protein-tyrosinekinaseactivityandpp60 ...cancerres.aacrjournals.org/content/48/16/4633.full.pdf ·...
TRANSCRIPT

[CANCER RESEARCH 48, 4633-4638, August 15, 1988]
Protein-Tyrosine Kinase Activity and pp60"~ircExpression in Whole Cells Measured
by Flow Cytometry1
Peter N. Preis,2 Frederic M. Waldman, A. Raymond Frackelton, Jr., Hideyuki Saya, and Victor A. Levin3
Brain Tumor Research Center [P. N. P., V. A. L., H. S.J, and Department of Laboratory Medicine [F. M. W.], School of Medicine, University of California,San Francisco, California 94143, and Department of Medicine, Roger Williams General Hospital and Brown University, Providence, Rhode Island 02908 [A. R. F.]
ABSTRACT
The expression and phosphotyrosine activity of pp60""* were meas
ured in the B31 avian sarcoma virus-transformed rat cell line by flowcytometry using monoclonal antibodies against ppftO' '" (EB7) and phos
photyrosine (1G2). Although the immunocytochemical staining wasmarkedly heterogeneous, binding of both antibodies was significantlygreater to B31 cells than to untransformed Rat 1 cells. Binding of 1G2to phosphotyrosine residues was specific; it was entirely inhibited byadding excess phenylphosphate but was not affected by phosphoserineor phosphothreonine. The relationship between the amount of phosphor-
ylated tyrosine measured by our FCM technique and total cellular phosphotyrosine measured by phosphoamino acid analysis was linear invanadate-treated BALB/c 3T3 cells. Treatment of B31 cells for 48 h with
herbimycin A, a benzenoid ansamycin antibiotic, to decrease the expression and tyrosine kinase activity of ppoO'""1'caused reductions of 42% in
:mti-pp60'""v and 58% in anti-phosphotyrosine antibody immunofluores-
cence. DNA staining with the fluorescent dye propidium iodide showedno cell cycle specificity in the binding of either antibody. Herbimycin Aalso caused the transformed cell line to revert to the morphology, actinconfiguration, and growth behavior of untransformed cells; these changeswere reversed within 12 h after removal of the drug. Flow cytometricevaluation of tyrosine kinase expression and activity was fast and easy,and the results correlated well with other measures of cell phenotype.This technique can be used to quantitate the effects of drugs on oncogenicproteins such as ppoO"'"*and their associated tyrosine kinase activity.
INTRODUCTION
Activation and expression of one or more oncogenes areconsidered crucial steps in the development and progression ofcancer (1-3). Oncogenes of the PTK4 family, such as v-src andc-src, are particularly interesting in that their aberrant PTKactivity is necessary for oncogenic transformation of cells byASV and other retroviruses (1, 4). This interest has beenheightened by reports that aberrantly active PTKs are associated with many human tumors (2, 3). As a result of the kinaseactivity, many cells that express these oncogenic proteins havegrossly elevated levels of proteins that contain phosphotyrosine(4-6).
Specific PTK inhibitors offer a rational approach for investigating the effects of oncogenic proteins on cellular transformation (7). In the past, the effects of PTK inhibitors have beenmonitored by immunoblot assays, protein-kinase assays of immune complexes, and estimation of cellular PTYR levels. Asan alternative, we have developed a method of quantitating the
Received 2/4/87; revised 2/1/88, 5/6/88; accepted 5/20/88.The costs of publication of this article were defrayed in part by the payment
of page charges. This article must therefore be hereby marked advertisement inaccordance with 18 U.S.C. Section 1734 solely to indicate this fact.
1Supported in part by NIH Grant CA 37655 from the National Cancer
Institute and by the Preuss Foundation, Inc.2Supported by a Max Kade Fellowship.3To whom requests for reprints should be addressed, c/0 The Editorial Office,
Department of Neurological Surgery, 1360 Ninth Avenue, Suite 210, San Francisco, CA 94122.
4The abbreviations used are: PTK, protein-tyrosine kinase; ASV, avian sarcoma virus; DMEM, Dulbecco's modified Eagle's medium; FCM, flow cytometry;FCS, fetal calf serum; Mab, monoclonal antibody; PBS, phosphate-buffered saline(137 mM NaCl-2.7 mM KC1-4.3 mM Na¡HPO4 7H2O-1.5 itiM KH2PO4); PTYR,phosphotyrosine.
expression of ppoO'"5" and PTK activity in cultured cells by
FCM analysis. In this report, we describe the technique and theresults of its application to evaluate the effects of herbimycinA on the expression and function of pp60v""*rin ASV-trans-
formed cells. This antibiotic reportedly induced morphologicalreversion and inactivated pp60"r in whole ASV-transformed
cells but did not inactivate the isolated enzyme preparation (8).
MATERIALS AND METHODS
Cell Lines. Rat 1and B31 cells were obtained from Dr. H. E. \ arums,University of California, San Francisco (9, 10). B31 cells are a clonalcell line of B77 ASV-transformed Rat 1 cells (F2408 line of Fischer ratembryo cells). Cells were grown in DMEM supplemented with 5%FCS, 5% calf serum, and antibiotics and were maintained at 37°Cin a
humidified 5% CO: atmosphere.Drug. For drug studies, herbimycin A was dissolved in a stock
solution of 100% dimethyl sulfoxide at a concentration of 125 Mg/mland diluted in culture medium. Herbimycin A was a gift from Mary K.Wolpert, Drug Evaluation Branch, National Cancer Institute. Sodiumo-vanadate was purchased from Sigma Chemical Co. (St. Louis, MO).
Antibodies. 1G2, a Mab against PTYR, has high admin and specificity for PTYR residues of proteins and does not cross-react withphosphate-containing molecules other than close PTYR analogues.Phosphoserine, phosphothreonine, and mono-, di-, and trinucleotidesdo not affect its binding to phosphotyrosyl proteins (11). In addition,we demonstrated that binding of 1G2 was totally inhibited by additionof 1 mM phenylphosphate to the antibody solution before staining andwas inhibited by 70% after addition of 10 mM 0-phosphotyrosine butwas not affected by addition of 10 mM phosphoserine or 10 mMphosphothreonine. EB7, a Mab against pp60*"*re(12, 13), was a gift
from J. T. Parsons, University of Virginia School of Medicine, Char-lottesville, VA.
Cloning Efficiency Assay. B31 cells were preincubated with or withoutherbimycin A, 0.1 to 0.5 Mg/ml, for 48 h. Fifteen, 30, 60, and 120 cellswere plated into 35-mm plastic Petri dishes containing 2.5 ml ofDMEM supplemented with 5% calf serum and 5% FCS and kept for14 days at 37°Cin a 5% COj atmosphere. The cells were fixed with
methanol and stained with 2% Giemsa stain. Colonies containing morethan 128 cells were counted, and cloning efficiency was determined asthe percentage of plated cells that formed colonies (14). Cellular morphology was evaluated by phase contrast microscopy.
Flow Cytometric Analysis. Cells were prepared for FCM analysis ofDNA, PTYR, and pp60" "* as follows. B31 cells were preincubated with
or without herbimycin A, 0.25 ¿ig/ml,for 48 h. The resulting monolayercultures were reduced to a single-cell suspension by treatment with0.05% trypsin, 0.02% EDTA, and 0.89% NaCl for 7 min at roomtemperature and fixed in 70% ethanol overnight at 4°C.Approximately2 x 10' cells were incubated with 0.5 ml of Mab-PTYR or Mab-pp60""r, 50 ¿ig/mlin PBS with 1% bovine serum albumin, for 45 min
at room temperature. The cells were washed twice in PBS and reactedwith 0.5 ml of fluorescein isothiocyanate-conjugated sheep anti-mouseIgG (Amersham International), diluted 1:40 in PBS, for 30 min atroom temperature. After two washes with PBS, the cells were resus-pended in 1.0 ml of RNase (10 Mg/ml) in PBS at 37'C for 10 min,
washed again, and resuspended in 1.0 ml of propidium iodide (10 ¿ig/ml) in PBS for 30 to 60 min.
Stained cells were analyzed with a Becton Dickensen FACS II flowcytometer using an argon laser at 488 nm and 250 mW. Red fluorescence from propidium iodide was collected through a 600-nm longpass
4633
Research. on September 3, 2018. © 1988 American Association for Cancercancerres.aacrjournals.org Downloaded from

PCM OF PTK ACTIVITY AND ppéCr"EXPRESSION
niter and recorded on linear scale as a measure of the total DNAcontent. Green fluorescence from fluorescein was collected through a530/30-nm bandpass filter and recorded after logarithmic amplificationas a measure of antibody binding. The data were accumulated in listmode in combination with forward angle light scatter and presented ascontour profiles with 20% of cells between contour lines. At least10,000 cells were collected for each sample. The mean intensity ofgreen fluorescence was measured by gating subpopulations within redfluorescence intensity limits (to define Gì,S, and d cell cycle compartments) before integration.
Immunocytochemistry and Actin Staining. These studies were doneon untreated B31 cells, B31 cells preincubated for 48 h with herbimycinA (0.25 Mg/ml), and Rat 1 cells. To localize cellular PTYR proteinsand pp60""*, cells were grown on glass coverslips, fixed in 70% ethanolat 4"C overnight, and reacted with Mab-PTYR or Mab-ppoO'"*", as
described above. Rhodamine phalloidin staining to demonstrate actinfilaments was performed as described by Wulf et al. (15). Briefly, cellswere grown on glass coverslips, rinsed twice in PBS, fixed for 10 minin 3.7% formaldehyde in PBS, and dehydrated in absolute acetone at—20°Cfor 4 min. The cells were air dried, immersed for 20 min in 10
//I of rhodamine phalloidin (1 Mg/ml; Molecular Probes, Inc.; Eugene,OR), washed three times in PBS, and mounted for viewing under anOlympus IMT 2 microscope with a xlOO fluorescence objective.
Phosphoamino Acid and Flow Cytometric Analyses of Vanadate-trcatcd Cells. To determine the significance of cellular fluorescenceseen by staining with Mab-PTYR, we correlated this with an independent and generally accepted measure of cellular PTYR. For this purpose,log-phase BALB/c 3T3 cells grown in RPMI 1640 medium supplemented with 10% PCS were dislodged by trypsinization and seededinto T75 tissue culture flasks and into six-well plates at a density of 3x IO5cells per 10 cm2. After 2 days of culture at 37°Cin 5% CO2, the
cells were rinsed with warm, phosphate-free DMEM. The T75 flaskswere incubated for 12 h in phosphate-free DMEM containing 4% PCS;the six-well plates were incubated in identical medium containing '-'I',.
I mCi/ml. Sodium 0-vanadate was added from concentrated stocksolutions to flasks and wells to achieve vanadate concentrations of 0,15, 32, 63, and 250 MM.The cells were incubated for 3 h at 37°Cand
harvested by brief trypsinization. Cells from the T75 flasks were collected by centrifugation, fixed in ice-cold 70% ethanol, stained by theindirect immunofluorescence method with Mab-PTYR, and analyzedby FCM as described above. Cells from the six-well plates were collectedby centrifugation and extracted with ice-cold Triton X-100-based Trisbuffer containing phosphatase, kinase, and protease inhibitors. Thedetergent extracts were clarified by centrifugation and processed forphosphoamino acid analysis both before and in parallel after purification of the phosphotyrosyl proteins (11, 16). Phosphoamino acids wereresolved from the partial acid hydrolysates by two-dimensional thin-layer electrophoresis and then quantitated by scintillation spectrometryand video densitometry of autoradiographs (11, 16).
RESULTS
Cloning Efficiency, Cell Survival, and Morphological Changesafter Herbimycin A Treatment. B31 cells exposed to herbimycinA did not survive at a drug concentration of 0.5 Mg/ml but grewnormally at 0.1 Mg/ml; at intermediate concentrations, slowingof growth was noted. After 14 days, the cloning efficiency at0.25 Mg/ml averaged 103 ±16% (SD) for Rat 1 cells and 88.5±4% for B31 cells. Morphological changes consisting of flattening and enlargement of cells began to occur at a herbimycinA concentration of 0.15 Mg/ml and were most marked at 0.25Mg/ml. Therefore, a dose of 0.25 Mg/ml was used for all furtherdrug studies.
Quantitation of PTYR and ppoO""*"by FCM. Indirect immu-nofluorescent staining with Mab-pp60v"5/r was 4 to 6 times
greater than background staining in three experiments; stainingwith Mab-PTYR was 2 to 3 times greater than background.Background staining was defined as the fluorescence intensityof cells when a control antibody was used.
The values for pp6Q"srcand PTYR obtained by FCM corre
lated with cell cycle progression as determined by dual labelingwith propidium iodide. Two-dimensional FCM analysis wasused to select G,-G0 phase cells for their normal 2N DNA
content and to calculate the mean intensity of green fluorescence (i.e., antibody binding) (Fig. 1). The antibody binding ofGa-M-phase cells was similarly calculated after selection fortheir 4N DNA content; S-phase cells had DNA content between2N and 4N. The ratio of the mean fluorescence intensities ofG2-M and Gi-Go cells was identical for both background andimmunofluorescent staining. Thus, antibody binding was independent of the cell cycle.
FCM showed that in B31 cells with herbimycin A, 0.25 Mg/ml, Mab-pp60'irc binding was reduced to 58% and Mab-PTYR
binding to 42% ofthat in untreated cells (Table 1). The ratioof antibody binding in G2-M and G]-G0 cells was unchangedafter drug treatment.
Distribution of F-Actin, PTYR, and pp60r 1(r in Treated and
Untreated Cells Evaluated by Fluorescence Microscopy. In theuntreated B31 cells, F-actin filaments appeared disorganized(Fig. 2Ä); in cultures of cells treated with 0.25 Mg/ml herbimycin A for 48 h, the actin filaments were more numerous andwere organized into parallel bundles (Fig. 2C). Rearrangementof actin filaments occurred in less than 10% of cells afterincubation with herbimycin A for 8 to 12 h and reached amaximum of 80% after 48 h. Within 12 h after removal of thedrug, disorganized F-actin filaments typical of the transformedphenotype were again seen. Although the F-actin cables werefewer and thinner in B3I cells treated with herbimycin A thanin the unlran stormed Rat 1 cell line (Fig. 2/4), intracellularactin fibers were well organized in both. Treated B31 cells alsoreverted from the more rounded phenotype of transformed cellsto the more flattened phenotype of the untransformed cells. Allchanges in cell morphology reversed within 12 h after removalof the drug.
In untreated B31 cells, compared with Rat 1 cells, fluorescence associated with proteins containing ppoO"""" (Fig. 2, D
and E) and PTYR (Fig. 2, G and H) was mainly found at cell-cell contacts, at the plasma membrane, and in the extranuclearregion of the cytoplasm. In B31 cells treated with herbimycinA, binding of both Mab-pp60'irc (Fig. IF) and Mab-PTYR
(Fig. 21) was greatly reduced at cell-cell contacts and wasconcentrated at cell adhesion plaques.
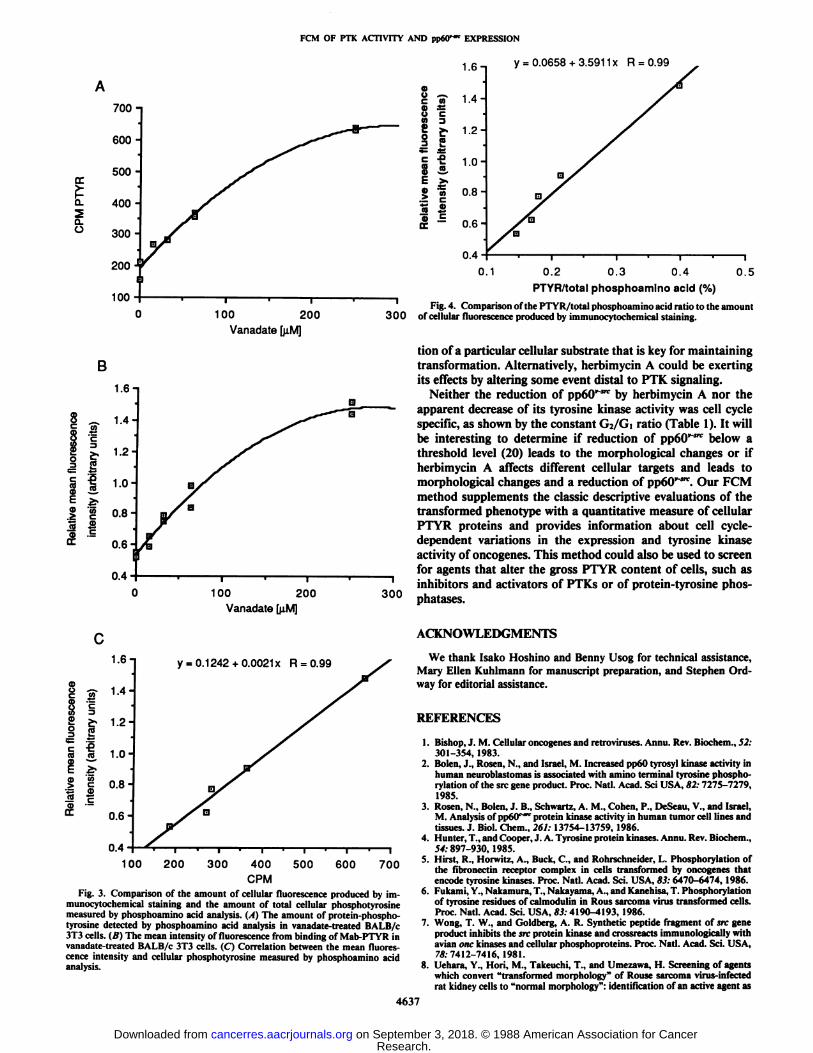
Comparison of Phosphoamino Acid and FCM Analyses ofVanadate-treated Cells. Phosphoamino acid analyses of cellextracts and of Mab-purified phosphotyrosyl protein gave well-resolved phosphoamino acid spots (data not shown) that werequantitated by scintillation spectrometry and by autoradiogra-phy and video densitometry. Vanadate caused marked increasesin the total cellular PTYR level in BALB/c 3T3 cells (Fig. 3/4)and in the amount of PTYR isolated from these cells by anti-PTYR immunoaffinity chromatography (data not shown).FCM also showed an increase in detected PTYR with increasingvanadate concentration (Fig. 3Ä).In both cases, the data werebest fit by a second-degree polynomial. The amount of cellularfluorescence after staining with Mab-PTYR correlated linearlywith the total cellular PTYR levels measured by phosphoaminoacid analysis (Fig. 3C). The phosphoamino acid analysis alsodemonstrated an increase in the amount of PTYR relative tothe total phosphoamino acid level with increasing vanadateconcentration. Lastly, Fig. 4 shows that the PTYR/total phosphoamino acid ratio was directly proportional to the intensityof cellular fluorescence.
4634
Research. on September 3, 2018. © 1988 American Association for Cancercancerres.aacrjournals.org Downloaded from

PCM OF PTK ACTIVITY AND ppoO"" EXPRESSION
ON«Content CPropidiue Iodide) DNAContent (Propid ON* Contint IProp idiu«Iodio«)
t. . M . . H . . Mi. . >•».,
DN»Contant IProp idi u«lodi O»I ON»Contenà IPropidiue Iodid*l DMAContent (Propidiue iod'd«]
Fig. 1. Dual parameter histograms of B31 cells. DNA content (jr-axis) allows division of cells into G0/G, S, and G2/M phases of the cell cycle, as shown in C.Indirect antibody labeling (log scale) is on the >'-axis. Controls for nonspecific staining with an irrelevant antibody (F) or no primary antibody (C); staining with Mab-PTYR (A, B), or Mab-ppoO"" (D. E); untreated cells (A, D) or cells pretreated with herbimycin A, 0.25 jig/ml (B, E).
Table 1 Relative mean fluorescence intensity (arbitrary units) of stained cellsgated for cell cycle compartment in two experiments"
B31 + HB31
Cell cyclecompartmentStainingwithMab-ppoO*"1"Experiment
1G,G2G2/G,Experiment
2G,G2G2/G,Staining
withMab-PTYRExperiment1G,G2G2/G,Experiment
2G,G2G2/G,B311.132.572.271.322.331.761.312.221.691.462.541.75B31
+H0.651.462.250.761.431.880.500.881.760.651.071.65(%)5857576138404542
" Background activity has been subtracted from the absolute mean values. H,
herbimycin A.
DISCUSSION
Two independent lines of research have implicated PTKs inthe regulation of the growth, differentiation, and transformation of cells: (a) cellular receptors for several polypeptide growthfactors are PTKs that are activated by the binding of theirrespective ligands (17, 18); (e), the transforming proteins ofmany retroviruses (e.g., src) are constitutively active PTKs thatphosphorylate themselves and/or various cellular proteins (1,3, 17, 19). The ability of these viruses to transform cells isdependent on the continued expression of viral PTKs.
When active pp60 is expressed in v-src-transfected cells overa certain threshold level (20) and is localized at the inner surface
of the plasma membrane, it induces cellular transformation. If,as hypothesized, phosphorylation of certain cellular regulatoryproteins is the crucial point in this process, the amount andsubcellular distribution of PTYR and pp6Q"'SKin treated and
untreated cells could provide important information aboutchanges in the expression and function of tyrosine kinases.
Herbimycin A reportedly reduces intracellular phosphorylation of pp60'src in fibroblasts transformed by a temperature-
sensitive mutant of Rous sarcoma virus and causes morphological reversion to the untransformed phenotype (13, 21-23).Current evidence suggests that herbimycin A inactivates pp60i'r
directly or acts through intermediate pathways that affect theexpression or function of ppoO'"1".
Our quantitative FCM analysis of changes in the relativeamounts of pp60"'src and PTYR residues demonstrates the po
tential of this technique for studying oncogene proteins andproducts in drug-treated cells. The amount of PTYR in B31cells is less than 0.3% of total phosphoamino acid content andis up to 10-fold less in untransfected cells (20). Although allPTYR residues may not be accessible to antibody binding, FCMmeasurements of PTYR appeared to correlate with the anticipated levels of PTK in B31 and Rat 1 cells. Consistent withthis, the anti-PTYR antibody isolates more than 90% of thePTYR in EGF-stimulated human epidermoid carcinoma cells.5
To further validate the relationship between PTYR and fluorescence, we compared the total cellular phosphoamino acidmeasurements obtained by traditional methods in vanadate-treated BALB/c 3T3 cells to FCM measurements using Mab-PTYR. In these studies, we used BALB/c 3T3 cells rather thanin B31 cells treated with herbimycin A for two main reasons,(a) To validate the FCM quantitation of PTYR it was importantto have cells that expressed wide ranges of cellular PTYR.
' A. R. Frackelton. Jr., unpublished observations.
4635
Research. on September 3, 2018. © 1988 American Association for Cancercancerres.aacrjournals.org Downloaded from

PCM OF PTK ACTIVITY AND ppéO'" EXPRESSION
Fig. 2. Rat I cells (A, D, G), B31 cells (B, E, //), and B31 cells pretreated with herbimycin A (0.25 tig/mi) (C, F, I), stained with Mab-PTYR (G, H, I), Mab-ppoO"" (D, E, F) or rhodamine phalloidin (A, B, C). x 1000. To achieve adequate fluorescence in Rat 1 cells required exposure times more than twice as long as that
required for B31 cells and therefore the intensity of fluorescence in the Rat 1 cells is exaggerated.
Drug-treated B31 cells demonstrate only a 2-fold change incellular PTYR, whereas quiescent BALB/c 3T3 cells have littlecellular PTYR but can be induced to high PTYR levels by briefincubation in vanadate (24). (b) Herbimycin A reduces proliferation of B31 cells and makes it difficult to normalize PTYRlevels to equal cell numbers and total phosphorylation. Therelationship between PTYR radioactivity and Mab-PTYR fluorescence was linear over the ranges studied (Fig. 3C).
Treatment of B31 cells with herbimycin A caused a reversionfrom the transformed phenotype; treated cells grew moreslowly, were flatter, and had well-organized actin filaments.This is surprising because the treated cells still expressed large
amounts of pp60v"ircprotein (58% of untreated cells) and be
cause the treated cells still contained grossly elevated levels ofphosphotyrosyl proteins (42% of untreated cells). Uehara et al.(8) showed that most of the ppoO1"""7proteins in cells should be
inactive as a kinase, at least in vitro. Thus, the remaining cellularPTYR could be due to residual protein-tyrosine phosphataseactivity. Studies from Varmus's laboratory have shown thatppoO'"5" activity sufficient to cause only 10% of the tyrosine
phosphorylation found in v-src-transformed rat fibroblasts(same parent line as B31 cells) still results in cellular transformation (20). Therefore, the reversion of phenotype in B31 cellstreated with herbimycin A may be due to altered phosphoryla-
4636
Research. on September 3, 2018. © 1988 American Association for Cancercancerres.aacrjournals.org Downloaded from
PCM OF PTK ACTIVITY AND pp6(Tm EXPRESSION
y = 0.0658 + 3.5911 x R = 0.99
OC
CLü
0.2 0.3 0.4PTYR/total phosphoamlno acid {%)
0.5
100Vanadate
200 300
B
0.4
200
1.6-
1.4-
I I 1-2^C ?(8 <B 1.0 •
0.8 H
<D —
Å’ 0.6 H
0.4
100Vanadate
y = 0.1242 +0.0021 x R = 0.99
300
100 200 300 400CPM
500 600 700
Fig. 3. Comparison of the amount of cellular fluorescence produced by im-munocytochemical staining and the amount of total cellular phosphotyrosinemeasured by phosphoamino acid analysis. (A) The amount of protein-phospho-tyrosine detected by phosphoamino acid analysis in vanadate-treated BALB/c3T3 cells. (B) The mean intensity of fluorescence from binding of Mab-PTYR invanadate-treated BALB/c 3T3 cells. (C) Correlation between the mean fluorescence intensity and cellular phosphotyrosine measured by phosphoamino acidanalysis.
Fig. 4. Comparison of the PTYR/total phosphoamino acid ratio to the amountof cellular fluorescence produced by immunocytochemical staining.
tion of a particular cellular substrate that is key for maintainingtransformation. Alternatively, herbimycin A could be exertingits effects by altering some event distal to PTK signaling.
Neither the reduction of pp60v'src by herbimycin A nor the
apparent decrease of its tyrosine kinase activity was cell cyclespecific, as shown by the constant Ga/d ratio (Table 1). It willbe interesting to determine if reduction of pp60"~srebelow a
threshold level (20) leads to the morphological changes or ifherbimycin A affects different cellular targets and leads tomorphological changes and a reduction of pp60"'srf. Our FCM
method supplements the classic descriptive evaluations of thetransformed phenotype with a quantitative measure of cellularPTYR proteins and provides information about cell cycle-dependent variations in the expression and tyrosine kinaseactivity of oncogenes. This method could also be used to screenfor agents that alter the gross PTYR content of cells, such asinhibitors and activators of PTKs or of protein-tyrosine phos-phatases.
ACKNOWLEDGMENTS
We thank Isako Hoshino and Benny Usog for technical assistance,Mary Ellen Kuhlmann for manuscript preparation, and Stephen Ord-way for editorial assistance.
REFERENCES
1. Bishop, J. M. Cellular oncogenes and retroviruses. Annu. Rev. Biochem., 52:301-354, 1983.
2. Bolen, J., Rosen, N., and Israel, M. Increased pp60 tyrosyl kinase activity inhuman neuroblastomas is associated with amino terminal tyrosine phospho-rylation of the src gene product. Proc. Nati. Acad. Sci USA, 82:7275-7279,1985.
3. Rosen, N., Bolen, J. B., Schwartz, A. M., Cohen, P., DeSeau. V., and Israel,M. Analysis ot pphO' '" protein kinase activity in human tumor cell lines andtissues. J. Biol. Chem., 261: 13754-13759, 1986.
4. Hunter, T., and Cooper, J. A. Tyrosine protein kinases. Annu. Rev. Biochem.,54: 897-930, 1985.
5. Hirst, R., Horwitz, A., Buck, C., and Rohrschneider, L. Phosphorylation ofthe fibronectin receptor complex in cells transformed by oncogenes thatencode tyrosine kinases. Proc. Nati. Acad. Sci. USA, 83: 6470-6474, 1986.
6. Fukami, Y., Nakamura, T., Nakayama, A., and Kanehisa, T. Phosphorylationof tyrosine residues of calmodulin in Rous sarcoma virus transformed cells.Proc. Nati. Acad. Sci. USA, 83:4190-4193, 1986.
7. Wong, T. W., and Goldberg, A. R. Synthetic peptide fragment of src geneproduct inhibits the src protein kinase and crossreacts immunologically withavian one kinases and cellular phosphoproteins. Proc. Nati. Acad. Sci. USA,78: 7412-7416, 1981.
8. Uehara, Y., Hori, M., Takeuchi, T., and Umezawa, H. Screening of agentswhich convert "transformed morphology" of Rouse sarcoma virus-infectedrat kidney cells to "normal morphology": identification of an active agent as
4637
Research. on September 3, 2018. © 1988 American Association for Cancercancerres.aacrjournals.org Downloaded from
PCM OF PTK ACTIVITY AND pp60'" EXPRESSION
IKi hum i-m and ils inhibition of intracellular src kinase. Jpn. J. Cancer Res.,76:672-675, 1985.
9. Oppermann, H., Lervinson, A. D., and Varmus, H. E. The structure andprotein kinase activity of proteins encoded by nonconditional mutants andback mutants in the src gene of avian sarcoma virus. Virology, 108: 47-70,1981.
10. Varmus, H. E., Quintrell, N., and Wyke. J. Revenants of an ASV transformedrat cell line have lost the complete provirus or sustained mutations in src.Virology, 108: 28-46, 1981.
11. Huhn, R. D., Posner, M. R., Rayter, S. I„Foulkes, J. G., and Frackelton, A.R„Jr. Cell lines and peripheral blood leukocytes derived from individualswith chronic myelogenous leukemia display virtually identical proteins phos-phorylated on tyrosine residues. Proc. Nati. Acad. Sci. USA, 84:4408-4412,1987.
12. Parsons. S. J.. McCarley, D. J., Raymond. V. W., and Parsons, J. T.Localization of conserved and nonconserved epitopes within the Rous sarcoma virus encoded src protein. J. Virol., 59: 755-758, 1986.
13. Parsons, S. J., McCarley, D. J., Ely, C. M., Benjamin. D. C., and Parsons,J. T. Monoclonal antibodies to Rous sarcoma virus ppoOsrc react withenzymatically active cellular pp60src of avian and mammalian origin. J.Virol., 51: 272-282, 1984.
14. Roscnblum. M. L., Vasquez. D. A., Hoshino, T., and Wilson, C. B. Development of a clonogenic cell assay for human brain tumors. Cancer (Phila.),41: 2305-2314, 1978.
15. Wulf, E.. Deboben, A.. Bautz, F. A., Faulstich. H., and Wieland. T. H.Fluorescent phallotoxin, a tool for the visualization of cellular actin. Proc.Nati. Acad. Sci. USA, 76:4498-4502, 1979.
16. Frackelton. A. R. Jr.. Ross, A. H., and Eisen, H. N. Characterization anduse of monoclonal antibodies for isolation of phosphotyrosyl proteins from
retrovirus-transformed cells and growth factor-stimulated cells. Mol. Cell.Biol.. 3: 1343-1352, 1983.
17. Kristensen, T., Saris, C. J. M., Hunter, T., Hicks, L. J., Noonan, D. J.,Glenney, J. R., Jr., and Tack, B. F. Primary structure of bovine calpactin 1heavy chain (p36), a major cellular substrate for retroviral tyrosine proteinkinases: homology with human phospholipase A2 inhibitor lipoprotein.Biochemistry, 25:4497-4503, 1986.
18. Garber, A. E., Krueger, J. G., Hanafusa, H., and Goldberg, A. R. Temperaturesensitive membrane association of ppoOsrc in tsNY68 infected cells correlateswith increased tyrosin phosphorylation of membrane associated proteins.Virology. 126: 73-86, 1983.
19. Le Beau, M. M., Westbrook, C. A., Diaz, M. O., and Rowly, J. D. C src isconsistently conserved in the chromosomal deletion (20q) observed in mye-loid disorders. Proc. Nati. Acad. Sci. USA, 82: 6692-6696, 1985.
20. Jakobovits, E. B., Majors, J. E., and Varmus, H. E. Hormonal regulation ofthe Rous sarcoma virus src gene via a heterologous promotor defines athreshhold dose for cellular transformation. Cell, 38: 757-765, 1984.
21. Muroi, M., Izawa, M., Kosai, Y., and Asai, M. Macbecins I and II, newantitumor antibiotics. II. Isolation and characterization. J. Antibiot. (Tokyo),33:205-212, 1980.
22. Shibata, K.. Satsumabayashi, S., Sano, H., Komiyama, K.. Nakagawa, A.,and Omura. S. Chemical modification of herbimycin A. Synthesis and invivo antitumor activities of halogenated and other related derivatives ofherbimycin A. J. Antibiot., 39:415-424, 1986.
23. Tañida, S., Hasegawa, T.. and Higashide, E. Macbecins I and II, newantitumor antibiotics. I. Producing organism, fermentation and antimicrobialactivities. J. Antibiot. (Tokyo), 33: 199-204, 1980.
24. Klarlund, J. K. Transformation of cells by an inhibitor of phosphatases actingon phosphotyrosine in proteins. Cell, 41: 707-717, 1985.
4638
Research. on September 3, 2018. © 1988 American Association for Cancercancerres.aacrjournals.org Downloaded from

1988;48:4633-4638. Cancer Res Peter N. Preis, Frederic M. Waldman, A. Raymond Frackelton, Jr., et al. Whole Cells Measured by Flow Cytometry
Expression inv-srcProtein-Tyrosine Kinase Activity and pp60
Updated version
http://cancerres.aacrjournals.org/content/48/16/4633
Access the most recent version of this article at:
E-mail alerts related to this article or journal.Sign up to receive free email-alerts
Subscriptions
Reprints and
To order reprints of this article or to subscribe to the journal, contact the AACR Publications
Permissions
Rightslink site. Click on "Request Permissions" which will take you to the Copyright Clearance Center's (CCC)
.http://cancerres.aacrjournals.org/content/48/16/4633To request permission to re-use all or part of this article, use this link
Research. on September 3, 2018. © 1988 American Association for Cancercancerres.aacrjournals.org Downloaded from