protein targeting with small molecules || target profiling of small molecules
TRANSCRIPT

2TARGET PROFILING OF SMALLMOLECULES
Leonid L. Chepelev and Michel DumontierDepartment of Biology, Carleton University, Ottawa, Ontario, Canada
2.1 INTRODUCTION
2.1.1 Basics of Small Molecules
Like millions of hard-working citizens in a busy metropolis, the multitudes ofour cellular constituents, including small molecules, interact constantly with theirenvironment and each other, participating in countless energy and matter trans-actions, in the process proliferating what we call life. While the attention ofmuch of current biological research may be focused exclusively on biomacro-molecules, small molecules (SMs) are also vital to metabolism, biosynthesis,and signaling in regulatory and neuronal networks. Historically, SMs have beencalled on most widely by the pharmaceutical industry to help combat disease.Although they can be devised to inhibit or promote enzymatic reactions throughblockage of the active site, or through allosteric or covalent modifications of thetarget enzyme or receptor, these mechanisms can be used to inhibit or promoteprotein–protein or protein–nucleic acid interactions. In addition to this, a portionof pharmaceutically active SMs exert their effect only after subsequent chemical
Protein Targeting with Small Molecules: Chemical Biology Techniques and Applications,Edited by Hiroyuki OsadaCopyright © 2009 John Wiley & Sons, Inc.
11

12 TARGET PROFILING OF SMALL MOLECULES
Proteomic profiling
Covalent protein Modification
Metabolomics
Competitive inhibition
Allosteric proteinmodification
PPI Disruptionor augmentation
SM–SM Interactions
Reversible SM complex Formation (e.g. Chelation)
Enzymatic metabolism
Non-enzymatic modification
OH
SM
???
Complementation or translocation assays
×
+
Fe
Figure 2-1 Some of the major interaction classes that SM may participate in withina living cell. Major directions in screening for these interaction classes are in italic.Unfortunately, SM–SM interaction detection, be it a direct reaction or the combination ofeffects of two SMs, resulting in unprecedented behavior, often requires an individualisticapproach to assay adequately.
modifications (enzymatic or not) to the form that elicits the effects desired [1].Because of this vast range of possible interactions (Fig. 2-1), determination ofthe particular target and the subsequent elucidation of the precise mechanismof action of a specific active small molecule persists as a major problem indrug development. In fact, a number of small-molecule treatments, such as bysalicylic acid, were first used without an adequate grasp of the mechanisticbackground. Indeed, the ability to assess the mechanism of action of a givenSM adequately would allow the possibility of improving the compound’s speci-ficity and selectivity, eliminating its side effects and improving its efficacy, whileuncovering disease mechanisms and alternative targets for treatment. Thankfully,recent advances in quantitative high-throughput genomic, metabolomic, and pro-teomic analysis methodologies have finally allowed us to begin constructing anentire spectrum of interaction maps for the various cellular constituents as wellas to begin to assess the state of a living cell dynamically and quantitativelywhile bringing us ever closer to an understanding of disease and drug activitymechanisms.
When considering a topic such as target profiling of SMs, we should definethe terms used. So for the purposes of this work, a target of a given SM is thecellular constituent upon a reversible or irreversible interaction with which the SMelicits a change in normal cellular behavior or initiates a signaling cascade that
INTRODUCTION 13
elicits such an effect. Most often, the target is a protein, an enzyme to be inhibitedselectively (e.g., a parasite’s unique enzymes) or a receptor to be incapacitated oractivated (e.g., estrogen receptors), although, potentially, some structural proteinscan also be targeted. Thus, we will consider primarily SM–protein interactiondetection and quantification, although most of the technologies discussed couldbe applied to screening of binding to other cellular constituents.
The field of quantitative high-throughput screening (HTS) of SM interactions isvast, incorporating diverse assay technologies, both quantitative and qualitative,mechanism- and phenotype-based, approaches that involve a carefully craftedknowledge-based assay and candidate design as well as those that involve thescreening of an entire combinatorial chemistry-generated SM library of millionsof compounds against thousands of potential targets on a proteomic scale withouta priori knowledge, assays that are carried out in silico, in vitro, and in vivo.Indeed, a systematic review of each methodology is a titanic work that couldeasily span multiple volumes. We have, however, summarize some of the mostcommonly encountered SM HTS technologies, some of which we cover in moredetail in Table 2-1. Here we opt to discuss briefly only a few of the representativetechnologies of the past that helped guide the field of proteome-scale interactionprofiling: ones that we believe to be most promising and deserving of receiv-ing widespread acceptance in the future. We specifically emphasize technologiesthat identify protein targets of a particular SM rather than the chemical libraryscreening used to identify all SMs that bind to a given protein.
2.1.2 Theoretical Background
Irrespective of the technology used to assay SM interactions and/or metabolictransformations, putting quantum tunneling aside, all biochemical reactions canbe characterized by two thermodynamic properties. The first is the standardGibbs free-energy change for a given reaction (�G0), given by equation (1),which describes the equilibrium position of a reaction, or its feasibility from thethermodynamic standpoint, at standard conditions.
�G0 = �H 0 − T �S0 = −RT ln Keq where Keq = kf
kr
=∏m
i=1 [producti]ni
∏lj=1 [Reactantj ]nj
(1)
Here �H 0 is the standard enthalpy change of reaction; �S0 the standard reactionentropy change; R the gas constant; T the temperature; Keq the equilibriumconstant for the reaction, given simply by the product of concentrations (activitiesin reality) of all the products to the power of their stoichiometric coefficients overthe same product for reactants; m the number of products; kf the forward rateconstant; kr the reverse rate constant; ni the stoichiometric coefficient of speciesi; and l the number of reactants. A �G0 value below zero indicates a reactionwith an equilibrium point where there is an excess of products over reactants, a
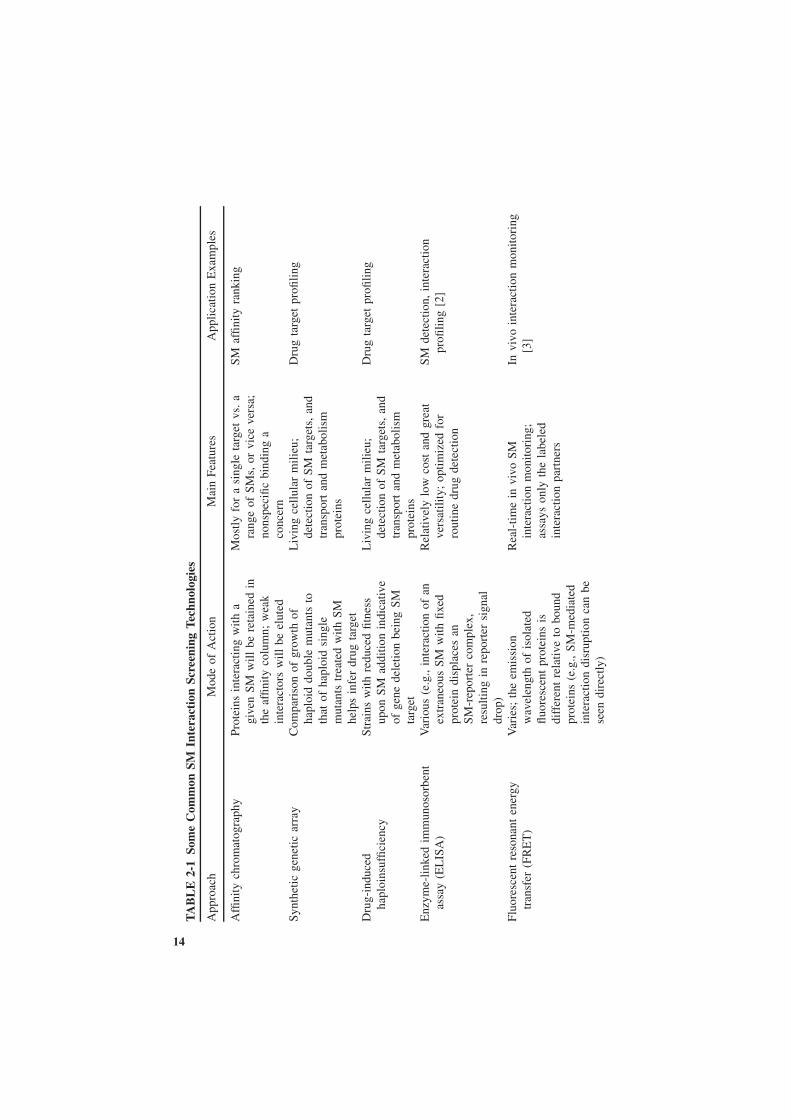
TA
BL
E2-
1So
me
Com
mon
SMIn
tera
ctio
nSc
reen
ing
Tech
nolo
gies
App
roac
hM
ode
ofA
ctio
nM
ain
Feat
ures
App
licat
ion
Exa
mpl
es
Affi
nity
chro
mat
ogra
phy
Prot
eins
inte
ract
ing
with
agi
ven
SMw
illbe
reta
ined
inth
eaf
finity
colu
mn;
wea
kin
tera
ctor
sw
illbe
elut
ed
Mos
tly
for
asi
ngle
targ
etvs
.a
rang
eof
SMs,
orvi
ceve
rsa;
nons
peci
ficbi
ndin
ga
conc
ern
SMaf
finity
rank
ing
Synt
hetic
gene
ticar
ray
Com
pari
son
ofgr
owth
ofha
ploi
ddo
uble
mut
ants
toth
atof
hapl
oid
sing
lem
utan
tstr
eate
dw
ithSM
help
sin
fer
drug
targ
et
Liv
ing
cell
ular
mil
ieu;
dete
ctio
nof
SMta
rget
s,an
dtr
ansp
ort
and
met
abol
ism
prot
eins
Dru
gta
rget
profi
ling
Dru
g-in
duce
dha
ploi
nsuf
ficie
ncy
Stra
ins
with
redu
ced
fitne
ssup
onSM
addi
tion
indi
cativ
eof
gene
dele
tion
bein
gSM
targ
et
Liv
ing
cell
ular
mil
ieu;
dete
ctio
nof
SMta
rget
s,an
dtr
ansp
ort
and
met
abol
ism
prot
eins
Dru
gta
rget
profi
ling
Enz
yme-
linke
dim
mun
osor
bent
assa
y(E
LIS
A)
Var
ious
(e.g
.,in
tera
ctio
nof
anex
tran
eous
SMw
ithfix
edpr
otei
ndi
spla
ces
anSM
-rep
orte
rco
mpl
ex,
resu
lting
inre
port
ersi
gnal
drop
)
Rel
ativ
ely
low
cost
and
grea
tve
rsat
ility
;op
timiz
edfo
rro
utin
edr
ugde
tect
ion
SMde
tect
ion,
inte
ract
ion
profi
ling
[2]
Fluo
resc
ent
reso
nant
ener
gytr
ansf
er(F
RE
T)
Var
ies;
the
emis
sion
wav
elen
gth
ofis
olat
edflu
ores
cent
prot
eins
isdi
ffer
ent
rela
tive
tobo
und
prot
eins
(e.g
.,SM
-med
iate
din
tera
ctio
ndi
srup
tion
can
bese
endi
rect
ly)
Rea
l-ti
me
invi
voSM
inte
ract
ion
mon
itori
ng;
assa
yson
lyth
ela
bele
din
tera
ctio
npa
rtne
rs
Invi
voin
tera
ctio
nm
onito
ring
[3]
14
Isot
herm
alca
lori
met
ry(I
TC
)D
ynam
ics
ofte
mpe
ratu
rech
ange
upon
SMad
ditio
nto
prot
ein
used
tode
rive
bind
ing
ther
mod
ynam
ics
and
kine
tics
Hig
hly
deta
iled
ther
mod
ynam
icda
ta,
ata
cost
oflo
wer
thro
ughp
ut
Elu
cida
tion
ofin
tera
ctio
nth
erm
odyn
amic
s[4
]
Surf
ace
plas
mon
reso
nanc
eim
agin
g(S
PRi)
Loc
alva
riat
ions
inin
dex
ofre
frac
tion
upon
abi
ndin
gev
ent
trig
ger
ach
ange
inre
sona
nce
ofsu
rfac
epl
asm
ons,
trac
ked
dyna
mic
ally
Opt
imiz
edfo
rar
ray
form
at,
prov
idin
ghi
ghqu
anti
ties
ofgo
od-q
uali
tyqu
anti
tati
veda
ta
Prot
eom
ic-s
cale
SMin
tera
ctio
npr
ofilin
g[5
];in
tera
ctio
nki
netic
sel
ucid
atio
n
Scin
tilla
tion
prox
imity
assa
y(S
PA)
Aflu
omic
rosp
here
coat
edw
ithpr
otei
nw
ill
emit
ligh
ton
lyw
hen
the
radi
olab
eled
ligan
dbi
nds
toth
epr
otei
nw
hen
com
ing
into
prox
imity
Low
cost
,es
peci
ally
usef
ulfo
rki
nase
stud
ies,
but
invo
lves
radi
oact
ive
isot
opes
Kin
ase
subs
trat
epr
ofilin
g;SM
inte
ract
ion
profi
ling
[6]
Yea
sttw
o-hy
brid
tech
nolo
gyV
arie
s(e
.g.,
inte
ract
ion
ofm
odifi
edSM
toits
targ
etac
tivat
esre
port
ertr
ansc
ript
ion)
Ver
ylo
wco
st,
extr
eme
vers
atil
ity,
invi
voas
say
envi
ronm
ent,
sim
ple
dete
ctio
n
Prot
eom
icin
tera
ctio
nm
appi
ng[7
]
15
16 TARGET PROFILING OF SMALL MOLECULES
value of zero indicates equality of reactant and product amounts, and a valueabove zero is indicative of an anticipated lack of reaction progress. In the majorityof studies of quantitative interaction characterization, the Kd parameter is usedto describe interaction strength. Kd is simply the equilibrium constant for thereaction of dissociation of a binding partner complex, and for the reaction AB �A + B,Kd can be found as
Kd = [A][B]
[AB](2)
The second factor is the standard activation free energy of the reaction(�G0∗), which describes reaction kinetics, how fast a reaction will proceed:
�G0∗ = −RT lnkf h
kBT(3)
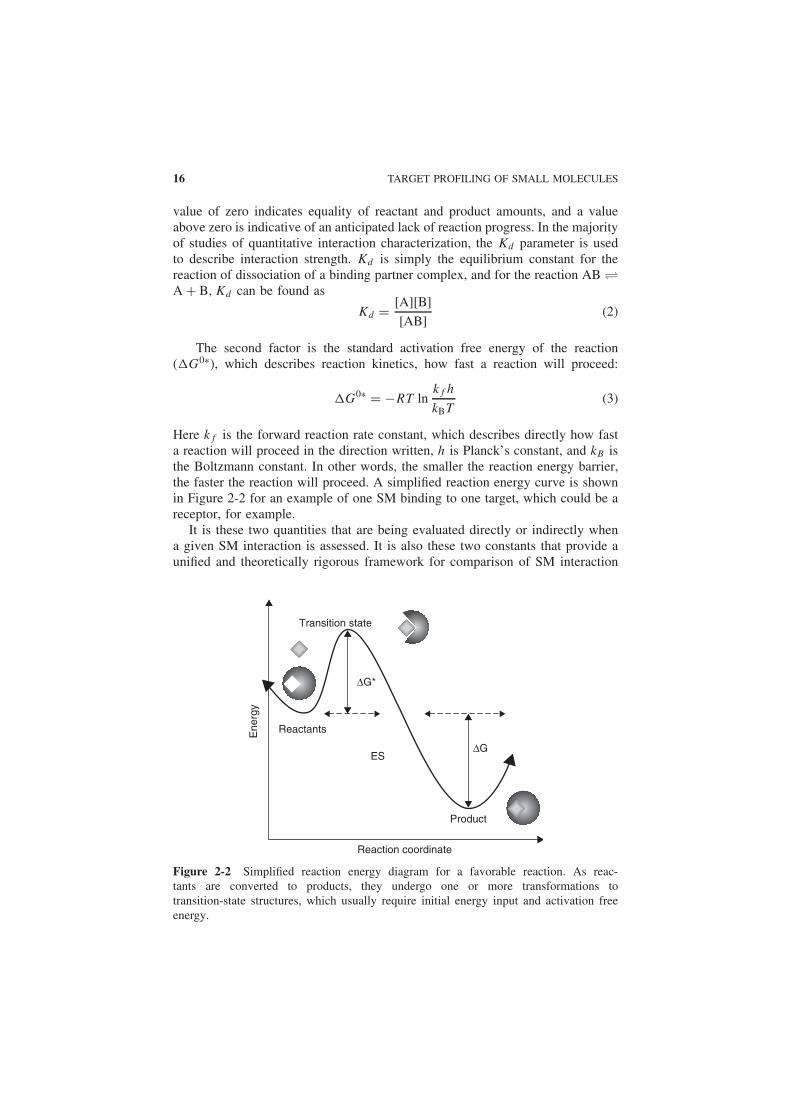
Here kf is the forward reaction rate constant, which describes directly how fasta reaction will proceed in the direction written, h is Planck’s constant, and kB isthe Boltzmann constant. In other words, the smaller the reaction energy barrier,the faster the reaction will proceed. A simplified reaction energy curve is shownin Figure 2-2 for an example of one SM binding to one target, which could be areceptor, for example.
It is these two quantities that are being evaluated directly or indirectly whena given SM interaction is assessed. It is also these two constants that provide aunified and theoretically rigorous framework for comparison of SM interaction
Ene
rgy
Reactants
Transition state
ΔG*
ΔGES
Product
Reaction coordinate
Figure 2-2 Simplified reaction energy diagram for a favorable reaction. As reac-tants are converted to products, they undergo one or more transformations totransition-state structures, which usually require initial energy input and activation freeenergy.
INTRODUCTION 17
strength with different binding partners and across multiple studies. Unfortu-nately, �G0 and �G0∗ vary with the temperature and the nature of the solvent,making comparisons of studies performed under highly dissimilar conditionssomewhat dubious. Although most studies can be carried out under standardconditions, one can easily envision cases where the addition of salt or varia-tion of pH, temperature, or other conditions is unavoidable (e.g., due to proteindenaturation).
The first equation provides us with three different ways to assess the �G0
value: the determination of the ratio of products and reactants at equilibrium, thedetermination of enthalpy and entropy change, possibly with techniques such asisothermal calorimetry, or direct quantification of kinetics of a given reaction inthe forward and reverse directions. The latter is the only option to determine thevalue of �G0∗. Consider yeast two-hybrid technology as an illustration of anapproach that is normally used for qualitative interaction characterization but canactually provide quantitative results when set up appropriately through determi-nation of equilibrium reactant and product levels (see below). On the other hand,the various quantitative interaction characterization technologies, such as sur-face plasmon resonance imaging (SPRi), aim to obtain the values of SM–proteinbinding and dissociation rate constants directly simply by monitoring complexformation and dissociation over time and extracting the kinetic constants directlyfrom the resulting time–response curves.
Yet another approach to the determination of �G0 is apparent when consider-ing another definition of the standard Gibbs free-energy change as the differencebetween the energies of formation of products and reactants:
�G0reaction =
m∑
i=1
ni(�G0formation)i−
l∑
j=1
nj (�G0formation)j (4)
Here i and j are indices of products and reactants, respectively, and n is the sto-ichiometric coefficient of a given species. In other words, the overall �G0 valuecan be determined by subtracting standard Gibbs free energies of formation ofproducts from those of reactants. This formulates the basis for the calculation of�G0 for SM interactions in silico. A number of algorithms and software pack-ages have been developed for the accurate calculation of reaction �G0 values,which we consider later in more detail. Additionally, in cases where rigorous abinitio calculations may be prohibitively time consuming, algorithms that employprotein sequence and known SM interaction partner information to approximateSM–target interaction strength have been developed and are considered here.
Whatever the interaction detection technology, it is always important toremember whether a tangible kinetic or thermodynamic constant is provided byan assay or whether we are forced to use a quantitative relative ranking schemeor an outright qualitative interaction assessment. While qualitative interactiondetection through yeast two-hybrid approaches is valuable for rapid, low-cost“first approach” screening, it is highly difficult to compare different interactionstrengths or to determine the precise role of a given compound in a dynamic
18 TARGET PROFILING OF SMALL MOLECULES
kinetic model of the pathway of interest without tangible kinetic data. Withoutsuch understanding, we are destined to probe the chemical space blindly in hopeof finding the occasional precious active SM while suffering from unanticipatedside effects.
2.2 EXPERIMENTAL APPROACHES TO SM INTERACTIONPROFILING
2.2.1 Yeast Two-Hybrid System
It is important first to discuss briefly qualitative and semiquantitative interac-tion screening methodologies, as they have helped pave the way for subsequentquantitative proteome-scale approaches. It was, after all, qualitative techniquesthat resulted in the first proteome-scale interaction maps [7] and were some ofthe first to be applied to aid in an understanding of major regulatory and diseasepathways as well as drug activity mechanisms [8]. Yeast has been shown to be anexcellent model organism for the purpose of SM interaction profiling [9]. Despitethe fact that the baker’s yeast Saccharomyces cerevisiae is a single-celled fun-gus with little outward resemblance to humans, it combines the versatility andtractability of a prokaryote with the main features of eukaryotes, such as thepresence of organelles and eukaryotic post-translational modifications; one-thirdof human genes involved in disease have yeast orthologs [10]. In addition tothis, yeast is one of the best-studied organisms available. Strain collections havebeen created in which every gene was systematically deleted or fused with, orreplaced by, a reporter gene such as GFP [11]. It is perhaps the ease of geneticmanipulation of yeast that led to the creation of the versatile yeast two-hybridtechnique, which since its introduction in 1989 [12] has also been modified andrefined extensively to produce proteome-scale qualitative and semiquantitativeinformation on protein–small molecule interactions [13,14].
The basic two-hybrid approach is quite simple: For two proteins X and Ywhose interaction status is to be determined, fusion proteins X-DBD and Y-ADare created, where AD is an activating domain and DBD is a DNA-bindingdomain specific to an upstream activating sequence of a reporter gene. Success-ful interaction of X and Y brings DBD in close proximity to AD, resulting inrecruitment of RNA polymerase to initiate the transcription of a reporter gene.The reporter gene could be a fluorescent protein (FP) or a chromogenic enzyme,for example, such that observation of its expression does not involve costlydetection equipment.
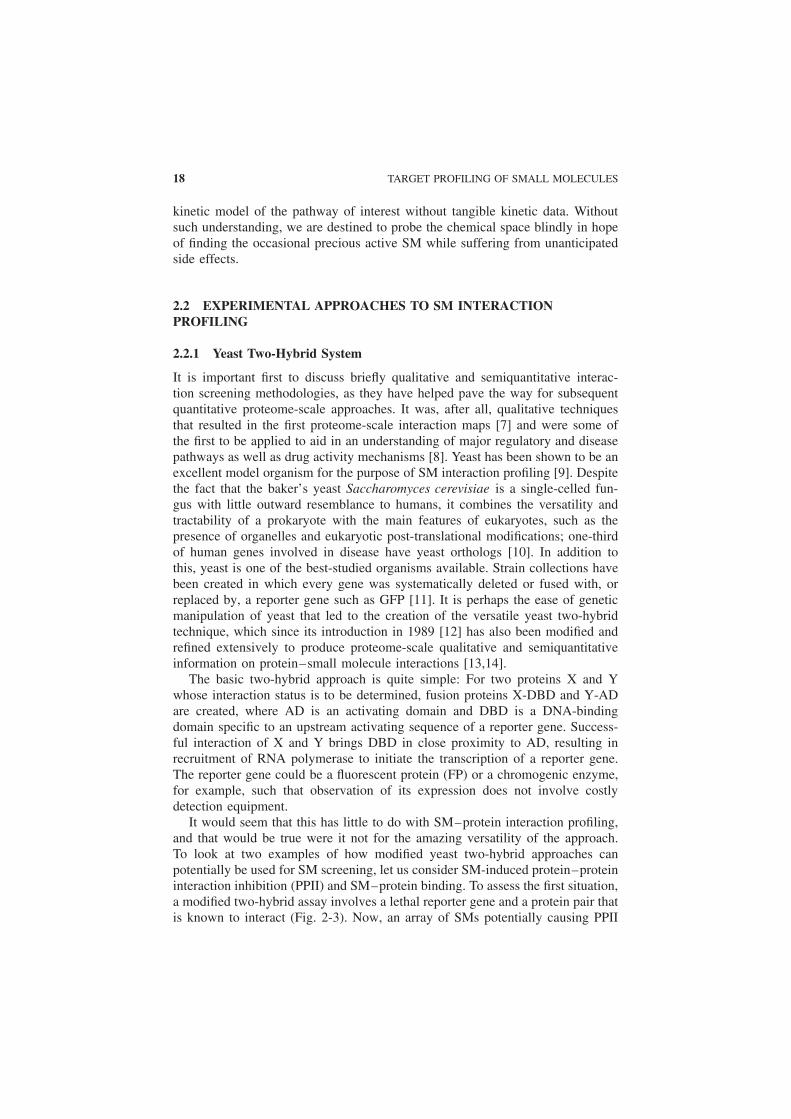
It would seem that this has little to do with SM–protein interaction profiling,and that would be true were it not for the amazing versatility of the approach.To look at two examples of how modified yeast two-hybrid approaches canpotentially be used for SM screening, let us consider SM-induced protein–proteininteraction inhibition (PPII) and SM–protein binding. To assess the first situation,a modified two-hybrid assay involves a lethal reporter gene and a protein pair thatis known to interact (Fig. 2-3). Now, an array of SMs potentially causing PPII
EXPERIMENTAL APPROACHES TO SM INTERACTION PROFILING 19
X
DBDAD
Y
UAS URA3
5-Fluoroorotic Acid
5-Fluorouracil
Cell Death
X
DBD
UAS URA3
5-Fluoroorotic Acid
5-Fluorouracil
Survival
Drug Addition
ADYDrug
Figure 2-3 SM protein–protein interaction inhibition assay based on the two-hybridsystem.
can be screened for activity. In the case of a successful interaction inhibition, theyeast colony with the added SM will survive. This allows for very large-scaleSM activity screening.
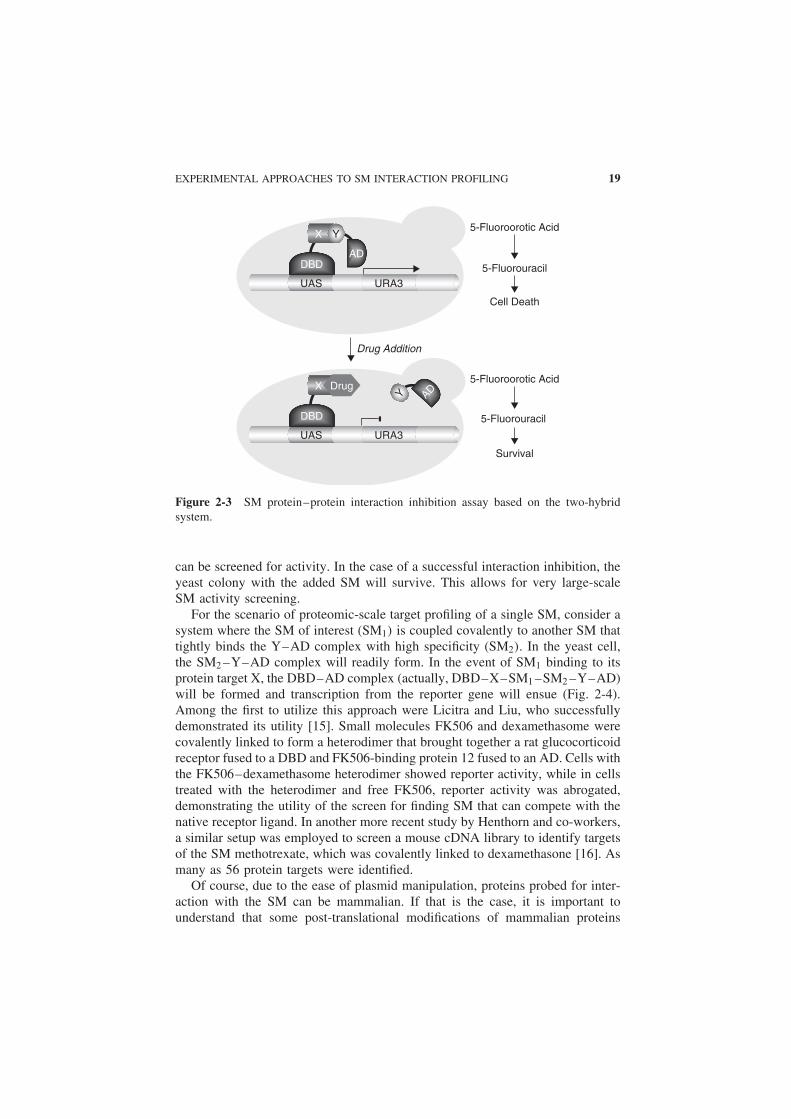
For the scenario of proteomic-scale target profiling of a single SM, consider asystem where the SM of interest (SM1) is coupled covalently to another SM thattightly binds the Y–AD complex with high specificity (SM2). In the yeast cell,the SM2 –Y–AD complex will readily form. In the event of SM1 binding to itsprotein target X, the DBD–AD complex (actually, DBD–X–SM1 –SM2 –Y–AD)will be formed and transcription from the reporter gene will ensue (Fig. 2-4).Among the first to utilize this approach were Licitra and Liu, who successfullydemonstrated its utility [15]. Small molecules FK506 and dexamethasome werecovalently linked to form a heterodimer that brought together a rat glucocorticoidreceptor fused to a DBD and FK506-binding protein 12 fused to an AD. Cells withthe FK506–dexamethasome heterodimer showed reporter activity, while in cellstreated with the heterodimer and free FK506, reporter activity was abrogated,demonstrating the utility of the screen for finding SM that can compete with thenative receptor ligand. In another more recent study by Henthorn and co-workers,a similar setup was employed to screen a mouse cDNA library to identify targetsof the SM methotrexate, which was covalently linked to dexamethasone [16]. Asmany as 56 protein targets were identified.
Of course, due to the ease of plasmid manipulation, proteins probed for inter-action with the SM can be mammalian. If that is the case, it is important tounderstand that some post-translational modifications of mammalian proteins

20 TARGET PROFILING OF SMALL MOLECULES
X
DBD
DBD
X
×
AD
Transcription
Mataα
Mataα
1. Mate 2. Add SM1-SM2 complex
Mata
SM1 SM2
Plasmid
UAS Reporter
Y
ADPlasmid
Y
Figure 2-4 SM-protein binding can be assessed with a modified two-hybrid assay.
expressed in yeast will be different from those performed by their native organ-ism, affecting the relevance of interactions detected. Fortunately, two-hybridapproaches are not simply restricted to yeast–mammalian two-hybrid systemsthat employ transient plasmid transfection, and stem cells are on the rise inrecent years—consider the recently reported real-time interaction monitoring inliving mice with a two-hybrid system [17].
Unfortunately, both of these techniques are susceptible to false positives andnegatives, due to potential SM toxicity and the ability to influence a numberof pathways irrelevant to the tested system. However, careful planning andcross-validation using other approaches should help minimize or at least estimatefalse positive and negative levels. In addition, as with any approach employingprotein conjugation or immobilization, the directionality of conjugation of the SMof interest and the interrogated protein library may be important. For instance,protein X conjugated to DBD through a terminus important for SM binding maybe falsely unrecognized as an interaction partner of the given SM. For this reason,plasmid libraries exist for N- and C-terminal protein fusion constructs, loweringthe chances of such an occurrence.
Although it would seem at first that only qualitative interaction informationcould be obtained from such screens, in fact, under certain conditions, dataobtained could be semiquantitative. For example, one need only determine equi-librium concentrations of interacting species to find the equilibrium constant [seeequation (1)]. If the transcription rate for the plasmids used could be determinedfrom FP expression from the plasmid, for instance, and if the transcription rate
EXPERIMENTAL APPROACHES TO SM INTERACTION PROFILING 21
for the reporter is known, it is possible to deduce SM–protein complex levelsalong with individual protein levels. With this information in hand, determinationof the equilibrium constant from equation (1) becomes trivial. In fact, a similarscheme has already been reported and requires somewhat more handling thana simple qualitative interaction test [13,14]. All in all, the two-hybrid approachcombines a number of characteristics that other SM interaction screening tech-nologies would do well to copy: versatility, in vivo assay conditions, extremelylow cost, and the potential for quantitative interaction profiling. It is this com-bination that assures the place of two-hybrid technologies as rapid preliminaryscreening tools.
2.2.2 Yeast-Based Genetic SM Interaction Screens
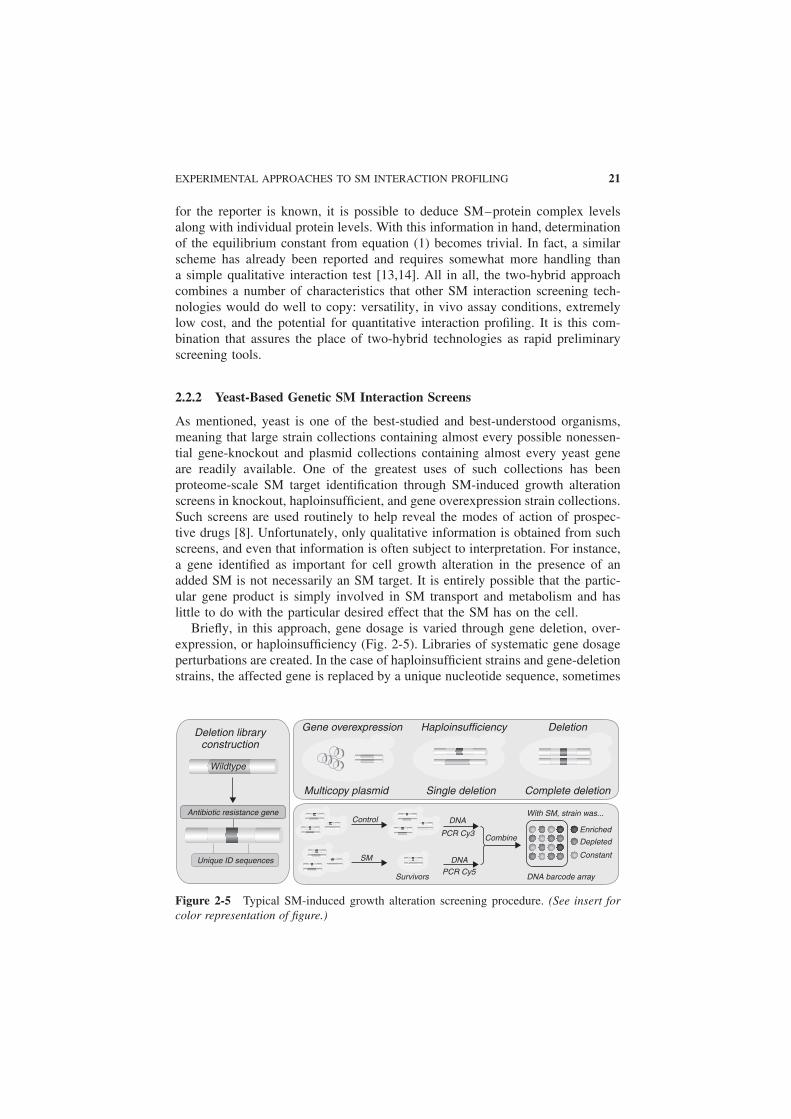
As mentioned, yeast is one of the best-studied and best-understood organisms,meaning that large strain collections containing almost every possible nonessen-tial gene-knockout and plasmid collections containing almost every yeast geneare readily available. One of the greatest uses of such collections has beenproteome-scale SM target identification through SM-induced growth alterationscreens in knockout, haploinsufficient, and gene overexpression strain collections.Such screens are used routinely to help reveal the modes of action of prospec-tive drugs [8]. Unfortunately, only qualitative information is obtained from suchscreens, and even that information is often subject to interpretation. For instance,a gene identified as important for cell growth alteration in the presence of anadded SM is not necessarily an SM target. It is entirely possible that the partic-ular gene product is simply involved in SM transport and metabolism and haslittle to do with the particular desired effect that the SM has on the cell.
Briefly, in this approach, gene dosage is varied through gene deletion, over-expression, or haploinsufficiency (Fig. 2-5). Libraries of systematic gene dosageperturbations are created. In the case of haploinsufficient strains and gene-deletionstrains, the affected gene is replaced by a unique nucleotide sequence, sometimes
Deletion library construction
Gene overexpression Haploinsufficiency Deletion
Complete deletionSingle deletionMulticopy plasmid
Antibiotic resistance gene
Unique ID sequences
Control
SM DNA
PCR Cy5
DNA
CombineEnriched
Depleted
DNA barcode arraySurvivors
Constant
With SM, strain was...
PCR Cy3
Wildtype
Figure 2-5 Typical SM-induced growth alteration screening procedure. (See insert forcolor representation of figure.)

22 TARGET PROFILING OF SMALL MOLECULES
referred to as a barcode. In the case of gene overexpression, the introduced mul-ticopy plasmid carries the identification of the perturbed gene. Now, the entirestrain collection is exposed to a SM, either in an array format, which requiresa pinning robot and additional handling, or in a pooled format, which makesthe different strains compete for survival. In either case, a population of cellsis treated with the SM of interest while another is left without treatment. Afterthe end of the treatment, extracted DNA undergoes polymerase chain reaction(PCR) amplification with fluorophore-labeled primers that differ for control andSM-treated samples. Next, the PCR products are combined and competitivelyhybridized to an oligonucleotide microarray. The dominance of fluorescence ofthe control sample indicates strain depletion for the particular gene deletion,while SM-treated sample-labeled PCR product fluorescence indicates enrichmentfor the given strain. The strains whose fitness is changed are identified and theirrespective mutated genes are inferred to be either drug targets or involved indrug metabolism.
One of the early applications was the screening of a library of 233 heterozy-gous deletion strains in a pooled format to identify the target of tunicamycin[18]. In another study, 78 growth inhibitors were screened against a collection of3503 heterozygous deletion strains in a pooled format to identify novel targetsand confirm the known pathway involvement of these SMs [19]. Although thedata produced in such studies are qualitative, there is nothing more precious thaninformation of SM interactions within the context of a living cell, which couldprovide SM mode of action information.
2.2.3 Quantitative Label-Free Interaction Profiling Systems
Affinity Chromatography Affinity chromatography (AC) is one of the first tech-niques to be adapted for quantitative high-throughput SM interaction detectionand screening [20]. Although they do not provide the cellular milieu of theliving yeast, AC-based assays remain an important tool in the HTS of SM inter-actions. The simplicity of these assays is unparalleled (Fig. 2-6). Briefly, an SMis immobilized through a covalent bond to a long linker on a solid substrate in
SM SM SM
SM SM SM
SM SM SM
SM SM SM
SM SM SM
SM SM SM
SM SM
SM SM SM
SM
Washing Washing,Analysiselution
Figure 2-6 Affinity chromatography assay—only the strong interactions will remainafter washing.

EXPERIMENTAL APPROACHES TO SM INTERACTION PROFILING 23
a chromatographic column, the substrate being column packing beads or columnwalls. A number of coupling chemistries exist to immobilize a vast majority ofSM. A protein solution, which can be a purified protein mixture or a whole-cellextract, is placed into the column. As the solution passes through the column,some constituents interact with the immobilized SM, while others bind non-specifically to the beads and the linker arm. Subsequent washing of the columnis expected to have the beneficial effect of removing constituents involved innonspecific interactions and the detrimental effect of washing away proteins thatinteract with the SM transiently or weakly. A final wash, usually with unboundSM, removes the remaining strongly interacting constituents, after which theiridentity is established, usually with mass spectrometry (MS).
This technology has been miniaturized and coupled to MS identificationdirectly to produce frontal affinity chromatography–mass spectrometry(FAC-MS) [21] (Fig. 2-7). FAC-MS allows for the rapid (thousands of SMsper day) ranking of SM candidates for binding to a particular target proteinaccording to binding affinity. In this setup, the sample travels along a capillarywhose walls serve as a substrate or a column containing beads to which the SMor protein are linked. The target is bound to the solid substrate either covalentlythrough a linker (SM) or using a biotin–streptavidin or a similar immobilizationsystem (protein). Unfortunately, as is the case for most techniques wherecovalent fixing on a solid substrate is used, this approach also often suffersfrom nonspecific interactions of the sample constituents with the linker as wellas from the aforementioned conjugation directionality issues.
As the sample proceeds through the capillary, interacting molecules areretained for longer periods of time than those that do not interact, resultingin a larger elution volume required for the interacting SMs. This allows for
m/z
Time
Detection
Figure 2-7 FAC-MS: SM affinity is proportional to retention time. (See insert for colorrepresentation of figure.)
24 TARGET PROFILING OF SMALL MOLECULES
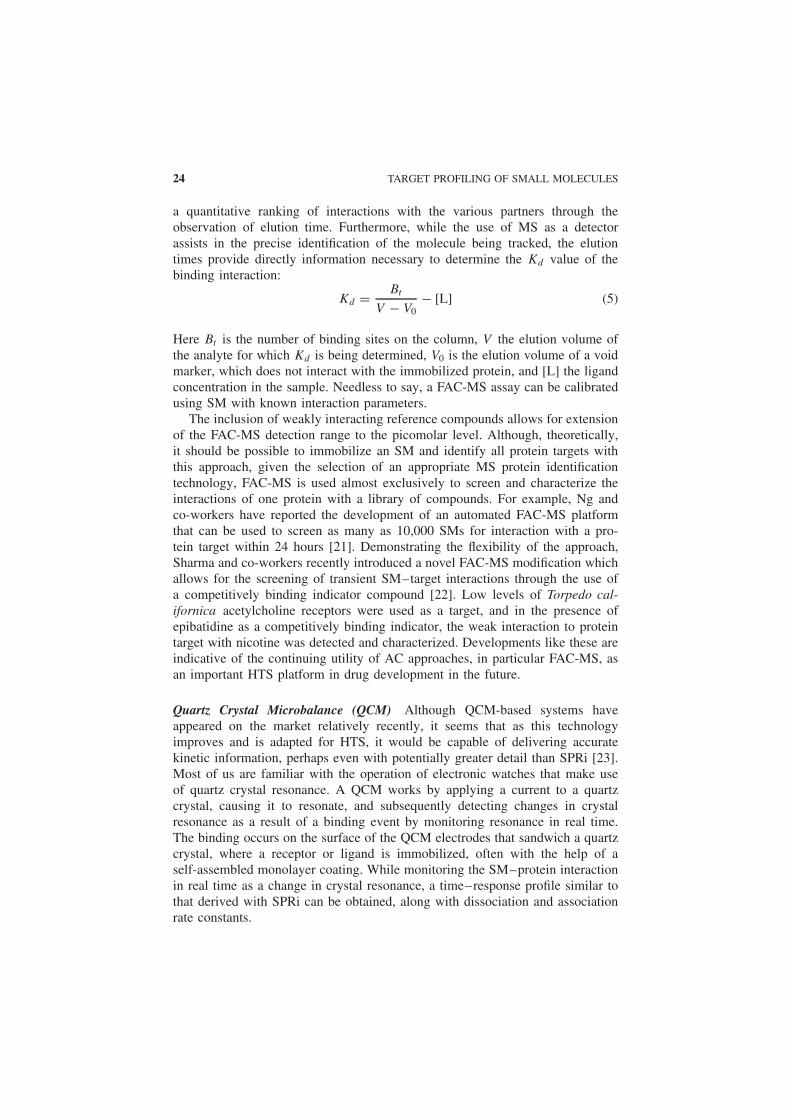
a quantitative ranking of interactions with the various partners through theobservation of elution time. Furthermore, while the use of MS as a detectorassists in the precise identification of the molecule being tracked, the elutiontimes provide directly information necessary to determine the Kd value of thebinding interaction:
Kd = Bt
V − V0− [L] (5)
Here Bt is the number of binding sites on the column, V the elution volume ofthe analyte for which Kd is being determined, V0 is the elution volume of a voidmarker, which does not interact with the immobilized protein, and [L] the ligandconcentration in the sample. Needless to say, a FAC-MS assay can be calibratedusing SM with known interaction parameters.
The inclusion of weakly interacting reference compounds allows for extensionof the FAC-MS detection range to the picomolar level. Although, theoretically,it should be possible to immobilize an SM and identify all protein targets withthis approach, given the selection of an appropriate MS protein identificationtechnology, FAC-MS is used almost exclusively to screen and characterize theinteractions of one protein with a library of compounds. For example, Ng andco-workers have reported the development of an automated FAC-MS platformthat can be used to screen as many as 10,000 SMs for interaction with a pro-tein target within 24 hours [21]. Demonstrating the flexibility of the approach,Sharma and co-workers recently introduced a novel FAC-MS modification whichallows for the screening of transient SM–target interactions through the use ofa competitively binding indicator compound [22]. Low levels of Torpedo cal-ifornica acetylcholine receptors were used as a target, and in the presence ofepibatidine as a competitively binding indicator, the weak interaction to proteintarget with nicotine was detected and characterized. Developments like these areindicative of the continuing utility of AC approaches, in particular FAC-MS, asan important HTS platform in drug development in the future.
Quartz Crystal Microbalance (QCM) Although QCM-based systems haveappeared on the market relatively recently, it seems that as this technologyimproves and is adapted for HTS, it would be capable of delivering accuratekinetic information, perhaps even with potentially greater detail than SPRi [23].Most of us are familiar with the operation of electronic watches that make useof quartz crystal resonance. A QCM works by applying a current to a quartzcrystal, causing it to resonate, and subsequently detecting changes in crystalresonance as a result of a binding event by monitoring resonance in real time.The binding occurs on the surface of the QCM electrodes that sandwich a quartzcrystal, where a receptor or ligand is immobilized, often with the help of aself-assembled monolayer coating. While monitoring the SM–protein interactionin real time as a change in crystal resonance, a time–response profile similar tothat derived with SPRi can be obtained, along with dissociation and associationrate constants.

EXPERIMENTAL APPROACHES TO SM INTERACTION PROFILING 25
During the binding, not only does the mass on the surface of the microbalanceincrease, but elasticity and viscosity properties of the ligand–receptor complexalso change. Because the resonating crystal emits an acoustic wave that propa-gates micrometers away from the source, all of these changes can be probed andused for a more detailed interaction characterization than simple binding kinetics(e.g., to probe structural implications of binding). The former, however, are easyto monitor in real time, thanks to the direct correspondence between the changein the frequency of vibration and the weight that is placed on the QCM electrode:
�f = f0
A�N�W (6)
Here �f is the observed frequency change, f0 the frequency prior to applicationof a weight �W , A the surface area of the cylindrical quartz crystal, � its density,and N the crystal’s frequency constant.
To date, protein–protein, protein–SM [24], and even DNA–SM interactionswere characterized successfully using QCM technology [23]. Unfortunately,interaction characterization with QCM is still geared toward detailed andlow-throughput interaction analysis, even though the drive toward multiplexingand increasing the throughput of the approach is evident. For instance, theRAP�id -4 system introduced in 2006 by Akubio Technologies employs the basicprinciples of QCM along with some variations, and makes possible automatedmonitoring of SM–protein interactions [25]. The system was demonstrated torank three cofactors of glucose dehydrogenase correctly according to measuredbinding response. Other multiplexed QCM arrays incorporating up to 10 sensorshave also been developed, but so far have been used only for the detectionof analytes in a mixed sample [26]. Whatever the present state of QCM, webelieve that sensor miniaturization and consistent improvement in automationmay someday make QCM-based multiplexed SM interaction profiling studies areality.
Electrochemical Interaction Detection Electrochemical interaction detection isa large and rapidly evolving field with a great number of variations in interactionassays [27]. Electrochemical detectors are attractive due to the ease of minia-turization, assay rapidity, low cost of assay hardware, and great sensitivity. It isbecoming increasingly easy to produce protein arrays for rapid and quantitativeinteraction characterization, in part due to the existing advances in electronics,particularly circuit printing, which electrochemical detection technologies candraw upon. In general, an electrochemical detection device involves three elec-trodes: a reference electrode placed away from the electrochemical reaction andused to maintain a stable potential; an auxiliary electrode that comes in contactwith the redox solution and allows for the current flow to the working electrode;and a working electrode in which the biochemical or redox reaction occurs andwhich acts as a transducer. Connection of these electrodes to an electronic testdevice allows one to monitor changes in potential, current, conductive propertiesof the solution medium, and impedance.

26 TARGET PROFILING OF SMALL MOLECULES
Source Drain
Current
Channel (e.g., SWCN)
Protein application
SM
Conductance change observed
Current
SM
Figure 2-8 One highly simplified mechanism of action of a simple field-effecttransistor-based interaction detection device.
Field-effect transistors constitute a very promising and distinct device classwhich, in basic terms, can measure alterations in conductance of a chargecarrier–depleted region (channel) between a source and a drain electrode as adirect or indirect result of biochemical events such as enzymatic reactions orbinding events (Fig. 2-8). The channel can be composed of a silicon nanowireor a single-walled carbon nanotube (SWNT), for example. The power offield-effect transistors has been widely demonstrated with aptamer-based proteinrecognition devices such as the SWNT thrombin detection device [28]. Sinceit is possible to obtain time–conductance change curves with these systems,quantitative analysis of interactions between SMs and their target proteins is alsopossible. Furthermore, such devices can be microfabricated or even potentiallynanofabricated, resulting in extremely high-density arrays for quantitativemultiplexed proteome-scale interaction characterization and protein detection[29]. The channels for such devices can then potentially be derivatized throughany of the existing processes, such as photo- or nanolithography [30].
Electrochemical impedance spectroscopy (EIS) is another technology thatallows label-free quantitative interaction detection. In this approach, the surfaceof an electrode is modified through application of a self-assembled monolayerto permit further derivatization that would ultimately lead to protein, DNA, orSM immobilization on the surface. An electrode array can be produced, witheach electrode derivatized with a distinct SM or protein. Once the immobiliza-tion is complete through the application of an appropriate coupling chemistry, theresulting chip or single device is incubated with the interrogated sample whilethe impedance of electron transfer to a redox solution is measured (Fig. 2-9). Inone setup, in which certain sample constituents bind to the immobilized proteinor small-molecule probe, the impedance of the layer immediately adjacent to theworking electrode will increase, due to hindrance of electron transfer from theworking electrode. In very simple terms, the complex impedance is determinedby examining the changes in the current upon application of an ac potential ofa given frequency at the working electrode. The parameters measured are theabsolute impedance and its phase, which depends on the frequency of appliedpotential. It is the change in phase that provides the means to detect the changes

EXPERIMENTAL APPROACHES TO SM INTERACTION PROFILING 27
Figure 2-9 Typical EIS device. Auxiliary, working, and reference electrodes are shownin gold, blue, and green, respectively. In a solution (gray transparent cube), a redox com-pound such as Fe(CN)6
3− will “complete the circuit” between the auxiliary and workingelectrodes, but upon application of a protein that would bind to a SM immobilized onthe working electrode, the access of the redox solute may be severely limited, resultingin impedance changes. (See insert for color representation of figure.)
in the layer surrounding the working electrode, and thus to detect and charac-terize binding events. Impedance phase can be recorded with respect to appliedpotential frequency, and the resulting spectrum can be monitored for shifts duringa binding event.
To date, this approach has been used primarily as the foundation of sensing oftarget compounds in a solution through the use of electrodes coated with DNAaptamers, allowing for nanomolar to subnanomolar detection. For example, Leeand co-workers have reported the development of an EIS aptamer-based devicefor thrombin detection whose detector part is no bigger than 25 mm2 [31]. Sincethe use of a redox solution poses certain risks to the sample and immobilizedmolecules, novel methods are being developed that would abolish the need forits use [28].
Additionally, the method was applied to probing protein–protein interactionsin an array format by Evans and co-workers [32]. In this study, a selectivechemical masking process was used specifically to derivatize 20-μm-wide goldelectrodes. The mask was removed by selective application of a potential tothe appropriate electrode, after which the appropriate aptamer was applied. Sub-nanomolar protein detection from cell lysate was attained in a multiplexed format.Although only few electrodes were used in this case, the approach can easily beextended. It is easy to foresee that as this methodology improves, the use of EISwill also allow for highly accurate studies of protein–protein interaction disrup-tion by SMs as well as for dynamic interrogation of SM–protein binding eventsin a high-throughput format. The possibility of integration of electrochemicaldetection devices with other instruments (e.g., QCM or SPRi) opens doors tosignificantly more accurate and data-rich assays [33]. All in all, in terms of HTS,EIS is as yet in an intermediate development stage, but its potential applicationsin inexpensive and versatile interaction screening will certainly establish it as animportant tool for SM target profiling in the very near future.

28 TARGET PROFILING OF SMALL MOLECULES
Height increase due to binding
Immobilized Layer
Chip Surface
Incident LightWavelength (mm)
Inte
nsity
Figure 2-10 Principles of RIfS: A change in the optical thickness (a product of physicalthickness and refractive index) of the immobilized layer due to binding will trigger a shiftin the interference pattern.
Reflectometric Interference Spectroscopy (RIFS) Another promising technologydeveloped in recent years is RIfS, which may complement or even replace SPRi asa quantitative HTS method of choice. In very simple terms, RIfS relies on partialreflection of light upon transfer between two materials with different refractiveindices combined with thin-film interference effects [34]. In an assay, a portion ofincident light will be reflected at each material interface, forming an interferencepattern when the path length of light through a particular layer supersedes thecoherence wavelength, as is often the case in the immobilized layer (Fig. 2-10).A change in the height or refractive index of the immobilized layer, which occursupon adsorption of molecules to the layer, will lead to changes in the interferencepattern, which can be observed over time with a diode-array detector, for instance.Since RIfS depth of penetration into the solution is about 100-fold greater thanthat of SPRi [34], this technique is capable of providing more pronounced signals.Further, because RIfS relies on both the refractive index and the path lengthof light through the immobilized layer, temperature change–induced refractionindex changes are not as much of a concern as they are with SPRi.
Although this approach has enjoyed a much lower level of recognition andapplication for biochemical problems, several interesting studies making use ofit have appeared. Of interest is a recent study that utilized RIfS in conjunctionwith matrix-assisted laser desorption ionization–time of flight (MALDI-TOF)MS not only to study the dynamics of binding of vancomycin-type glycopeptideantibiotics to an immobilized target peptide, but also to identify the bound com-pounds on the surface of the chip [35]. This study has demonstrated the potentialfuture utility of RIfS as a multiplexed quantitative proteome-scale SM interactiondetection technique.
Surface Plasmon Resonance Imaging Whereas most of the technologies wehave discussed so far are only developing, SPRi has been available for quitesome time, offering quantitative, label-free, robust, and economical interactiondetection in a high-throughput format (Fig. 2-11) [36]. Although RIfS and EISmay provide data types similar to those of this technique, SPRi has been com-mercialized and subsequently developed for routine practical applications much
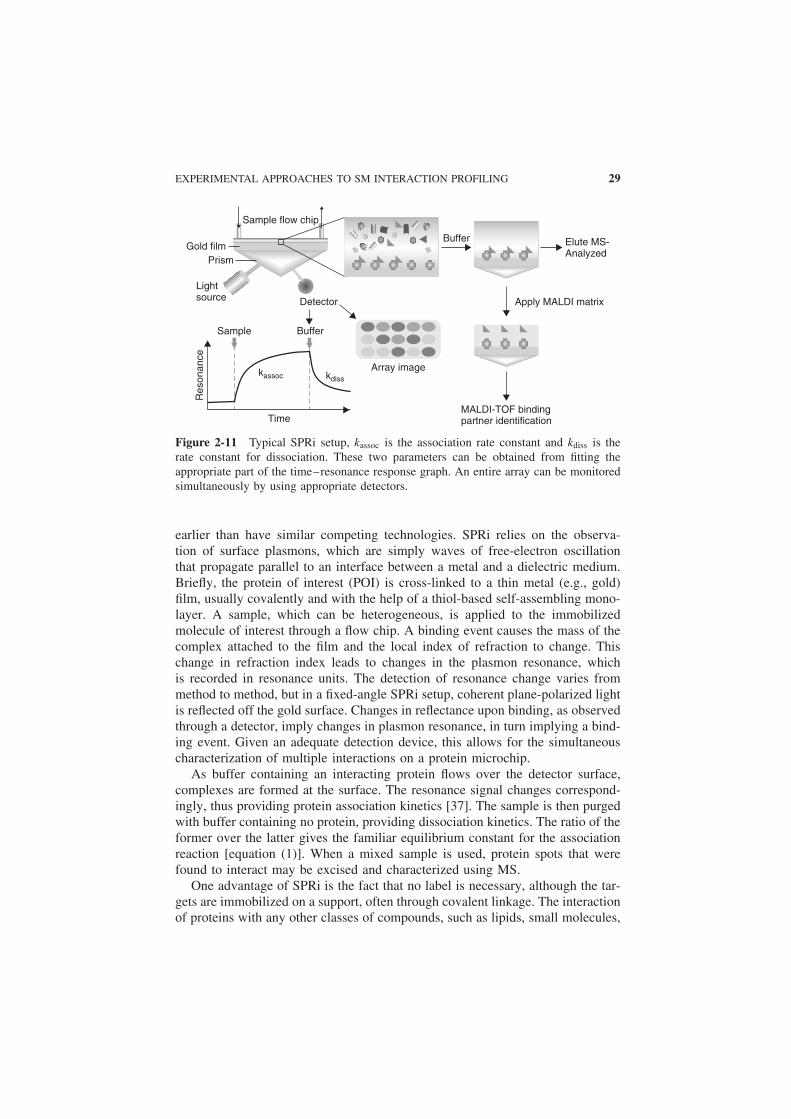
EXPERIMENTAL APPROACHES TO SM INTERACTION PROFILING 29
Sample flow chip
Buffer Elute MS-Analyzed
Apply MALDI matrix
MALDI-TOF bindingpartner identification
Array image
Time
Res
onan
ce
kassoc kdiss
Detector
Lightsource
Gold film
Sample Buffer
Prism
Figure 2-11 Typical SPRi setup, kassoc is the association rate constant and kdiss is therate constant for dissociation. These two parameters can be obtained from fitting theappropriate part of the time–resonance response graph. An entire array can be monitoredsimultaneously by using appropriate detectors.
earlier than have similar competing technologies. SPRi relies on the observa-tion of surface plasmons, which are simply waves of free-electron oscillationthat propagate parallel to an interface between a metal and a dielectric medium.Briefly, the protein of interest (POI) is cross-linked to a thin metal (e.g., gold)film, usually covalently and with the help of a thiol-based self-assembling mono-layer. A sample, which can be heterogeneous, is applied to the immobilizedmolecule of interest through a flow chip. A binding event causes the mass of thecomplex attached to the film and the local index of refraction to change. Thischange in refraction index leads to changes in the plasmon resonance, whichis recorded in resonance units. The detection of resonance change varies frommethod to method, but in a fixed-angle SPRi setup, coherent plane-polarized lightis reflected off the gold surface. Changes in reflectance upon binding, as observedthrough a detector, imply changes in plasmon resonance, in turn implying a bind-ing event. Given an adequate detection device, this allows for the simultaneouscharacterization of multiple interactions on a protein microchip.
As buffer containing an interacting protein flows over the detector surface,complexes are formed at the surface. The resonance signal changes correspond-ingly, thus providing protein association kinetics [37]. The sample is then purgedwith buffer containing no protein, providing dissociation kinetics. The ratio of theformer over the latter gives the familiar equilibrium constant for the associationreaction [equation (1)]. When a mixed sample is used, protein spots that werefound to interact may be excised and characterized using MS.
One advantage of SPRi is the fact that no label is necessary, although the tar-gets are immobilized on a support, often through covalent linkage. The interactionof proteins with any other classes of compounds, such as lipids, small molecules,

30 TARGET PROFILING OF SMALL MOLECULES
and aptamers or nucleic acid fragments, may be examined. Conveniently, thecomposition of the flow chamber solution may be altered to characterize therange of conditions in which an interaction occurs. The sensor chip is highlyreusable, with some studies using one chip up to 50 times. Additionally, thesample that passes over the sensor surface need not be pure, as MALDI-TOFMS can be used to identify the interacting proteins. One may even envision ascenario in which whole-cell proteomic extract is separated into fractions [e.g.,with high-performance liquid chromatography (HPLC)] even before reaching thesensor surface to simplify MALDI analysis by considering HPLC lysate frac-tions sequentially. SPRi is also highly versatile; in one study, SPRi was usedto identify phosphorylated proteins using the biotin–streptavidin system [38],while in another, cells were grown on the detector chip and lysed for interactionanalysis [39].
Finally, this technique is highly scalable. Nanohole arrays allow for improvedSPRi resolution, making it is theoretically possible to assay the interactions ofmore than 1 million proteins in 1 mm2 [40]. Of course, it is imperative for pro-tein printing resolution to correspond to that of analysis resolution to take fulladvantage of SPRi. Efficient protein printing methods, such as dip-pen nano-lithography, have been developed recently [41]. Methods to immobilize proteinswith a histidine tag have been available for a long time [42]. Self-assemblingprotein chips may also be used for high-density protein array production [43]. Inthis system, cDNA with epitope-tagged sequences of POIs is immobilized on thechip along with a capture agent, such as an aptamer or label capture molecule.As a cell-free expression system synthesizes the POI, it is immediately capturednext to the site of its production. In terms of commercially available instruments,a single chip of an area of about 1 cm2 can contain from 10 to 400 spots (Bia-core [44] and GWC Technologies, Inc. [45]) to 1000 to 10,000 spots (Lumera[46]). With these systems it is possible quantitatively to characterize binding ineach spot simultaneously with detection limits in the femtogram range and timeresolution on the order of 1 second or less.
SPRi is extremely well suited for accurate thermodynamic characterization ofbinding as well. In a recent study, Yan and co-workers were capable of iden-tifying entropic and enthalpic contributions to free energy of binding of Aβ
binding alcohol dehydrogenase to Aβ, considered to be central to Alzheimer’sdisease [47]. In another study, potential small-molecule ligands were screenedfor interaction with a human estrogen receptor, providing the authors with kineticcharacterization of the binding of these drug candidates [48].
Similar to two-hybrid screens, SPRi can be used to detect conditions underwhich proteins do not interact. The interaction of human papillomavirus E7 pro-tein and retinoblastoma tumor suppressor protein RB was studied by Jung andco-workers [49]. Fifteen hundred protein spots containing immobilized E7 pro-tein were produced, and an interaction with added RB protein was detected usingSPR. The addition of a peptide derived from a motif on E7 along with RB hasbeen observed to clearly disrupt the interaction through lack of an SPR signal.The one peptide discussed in this study can easily be replaced with an array of
COMPUTATIONAL APPROACHES 31
peptides or SMs, and a number of different proteins can be imprinted or addedon this array.
Furthermore, the method was also applied very recently to drug–drug inter-action characterization by Kuroda and co-workers [50]. For other applications,Rich and Myszka provide an extensive review of SPR literature that is highlyrecommended [51]. A large and growing number of other studies that employSPRi are available, including studies on interactions of membrane proteins,domain–domain interactions, and various protein–ligand interactions. Thepopularity and the scale of development of SPR and SPRi-based technologiesmake us believe that it is these technologies that will be the most prominentcatalysts of a quantitative revolution in all areas of biology, rapidly providingsystems biology and rational drug design fields with much-needed quantitativedata on a proteomic scale.
2.3 COMPUTATIONAL APPROACHES
2.3.1 Introduction
Thus far we have considered the derivation of kinetic constants describing inter-actions from experimental data through either direct observation of dissociationand association kinetics through a time–response curve (Fig. 2-11), relative bind-ing affinity rankings with FAC, or indirect interaction observation with a reporterthrough yeast two-hybrid techniques. However, many of these technologies sufferfrom different drawbacks, from the occurrence of false positives and negatives tothe incompatibility of assay conditions with successful formation of all potentialcomplexes in a multiplexed assay. The question of whether these experimentalcomplications can be avoided and, if possible, eliminated completely arises nat-urally. One way to avoid these complications along with the experimental timeand material costs is to consider the fourth route to interaction characterization:interaction energy calculations. In fact, virtual interaction screening for largechemical libraries is already helping great numbers of researchers in industryand academia alike to understand and design ligands (e.g., for pharmaceuticalapplications) [52].
Although many theoretical methodologies, starting with density functional the-ory and semiempirical geometry optimization and energy calculation algorithmsdown to protein sequence–based analysis rely inherently on experimental datafor parametrization, thus incorporating any experimental errors, other methods,such as ab initio quantum mechanical methods, rely on few, if any, experimentaldata. The major drawback for the latter algorithms is the dreadful scaling ofcomputational effort required with the number of elements in the system consid-ered. However, with Moore’s law–type progression in computational hardwarecosts and performance, along with developments in nascent technologies suchas quantum computing, one can foresee a time when brute-force approacheswith all-atom, all-electron, all-interaction complex and transition-state free-energycalculations will become a reality for biomacromolecule-scale problems. For

32 TARGET PROFILING OF SMALL MOLECULES
example, a computational power equivalent of the IBM Deep Blue supercomputerbuilt in the early 1990s, used to beat Garry Kasparov at chess, has recently beenbuilt by academics for about $1000 using, among other things, four low-cost pro-cessors. Whether ab initio methods will provide a level of accuracy sufficientlyhigher than that of experimentally parametrized ubiquitous low-cost computa-tional chemistry methods such as Austin Method 1 (AM1) is questionable. It iscertain, however, that such methods will possess a greater level of general appli-cability, allowing them to treat accurately compounds outside the parametrizationset of modern low-cost methods.
Although first prototypes of quantum computing-based systems are only nowbeing built, sufficiently computationally powerful systems are still out of ourreach, forcing researchers to apply simplifying assumptions in their studies. Forexample, one famous assumption is the treatment of atoms as hard, chargedspheres of a given mass connected by springs, used within molecular mechan-ics force field (MMFF) frameworks, which facilitates calculations on very largesystems. Another way to look at interaction prediction and characterization isto consider recurrent protein sequence patterns, which are used by proteins tointeract with small molecules. In the following sections we very briefly considera few interesting applications and trends in theoretical interaction screening tech-nologies. The reader is referred elsewhere for a more in-depth treatment of thesubject [53].
2.3.2 Energy-Based SM Interaction Predictions
Most of the methods for SM interaction profiling in use today employ MMFFs,which do not provide the actual Gibbs free energies of formation, but rather thestrain energies, which only reflect the instability of the system in question. Thatis, all the bonds, angles, and dihedral angles are springs, and any distortion ofa spring from its equilibrium point will result in the accumulation of potentialenergy. The presence of electrostatic and van der Waals interactions will furthermodify this strain energy. In fact, it is the latter two factors that almost entirelydetermine the energies of interaction between a small molecule and its appro-priate binding site. Although the binding site may change its configuration toaccommodate an SM distinct from its native ligand, a large number of studiesapply a rigid protein assumption, leaving the active site fixed while the optimalconfiguration of an SM is found within it. In some cases, researchers have goneso far as to suggest abstracting all binding pocket surfaces to form a pocketcollection they refer to as the pocketome to facilitate the identification of SMprotein targets through the calculation of pocket–SM interaction energies [54].
Although many protein x-ray crystal structures are of proteins in a complexwith an inhibitor or, in general, an SM interaction partner, making the bind-ing pocket easy to identify, this is not the case for all the three-dimensionalstructures deposited. For this purpose, several authors successfully identified thebinding pockets of a wide range of protein structures from a number of organ-isms, drawing on protein structure and sequence similarity [55,56]. In one case,

COMPUTATIONAL APPROACHES 33
of 5616 pockets considered, the algorithm presented identified 96.8% of the bind-ing sites, 85.7% of the sites predicted showing similarity to actual binding sitesof 80% or more [54]. Provided that the sequence and geometry of the bindingsites can be determined from a crystallographic experiment or from an algorithmsuch as the one discussed, any of the existing computational chemistry packages,such as AutoDock [57], GROMACS [58], and MOE [59], can be used to esti-mate binding energies and to evaluate the quality of fit of a particular SM ina particular binding site. (The former two packages are free for academic use,highly accessible, easy to use, and are supported with extensive online docu-mentation and user forums; for a general review, see ref. 60.) This allows, forexample, for preliminary SM target profiling for different organisms, which isimportant in pesticide and antibiotic development. In addition to this, computa-tional interaction profiling is relatively rapid and rather inexpensive relative to theexperimental methods mentioned. As computational power and algorithm opti-mization continue to develop, in silico interaction profiling will keep growingin reliability and applicability, providing interaction data on an unprecedentedscale.
2.3.3 Sequence-Based SM Interaction Predictions
Another way to predict protein–SM interactions is to assume that similar pro-tein sequences bind similar SMs. This is a simple, yet powerful assumption,providing accurate interaction predictions, demonstrated in a number of studies.The actual implementation of this idea into a computational algorithm is lim-ited only by human imagination and available time, so its discussion is beyondthe scope of this chapter. One interesting sequence-based interaction predic-tion approach reported by Synder and co-workers [61] was used to create thesmall-molecule interaction database (SMID) (Fig. 2-12). Biologically relevantSMs were determined from three-dimensional x-ray crystal structures containing
Unknown SM Target protein list
Binding sites identifiedUnknown sequence
Protein sequence
AKVVA....LAPKA
AAWVKK....LAALAP
Chemical ontology similarity
SMID
BLAST
Annotated sequence
SM1 SM2SM3SM4SM5
RCSBPDB
Figure 2-12 Simplified overview of the mechanism of action of SMID-based SM targetprofiling and protein SM binding site identification.
34 TARGET PROFILING OF SMALL MOLECULES
solvents, cofactors, and extraneous molecules provided by the Research Collab-oratory for Structural Bioinformatics Protein Data Bank. Amino acid residuesimportant in binding to the SM were determined from interaction proximity andconservation of binding motif across multiple sequences. All of this informationwas then used to annotate SM binding sites on structurally determined proteins,generating the SMID.
Embodied as the SMID-BLAST tool, a protein of interest is compared againstthe SM-binding proteins in the SMID database so as to identify portions of theprotein anticipated to interact with a particular small molecule. Interestingly,this approach was then extended to allow for the profiling of interactions of agiven small molecule within SMID [62]. An ontological-based semantic sim-ilarity measure was chosen to identify close structural or drug analogs to thequeried molecule, although SMILES string or InChI-based searches would alsohave been possible. Thus, accurate SM target identification is possible in sil-ico using very little preliminary sequence information. Although protein–SMinteraction energy calculations from first principles may someday become com-monplace and highly reliable in the short to medium term, there is nothingas elegant and as computationally inexpensive as sequence-based interactionprediction.
2.4 CONCLUSIONS
Indeed, in the past decade, there has been a remarkably rapid evolution of quali-tative interaction profiling based on yeast two-hybrid methods to proteome-scalequantitative dynamic characterization of SM–protein binding events based on,for example, SPRi, augmented with in silico interaction prediction. We cannotremain unmoved both by the present state of the field, where only a few yearsago quantitative information on a proteomic scale seemed like a dream, and bythe exciting paths of scientific discovery unlocked by this information. Much likethe revolutionary sequencing of the human and other organisms’ genomes hasprovided vast quantities of information regarding the essence of life and under-lying mechanisms, the present-day quantitative revolution will leave a mark onall fields of biochemical enquiry. Although experimental and theoretical SM tar-get profiling methodologies are presently very well developed, we are lookingforward to the next stages of interaction characterization: the determination ofprecise binding mechanisms in a high-throughput format.
Additionally, since most of the techniques discussed here can monitor a largerange of reaction dynamics besides SM–protein target interaction, includingenzymatic reaction dynamics, complete dynamic cell-scale process descriptionwill become available. Among other things, these breakthroughs will enable usto develop quantitative, mechanistic models of the cell, which in turn would leadto the discovery of side effect–free drugs to combat entrenched diseases, moreeffective pesticides and antibiotics, and more productive and novel bioindustrialprocesses. Indeed, the SM target profiling field is ripe for a bountiful harvest ofknowledge.

REFERENCES 35
REFERENCES
1. Rautio, J., Kumpulainen, H., Heimbach, T., et al. (2008). Prodrugs: design and clinicalapplications. Nat. Rev. Drug Discov ., 7 , 255–270.
2. Ling, M. M., Ricks, C., Lea, P. (2007). Multiplexing molecular diagnostics andimmunoassays using emerging microarray technologies. Expert Rev. Mol. Diagn .,7 , 87–98.
3. Lohse, M. J., Hein, P., Hoffmann, C., Nikolaev, V. O., Vilardaga, J. P., Bunemann,M. (2008). Kinetics of G-protein-coupled receptor signals in intact cells. Br. J. Phar-macol ., 153 , S125–S132.
4. Freyer, M. W., Lewis, E. A. (2008). Isothermal titration calorimetry: experimentaldesign, data analysis, and probing macromolecule/ligand binding and kinetic interac-tions. Methods Cell Biol ., 84 , 79–113.
5. Nelson, R. W., Nedelkov, D., Tubbs, K. A. (2000). Biosensor chip mass spectrometry:a chip-based proteomics approach. Electrophoresis , 21 , 1155–1163.
6. Evans, D. B., Rank, K. B., Sharma, S. K. (2002). A scintillation proximity assay forstudying inhibitors of human tau protein kinase II/cdk5 using a 96-well format. J.Biochem. Biophys. Methods , 50 , 151–161.
7. Stanyon, C. A., Liu, G., Mangiola, B. A., et al. (2004). A Drosophila protein-interaction map centered on cell-cycle regulators. Genome Biol ., 5 , R96.
8. Parsons, A. B., Lopez, A., Givoni, I. E., et al. (2006). Exploring the mode-of-actionof bioactive compounds by chemical-genetic profiling in yeast. Cell , 126 , 611–625.
9. Becker, F., Murthi, K., Smith, C., et al. (2004). A three-hybrid approach to scan-ning the proteome for targets of small molecule kinase inhibitors. Chem. Biol ., 11 ,211–223.
10. Botstein, D., Chervitz, S. A., Cherry, J. M. (1997). Yeast as a model organism.Science, 277 , 1259–1260.
11. Giaever, G., Flaherty, P., Kumm, J., et al. (2004). Chemogenomic profiling: identi-fying the functional interactions of small molecules in yeast. Proc. Natl. Acad. Sci.USA, 101 , 793–798.
12. Fields, S., Song, O. (1989). A novel genetic system to detect protein–protein inter-actions. Nature, 340 , 245–246.
13. Titz, B., Thomas, S., Rajagopala, S. V., Chiba, T., Ito, T., Uetz, P. (2006). Transcrip-tional activators in yeast. Nucleic Acids Res ., 34 , 955–967.
14. Ehlert, A., Weltmeier, F., Wang, X., et al. (2006). Two-hybrid protein–protein inter-action analysis in Arabidopsis protoplasts: establishment of a heterodimerization mapof group C and group S bZIP transcription factors. Plant J ., 46 , 890–900.
15. Licitra, E. J., Liu, J. O. (1996). A three-hybrid system for detecting smallligand–protein receptor interactions. Proc. Natl. Acad. Sci. USA, 93 , 12817–12821.
16. Henthorn, D. C., Jaxa-Chamiec, A. A., Meldrum, E. (2002). A GAL4-based yeastthree-hybrid system for the identification of small molecule–target protein interac-tions. Biochem. Pharmacol ., 63 , 1619–1628.
17. Ray, P., Pimenta, H., Paulmurugan, R., et al. (2002). Proc. Natl. Acad. Sci. USA, 99 ,3105–3110.
18. Giaever, G., Shoemaker, D. D., Jones, T. W., et al. (1999). Genomic profiling of drugsensitivities via induced haploinsufficiency. Nat. Genet ., 21 , 278–283.

36 TARGET PROFILING OF SMALL MOLECULES
19. Lum, P. Y., Armour, C. D., Stepaniants, S. B., et al. (2004). Discovering modes ofaction for therapeutic compounds using a genome-wide screen of yeast heterozygotes.Cell , 116 , 121–137.
20. Katayama, H., Oda, Y. (2007). Chemical proteomics for drug discovery based oncompound-immobilized affinity chromatography. J. Chromatogr. B , 855 , 21–27.
21. Ng, W., Dai, J. R., Slon-Usakiewicz, J. J., Redden, P. R., Pasternak, A., Reid, N.(2007). Automated multiple ligand screening by frontal affinity chromatography–mass spectrometry (FAC-MS). J. Biomol. Screen ., 12 , 167–174.
22. Sharma, J., Besanger, T. R., Brennan, J. D. (2008). Assaying small-molecule-receptorinteractions by continuous flow competitive displacement chromatography/mass spec-trometry. Anal. Chem ., 80 , 3213–3220.
23. Cooper, M. A., Singleton, V. T. (2007). A survey of the 2001 to 2005 quartz crystalmicrobalance biosensor literature: applications of acoustic physics to the analysis ofbiomolecular interactions. J. Mol. Recognit ., 20 , 154–184.
24. Nishino, H., Nihira, T., Mori, T., Okahata, Y. (2004). Direct monitoring of enzymaticglucan hydrolysis on a 27-MHz quartz-crystal microbalance. J. Am. Chem. Soc., 126 ,2264–2265.
25. Godber, B., Frogley, M., Rehak, M., et al. (2007). Profiling of molecular interactionsin real time using acoustic detection. Biosens. Bioelectron ., 22 , 2382–2386.
26. Luo, Y., Chen, M., Wen, Q., et al. (2006). Rapid and simultaneous quantificationof four urinary proteins by piezoelectric quartz crystal microbalance immunosensorarray. Clin. Chem ., 52 , 2273–2280.
27. Grieshaber, D., MacKenzie, R., Voros, J., Reimhult, E. (2008). Electrochemicalbiosensors: sensor principles and architectures. Sensors , 8 , 1400–1458.
28. Radi, A. E., Acero Sanchez, J. L., Baldrich, E., O’Sullivan, C. K. (2006). Reagentless,reusable, ultrasensitive electrochemical molecular beacon aptasensor. J. Am. Chem.Soc., 128 , 117–124.
29. Chen, C., Zhang, Y. (2006). Carbon nanotube multi-channeled field-effect transistors.J. Nanosci. Nanotechnol ., 6 , 3789–3793.
30. Lee, J. Y., Shah, S. S., Zimmer, C. C., Liu, G. Y., Revzin, A. (2008). Use of pho-tolithography to encode cell adhesive domains into protein microarrays. Langmuir ,24 , 2232–2239.
31. Lee, J. A., Hwang, S., Kwak, J., Park, S. I., Lee, S. S., Lee, K.-C. (2007). An elec-trochemical impedance biosensor with aptamer-modified pyrolyzed carbon electrodefor label-free protein detection. Sens. Actuat. B , 1 , 372–379.
32. Evans, D., Johnson, S., Laurenson, S., Davies, A. G., Ko Ferrigno, P., Walti, C.(2008). Electrical protein detection in cell lysates using high-density peptide-aptamermicroarrays. J. Biol ., 7 , 3.
33. Jia, X., Xie, Q., Zhang, Y., Yao, S. (2007). Simultaneous quartz crystalmicrobalance–electrochemical impedance spectroscopy study on the adsorption ofanti-human immunoglobulin G and its immunoreaction at nanomaterial-modified Auelectrode surfaces. Anal. Sci ., 23 , 689–696.
34. Proll, G., Steinle, L., Proll, F., et al. (2007). Potential of label-free detection inhigh-content-screening applications. J. Chromatogr. A, 1161 , 2–8.

REFERENCES 37
35. Mehlmann, M., Garvin, A. M., Steinwand, M., Gauglitz, G. (2005). Reflectometricinterference spectroscopy combined with MALDI-TOF mass spectrometry to deter-mine quantitative and qualitative binding of mixtures of vancomycin derivatives. Anal.Bioanal. Chem ., 382 , 1942–1948.
36. Yu, X., Xu, D., Cheng, Q. (2006). Label-free detection methods for protein microar-rays. Proteomics , 6 , 5493–5503.
37. Rich, R. L., Cannon, M. J., Jenkins, J., et al. (2008). Extracting kinetic rate constantsfrom surface plasmon resonance array systems. Anal. Biochem ., 373 , 112–120.
38. Inamori, K., Kyo, M., Nishiya, Y., et al. (2005). Detection and quantification ofon-chip phosphorylated peptides by surface plasmon resonance imaging techniquesusing a phosphate capture molecule. Anal. Chem ., 77 , 3979–3985.
39. Kim, M., Park, K., Jeong, E. J., Shin, Y. B., Chung, B. H. (2006). Surface plasmonresonance imaging analysis of protein–protein interactions using on-chip-expressedcapture protein. Anal. Biochem ., 351 , 298–304.
40. De Leebeeck, A., Kumar, L. K., de Lange, V., Sinton, D., Gordon, R., Brolo, A.G. (2007). On-chip surface-based detection with nanohole arrays. Anal. Chem ., 79 ,4094–4100.
41. Liu, X., Yue, J., Zhang, Z. (2008). Generation of F(0)F(1)-ATPase nanoarray bydip-pen nanolithography and its application as biosensors. Arch. Biochem. Biophys .,(in press).
42. Gershon, P. D., Khilko, S. (1995). Stable chelating linkage for reversible immobi-lization of oligohistidine tagged proteins in the BIAcore surface plasmon resonancedetector. J. Immunol. Methods , 183 , 65–76.
43. Ramachandran, N., Hainsworth, E., Bhullar, B., et al. (2004). Self-assembling proteinmicroarrays. Science, 305 , 86–90.
44. Biacore. http://www.biacore.com/lifesciences/index.html.
45. GWC Technologies, Inc. http://www.gwctechnologies.com.
46. Lumera. http://www.lumera.com.
47. Yan, Y., Liu, Y., Sorci, M., et al. (2007). Surface plasmon resonance and nuclear mag-netic resonance studies of ABAD–Abeta interaction. Biochemistry , 46 , 1724–1731.
48. Rich, R. L., Hoth, L. R., Geoghegan, K. F., et al. (2002). Kinetic analysis of estrogenreceptor/ligand interactions. Proc. Natl. Acad. Sci. USA, 99 , 8562–8567.
49. Jung, S. O., Ro, H. S., Kho, B. H., Shin, Y. B., Kim, M. G., Chung, B. H. (2005). Sur-face plasmon resonance imaging-based protein arrays for high-throughput screeningof protein–protein interaction inhibitors. Proteomics , 5 , 4427–4431.
50. Kuroda, Y., Saito, M., Sakai, H., Yamaoka, T. (2008). Rapid characterization ofdrug–drug interaction in plasma protein binding using a surface plasmon resonancebiosensor. Drug Metab. Pharmacokinet ., 23 , 120–127.
51. Rich, R. L., Myszka, D. G. (2007). Survey of the year 2006 commercial opticalbiosensor literature. J. Mol. Recognit ., 20 , 300–366.
52. Charifson, P. S., Walters, W. P. (2002). Filtering databases and chemical libraries. J.Comput.-Aided Mol. Des ., 16 , 311–323.
53. Kukol, A. (ed.) (2008). Molecular Modeling of Proteins . Humana Press, Totowa, NJ.
54. An, J., Totrov, M., Abagyan, R. (2005). Pocketome via comprehensive identificationand classification of ligand binding envelopes. Mol. Cell. Proteom ., 4 , 752–761.

38 TARGET PROFILING OF SMALL MOLECULES
55. Henschel, A., Winter, C., Kim, W. K., Schroeder, M. (2007). Using structural motifdescriptors for sequence-based binding site prediction. BMC Bioinformatics , 8(Suppl. 4), S5.
56. Laurie, A. T., Jackson, R. M. (2005). Q-SiteFinder: an energy-based method for theprediction of protein–ligand binding sites. Bioinformatics , 21 , 1908–1916.
57. AutoDock. http://autodock.scripps.edu/.
58. GROMACS. http://www.gromacs.org/.
59. MOE. http://www.chemcomp.com/.
60. Perola, E., Walters, W. P., Charifson, P. S. (2004). A detailed comparison of currentdocking and scoring methods on systems of pharmaceutical relevance. Proteins , 56 ,235–249.
61. Snyder, K. A., Feldman, H. J., Dumontier, M., Salama, J. J., Hogue, C. W. (2006).Domain-based small molecule binding site annotation. BMC Bioinformatics , 7 , 152.
62. Feldman, H. J., Dumontier, M., Ling, S., Haider, N., Hogue, C. W. (2005). CO: achemical ontology for identification of functional groups and semantic comparison ofsmall molecules. FEBS Lett ., 579 , 4685–4691.