protein identification using a nanouhplc-ap-maldi ms/ms...
TRANSCRIPT
Protein identification using a nanoUHPLCAPMALDI MS/MS workflow with CID of multiply charged proteolytic peptides Article
Published Version
Creative Commons: Attribution 4.0 (CCBY)
Open Access
Ryumin, P., Brown, J., Morris, M. and Cramer, R. (2017) Protein identification using a nanoUHPLCAPMALDI MS/MS workflow with CID of multiply charged proteolytic peptides. International Journal of Mass Spectrometry, 416. pp. 2028. ISSN 13873806 doi: https://doi.org/10.1016/j.ijms.2016.12.006 Available at http://centaur.reading.ac.uk/68418/
It is advisable to refer to the publisher’s version if you intend to cite from the work. See Guidance on citing .
To link to this article DOI: http://dx.doi.org/10.1016/j.ijms.2016.12.006
Publisher: Elsevier
All outputs in CentAUR are protected by Intellectual Property Rights law, including copyright law. Copyright and IPR is retained by the creators or other copyright holders. Terms and conditions for use of this material are defined in the End User Agreement .
www.reading.ac.uk/centaur

CentAUR
Central Archive at the University of Reading
Reading’s research outputs online
Pw
Pa
b
a
ARR3AA
KLLABMM
1
(fitMsmtda
wLMtbtw
h1
International Journal of Mass Spectrometry 416 (2017) 20–28
Contents lists available at ScienceDirect
International Journal of Mass Spectrometry
journa l h om epage: ww w.elsev ier .com/ locate / i jms
rotein identification using a nanoUHPLC-AP-MALDI MS/MSorkflow with CID of multiply charged proteolytic peptides
avel Ryumina, Jeffery Browna,b, Michael Morrisb, Rainer Cramera,∗
Department of Chemistry, University of Reading, Whiteknights, Reading, RG6 6AD, UKWaters Corporation, Stamford Avenue, Wilmslow, SK9 4AX, UK
r t i c l e i n f o
rticle history:eceived 14 July 2016eceived in revised form0 November 2016ccepted 2 December 2016vailable online 5 December 2016
a b s t r a c t
Liquid AP-MALDI can produce predominantly multiply charged ESI-like ions and stable durable analyteion yields with samples allowing good shot-to-shot reproducibility and exhibiting self-healing propertiesduring laser irradiation. In this study, LC-MALDI MS/MS workflows that utilize multiply charged ions arereported for the first time and compared with standard LC-ESI MS/MS for bottom-up proteomic analysis.The proposed method is compatible with trifluoroacetic acid as an LC ion pairing reagent and allowsmultiple MS/MS acquisitions of the LC-separated samples without substantial sample consumption. Inaddition, the method facilitates the storage of fully spotted MALDI target plates for months without
eywords:C-MALDIiquid MALDIP-MALDIottom-up proteomicsultiply charged ions
significant sample degradation.© 2016 The Authors. Published by Elsevier B.V. This is an open access article under the CC BY license
(http://creativecommons.org/licenses/by/4.0/).
ALDI-CID MS/MS
. Introduction
Liquid chromatography (LC) coupled with mass spectrometryMS) has become one of the most powerful analytical techniquesor biomolecular studies. The development of electrospray ion-zation (ESI) [1] and the easy coupling of LC with ESI made ithe preferred separation method for high-sensitivity MS analysis.
atrix-assisted laser desorption/ionization (MALDI) MS [2,3] hashown to be a valuable alternative to ESI often providing comple-entary information [4]. Compared to the on-line coupling of LC
o ESI MS, LC is usually performed off-line when coupled to MALDI,epositing LC eluent fractions on a target plate before MALDI MSnalysis [4–8].
Although on-line LC-ESI MS coupling is fast and straightfor-ard, the off-line approach offers certain advantages by decoupling
C separation and MS analysis [9]. Firstly, LC separation andS data acquisition can be independently optimized allowing
he usage of additives in the LC runs which are not compati-
le with MS. Secondly, MS analysis can be performed withoutime constraints, enabling truly data-dependent acquisition (DDA)orkflows. Finally, separated and MS-analyzed samples can be∗ Corresponding author.E-mail address: [email protected] (R. Cramer).
ttp://dx.doi.org/10.1016/j.ijms.2016.12.006387-3806/© 2016 The Authors. Published by Elsevier B.V. This is an open access article u
archived and revisited for subsequent re-analysis. These and otheradvantages have driven the development of various automatedLC eluent fractionation/deposition systems [5,10–15] as well asadvanced off-line MS acquisition workflows [7,9,16–18].
One of the challenges of conventional LC-MALDI coupling arisesfrom the usage of solid crystalline samples for MALDI. Solid MALDIsamples often provide poor sample homogeneity resulting in highion yield variation which complicates the automation of MS dataacquisition. In contrast, liquid MALDI samples not only offer bettersample homogeneity [19,20] but also exhibit self-healing proper-ties eliminating the need to adjust the laser desorption positionduring the acquisition, thus providing a substantially more robustsystem for automation [21,22].
The quality of mass spectral data is another important aspect,in particular for large-scale proteomics. ESI at atmospheric pres-sure (AP) effectively decouples mass measurement from ionization,facilitating hybrid mass spectrometry [23] and expanding the rangeof analytical tools available prior to mass analysis [24]. In contrast,conventional MALDI is typically performed at high vacuum, withthe ion source directly coupled to an axial time-of-flight (TOF) massanalyzer, and the quality of mass spectral data greatly dependson complex ion manipulation and appropriate mass calibration
which often complicates tandem mass spectrometry (MS/MS) andits outcome [7,25]. To alleviate these shortcomings MALDI has beennder the CC BY license (http://creativecommons.org/licenses/by/4.0/).
al of M
ea
if(tmcmtt
Es[fssoptfa
2
2
dfo(aB
2
UQip2WtasAooif
2
w6sde3lp
P. Ryumin et al. / International Journ
mployed at elevated pressures and hyphenated with other massnalyzers [26–32].
Another distinct feature of ESI compared to MALDI is its predom-nantly multiply charged ion yield which has certain advantagesor MS analysis. Firstly, it enables electron-capture dissociationECD) [33] and electron-transfer dissociation (ETD) [34] fragmen-ation techniques capable of preserving labile post-translational
odifications [35]. Secondly, it often improves the quality ofollision-induced dissociation (CID) MS/MS data [36–38]. Thirdly,ultiply charged ions are better suited for ion manipulation and
ransmission in radio frequency ion guides and low-cost mass spec-rometers with a limited m/z range [39].
Recent developments in MALDI MS now allow the production ofSI-like predominantly multiply charged ions at atmospheric pres-ure from both solid [40] and liquid [41] samples at high sensitivity42], thus promising the combination of some of the advantagesrom both MALDI and ESI. However, to our knowledge so far, notudies have been performed applying these methods to large-cale and/or automated proteomic analysis. Here, an initial designf an automated bottom-up proteomic workflow utilizing multi-ly charged ions obtained by liquid AP-MALDI, and its comparisono a conventional LC-ESI MS/MS workflow is described. Areas ofuture development for transforming the described approach into
practical analytical tool are highlighted.
. Materials and methods
.1. Consumables
Acetonitrile (ACN), trifluoroacetic acid (TFA), 2,5-ihydroxybenzoic acid (DHB) and glycerol were purchasedrom Sigma-Aldrich (Gillingham, UK). Formic acid (FA) wasbtained from Greyhound (Birkenhead, UK). HPLC-grade waterH2O) was purchased from Fisher Scientific (Loughborough, UK)nd a tryptic bovine serum albumin (BSA) digest from Proteaiosciences (Morgantown, WV, USA).
.2. UHPLC
LC separation for this study was carried out on a nanoACQUITYPLC (Waters Ltd, Elstree, UK) system with a trap column (nanoAC-UITY UPLC 2G-V/Mtrap 5 �m Symmetry; 20 mm length, 180 �m
nner diameter (i.d.), 5 �m particle size; Waters Ltd) and a reversed-hase analytical column (ACQUITY UPLC Peptide BEH C18; 10k psi,50 mm length, 75 �m i.d., 1.7 �m particle size, 130 Å pore size;aters Ltd). Both FA and TFA were used as LC mobile phase addi-
ives. For the experiments with FA, solvent A was 0.1% FA in H2Ond solvent B was 0.1% FA in ACN. For the experiments with TFA,olvent A was 0.1% TFA in H2O and solvent B was 0.1% TFA in ACN.
volume of 5 �L of a tryptic BSA digest diluted to a concentrationf 1 pmol/�L in 0.1% FA was injected and analyzed using a flow ratef 300 nL/min with the following gradient: 3% B at 0 min, linearlyncreased to 40% B at 30 min, followed by 3 min washing at 85% Brom 32 to 35 min.
.3. MALDI sample deposition
For the LC-MALDI MS experiments, the liquid matrix solutionas prepared by dissolving 25 mg of DHB in 70% ACN and adding
0% of glycerol by volume. A volume of 0.5 �L of this solution waspotted onto each sample position of a MALDI target plate and leftrying at room temperature for 30 min. Subsequently, the UHPLC
luents were collected on top of the pre-spotted liquid matrices in0-s fractions (150 nL) by manual submerging the LC outlet capil-ary into the pre-spotted matrix droplet. A total of 60 fractions wererepared for each LC run. Finally, 0.5 �L of a 10-�M bradykinin
ass Spectrometry 416 (2017) 20–28 21
solution was spotted to one of the remaining sample wells withpre-spotted liquid matrix for mass measurement accuracy checks.All MALDI samples remained liquid over the entire timespan of theexperiment.
2.4. MALDI MS
For all MALDI MS experiments a Synapt G2-Si mass spec-trometer (Waters Corporation, Wilmslow, UK) was employed. Anin-house developed AP-MALDI ion source described in detail else-where [42] was optimized for the generation of multiply chargedions from liquid MALDI samples (see Fig. 1). Briefly, a commer-cial ESI source (Waters) for the Synapt G2-Si mass spectrometerwas modified to accommodate a standard Waters MALDI targetplate mounted on a PC-controllable XY-translational stage (ZaberT-LSM050A; Laser2000, Huntingdon, UK). The ion source’s AP-to-vacuum interface was equipped with an additional resistivelyheated ion transfer tube in front of the vacuum inlet with a control-lable gas flow regime which was operated at 25 W heating powerand 180 L/h counter flow (∼350 ◦C ion transfer tube wall temper-ature). The distance between the ion transfer tube and the MALDItarget plate was 3 mm, and a 4 kV potential was applied to the tar-get plate. A pulsed nitrogen laser (MNL 103 LD; LTB LasertechnikGmbH, Berlin, Germany) with a pulse duration of 3 ns and a wave-length of 337 nm was used to irradiate the sample. The laser wasoperated at a repetition rate of 30 Hz and focused to a spot sizediameter of ∼150 �m with the laser pulse energy attenuated to30 �J. Please note that local H&S requirements, e.g. regarding lasersafety and risk assessments, have to be satisfied as it was the casefor this study.
MALDI MS data were acquired in ESI MS mode with ion mobilityseparation (IMS) enabled. The instrument settings controlling thenitrogen gas flow in the IMS cell, helium gas flow in the heliumcell and argon gas flow in the trap cell were set to 90 mL/min,180 mL/min and 2 mL/min, respectively. The drift time in the IMScell was recorded with the ‘IMS Wave Velocity’ set to 650 m/s and‘IMS Wave Height’ set to 40.0 V. A standard ESI MS survey method(‘Mobility Fast DDA’) was adapted for automated data acquisition.The MS survey scan duration was set to 1 s with a signal intensityabove 100 triggering subsequent MS/MS acquisitions of 5 s. CID wascarried out after IMS separation in a transfer cell using a collisionenergy ramp with the following settings: LM CE ramp start = 30,LM CE ramp End = 40, HM CE ramp start = 40, HM CE ramp End = 55.Singly charged ions were eliminated from the precursor ion selec-tion list. The m/z data acquisition range was set to 100–2000.
For controlling the MALDI target plate XY stage movement,a Waters Research Enabled Software (WREnS; Waters Corpora-tion) compatible script was developed. Prior to the start of the MSdata acquisition the laser focus was positioned on the first sampleand the laser was turned on. Within seconds MS data acquisitionwas manually started, which automatically triggered the targetplate movement allowing consecutive stationary irradiation of eachMALDI sample for 60 s before automatically moving to the nextsample. Between each sample the XY stage moved the target plateto a blank sample spot for 5 s.
2.5. LC-ESI MS
For the comparative LC-ESI MS experiments the nanoUHPLC sys-tem was coupled to the Synapt G2-Si mass spectrometer usingthe Universal Nano Flow Sprayer (Waters) with a PicoTip emit-ter (20 �m; New Objective, Woburn, MA). IMS separation for these
experiments was turned off. Similar to the MALDI MS data acquisi-tion, a fast DDA method was used for the ESI MS data acquisition.The MS survey scan duration was set to 0.2 s with a signal inten-sity above 5000 triggering subsequent MS/MS acquisitions. The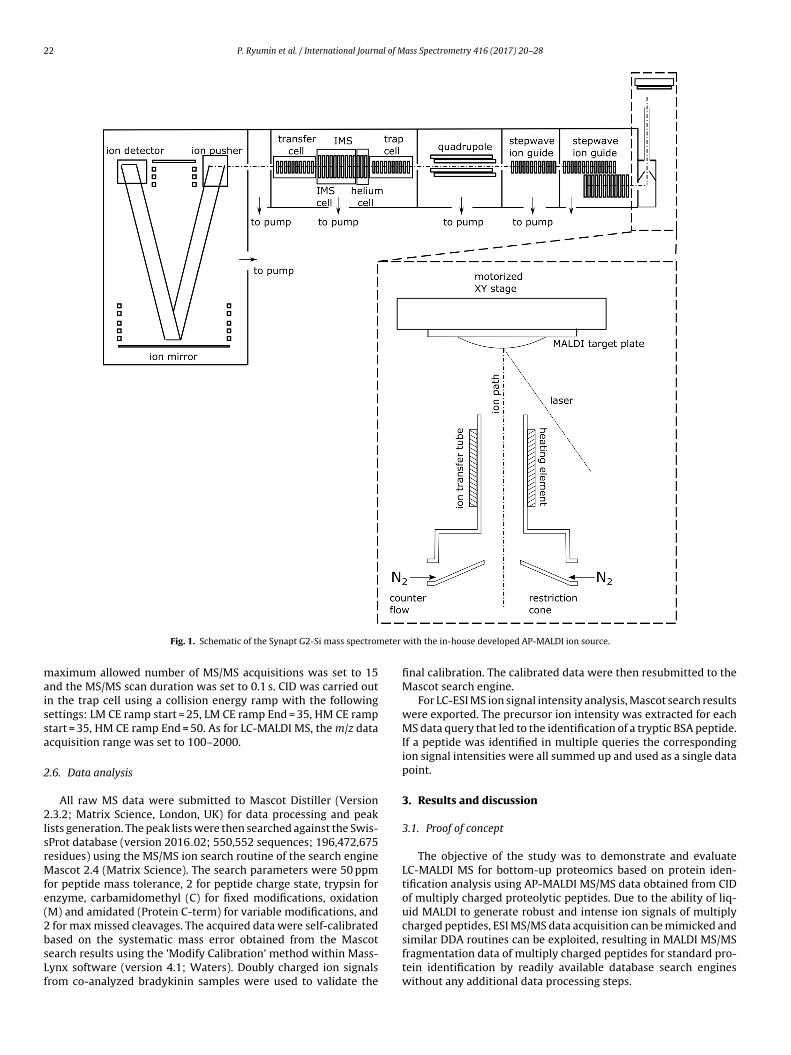
22 P. Ryumin et al. / International Journal of Mass Spectrometry 416 (2017) 20–28
eter
maissa
2
2lsrMfe(2bsLf
Fig. 1. Schematic of the Synapt G2-Si mass spectrom
aximum allowed number of MS/MS acquisitions was set to 15nd the MS/MS scan duration was set to 0.1 s. CID was carried outn the trap cell using a collision energy ramp with the followingettings: LM CE ramp start = 25, LM CE ramp End = 35, HM CE ramptart = 35, HM CE ramp End = 50. As for LC-MALDI MS, the m/z datacquisition range was set to 100–2000.
.6. Data analysis
All raw MS data were submitted to Mascot Distiller (Version.3.2; Matrix Science, London, UK) for data processing and peak
ists generation. The peak lists were then searched against the Swis-Prot database (version 2016 02; 550,552 sequences; 196,472,675esidues) using the MS/MS ion search routine of the search engineascot 2.4 (Matrix Science). The search parameters were 50 ppm
or peptide mass tolerance, 2 for peptide charge state, trypsin fornzyme, carbamidomethyl (C) for fixed modifications, oxidationM) and amidated (Protein C-term) for variable modifications, and
for max missed cleavages. The acquired data were self-calibrated
ased on the systematic mass error obtained from the Mascotearch results using the ’Modify Calibration’ method within Mass-ynx software (version 4.1; Waters). Doubly charged ion signalsrom co-analyzed bradykinin samples were used to validate thewith the in-house developed AP-MALDI ion source.
final calibration. The calibrated data were then resubmitted to theMascot search engine.
For LC-ESI MS ion signal intensity analysis, Mascot search resultswere exported. The precursor ion intensity was extracted for eachMS data query that led to the identification of a tryptic BSA peptide.If a peptide was identified in multiple queries the correspondingion signal intensities were all summed up and used as a single datapoint.
3. Results and discussion
3.1. Proof of concept
The objective of the study was to demonstrate and evaluateLC-MALDI MS for bottom-up proteomics based on protein iden-tification analysis using AP-MALDI MS/MS data obtained from CIDof multiply charged proteolytic peptides. Due to the ability of liq-uid MALDI to generate robust and intense ion signals of multiplycharged peptides, ESI MS/MS data acquisition can be mimicked and
similar DDA routines can be exploited, resulting in MALDI MS/MSfragmentation data of multiply charged peptides for standard pro-tein identification by readily available database search engineswithout any additional data processing steps.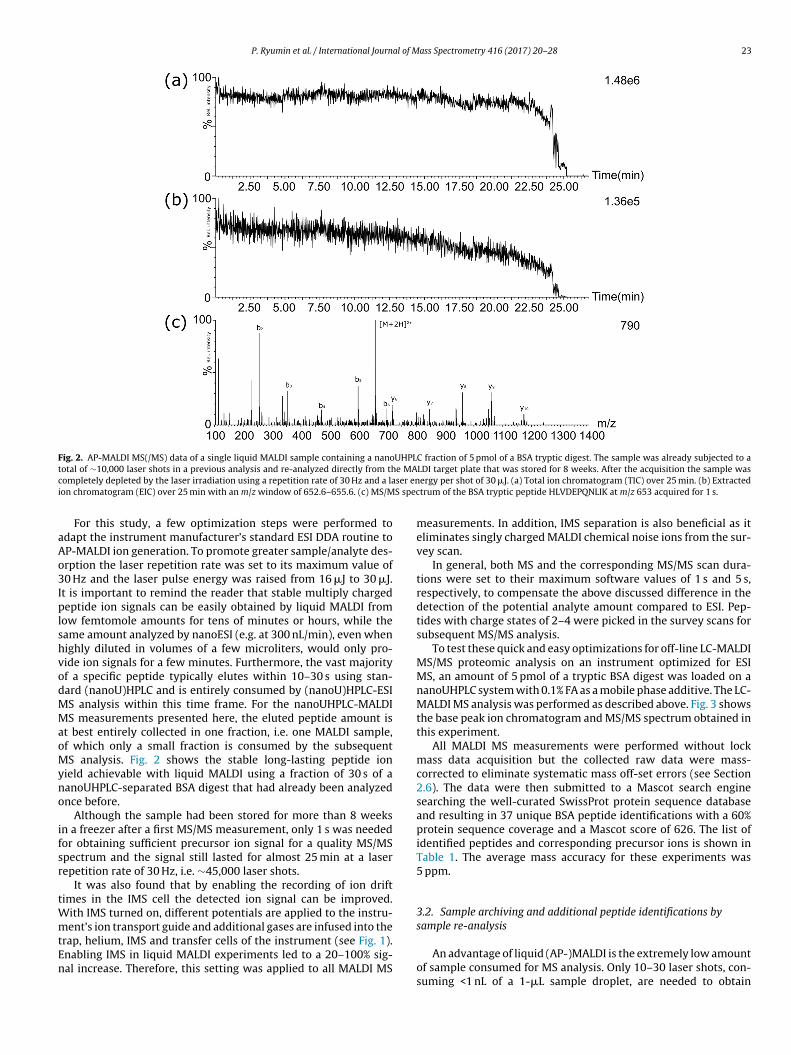
P. Ryumin et al. / International Journal of Mass Spectrometry 416 (2017) 20–28 23
Fig. 2. AP-MALDI MS(/MS) data of a single liquid MALDI sample containing a nanoUHPLC fraction of 5 pmol of a BSA tryptic digest. The sample was already subjected to at e MAc ser eni S spec
aAo3IplshvodMMaoMyno
ifsr
tWmtEn
otal of ∼10,000 laser shots in a previous analysis and re-analyzed directly from thompletely depleted by the laser irradiation using a repetition rate of 30 Hz and a laon chromatogram (EIC) over 25 min with an m/z window of 652.6–655.6. (c) MS/M
For this study, a few optimization steps were performed todapt the instrument manufacturer’s standard ESI DDA routine toP-MALDI ion generation. To promote greater sample/analyte des-rption the laser repetition rate was set to its maximum value of0 Hz and the laser pulse energy was raised from 16 �J to 30 �J.t is important to remind the reader that stable multiply chargedeptide ion signals can be easily obtained by liquid MALDI from
ow femtomole amounts for tens of minutes or hours, while theame amount analyzed by nanoESI (e.g. at 300 nL/min), even whenighly diluted in volumes of a few microliters, would only pro-ide ion signals for a few minutes. Furthermore, the vast majorityf a specific peptide typically elutes within 10–30 s using stan-ard (nanoU)HPLC and is entirely consumed by (nanoU)HPLC-ESIS analysis within this time frame. For the nanoUHPLC-MALDIS measurements presented here, the eluted peptide amount is
t best entirely collected in one fraction, i.e. one MALDI sample,f which only a small fraction is consumed by the subsequentS analysis. Fig. 2 shows the stable long-lasting peptide ion
ield achievable with liquid MALDI using a fraction of 30 s of aanoUHPLC-separated BSA digest that had already been analyzednce before.
Although the sample had been stored for more than 8 weeksn a freezer after a first MS/MS measurement, only 1 s was neededor obtaining sufficient precursor ion signal for a quality MS/MSpectrum and the signal still lasted for almost 25 min at a laserepetition rate of 30 Hz, i.e. ∼45,000 laser shots.
It was also found that by enabling the recording of ion driftimes in the IMS cell the detected ion signal can be improved.
ith IMS turned on, different potentials are applied to the instru-ent’s ion transport guide and additional gases are infused into the
rap, helium, IMS and transfer cells of the instrument (see Fig. 1).nabling IMS in liquid MALDI experiments led to a 20–100% sig-al increase. Therefore, this setting was applied to all MALDI MS
LDI target plate that was stored for 8 weeks. After the acquisition the sample wasergy per shot of 30 �J. (a) Total ion chromatogram (TIC) over 25 min. (b) Extractedtrum of the BSA tryptic peptide HLVDEPQNLIK at m/z 653 acquired for 1 s.
measurements. In addition, IMS separation is also beneficial as iteliminates singly charged MALDI chemical noise ions from the sur-vey scan.
In general, both MS and the corresponding MS/MS scan dura-tions were set to their maximum software values of 1 s and 5 s,respectively, to compensate the above discussed difference in thedetection of the potential analyte amount compared to ESI. Pep-tides with charge states of 2–4 were picked in the survey scans forsubsequent MS/MS analysis.
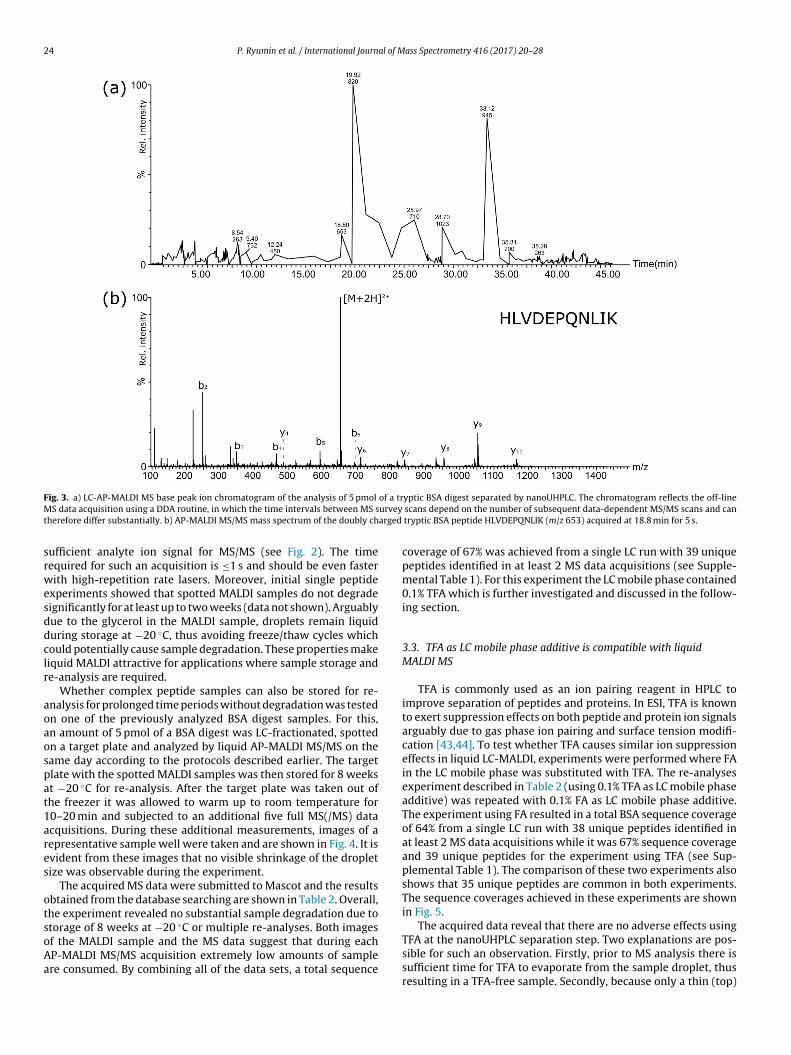
To test these quick and easy optimizations for off-line LC-MALDIMS/MS proteomic analysis on an instrument optimized for ESIMS, an amount of 5 pmol of a tryptic BSA digest was loaded on ananoUHPLC system with 0.1% FA as a mobile phase additive. The LC-MALDI MS analysis was performed as described above. Fig. 3 showsthe base peak ion chromatogram and MS/MS spectrum obtained inthis experiment.
All MALDI MS measurements were performed without lockmass data acquisition but the collected raw data were mass-corrected to eliminate systematic mass off-set errors (see Section2.6). The data were then submitted to a Mascot search enginesearching the well-curated SwissProt protein sequence databaseand resulting in 37 unique BSA peptide identifications with a 60%protein sequence coverage and a Mascot score of 626. The list ofidentified peptides and corresponding precursor ions is shown inTable 1. The average mass accuracy for these experiments was5 ppm.
3.2. Sample archiving and additional peptide identifications bysample re-analysis
An advantage of liquid (AP-)MALDI is the extremely low amountof sample consumed for MS analysis. Only 10–30 laser shots, con-suming <1 nL of a 1-�L sample droplet, are needed to obtain
24 P. Ryumin et al. / International Journal of Mass Spectrometry 416 (2017) 20–28
F of a trM urveyt arged
srwesddclr
aoaospat1ares
otsoAa
ig. 3. a) LC-AP-MALDI MS base peak ion chromatogram of the analysis of 5 pmol
S data acquisition using a DDA routine, in which the time intervals between MS sherefore differ substantially. b) AP-MALDI MS/MS mass spectrum of the doubly ch
ufficient analyte ion signal for MS/MS (see Fig. 2). The timeequired for such an acquisition is ≤1 s and should be even fasterith high-repetition rate lasers. Moreover, initial single peptide
xperiments showed that spotted MALDI samples do not degradeignificantly for at least up to two weeks (data not shown). Arguablyue to the glycerol in the MALDI sample, droplets remain liquiduring storage at −20 ◦C, thus avoiding freeze/thaw cycles whichould potentially cause sample degradation. These properties makeiquid MALDI attractive for applications where sample storage ande-analysis are required.
Whether complex peptide samples can also be stored for re-nalysis for prolonged time periods without degradation was testedn one of the previously analyzed BSA digest samples. For this,n amount of 5 pmol of a BSA digest was LC-fractionated, spottedn a target plate and analyzed by liquid AP-MALDI MS/MS on theame day according to the protocols described earlier. The targetlate with the spotted MALDI samples was then stored for 8 weekst −20 ◦C for re-analysis. After the target plate was taken out ofhe freezer it was allowed to warm up to room temperature for0–20 min and subjected to an additional five full MS(/MS) datacquisitions. During these additional measurements, images of aepresentative sample well were taken and are shown in Fig. 4. It isvident from these images that no visible shrinkage of the dropletize was observable during the experiment.
The acquired MS data were submitted to Mascot and the resultsbtained from the database searching are shown in Table 2. Overall,he experiment revealed no substantial sample degradation due totorage of 8 weeks at −20 ◦C or multiple re-analyses. Both images
f the MALDI sample and the MS data suggest that during eachP-MALDI MS/MS acquisition extremely low amounts of samplere consumed. By combining all of the data sets, a total sequenceyptic BSA digest separated by nanoUHPLC. The chromatogram reflects the off-line scans depend on the number of subsequent data-dependent MS/MS scans and can
tryptic BSA peptide HLVDEPQNLIK (m/z 653) acquired at 18.8 min for 5 s.
coverage of 67% was achieved from a single LC run with 39 uniquepeptides identified in at least 2 MS data acquisitions (see Supple-mental Table 1). For this experiment the LC mobile phase contained0.1% TFA which is further investigated and discussed in the follow-ing section.
3.3. TFA as LC mobile phase additive is compatible with liquidMALDI MS
TFA is commonly used as an ion pairing reagent in HPLC toimprove separation of peptides and proteins. In ESI, TFA is knownto exert suppression effects on both peptide and protein ion signalsarguably due to gas phase ion pairing and surface tension modifi-cation [43,44]. To test whether TFA causes similar ion suppressioneffects in liquid LC-MALDI, experiments were performed where FAin the LC mobile phase was substituted with TFA. The re-analysesexperiment described in Table 2 (using 0.1% TFA as LC mobile phaseadditive) was repeated with 0.1% FA as LC mobile phase additive.The experiment using FA resulted in a total BSA sequence coverageof 64% from a single LC run with 38 unique peptides identified inat least 2 MS data acquisitions while it was 67% sequence coverageand 39 unique peptides for the experiment using TFA (see Sup-plemental Table 1). The comparison of these two experiments alsoshows that 35 unique peptides are common in both experiments.The sequence coverages achieved in these experiments are shownin Fig. 5.
The acquired data reveal that there are no adverse effects using
TFA at the nanoUHPLC separation step. Two explanations are pos-sible for such an observation. Firstly, prior to MS analysis there issufficient time for TFA to evaporate from the sample droplet, thusresulting in a TFA-free sample. Secondly, because only a thin (top)
P. Ryumin et al. / International Journal of Mass Spectrometry 416 (2017) 20–28 25
Table 1List of BSA peptides identified in a single LC-AP-MALDI MS/MS experiment based on multiply charged precursor ionsa.
Observed m/z Mass accuracy (ppm) Charge state Assigned peptide sequence Score
625.3158 2.62 2 FKDLGEEHFK 35582.3239 8.58 2 LVNELTEFAK 61732.2951 −4.17 2 TCVADESHAGCEK 66710.3494 −1.53 2 SLHTLFGDELCK 59517.7398 −0.073 2 NECFLSHK 25634.6274 −1.08 3 NECFLSHKDDSPDLPK 13788.8845 −3.77 2 LKPDPNTLCDEFK 16464.2555 11.1 2 YLYEIAR 231023.0143 −3.22 2 RHPYFYAPELLYYANK 7682.3511 5.35 3 RHPYFYAPELLYYANK 17944.9657 −1.41 2 HPYFYAPELLYYANK 85874.3507 −6.26 2 YNGVFQECCQAEDK 51379.7203 13.7 2 GACLLPK 7461.7500 5.11 2 AEFVEVTK 15395.2427 8.21 2 LVTDLTK 11875.3266 −9.48 2 ECCHGDLLECADDR 10722.3243 −0.46 2 YICDNQDTISSK 65766.8898 −5.77 2 LKECCDKPLLEK 27646.3018 −4.37 2 ECCDKPLLEK 12878.6723 −1.25 4 SHCIAEVEKDAIPENLPPLTADFAEDKDVCK 24820.0625 −3.07 3 DAIPENLPPLTADFAEDKDVCK 9720.4090 −0.74 2 RHPEYAVSVLLR 35480.6094 1.25 2 RHPEYAVSVLLR 20642.3602 1.98 2 HPEYAVSVLLR 64751.8116 1.50 2 EYEATLEECCAK 54777.8296 −0.62 2 DDPHACYSTVFDK 25653.3632 2.36 2 HLVDEPQNLIK 59740.4035 2.85 2 LGEYGFQNALIVR 74820.4689 −4.41 2 KVPQVSTPTLVEVSR 84756.4206 −5.85 2 VPQVSTPTLVEVSR 43449.7448 0.84 2 LCVLHEK 4569.7560 6.02 2 CCTESLVNR 47940.9591 −5.38 2 RPCFSALTPDETYVPK 29627.6467 2.42 3 RPCFSALTPDETYVPK 12954.4651 1.12 2 LFTFHADICTLPDTEK 4571.8631 4.03 2 KQTALVELLK 36507.8166 6.52 2 QTALVELLK 53700.3503 0.44 2 TVMENFVAFVDK 57708.3576 14.4 2 TVMENFVAFVDK + Oxidation 41643.2731 3.43 3 CCAADDKEACFAVEGPK 1554.2620 2.54 2 EACFAVEGPK 27
) dataw
lsaTtapAbawsgp
3
MDss7Mo
one order of magnitude lower, there is great potential to improveits sensitivity for proteomic workflows substantially. Fig. 7 showsthat the difference in ESI signal intensity for the peptides detectedby both methods compared to the ones detected only by ESI MS
Table 2Database search results of AP-MALDI MS/MS re-analyses of the same liquid MALDIsamples of an LC-fractionated BSA digest (5 pmol).
MS acquisitionnumber
Storage timeat −20 ◦C
Number ofunique peptidesidentified
BSA sequencecoverage (%)
Mascotscore
1 none 37 57 7612 8 weeks 37 58 1181
a The data were obtained from SwissProt database searching of the raw MS(/MSith 0.1% FA in the mobile phase.
ayer of the sample droplet is desorbed, possible electrophoreticeparation of the TFA anions from the peptide cations caused by thepplied voltage potential prevents their simultaneous desorption.he former has been confirmed by acquiring AP-MALDI mass spec-ra in negative ion mode using the same MALDI matrix and 0.2% TFAs analyte solution. Spectra were recorded immediately after sam-le spotting and after 30 min of sample drying at ambient pressure.fter drying, the TFA deprotonated anion signal intensity droppedy ∼70%. Interestingly, TFA evaporation from a sample droplet canlso be registered by irradiating a TFA-free adjacent sample dropletithout irradiating the TFA-containing sample droplet. It can be
peculated that the TFA anions are produced by evaporation andas-phase proton transfer or a secondary electrospray ionizationrocess of fused aerosols [45].
.4. Comparison to LC-ESI MS
In a final comparison, the same BSA digest analyzed by LC-ALDI MS/MS was also analyzed using a standard LC-ESI MS/MSDA workflow with 0.1% FA in the LC mobile phase and no IMS
eparation. Here, IMS was switched off due to concerns of detector
aturation. This resulted in 66 unique peptide identifications and7% sequence coverage. All peptides identified by liquid AP-MALDIS coupled to off-line nanoHPLC separation were also found in then-line LC-ESI MS data (see Supplemental Table 1). The difference
acquired from 5 pmol of a tryptic BSA digest that was factionated by nanoUHPLC
in sequence coverage obtained by LC-MALDI MS and LC-ESI MS isshown in Fig. 6.
In general, the comparison between the off-line LC-MALDI andon-line LC-ESI analyses shows that the MALDI-generated peptidesare also found in ESI MS. There is currently a lower number oftryptic peptides detected by MALDI MS. However, as a commer-cial instrument optimized for ESI data acquisition was employedfor the measurements, and more importantly, only little advantagewas taken from the fact that the sample consumption is roughly
3 8 weeks 38 61 9654 8 weeks 37 59 11775 8 weeks 37 59 10846 8 weeks 35 56 923

26 P. Ryumin et al. / International Journal of Mass Spectrometry 416 (2017) 20–28
Fig. 4. Images of the same liquid MALDI sample taken during a set of 5 consecutive AP-MALDI MS/MS data acquisitions. Image (a) was taken before the first measurement,images (b–f) were taken after each AP-MALDI MS/MS data acquisition. During each of these measurements the sample was irradiated for 60 s with a laser repetition rate setto 30 Hz and a laser pulse energy of 30 �J.
Fig. 5. BSA sequence coverage obtained by two sets of LC-AP-MALDI MS/MS analyses of 5 pmol of a tryptic digest using FA and TFA, respectively, in the LC mobile phase.S isitionL dentifia
iwiATefsdM
equences in bold were identified in both experiments in at least two MS/(MS) acquC mobile phase in at least two MS/(MS) acquisitions. Underlined sequences were icquisitions.
s around one order of magnitude. These data are in agreementith the hypothesis that liquid AP-MALDI and ESI share the same
onization mechanism but the current limits of detection in liquidP-MALDI MS result in a smaller number of identified peptides.hus, relatively simple changes such as a higher laser shot rep-tition rate, optimized off-line collection of possibly smaller LC
ractions and the introduction of droplet shrinkage, leading tomaller samples but higher analyte concentration as previouslyemonstrated [21], should all improve the detection limits in futureS-based proteomic workflows using liquid MALDI.s. Sequences in italics were exclusively identified in the experiment with TFA in theed only in the experiment with FA in the LC mobile phase in at least two MS(/MS)
Data supporting the results reported in this paper are openlyavailable from the University of Reading Research Data Archive athttp://dx.doi.org/10.17864/1947.74
4. Conclusions
This is the first time that off-line LC coupled to (liquid) AP-MALDIhas been shown to allow protein identification based entirely on theMS/MS analysis of multiply charged precursor ions. Simple adapta-tions of a standard ESI-based bottom-up proteomic workflow have

P. Ryumin et al. / International Journal of Mass Spectrometry 416 (2017) 20–28 27
Fig. 6. BSA sequence coverage obtained by nanoUHPLC-ESI and LC-MALDI MS analysis of 5 pmol of a tryptic digest using FA and TFA, respectively, as mobile phase additive.Sequences in bold were identified in both analyses. Sequences in italics were identified only by nanoUHPLC-ESI MS.
F d into
laoaAlait
A
sh
ig. 7. LC-ESI MS ion signal intensity of the BSA-matched unique peptides separate
ed to comparable though slightly lower protein sequence cover-ges but at vastly lower sample consumption when compared ton-line LC-ESI MS(/MS). In contrast to ESI MS, the usage of TFA asn LC ion pairing reagent does not cause adverse effects in liquidP-MALDI MS. Furthermore, the MALDI target plate with spotted
iquid samples could be stored after analysis for weeks withoutnalyte ion or sample degradation. Further optimization areas formproving the method’s current performance, in particular detec-ion limits, have been identified and discussed.
cknowledgements
The authors thank Emmy Hoyes of Waters Corporation (Wilm-low, UK) for her help with WREnS and Franz Hillenkamp foris support and mentorship. This work was supported by the
two classes according to their detection in a comparative LC-MALDI MS analysis.
EPSRC through grant EP/L006227/1, on which Franz Hillenkampis a named collaborator.
Appendix A. Supplementary data
Supplementary data associated with this article can be found, inthe online version, at http://dx.doi.org/10.1016/j.ijms.2016.12.006.
References
[1] J.B. Fenn, M. Mann, C.K. Meng, S.F. Wong, Whitehouse C.M. Sci. 246 (1989)64–71.
[2] M. Karas, D. Bachmann, F. Hillenkamp, Int. J. Mass Spectrom. Ion Processes 78(1987) 53–68.
[3] M. Karas, F. Hillenkamp, Anal. Chem. 60 (1988) 2299–2301.

2 al of M
[
[
[[
[
[
[
[
[[
[[[[[
[[
[
[[
[
[[
[
[
[
[[
[
[[
[
[42] P. Ryumin, J. Brown, M. Morris, R. Cramer, Methods 104 (2016) 11–20.
8 P. Ryumin et al. / International Journ
[4] W.M. Bodnar, R.K. Blackburn, J.M. Krise, M.A. Moseley, J. Am. Soc. MassSpectrom. 14 (2003) 971–979.
[5] E. Mirgorodskaya, C. Braeuer, P. Fucini, H. Lehrach, J. Gobom, Proteomics 5(2005) 399–408.
[6] F. Pereira, X. Niu, A. deMello, J. PLoS One 8 (2013) e63087.[7] K. Wiangnon, R. Cramer, J. Proteome Res. 15 (2016) 2998–3008.[8] D.B. Wall, S.J. Berger, J.W. Finch, S.A. Cohen, K. Richardson, R. Chapman, D.
Drabble, J. Brown, D. Gostick, Electrophoresis 23 (2002) 3193–3204.[9] T. Chen H.-s. Rejtar, V. Andreev, E. Moskovets, B.L. Karger, Anal. Chem. 77
(2005) 2323–2331.10] T.N. Corso, C.K. Van Pelt, J. Li, C. Ptak, X. Huang, Anal. Chem. 78 (2006)
2209–2219.11] D. Patterson, R. van Soest, M. van Gils, H. Schwartz, R. Swart, I. Dragan, J.P.
Chervet, J. Assoc. Lab. Autom. 8 (2003) 34–35.12] J.B. Young, L. Li, Anal. Chem. 79 (2007) 5927–5934.13] C. Ericson, Q.T. Phung, D.M. Horn, E.C. Peters, J.R. Fitchett, S.B. Ficarro, A.R.
Salomon, L.M. Brill, A. Brock, Anal. Chem. 75 (2003) 2309–2315.14] J. Kool, G. de Kloe, A.D. Denker, K. van Altena, M. Smoluch, D. van Iperen, T.T.
Nahar, R.J. Limburg, W.M.A. Niessen, H. Lingeman, R. Leurs, I.J.P. de Esch, A.B.Smit, H. Irth, Anal. Chem. 83 (2011) 125–132.
15] S.K. Küster, M. Pabst, K. Jefimovs, R. Zenobi, P.S. Dittrich, Anal. Chem. 86(2014) 4848–4855.
16] H. Liu, L. Yang, N. Khainovski, M. Dong, S.C. Hall, S.J. Fisher, M.D. Biggin, J. Jin,H.E. Witkowska, Anal. Chem. 83 (2011) 6286–6293.
17] A. Zerck, E. Nordhoff, A. Resemann, E. Mirgorodskaya, D. Suckau, K. Reinert, H.Lehrach, J. Gobom, J. Proteome Res. 8 (2009) 3239–3251.
18] A. Zerck, E. Nordhoff, H. Lehrach, K. Reinert, BMC Bioinf. 14 (2013) 1–14.19] M.W. Towers, J.E. McKendrick, R. Cramer, J. Proteome Res. 9 (2010)
1931–1940.20] R. Cramer, M. Karas, T.W. Jaskolla, Anal. Chem. 86 (2014) 744–751.
21] R. Cramer, S. Corless, Proteomics 5 (2005) 360–370.22] M. Palmblad, R. Cramer, J. Am. Soc. Mass Spectrom. 18 (2007) 693–697.23] G.L. Glish, D.J. Burinsky, J. Am. Soc. Mass Spectrom. 19 (2011) 161–172.24] A.B. Kanu, P. Dwivedi, M. Tam, L. Matz, H.H. Hill, J. Mass Spectrom. 43 (2008)1–22.
[
[[
ass Spectrometry 416 (2017) 20–28
25] A.J. Hoteling, K.G. Owens, J. Am. Soc. Mass Spectrom. 15 (2004) 523–535.26] P.B. O’Connor, C.E. Costello, Rapid Commun. Mass Spectrom. 15 (2001)
1862–1868.27] P.B. O’Connor, E. Mirgorodskaya, C.E. Costello, J. Am. Soc. Mass Spectrom. 13
(2002) 402–407.28] V.V. Laiko, M.A. Baldwin, A.L. Burlingame, Anal. Chem. 72 (2000) 652–657.29] A.V. Loboda, A.N. Krutchinsky, M. Bromirski, W. Ens, K.G. Standing, Rapid
Commun. Mass Spectrom. 14 (2000) 1047–1057.30] K.F. Medzihradszky, J.M. Campbell, M.A. Baldwin, A.M. Falick, P. Juhasz, M.L.
Vestal, A.L. Burlingame, Anal. Chem. 72 (2000) 552–558.31] J. Qin, B.T. Chait, Anal. Chem. 68 (1996) 2108–2112.32] A.N. Krutchinsky, A.V. Loboda, V.L. Spicer, R. Dworschak, W. Ens, K.G.
Standing, Rapid Commun. Mass Spectrom. 12 (1998) 508–518.33] R.A. Zubarev, N.L. Kelleher, F.W. McLafferty, J. Am. Chem. Soc. 120 (1998)
3265–3266.34] J.E.P. Syka, J.J. Coon, M.J. Schroeder, J. Shabanowitz, D.F. Hunt, Proc. Natl. Acad.
Sci. U. S. A. 101 (2004) 9528–9533.35] F. Kjeldsen, K.F. Haselmann, B.A. Budnik, E.S. Sørensen, R.A. Zubarev, Anal.
Chem. 75 (2003) 2355–2361.36] R. Cramer, S. Corless, Rapid Commun. Mass Spectrom. 15 (2001) 2058–2066.37] Y. Huang, J.M. Triscari, G.C. Tseng, L. Pasa-Tolic, M.S. Lipton, R.D. Smith, V.H.
Wysocki, Anal. Chem. 77 (2005) 5800–5813.38] D.M. Good, M. Wirtala, G.C. McAlister, J.J. Coon, Mol. Cell. Proteomics 6 (2007)
1942–1951.39] D.J. Douglas, Mass Spectrom. Rev. 28 (2009) 937–960.40] S. Trimpin, E.D. Inutan, T.N. Herath, C.N. McEwen, Mol. Cell. Proteomics 9
(2010) 362–367.41] R. Cramer, A. Pirkl, F. Hillenkamp, K. Dreisewerd, Angew. Chem. Int. Ed. 52
(2013) 2364–2367.
43] A. Apffel, S. Fischer, G. Goldberg, P.C. Goodley, F.E. Kuhlmann, J. Chromatogr. A712 (1995) 177–190.
44] W.Z. Shou, W. Naidong, J. Chromatogr. B 825 (2005) 186–192.45] C. Wu, W.F. Siems, H.H. Hill, Anal. Chem. 72 (2000) 396–403.