protein concentration in milk formula, growth, and …jn.nutrition.org/content/146/3/551.full.pdfthe...
TRANSCRIPT

The Journal of Nutrition
Nutrition and Disease
Protein Concentration in Milk Formula, Growth,and Later Risk of Obesity: A SystematicReview1–3
Bernadeta Patro-Go1ab,4* Bart1omiej M Zalewski,4 Stefanie MP Kouwenhoven,5 Jacek Karas,4
Berthold Koletzko,6 Johannes Bernard van Goudoever,5,7 and Hania Szajewska4
4Department of Pediatrics, The Medical University of Warsaw, Warsaw, Poland; 5Department of Pediatrics, VU University Medical
Center, Amsterdam, Netherlands; 6Ludwig Maximilians University, Dr. von Hauner Children�s Hospital, Division of Metabolic and
Nutritional Medicine, University of Munich Medical Centre, Munich, Germany; and 7Department of Pediatrics, Emma Children�sHospital, Amsterdam Medical Center, Amsterdam, Netherlands
Abstract
Background: Protein intake may influence important health outcomes in later life.
Objective: The objective of this study was to investigate current evidence on the effects of infant formulas and follow-on
formulas with different protein concentrations on infants� and children�s growth, body composition, and later risk of
overweight and obesity.
Methods: In this systematic review, we searched electronic databases (including MEDLINE, Embase, and the Cochrane
Library) up until November 2014 for randomized controlled trials (RCTs). Eligible studies had to include children aged 0–3 y
who represented the general population and were fed cow milk–based infant formulas with variations in protein
concentration. Control groups received lower-protein cow milk–based formulas (as defined by the authors). The primary
outcomeswere growth, overweight, obesity, and adiposity. Various time points for outcomes assessment were accepted
for inclusion. If possible, a meta-analysis was performed.
Results: Twelve RCTsmet our inclusion criteria. Different formula protein concentrations did not affect linear growth other
than a transient effect on mean length at 3 mo observed in a meta-analysis of 4 studies (mean difference, – 0.27 cm; 95%
CI: 20.52, 20.02). Lower mean weight and weight z scores obtained from the infants fed lower-protein formulas were
observed only from 6 to 12mo of age. Data from one large RCT showed that consumption of a lower-protein infant formula
may reduce bodymass index at 12mo of age and later (12mo, 24mo, and 6y) and the risk of obesity at 6 y. Effects on body
composition remained unclear.
Conclusions: The current evidence is insufficient for assessing the effects of reducing the protein concentration in infant
formulas on long-term outcomes, but, if confirmed, this could be a promising intervention for reducing the risk of
overweight and obesity in children. In view of the limited available evidence, more studies replicating effects on long-term
health outcomes are needed. J Nutr 2016;146:551–64.
Keywords: RCT, systematic review, infant nutrition, pediatrics, protein
Introduction
Overweight and obesity are among the most serious publichealth challenges. The effectiveness of different treatment
modalities is limited, and, thus, interest in the identification of
modifiable risk and protective factors is growing. One of these
includes research on the potential role of infant feeding on body
composition and the likelihood of being overweight or obese in
later life.Sufficient protein intake early in life is of major importance.
Deficient protein intake can lead to suboptimal growth and
impaired neurodevelopment (1). However, protein intake that is
too high may have adverse effects as well. It has been
documented that rapid weight gain in infancy is associated
with an increased chance of later obesity (2), and weight gainfrom birth to 24 mo is the best overall predictor of lateroverweight (3). High early protein intake in excess of metabolicrequirements may stimulate the secretion of insulin and insulin-like growth factor I (4), thereby enhancing weight gain ininfancy and increasing the later risk of obesity. This is known asthe early protein hypothesis (5), and it is based on earlyobservations by Rolland-Cachera et al. (6). These investigatorsrelated a high protein intake during early childhood to modifiedendocrine responses and an increased risk of obesity at schoolage. The mechanisms by which increased protein intake affectsweight gain and body composition are not yet completely clear.However, the endocrine and metabolic responses of infants are
ã 2016 American Society for Nutrition.
Manuscript received September 8, 2015. Initial review completed October 20, 2015. Revision accepted January 8, 2016. 551First published online February 10, 2016; doi:10.3945/jn.115.223651.
Downloaded from https://academic.oup.com/jn/article-abstract/146/3/551/4578260by gueston 17 June 2018
affected substantially by dietary protein intake (7). Therefore,lowering protein intake from milk formulas may exhibitbeneficial effects on weight gain, body composition, andmetabolic diseases in later life.
There is currently no consensus regarding what should bethe appropriate amount of protein in infant formulas (8–12).European Directive 2006/141/EC on infant and follow-onformulas (13), as well as the FDA (14), Codex Alimentarius(15), and European Food Safety Authority (16), define theminimum protein-to-energy ratio for infant formulas based oncow milk and soy protein as 1.8 g/100 kcal and 2.25 g/100 kcal,respectively, but they do not define an optimal intake amount.
In 2014, the European Food Safety Authority carried out aliterature search and review as preparatory work for theevaluation of the composition of infant and follow-on formulasand growing-up milk. With regard to reduced-protein formulas,this report concluded that neither negative health effects norclear benefits from the use of this type of formula could beestablished (8). Because there is uncertainty regarding the effectof dietary protein intake in childhood on growth and bodycomposition, and the later risk of overweight, obesity, andmetabolic syndrome, we aimed to investigate systematically thecurrent evidence on this proposed relation. The review protocolwas registered on the PROSPERO International ProspectiveRegister for Systematic Reviews (crd.york.ac.uk/prospero/index.asp) as CRD42014015573.
Methods
Inclusion/exclusion criteria. Study inclusion and exclusion criteria are
summarized in Table 1 (CRD42014015573).
Search methods for identification of studies. The followingelectronic databases were searched until November 2014 for published
studies that fulfilled our criteria: Cochrane Central Register of Controlled
Trials, PubMed (including MEDLINE), Embase, and the CumulativeIndex to Nursing and Allied Health Literature. To identify potential
systematic reviews/meta-analyses, we browsed The Cochrane Database
of Systematic Reviews and Database of Abstracts of Reviews of Effects.
Four reviewers (BP-G, BMZ, SMPK, and JK) were involved in the
process of the search, which was carried out independently by at least 2
reviewers. No language restrictions were applied. A detailed searchstrategy (Supplemental Table 1) was prepared with the support of an
information specialist from the Centre for Reviews and Dissemination,
University of York. Initially, the title, abstract, and keywords of every
record identified with the use of our search strategy were screened.Irrelevant articles were excluded by title or abstract. Full texts were
obtained for all potentially relevant studies. Differences between
reviewers were resolved by discussion until a consensus was reached.
The reference lists from identified studies and key review articles, as wellas selected trial registries (clinicaltrials.gov, www.clinicaltrials.gov; EU
Clinical Trials Register, www.clinicaltrialsregister.eu), were searched.
Proceedings from major scientific gastrointestinal and nutritionalmeetings published in the last 3 y also were screened. Finally, an
attempt was made to obtain additional data by direct contact with
experts in the field.
Data collection and analysis. An initial screening of the title, abstract,
and keywords of every record identified was performed. The next step
was to retrieve the full text of potentially relevant studies. Three
reviewers (BP-G, BMZ, and JK) independently assessed the eligibility ofeach potentially relevant study with the use of the inclusion criteria. All
cases in which different opinions or questions about the eligibility of a
particular study occurred were discussed with at least one other memberof the group (usually the expert of the team).
Data extraction andmanagement.With the use of a previously prepared
template of a table of evidence, 2 reviewers independently extracted thedata necessary for study characteristics and risk of bias assessment.
Assessment of risk of bias. The Cochrane Collaboration�s tool for
assessing risk of bias was used while including the following criteria:adequacy of sequence generation; allocation concealment; blinding of
participants, personnel, and outcome assessors; incomplete outcome
data; and selective reporting.
Measures of treatment effect. If feasible, for the continuous
outcomes, the results have been reported as the mean difference (MD)8
between the lower-protein formula groups and higher-protein formulagroups with a 95% CI. For the dichotomous outcome (prevalence of
obesity), the results have been reported as the RR between the lower-
protein and higher-protein formula groups with a 95% CI. Missing SDs
in 2 randomized controlled trials (RCTs) were calculated based on thereported SEMs with the use of the method described in the Cochrane
Handbook for Systematic Reviews of Interventions (17). For outcomes
expressed with the use of different units, if possible, data were
transformed for their unification (e.g., millimeters into centimeters).Four authors were contacted by e-mail or personally to obtain missing
data or clarify equivocal issues. This resulted in our obtaining additional
unpublished data from 2 published trials (18, 19).
Assessment of heterogeneity. Clinical and methodologic inconsistency
between the selected studies was assessed during the initial analysis, data
extraction, and quality assessment process. The decision to pool datatogether into a meta-analysis was based mainly on this assessment.
Additional information about heterogeneity was obtainedwhen the results
of the chi-square test and I2 value were analyzed for some outcomes.
Assessment of reporting biases. Although originally planned,
because of the insufficient number of studies included in the meta-
analysis (<10), we did not create a funnel plot, nor did we performa statistical test for its asymmetry to detect potential publication bias.
Data synthesis. A narrative synthesis was undertaken if conditions
required for performance of a meta-analysis were not fulfilled. For
1 The research leading to these results received funding from the European
Union’s Seventh Framework Programme (FP7/2007-2013), project EarlyNutrition
under grant agreement no. 289346. The study formula for the Childhood Obesity
Programme study was produced by Bledina, Steenvorde, France as part of a
contract with the European Commission.2 B Patro-Go1ab and BM Zalewski participated in a conference sponsored by
Nestle. SMP Kouwenhoven is a PhD student involved in a study designed to look
at the effects of a low-protein formula on weight gain and body composition. B
Koletzko is a member of the National Breastfeeding Committee and tends to be
biased toward breastfeeding. Both B Koletzko and his employer, the
Ludwig-Maximilians-University of Munich, Germany, have received support for
scientific and educational activities by companies that market products for
infants and children, including Abbott, Baxter, B. Braun, Dairy Goat Cooperative,
Danone, Fresenius Kabi, Fonterra, Hipp, Mead Johnson, Nestle, and Yakult,
predominantly as part of publicly funded research projects with the support of
the European Commission or the German government. JB van Goudoever holds
patents for a specific blend of essential amino acids in order to develop a new
infant formula, and is the sponsor of a study funded by the European Union that is
designed to look at the effects of a low-protein formula on weight gain and body
composition. He participated as a clinical researcher, advisory board member,
and/or speaker for Danone, Dicofarm, Ferrero, Hipp, Nestle Nutrition Institute,
Nutricia, and MJN. H Szajewska has participated as a clinical investigator,
advisory board member, and/or speaker for Arla, Biogaia, Biocodex, Danone,
Dicofarm, Hipp, Nestle, Nestle Nutrition Institute, Nutricia, Mead Johnson,
Merck, Sequoia, and Yakult. J Karas, no conflicts of interest.3 Supplemental Figure 1 and Supplemental Tables 1–3 are available from the
"Online Supporting Material" link in the online posting of the article and from the
same link in the online tables at http://jn.nutrition.org.
*To whom correspondence should be addressed. E-mail: [email protected].
8 Abbreviations used: CHOP, EU Childhood Obesity Programme; MD, mean
difference; RCT, randomized clinical trial.
552 Patro-Go1ab et al.
Downloaded from https://academic.oup.com/jn/article-abstract/146/3/551/4578260by gueston 17 June 2018
quantitative analysis and pooling individual study data together, we used
the ReviewManager computer program, version 5.3 (The Nordic Cochrane
Centre; The Cochrane Collaboration). For the 4 multiarm studies included in
the meta-analysis (18, 20–22), in order to avoid a unit-of-analysis error, wecombined the study groups to achieve a single pairwise comparison while
following the formulas provided by the Cochrane Handbook for Systematic
Reviews of Interventions (17). Some studies, although reporting an outcomeof interest, were excluded from the meta-analysis because of a lack of
necessary data (a lack of sample size, narrative results description without
numerical data, etc.). The authors of one trial assessed the outcomes for
lower- and higher-protein formula groups at different ages of children; thus,this trial was excluded from the analysis (23). In the case of another study, we
could not rule out the possibility of the presentation of duplicated data (21).
However, because data from this study were not pooled together in the meta-
analysis with data provided by other authors, the inclusion of this study isunlikely to result in biased estimates. The study aimed to compare infants that
were given different weaning foods (Swedish or Mediterranean); however,
children in both groups were randomly assigned to receive formula with alower or higher protein concentration. Because the authors provided
sufficient data, we compared the growth of infants within each study
group (different protein concentrations), but not between the groups
themselves (different weaning food). In the case of one trial [Raiha et al.(24)], when presenting the results, we made an assumption that the mean
values were accompanied by SD values (but not SEM values). However,
this was not clearly stated in the original paper.
Results
For a PRISMA flow diagram documenting the identificationprocess for eligible trials, see online Supplemental Figure 1. For
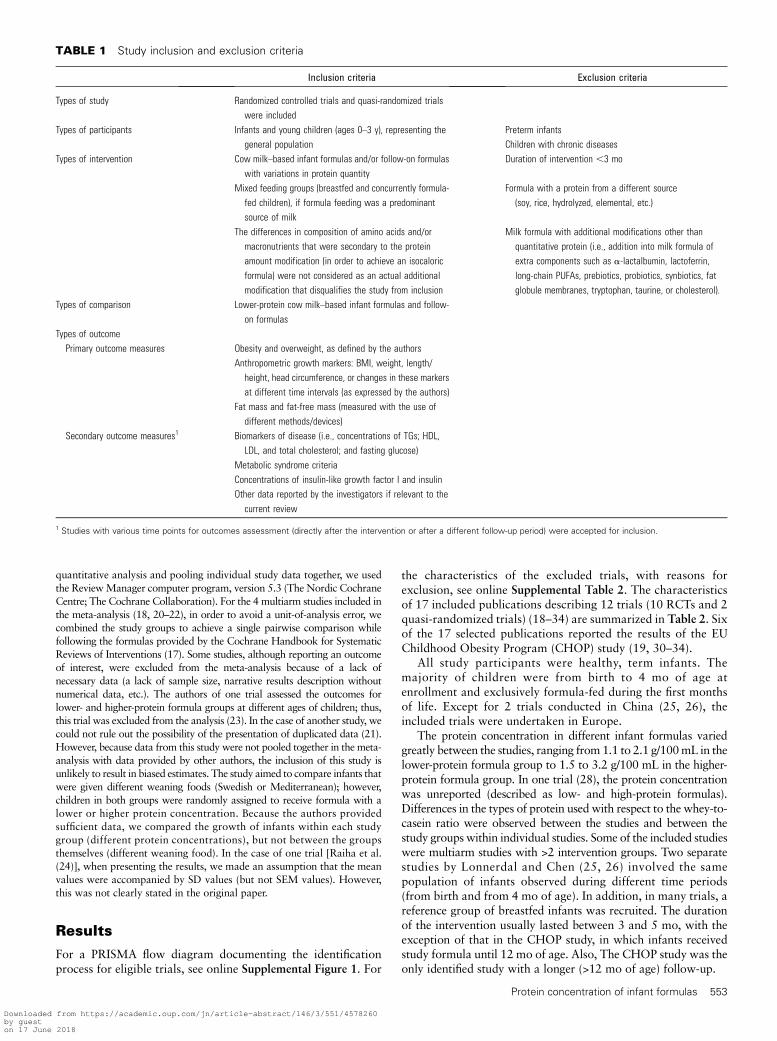
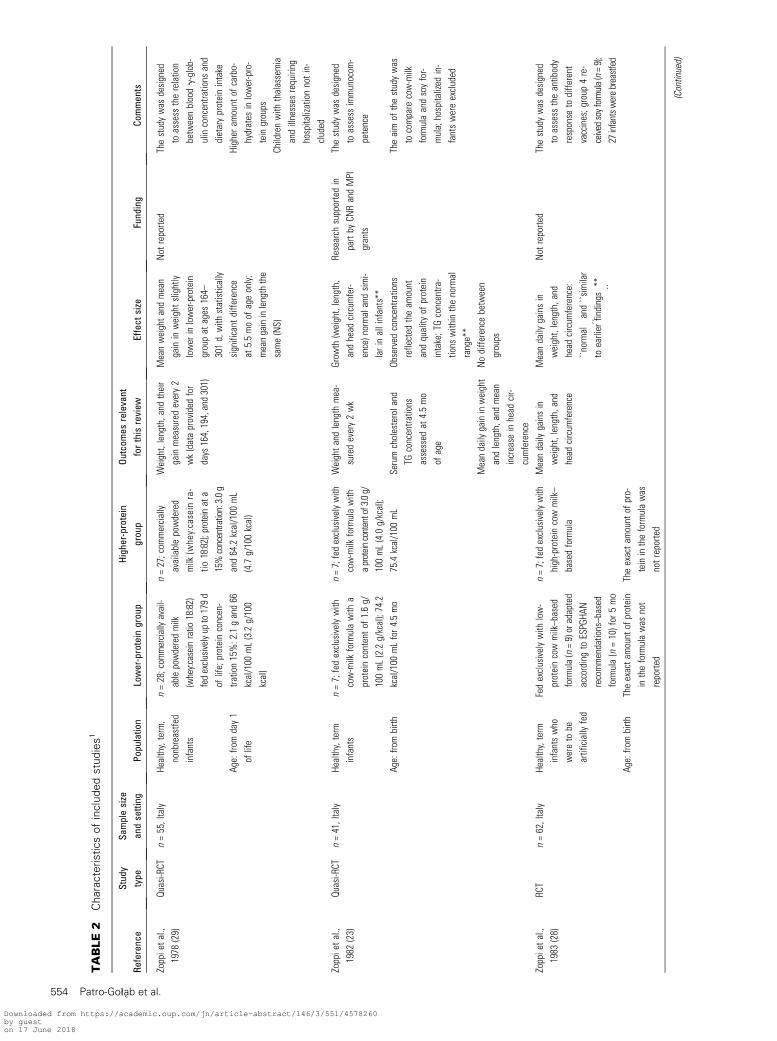
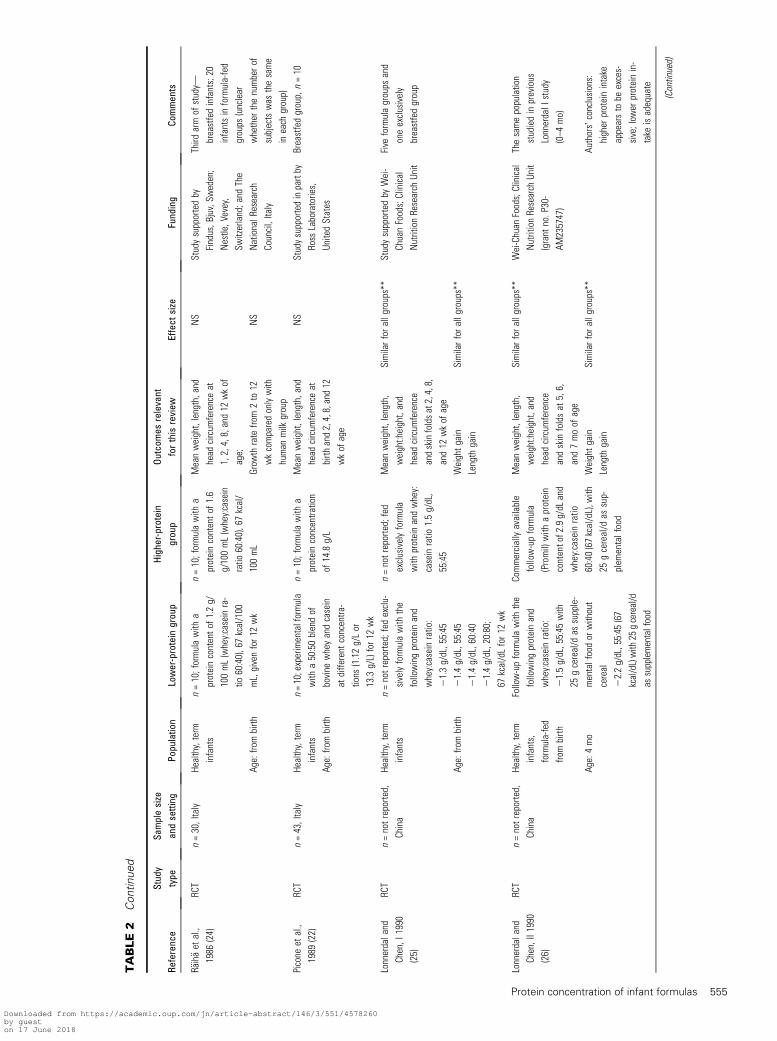
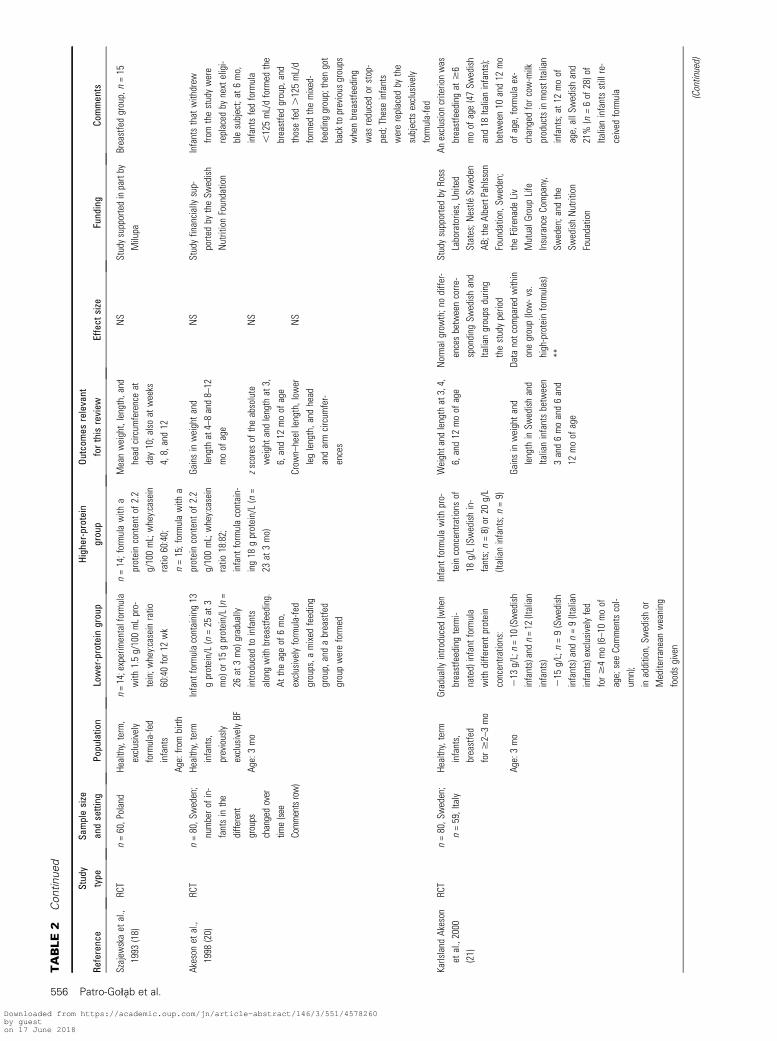
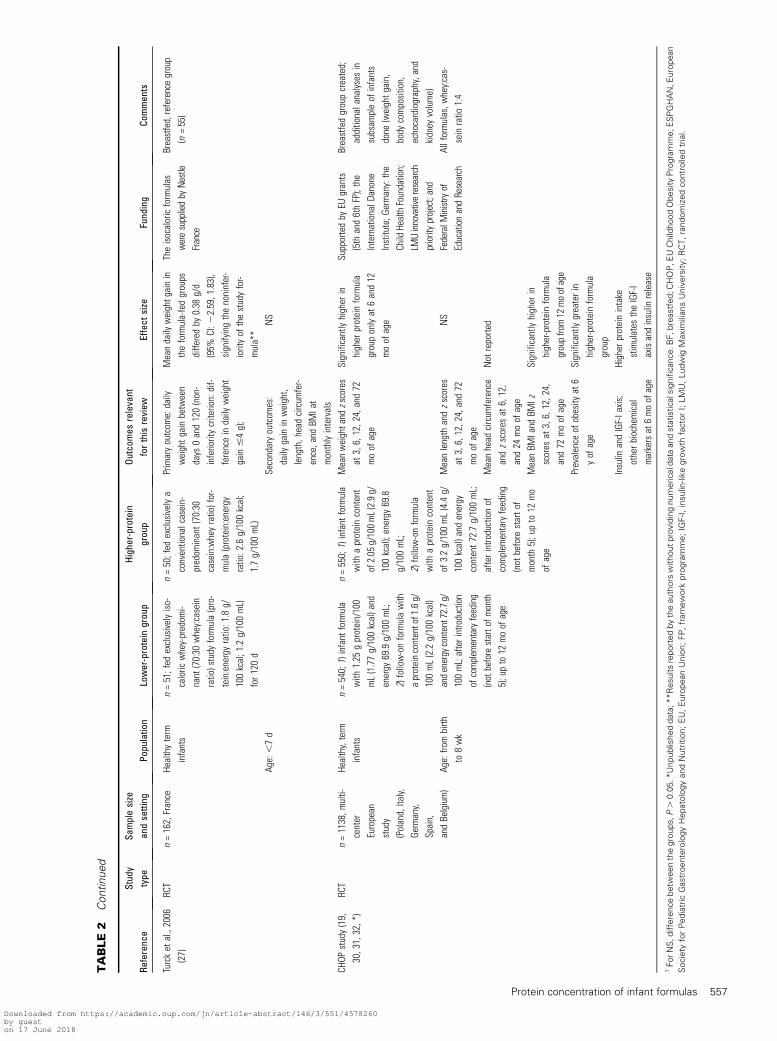
the characteristics of the excluded trials, with reasons forexclusion, see online Supplemental Table 2. The characteristicsof 17 included publications describing 12 trials (10 RCTs and 2quasi-randomized trials) (18–34) are summarized in Table 2. Sixof the 17 selected publications reported the results of the EUChildhood Obesity Program (CHOP) study (19, 30–34).
All study participants were healthy, term infants. Themajority of children were from birth to 4 mo of age atenrollment and exclusively formula-fed during the first monthsof life. Except for 2 trials conducted in China (25, 26), theincluded trials were undertaken in Europe.
The protein concentration in different infant formulas variedgreatly between the studies, ranging from1.1 to 2.1 g/100mL in thelower-protein formula group to 1.5 to 3.2 g/100 mL in the higher-protein formula group. In one trial (28), the protein concentrationwas unreported (described as low- and high-protein formulas).Differences in the types of protein used with respect to the whey-to-casein ratio were observed between the studies and between thestudy groupswithin individual studies. Some of the included studieswere multiarm studies with >2 intervention groups. Two separatestudies by Lonnerdal and Chen (25, 26) involved the samepopulation of infants observed during different time periods(from birth and from 4 mo of age). In addition, in many trials, areference group of breastfed infants was recruited. The durationof the intervention usually lasted between 3 and 5 mo, with theexception of that in the CHOP study, in which infants receivedstudy formula until 12 mo of age. Also, The CHOP study was theonly identified study with a longer (>12 mo of age) follow-up.
TABLE 1 Study inclusion and exclusion criteria
Inclusion criteria Exclusion criteria
Types of study Randomized controlled trials and quasi-randomized trials
were included
Types of participants Infants and young children (ages 0–3 y), representing the
general population
Preterm infants
Children with chronic diseases
Types of intervention Cow milk–based infant formulas and/or follow-on formulas
with variations in protein quantity
Duration of intervention ,3 mo
Mixed feeding groups (breastfed and concurrently formula-
fed children), if formula feeding was a predominant
source of milk
Formula with a protein from a different source
(soy, rice, hydrolyzed, elemental, etc.)
The differences in composition of amino acids and/or
macronutrients that were secondary to the protein
amount modification (in order to achieve an isocaloric
formula) were not considered as an actual additional
modification that disqualifies the study from inclusion
Milk formula with additional modifications other than
quantitative protein (i.e., addition into milk formula of
extra components such as a-lactalbumin, lactoferrin,
long-chain PUFAs, prebiotics, probiotics, synbiotics, fat
globule membranes, tryptophan, taurine, or cholesterol).
Types of comparison Lower-protein cow milk–based infant formulas and follow-
on formulas
Types of outcome
Primary outcome measures Obesity and overweight, as defined by the authors
Anthropometric growth markers: BMI, weight, length/
height, head circumference, or changes in these markers
at different time intervals (as expressed by the authors)
Fat mass and fat-free mass (measured with the use of
different methods/devices)
Secondary outcome measures1 Biomarkers of disease (i.e., concentrations of TGs; HDL,
LDL, and total cholesterol; and fasting glucose)
Metabolic syndrome criteria
Concentrations of insulin-like growth factor I and insulin
Other data reported by the investigators if relevant to the
current review
1 Studies with various time points for outcomes assessment (directly after the intervention or after a different follow-up period) were accepted for inclusion.
Protein concentration of infant formulas 553
Downloaded from https://academic.oup.com/jn/article-abstract/146/3/551/4578260by gueston 17 June 2018
TABLE
2Characteristicsofincludedstudies1
Reference
Stud
ytype
Samplesize
andsetting
Population
Lower-protein
group
Higher-protein
group
Outcomes
relevant
forthisreview
Effect
size
Funding
Comments
Zoppietal.,
1978
(29)
Quasi-RCT
n=55,Italy
Healthy,term,
nonbreastfe
d
infants
n=28;com
mercia
llyavail-
ablepowderedmilk
(whey:caseinratio
18:82)
fedexclu
sivelyup
to179d
oflife;proteinconcen-
tration15%:2.1gand66
kcal/100
mL(3.2g/100
kcal)
n=27;com
mercially
availablepowdered
milk
(whey:casein
ra-
tio18:82);proteinata
15%concentration:3.0g
and64.2kcal/100
mL
(4.7g/100kcal)
Weight,length,and
their
gainmeasuredevery2
wk(dataprovided
for
days
164,194,and301)
Meanweightandmean
gaininweightslightly
lower
inlower-protein
groupat
ages
164–
301d,with
statistically
significant
diffe
rence
at5.5moof
ageonly;
meangaininlengththe
same(NS)
Not
reporte
dThestudywas
designed
toassess
therelation
betweenbloodg-glob-
ulinconcentra
tions
and
dietaryproteinintake
Age:fro
mday1
oflife
Higher
amount
ofcarbo-
hydrates
inlower-pro-
teingroups
Childrenwith
thalassemia
andillnesses
requiring
hospitalizationnotin-
cluded
Zoppietal.,
1982
(23)
Quasi-RCT
n=41,Italy
Healthy,term
infants
n=7;fedexclusivelywith
cow-milk
formulawith
a
proteincontentof
1.6g/
100mL(2.2g/kcal);74.2
kcal/100
mLfor4.5mo
n=7;fedexclusivelywith
cow-milk
formulawith
aproteincontentof3.0g/
100mL(4.0g/kcal);
75.4kcal/100
mL
Weightandlength
mea-
suredevery2wk
Grow
th(weight,length,
andhead
circum
fer-
ence)normalandsimi-
larinallinfants**
Research
supportedin
partby
CNRandMPI
grants
Thestudywas
designed
toassess
immunocom
-
petence
Age:fro
mbirth
Serumcholesteroland
TGconcentra
tions
assessed
at4.5mo
ofage
Observed
concentra
tions
reflected
theam
ount
andquality
ofprotein
intake;TGconcentra
-
tions
withinthenormal
range**
Theaimof
thestudywas
tocompare
cow-milk
formulaandsoyfor-
mula;hospitalized
in-
fantswereexcluded
Meandaily
gaininweight
andlength,and
mean
increase
inhead
cir-
cumference
Nodiffe
rencebetween
groups
Zoppietal.,
1983
(28)
RCT
n=62,Italy
Healthy,term
infantswho
wereto
be
artificially
fed
Fedexclusivelywith
low-
proteincowmilk–based
formula(n=9)oradapted
accordingto
ESPGHA
N
recommendations–based
formula(n=10)for
5mo
n=7;fedexclusivelywith
high-proteincowmilk–
basedformula
Meandaily
gainsin
weight,length,and
head
circum
ference
Meandaily
gainsin
weight,length,and
head
circum
ference:
``normal
``and
``similar
toearlier
findings
``**
Not
reporte
dThestudywas
designed
toassess
theantibody
response
todiffe
rent
vaccines;group
4re-
ceivedsoyformula(n=9);
27infantsw
erebreastfed
Age:fro
mbirth
Theexactamount
ofprotein
intheformulawas
not
reporte
d
Theexactam
ount
ofpro-
teinintheformulawas
notreporte
d
(Continued)
554 Patro-Go1ab et al.
Downloaded from https://academic.oup.com/jn/article-abstract/146/3/551/4578260by gueston 17 June 2018
TABLE
2Continued
Reference
Stud
ytype
Samplesize
andsetting
Population
Lower-protein
group
Higher-protein
group
Outcomes
relevant
forthisreview
Effect
size
Funding
Comments
R€ aih€ aet
al.,
1986
(24)
RCT
n=30,Italy
Healthy,term
infants
n=10;formulawith
a
proteincontentof
1.2g/
100mL(whey:caseinra-
tio60:40),67kcal/100
mL,givenfor12
wk
n=10;formulawith
a
proteincontentof
1.6
g/100mL(whey:casein
ratio
60:40),67kcal/
100mL
Meanweight,length,and
head
circum
ferenceat
1,2,4,8,and12
wkof
age;
NS
Studysupportedby
Findus,B
juv,Sw
eden;
Nestle,Vevey,
Switzerland;and
The
NationalR
esearch
Council,Italy
Third
armof
study—
breastfedinfants;20
infantsinformula-fed
groups
(unclear
whether
thenumberof
subjectswas
thesame
ineach
group)
Age:fro
mbirth
Grow
thrate
from2to
12
wkcomparedonlywith
human
milk
group
NS
Picone
etal.,
1989
(22)
RCT
n=43,Italy
Healthy,term
infants
n=10;experimentalformula
with
a50:50blendof
bovine
wheyandcasein
atdiffe
rent
concentra
-
tions
(1.12g/Lor
13.3g/L)for12
wk
n=10;formulawith
a
proteinconcentra
tion
of14.8g/L
Meanweight,length,and
head
circum
ferenceat
birth
and2,4,8,and12
wkof
age
NS
Studysupportedinpartby
Ross
Laboratories,
UnitedStates
Breastfedgroup,n=10
Age:fro
mbirth
Lonnerdaland
Chen,I
1990
(25)
RCT
n=notreporte
d,
China
Healthy,term
infants
n=notreported;fedexclu-
sivelyformulawith
the
followingproteinand
whey:caseinratio:
21.3g/dL,55:45
21.4g/dL,55:45
21.4g/dL,60:40
21.4g/dL,20:80;
67kcal/dLfor12
wk
n=notreporte
d;fed
exclusivelyformula
with
proteinandwhey:
caseinratio
1.5g/dL,
55:45
Meanweight,length,
weight:height,and
head
circum
ference
andskinfoldsat2,4,8,
and12
wkof
age
Similarfora
llgroups**
Studysupportedby
Wei-
ChuanFoods;Clinical
NutritionResearch
Unit
Five
formulagroups
and
oneexclusively
breastfedgroup
Age:fro
mbirth
Weightgain
Similarfora
llgroups**
Length
gain
Lonnerdaland
Chen,II1990
(26)
RCT
n=notreporte
d,
China
Healthy,term
infants,
formula-fed
frombirth
Follow-upformulawith
the
followingproteinand
whey:caseinratio:
21.5g/dL,55:45
with
25gcereal/d
assupple-
mentalfoodor
without
cereal
22.2g/dL,55:45
(67
kcal/dL)with
25gcereal/d
assupplementalfood
Commerciallyavailable
follow-upformula
(Promil)with
aprotein
contentof2.9g/dL
and
whey:caseinratio
60:40(67kcal/dL),w
ith
25gcereal/d
assup-
plem
entalfood
Meanweight,length,
weight:height,and
head
circum
ference
andskinfoldsat
5,6,
and7moof
age
Similarfora
llgroups**
Wei-Chuan
Foods;Clinical
NutritionResearch
Unit
(grant
no.P30-
AM235747)
Thesamepopulation
studiedinprevious
LonnerdalI
study
(0–4
mo)
Age:4mo
Weightgain
Similarfora
llgroups**
Authors�conclusions:
higher
proteinintake
appearsto
beexces-
sive;low
erproteinin-
take
isadequate
Length
gain
(Continued)
Protein concentration of infant formulas 555
Downloaded from https://academic.oup.com/jn/article-abstract/146/3/551/4578260by gueston 17 June 2018
TABLE
2Continued
Reference
Stud
ytype
Samplesize
andsetting
Population
Lower-protein
group
Higher-protein
group
Outcomes
relevant
forthisreview
Effect
size
Funding
Comments
Szajew
skaet
al.,
1993
(18)
RCT
n=60,Poland
Healthy,term,
exclusively
formula-fed
infants
n=14;experimentalformula
with
1.5g/100mLpro-
tein;w
hey:caseinratio
60:40for12
wk
n=14;formulawith
a
proteincontentof
2.2
g/100mL;whey:casein
ratio
60:40;
n=15;formulawith
a
proteincontentof
2.2
g/100mL;whey:casein
ratio
18:82;
infant
formulacontain-
ing18
gprotein/L(n=
23at
3mo)
Meanweight,length,and
head
circum
ferenceat
day10;alsoat
weeks
4,8,and12
NS
Studysupportedinpartby
Milupa
Breastfedgroup,n=15
Age:fro
mbirth
Akeson
etal.,
1998
(20)
RCT
n=80,S
weden;
numberof
in-
fantsinthe
different
groups
changedover
time(see
Commentsrow)
Healthy,term
infants,
previously
exclusivelyBF
Infantformulacontaining
13
gprotein/L(n=25
at3
mo)or15
gprotein/L(n=
26at
3mo)gradually
intro
ducedto
infants
alongwith
breastfeeding.
Attheageof
6mo,
exclusivelyformula-fed
groups,a
mixed
feeding
group,andabreastfed
groupwereformed
Gainsinweightand
lengthat4–8and8–12
moof
age
NS
Studyfinanciallysup-
porte
dby
theSw
edish
NutritionFoundation
Infantsthat
withdrew
fromthestudywere
replaced
bynexteligi-
blesubject;at
6mo,
infantsfedformula
,125mL/dformed
the
breastfedgroup,and
thosefed.125mL/d
formed
themixed-
feedinggroup;then
got
backtoprevious
groups
whenbreastfeeding
was
reducedor
stop-
ped;Theseinfants
werereplaced
bythe
subjectsexclusively
formula-fed
Age:3mo
zscores
oftheabsolute
weightand
lengthat3,
6,and12
moof
age
NS
Crow
n–heellength,low
er
leglength,and
head
andarmcircum
fer-
ences
NS
Karlsland
Akeson
etal.,2000
(21)
RCT
n=80,S
weden;
n=59,Italy
Healthy,term
infants,
breastfed
for$2–3mo
Gradually
intro
duced(when
breastfeedingtermi-
nated)infant
formula
with
diffe
rent
protein
concentra
tions:
213
g/L;n=10
(Swedish
infants)andn=12
(Italian
infants)
215
g/L;n=9(Swedish
infants)andn=9(Italian
infants)exclusivelyfed
for$4mo(6–10moof
age;seeCommentscol-
umn);
inaddition,Sw
edishor
Mediterra
nean
weaning
foodsgiven
Infant
formulawith
pro-
teinconcentra
tions
of
18g/L(Swedishin-
fants;n=8)or
20g/L
(Italianinfants;n=9)
Weightand
lengthat3,4,
6,and12
moof
age
Normalgrow
th;nodiffe
r-
encesbetweencorre
-
sponding
Swedishand
Italiangroups
during
thestudyperiod
Studysupportedby
Ross
Laboratories,United
States;N
estle
Sweden
AB;the
AlbertPahlsson
Foundation,Sw
eden;
theF€ orenade
Liv
MutualG
roup
Life
InsuranceCompany,
Sweden;and
the
SwedishNutrition
Foundation
Anexclusioncriterionwas
breastfeedingat
$6
moof
age(47Sw
edish
and18
Italianinfants);
between10
and12
mo
ofage,formulaex-
changedforcow-milk
productsinmostItalian
infants;at
12moof
age,allS
wedishand
21%
(n=6of
28)of
Italianinfantsstillre-
ceived
formula
Age:3mo
Gainsinweightand
length
inSw
edishand
Italianinfantsbetween
3and6moand6and
12moof
age
Data
notcom
paredwithin
onegroup(low-vs.
high-proteinformulas)
**
(Continued)
556 Patro-Go1ab et al.
Downloaded from https://academic.oup.com/jn/article-abstract/146/3/551/4578260by gueston 17 June 2018
TABLE
2Continued
Reference
Stud
ytype
Samplesize
andsetting
Population
Lower-protein
group
Higher-protein
group
Outcomes
relevant
forthisreview
Effect
size
Funding
Comments
Turcket
al.,2006
(27)
RCT
n=162,France
Healthyterm
infants
n=51;fed
exclusivelyiso-
caloric
whey-predom
i-
nant
(70:30
whey:casein
ratio)study
formula(pro-
tein:energyratio:1.8g/
100kcal;1.2g/100mL)
for120d
n=50;fed
exclusivelya
conventionalcasein-
predom
inant(70:30
casein:wheyratio)for-
mula(protein:energy
ratio:2.6g/100kcal;
1.7g/100mL)
Primaryoutcom
e:daily
weightgainbetween
days
0and120(non-
inferioritycriterion:dif-
ferenceindaily
weight
gain#4g);
Meandaily
weightgainin
theformula-fedgroups
diffe
redby
0.38
g/d
(95%
CI:2
2.59,1.83),
signifyingthenoninfer-
iorityof
thestudyfor-
mula**
Theisocaloricformulas
weresuppliedby
Nestle
France
Breastfed,referencegroup
(n=55)
Age:,7d
Secondaryoutcom
es:
daily
gaininweight,
length,headcircum
fer-
ence,and
BMIat
monthlyintervals
NS
CHOP
study(19,
30,31,32,*)
RCT
n=1138,m
ulti-
center
European
study
(Poland,Italy,
Germany,
Spain,
andBelgium)
Healthy,term
infants
n=540;1)infant
formula
with
1.25
gprotein/100
mL(1.77g/100kcal)and
energy
69.9g/100mL;
2)follow-onformulawith
aproteincontentof1.6g/
100mL(2.2g/100kcal)
andenergy
content72.7g/
100mL;afterintroduction
ofcomplem
entaryfeeding
(not
before
starto
fmonth
5);upto12
moof
age
n=550;1)infant
formula
with
aproteincontent
of2.05
g/100mL(2.9g/
100kcal);energy
69.8
g/100mL;
2)follow-onformula
with
aproteincontent
of3.2g/100mL(4.4g/
100kcal)and
energy
content72.7g/100mL;
afterintro
ductionof
complem
entaryfeeding
(not
before
startof
month
5);upto
12mo
ofage
Meanweightand
zscores
at3,6,12,24,and72
moof
age
Significantlyhigher
in
higher
proteinformula
grouponlyat
6and12
moof
age
Supportedby
EUgrants
(5th
and6thFP);the
InternationalD
anone
Institute;G
ermany:the
Child
HealthFoundation;
LMUinnovativeresearch
priorityproject;and
FederalM
inistryof
EducationandResearch
Breastfedgroupcreated;
additionalanalysesin
subsam
pleof
infants
done
(weightgain,
body
composition,
echocardiography,and
kidney
volume)
Age:fro
mbirth
to8wk
Meanlength
andzscores
at3,6,12,24,and72
moof
age
NS
Allformulas,w
hey:cas-
seinratio
1:4
Meanhead
circum
ference
andzscores
at6,12,
and24
moof
age
Not
reporte
d
MeanBM
Iand
BMIz
scores
at3,6,12,24,
and72
moof
age
Significantlyhigher
in
higher-proteinformula
groupfrom12
moofage
Prevalence
ofobesity
at6
yof
age
Significantlygreaterin
higher-proteinformula
group
Insulin
andIGF-Iaxis;
otherbiochemical
markersat
6moofage
Higher
proteinintake
stimulates
theIGF-I
axisandinsulin
release
1ForNS,differencebetw
eenthegroups,P.
0.05.*Unpublisheddata;**Resultsreportedbytheauthors
withoutprovidingnumericaldata
andstatisticalsignificance.BF,breastfed;CHOP,EUChildhoodObesityProgramme;ESPGHAN,European
Society
forPediatric
GastroenterologyHepatologyandNutrition;EU,EuropeanUnion;FP,framework
programme;IGF-I,insulin-likegrowth
factorI;LMU,Ludwig
Maxim
iliansUniversity;RCT,randomizedcontrolledtrial.
Protein concentration of infant formulas 557
Downloaded from https://academic.oup.com/jn/article-abstract/146/3/551/4578260by gueston 17 June 2018
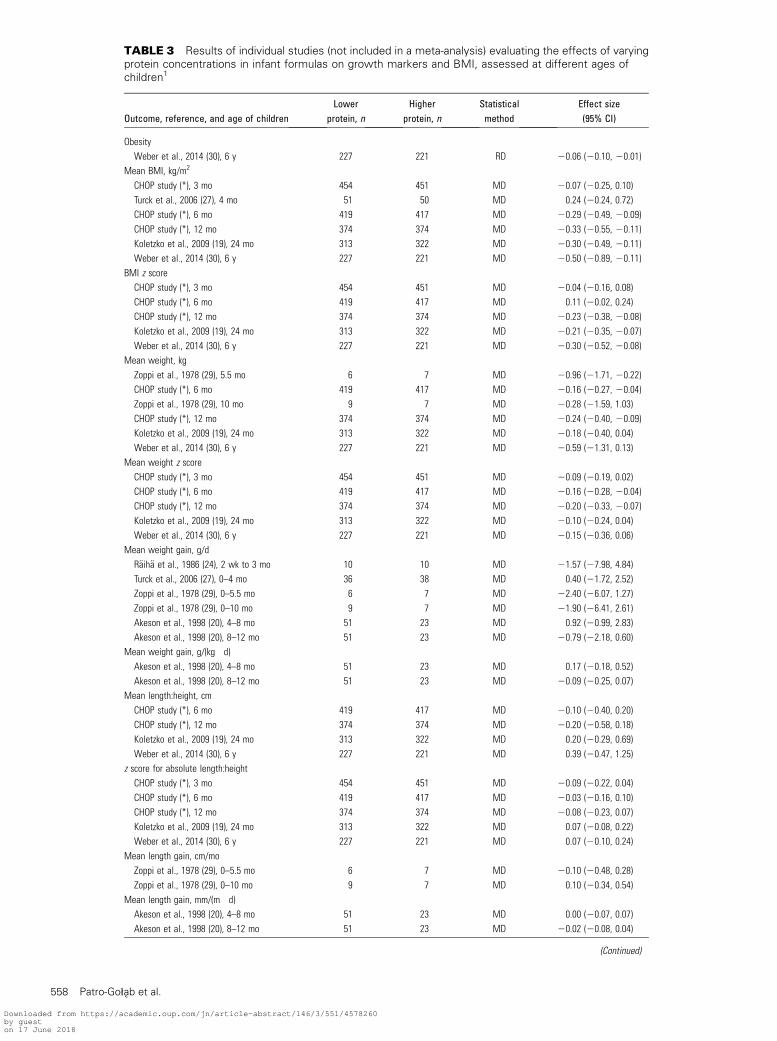
TABLE 3 Results of individual studies (not included in a meta-analysis) evaluating the effects of varyingprotein concentrations in infant formulas on growth markers and BMI, assessed at different ages ofchildren1
Outcome, reference, and age of childrenLower
protein, nHigher
protein, nStatisticalmethod
Effect size(95% CI)
Obesity
Weber et al., 2014 (30), 6 y 227 221 RD 20.06 (20.10, 20.01)
Mean BMI, kg/m2
CHOP study (*), 3 mo 454 451 MD 20.07 (20.25, 0.10)
Turck et al., 2006 (27), 4 mo 51 50 MD 0.24 (20.24, 0.72)
CHOP study (*), 6 mo 419 417 MD 20.29 (20.49, 20.09)
CHOP study (*), 12 mo 374 374 MD 20.33 (20.55, 20.11)
Koletzko et al., 2009 (19), 24 mo 313 322 MD 20.30 (20.49, 20.11)
Weber et al., 2014 (30), 6 y 227 221 MD 20.50 (20.89, 20.11)
BMI z score
CHOP study (*), 3 mo 454 451 MD 20.04 (20.16, 0.08)
CHOP study (*), 6 mo 419 417 MD 0.11 (20.02, 0.24)
CHOP study (*), 12 mo 374 374 MD 20.23 (20.38, 20.08)
Koletzko et al., 2009 (19), 24 mo 313 322 MD 20.21 (20.35, 20.07)
Weber et al., 2014 (30), 6 y 227 221 MD 20.30 (20.52, 20.08)
Mean weight, kg
Zoppi et al., 1978 (29), 5.5 mo 6 7 MD 20.96 (21.71, 20.22)
CHOP study (*), 6 mo 419 417 MD 20.16 (20.27, 20.04)
Zoppi et al., 1978 (29), 10 mo 9 7 MD 20.28 (21.59, 1.03)
CHOP study (*), 12 mo 374 374 MD 20.24 (20.40, 20.09)
Koletzko et al., 2009 (19), 24 mo 313 322 MD 20.18 (20.40, 0.04)
Weber et al., 2014 (30), 6 y 227 221 MD 20.59 (21.31, 0.13)
Mean weight z score
CHOP study (*), 3 mo 454 451 MD 20.09 (20.19, 0.02)
CHOP study (*), 6 mo 419 417 MD 20.16 (20.28, 20.04)
CHOP study (*), 12 mo 374 374 MD 20.20 (20.33, 20.07)
Koletzko et al., 2009 (19), 24 mo 313 322 MD 20.10 (20.24, 0.04)
Weber et al., 2014 (30), 6 y 227 221 MD 20.15 (20.36, 0.06)
Mean weight gain, g/d
R€aih€a et al., 1986 (24), 2 wk to 3 mo 10 10 MD 21.57 (27.98, 4.84)
Turck et al., 2006 (27), 0–4 mo 36 38 MD 0.40 (21.72, 2.52)
Zoppi et al., 1978 (29), 0–5.5 mo 6 7 MD 22.40 (26.07, 1.27)
Zoppi et al., 1978 (29), 0–10 mo 9 7 MD 21.90 (26.41, 2.61)
Akeson et al., 1998 (20), 4–8 mo 51 23 MD 0.92 (20.99, 2.83)
Akeson et al., 1998 (20), 8–12 mo 51 23 MD 20.79 (22.18, 0.60)
Mean weight gain, g/(kg � d)Akeson et al., 1998 (20), 4–8 mo 51 23 MD 0.17 (20.18, 0.52)
Akeson et al., 1998 (20), 8–12 mo 51 23 MD 20.09 (20.25, 0.07)
Mean length:height, cm
CHOP study (*), 6 mo 419 417 MD 20.10 (20.40, 0.20)
CHOP study (*), 12 mo 374 374 MD 20.20 (20.58, 0.18)
Koletzko et al., 2009 (19), 24 mo 313 322 MD 0.20 (20.29, 0.69)
Weber et al., 2014 (30), 6 y 227 221 MD 0.39 (20.47, 1.25)
z score for absolute length:height
CHOP study (*), 3 mo 454 451 MD 20.09 (20.22, 0.04)
CHOP study (*), 6 mo 419 417 MD 20.03 (20.16, 0.10)
CHOP study (*), 12 mo 374 374 MD 20.08 (20.23, 0.07)
Koletzko et al., 2009 (19), 24 mo 313 322 MD 0.07 (20.08, 0.22)
Weber et al., 2014 (30), 6 y 227 221 MD 0.07 (20.10, 0.24)
Mean length gain, cm/mo
Zoppi et al., 1978 (29), 0–5.5 mo 6 7 MD 20.10 (20.48, 0.28)
Zoppi et al., 1978 (29), 0–10 mo 9 7 MD 0.10 (20.34, 0.54)
Mean length gain, mm/(m � d)Akeson et al., 1998 (20), 4–8 mo 51 23 MD 0.00 (20.07, 0.07)
Akeson et al., 1998 (20), 8–12 mo 51 23 MD 20.02 (20.08, 0.04)
(Continued)
558 Patro-Go1ab et al.
Downloaded from https://academic.oup.com/jn/article-abstract/146/3/551/4578260by gueston 17 June 2018
The risk of bias in included studies
The included studies are described with respect to their risk ofbias in Supplemental Table 3. Methodologic limitationsincluded a very small sample size, participants� replacement,pseudo-random allocation, a high loss to follow-up, per-protocol analysis, and selective outcomes reporting. In manystudies, because of poor reporting, unambiguous evaluation ofthe risk of bias was not possible, which often resulted in thedescription of some elements as unclear.
Effects of interventions—primary outcomes
Overweight and obesity. Only one RCT (30) (the CHOPstudy; n = 448) reported this outcome (Table 3). The risk ofbecoming obese at the age of 6 y was significantly lower in thelower-protein formula group than in the higher-protein formulagroup (RR 0.44; 95% CI: 0.21, 0.91).
Fat mass and fat-free mass. The analysis of body compositionby isotope dilution was performed in a subsample (n = 52) of 6-mo-old infants who were enrolled in the CHOP study (31).Although correlations between the fat-mass z score (but not thefat-free mass z score) and both growth velocity and BMI wereobserved, fat-free mass and fat mass z scores did not differbetween the higher- and lower-protein formula groups. In thestudy by Lonnerdal and Chen (26), skin fold measurements wereobtained at 5, 6, and 7 mo of age. The authors reported similar
results for all study groups. However, no numeral data wereavailable.
Anthropometric growth markers.BMI. This outcome was reported at different time points in 4
publications (19, 27, 30, 32) (Table 3). At 3 or 4 mo of age, therewere no significant differences between the study groups.Starting at 6 mo of age, only one RCT (CHOP Study) reporteddata on BMI. BMI was significantly lower in the lower-proteinformula group than in the higher-protein formula group at alltime points (i.e., at 6, 12, and 24 mo and at 6 y).
BMI z scores. Only the CHOP study (unpublished data)reported BMI z scores (Table 3). No significant differences werefound at 3 and 6 mo of age between the lower-protein formulagroup and the higher-protein formula group. Starting at 12 moof age, BMI z scores were significantly lower in the lower-proteinformula group than in the higher-protein formula group at alltime points (i.e., at 12 and 24 mo and at 6 y).
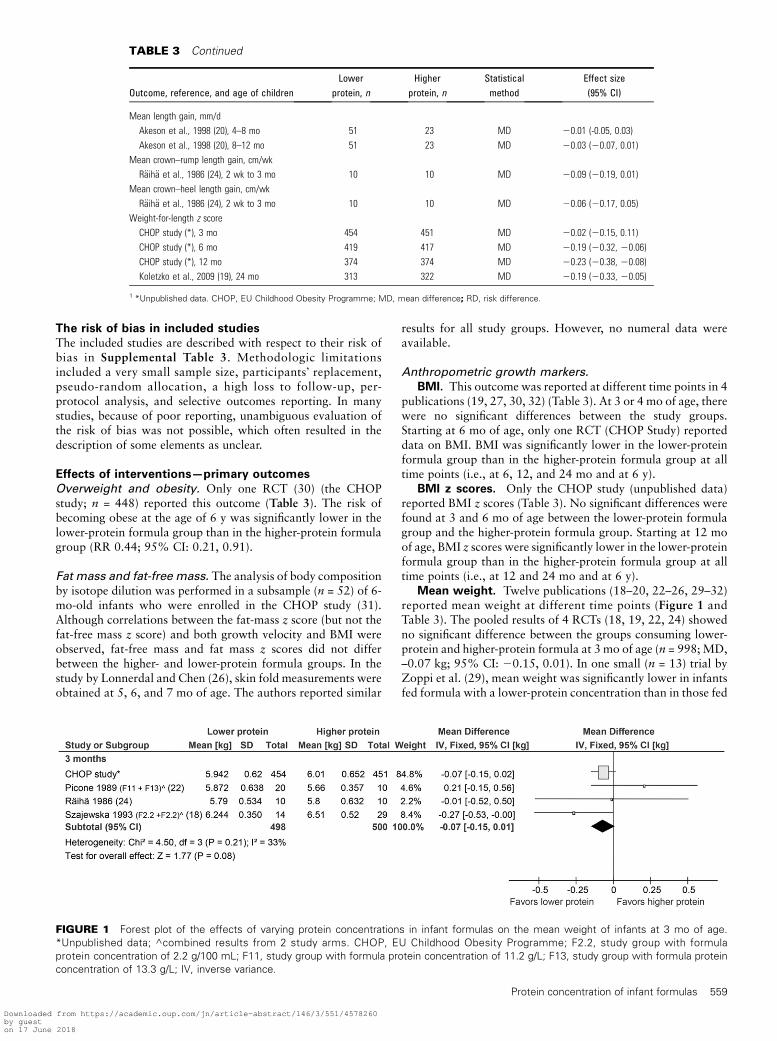
Mean weight. Twelve publications (18–20, 22–26, 29–32)reported mean weight at different time points (Figure 1 andTable 3). The pooled results of 4 RCTs (18, 19, 22, 24) showedno significant difference between the groups consuming lower-protein and higher-protein formula at 3 mo of age (n = 998;MD,–0.07 kg; 95% CI: 20.15, 0.01). In one small (n = 13) trial byZoppi et al. (29), mean weight was significantly lower in infantsfed formula with a lower-protein concentration than in those fed
TABLE 3 Continued
Outcome, reference, and age of childrenLower
protein, nHigher
protein, nStatisticalmethod
Effect size(95% CI)
Mean length gain, mm/d
Akeson et al., 1998 (20), 4–8 mo 51 23 MD 20.01 (-0.05, 0.03)
Akeson et al., 1998 (20), 8–12 mo 51 23 MD 20.03 (20.07, 0.01)
Mean crown–rump length gain, cm/wk
R€aih€a et al., 1986 (24), 2 wk to 3 mo 10 10 MD 20.09 (20.19, 0.01)
Mean crown–heel length gain, cm/wk
R€aih€a et al., 1986 (24), 2 wk to 3 mo 10 10 MD 20.06 (20.17, 0.05)
Weight-for-length z score
CHOP study (*), 3 mo 454 451 MD 20.02 (20.15, 0.11)
CHOP study (*), 6 mo 419 417 MD 20.19 (20.32, 20.06)
CHOP study (*), 12 mo 374 374 MD 20.23 (20.38, 20.08)
Koletzko et al., 2009 (19), 24 mo 313 322 MD 20.19 (20.33, 20.05)
1 *Unpublished data. CHOP, EU Childhood Obesity Programme; MD, mean difference; RD, risk difference.
FIGURE 1 Forest plot of the effects of varying protein concentrations in infant formulas on the mean weight of infants at 3 mo of age.
*Unpublished data; ^combined results from 2 study arms. CHOP, EU Childhood Obesity Programme; F2.2, study group with formula
protein concentration of 2.2 g/100 mL; F11, study group with formula protein concentration of 11.2 g/L; F13, study group with formula protein
concentration of 13.3 g/L; IV, inverse variance.
Protein concentration of infant formulas 559
Downloaded from https://academic.oup.com/jn/article-abstract/146/3/551/4578260by gueston 17 June 2018
formula with a higher-protein concentration at 5.5 mo of age;however, the difference between the groups was no longersignificant when these infants were 10 mo old. The CHOP studyreported a significantly lower mean weight in the group consum-ing lower-protein formula than in the group consuming higher-protein formula at 6 and 12mo of age, but there was no significantdifference between the groups at 24 mo and at 6 y.
In one study (23), this outcome was assessed at different childages in the groups consuming lower-protein and higher-proteinformula. Therefore, we found it improper to compare the results.
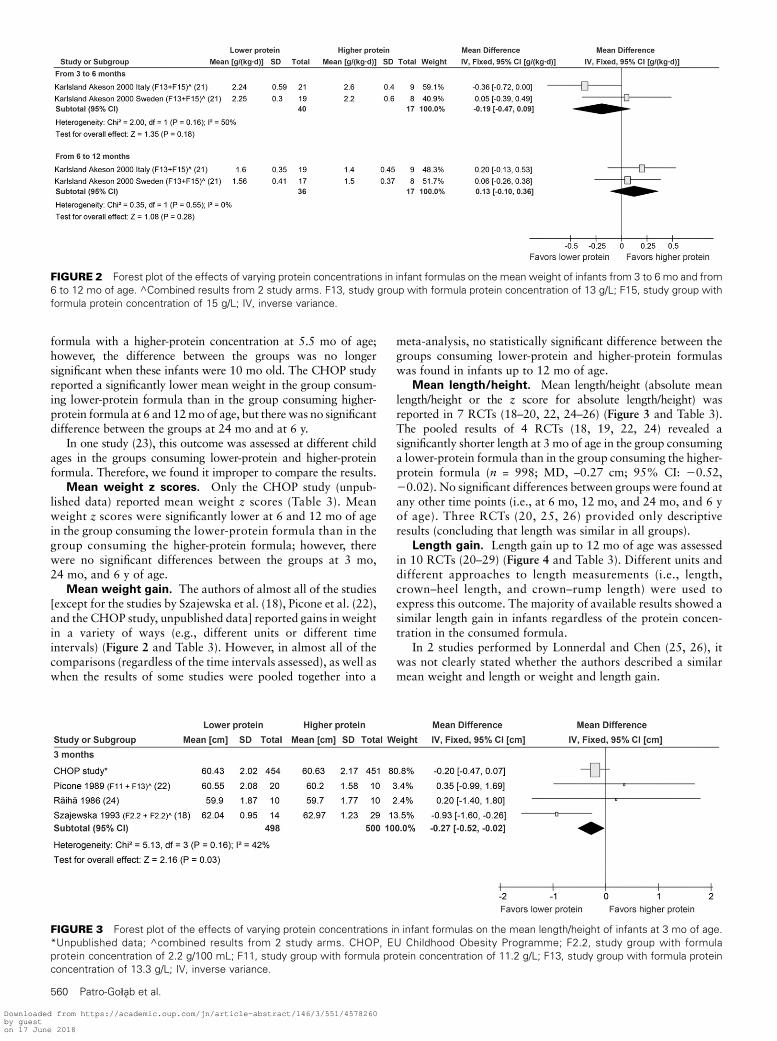
Mean weight z scores. Only the CHOP study (unpub-lished data) reported mean weight z scores (Table 3). Meanweight z scores were significantly lower at 6 and 12 mo of agein the group consuming the lower-protein formula than in thegroup consuming the higher-protein formula; however, therewere no significant differences between the groups at 3 mo,24 mo, and 6 y of age.
Mean weight gain. The authors of almost all of the studies[except for the studies by Szajewska et al. (18), Picone et al. (22),and the CHOP study, unpublished data] reported gains in weightin a variety of ways (e.g., different units or different timeintervals) (Figure 2 and Table 3). However, in almost all of thecomparisons (regardless of the time intervals assessed), as well aswhen the results of some studies were pooled together into a
meta-analysis, no statistically significant difference between thegroups consuming lower-protein and higher-protein formulaswas found in infants up to 12 mo of age.
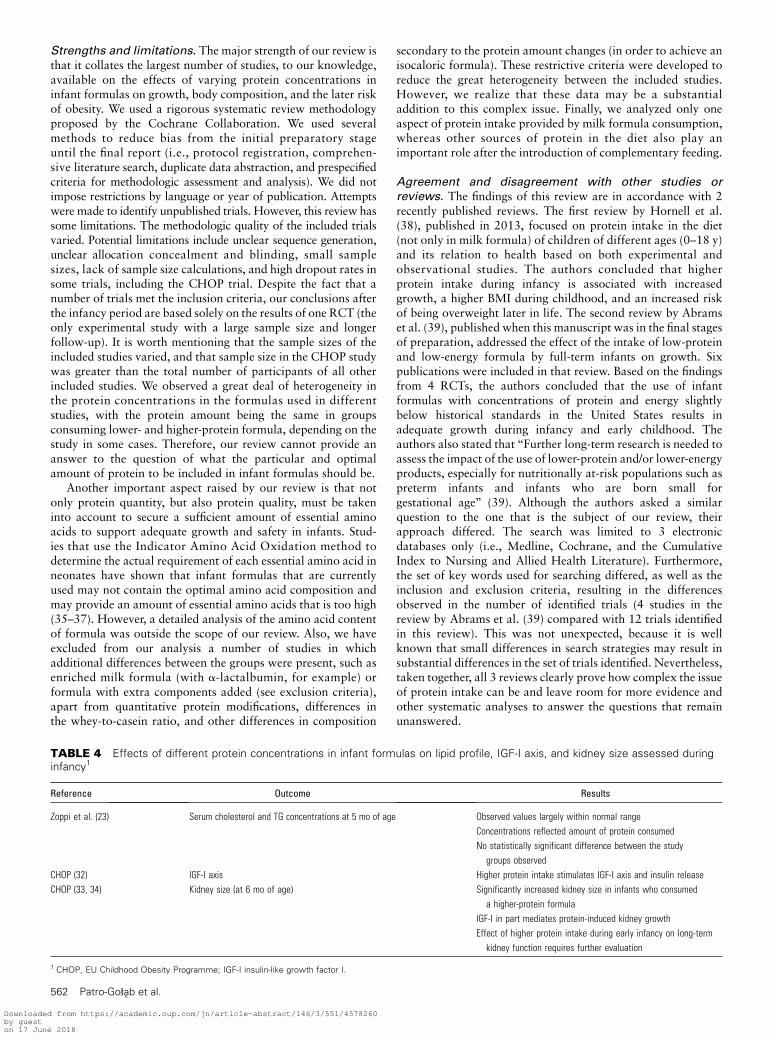
Mean length/height. Mean length/height (absolute meanlength/height or the z score for absolute length/height) wasreported in 7 RCTs (18–20, 22, 24–26) (Figure 3 and Table 3).The pooled results of 4 RCTs (18, 19, 22, 24) revealed asignificantly shorter length at 3 mo of age in the group consuminga lower-protein formula than in the group consuming the higher-protein formula (n = 998; MD, –0.27 cm; 95% CI: 20.52,20.02). No significant differences between groups were found atany other time points (i.e., at 6 mo, 12 mo, and 24 mo, and 6 yof age). Three RCTs (20, 25, 26) provided only descriptiveresults (concluding that length was similar in all groups).
Length gain. Length gain up to 12 mo of age was assessedin 10 RCTs (20–29) (Figure 4 and Table 3). Different units anddifferent approaches to length measurements (i.e., length,crown–heel length, and crown–rump length) were used toexpress this outcome. The majority of available results showed asimilar length gain in infants regardless of the protein concen-tration in the consumed formula.
In 2 studies performed by Lonnerdal and Chen (25, 26), itwas not clearly stated whether the authors described a similarmean weight and length or weight and length gain.
FIGURE 2 Forest plot of the effects of varying protein concentrations in infant formulas on the mean weight of infants from 3 to 6 mo and from
6 to 12 mo of age. ^Combined results from 2 study arms. F13, study group with formula protein concentration of 13 g/L; F15, study group with
formula protein concentration of 15 g/L; IV, inverse variance.
FIGURE 3 Forest plot of the effects of varying protein concentrations in infant formulas on the mean length/height of infants at 3 mo of age.
*Unpublished data; ^combined results from 2 study arms. CHOP, EU Childhood Obesity Programme; F2.2, study group with formula
protein concentration of 2.2 g/100 mL; F11, study group with formula protein concentration of 11.2 g/L; F13, study group with formula protein
concentration of 13.3 g/L; IV, inverse variance.
560 Patro-Go1ab et al.
Downloaded from https://academic.oup.com/jn/article-abstract/146/3/551/4578260by gueston 17 June 2018

Head circumference. In 5 RCTs (18, 22, 24–26), dataregarding head circumference were available (Figure 5). Thepooled results of 3 RCTs (18, 22, 24) showed no significantdifference in head circumference between the groups consuminglower-protein and higher-protein formula at 12 wk of age (MD,20.31 cm; 95% CI: 20.63, 0.02). However, significant heteroge-neity was found (I2 = 81%). The observed heterogeneity was notexplained by the subgroup analysis based on the amount of proteinin milk formulas, which was performed as originally planned inthe protocol. We also considered different measurement techniquesas a potential source of the identified heterogeneity. However, theauthors did not report how the measurements were obtained. In2 studies by Lonnerdal and Chen (25, 26), the authors reported asimilar mean head circumference in all study groups (numericaldata were not shown).
Head circumference gain. In the study by Turck et al. (27),the daily gain in head circumference (millimeters per day) atmonthly intervals was described, showing a similar growth rate inboth study groups. In the study by Zoppi et al. (23), the meanincrease in head circumference was evaluated in the group consum-ing higher-protein formula only. In another report (28), the meandaily gain in head circumference was described as normal.
Weight-for-length z scores. Weight-for-length z scoreswere analyzed in the CHOP study [(unpublished data) Table 3].The weight-for-length z scores were significantly higher at 6, 12,and 24mo of age in the group consuming higher-protein formulathan in the group consuming lower-protein formula.
Other. Other anthropometric assessments were reported insome of the included trials (particularly an early assessment ofgrowth at 2, 4, and 8 wk of age; evaluation of weight and length
gain at monthly intervals; etc.). However, we found the results ofthese trials to be irrelevant to our review.
Secondary outcomes
Our secondary outcomes were only partially addressed in 2studies. A summary of these findings is presented in Table 4.
Discussion
Summary of the evidence. This review revealed that the vastmajority of identified studies evaluated only short-term out-comes related to infant growth. The gathered evidence suggeststhat during the first year of life, different protein concentrationsin infant formulas do not seem to affect infants� linear growthsignificantly apart from a transient effect on mean length duringthe first months of life. Data with respect to weight and weightgain suggest similar growth in the first months of life, with alower mean weight (and weight z score) obtained in the infantsfed lower-protein formulas from;6 mo until 12 mo of age only.A significantly lower BMI associated with the intake of lower-protein formula was firmly observed in 12-mo-old infants and inchildren up until early school age. No conclusions with regard tothe effects of formula protein concentration on body composi-tion can be formulated. We have identified only one RCT (theCHOP study) that assessed the outcomes of interest afterinfancy. The intake of lower-protein formula during infancy wasobserved to reduce the risk of obesity at the age of 6 y in thisstudy. However, these findings need to be interpreted withcaution, because this is a single report, and some methodologiclimitations of the study were identified.
FIGURE 4 Forest plot of the effects of varying protein concentrations in infant formulas on the mean length gain of infants from 3 to 6 mo and
from 6 to 12 mo of age. ^Combined results from 2 study arms. F13, study group with formula protein concentration of 13 g/L; F15, study group
with formula protein concentration of 15 g/L; IV, inverse variance.
FIGURE 5 Forest plot of the effects of varying protein concentrations in infant formulas on the mean head circumference of infants at 3 mo of
age. ^Combined results from 2 study arms. F2.2, study group with formula protein concentration of 2.2 g/100 mL; F11, study group with formula
protein concentration of 11.2 g/L; F13, study group with formula protein concentration of 13.3 g/L; IV, inverse variance.
Protein concentration of infant formulas 561
Downloaded from https://academic.oup.com/jn/article-abstract/146/3/551/4578260by gueston 17 June 2018
Strengths and limitations. The major strength of our review isthat it collates the largest number of studies, to our knowledge,available on the effects of varying protein concentrations ininfant formulas on growth, body composition, and the later riskof obesity. We used a rigorous systematic review methodologyproposed by the Cochrane Collaboration. We used severalmethods to reduce bias from the initial preparatory stageuntil the final report (i.e., protocol registration, comprehen-sive literature search, duplicate data abstraction, and prespecifiedcriteria for methodologic assessment and analysis). We did notimpose restrictions by language or year of publication. Attemptswere made to identify unpublished trials. However, this review hassome limitations. The methodologic quality of the included trialsvaried. Potential limitations include unclear sequence generation,unclear allocation concealment and blinding, small samplesizes, lack of sample size calculations, and high dropout rates insome trials, including the CHOP trial. Despite the fact that anumber of trials met the inclusion criteria, our conclusions afterthe infancy period are based solely on the results of one RCT (theonly experimental study with a large sample size and longerfollow-up). It is worth mentioning that the sample sizes of theincluded studies varied, and that sample size in the CHOP studywas greater than the total number of participants of all otherincluded studies. We observed a great deal of heterogeneity inthe protein concentrations in the formulas used in differentstudies, with the protein amount being the same in groupsconsuming lower- and higher-protein formula, depending on thestudy in some cases. Therefore, our review cannot provide ananswer to the question of what the particular and optimalamount of protein to be included in infant formulas should be.
Another important aspect raised by our review is that notonly protein quantity, but also protein quality, must be takeninto account to secure a sufficient amount of essential aminoacids to support adequate growth and safety in infants. Stud-ies that use the Indicator Amino Acid Oxidation method todetermine the actual requirement of each essential amino acid inneonates have shown that infant formulas that are currentlyused may not contain the optimal amino acid composition andmay provide an amount of essential amino acids that is too high(35–37). However, a detailed analysis of the amino acid contentof formula was outside the scope of our review. Also, we haveexcluded from our analysis a number of studies in whichadditional differences between the groups were present, such asenriched milk formula (with a-lactalbumin, for example) orformula with extra components added (see exclusion criteria),apart from quantitative protein modifications, differences inthe whey-to-casein ratio, and other differences in composition
secondary to the protein amount changes (in order to achieve anisocaloric formula). These restrictive criteria were developed toreduce the great heterogeneity between the included studies.However, we realize that these data may be a substantialaddition to this complex issue. Finally, we analyzed only oneaspect of protein intake provided by milk formula consumption,whereas other sources of protein in the diet also play animportant role after the introduction of complementary feeding.
Agreement and disagreement with other studies orreviews. The findings of this review are in accordance with 2recently published reviews. The first review by Hornell et al.(38), published in 2013, focused on protein intake in the diet(not only in milk formula) of children of different ages (0–18 y)and its relation to health based on both experimental andobservational studies. The authors concluded that higherprotein intake during infancy is associated with increasedgrowth, a higher BMI during childhood, and an increased riskof being overweight later in life. The second review by Abramset al. (39), published when this manuscript was in the final stagesof preparation, addressed the effect of the intake of low-proteinand low-energy formula by full-term infants on growth. Sixpublications were included in that review. Based on the findingsfrom 4 RCTs, the authors concluded that the use of infantformulas with concentrations of protein and energy slightlybelow historical standards in the United States results inadequate growth during infancy and early childhood. Theauthors also stated that ‘‘Further long-term research is needed toassess the impact of the use of lower-protein and/or lower-energyproducts, especially for nutritionally at-risk populations such aspreterm infants and infants who are born small forgestational age’’ (39). Although the authors asked a similarquestion to the one that is the subject of our review, theirapproach differed. The search was limited to 3 electronicdatabases only (i.e., Medline, Cochrane, and the CumulativeIndex to Nursing and Allied Health Literature). Furthermore,the set of key words used for searching differed, as well as theinclusion and exclusion criteria, resulting in the differencesobserved in the number of identified trials (4 studies in thereview by Abrams et al. (39) compared with 12 trials identifiedin this review). This was not unexpected, because it is wellknown that small differences in search strategies may result insubstantial differences in the set of trials identified. Nevertheless,taken together, all 3 reviews clearly prove how complex the issueof protein intake can be and leave room for more evidence andother systematic analyses to answer the questions that remainunanswered.
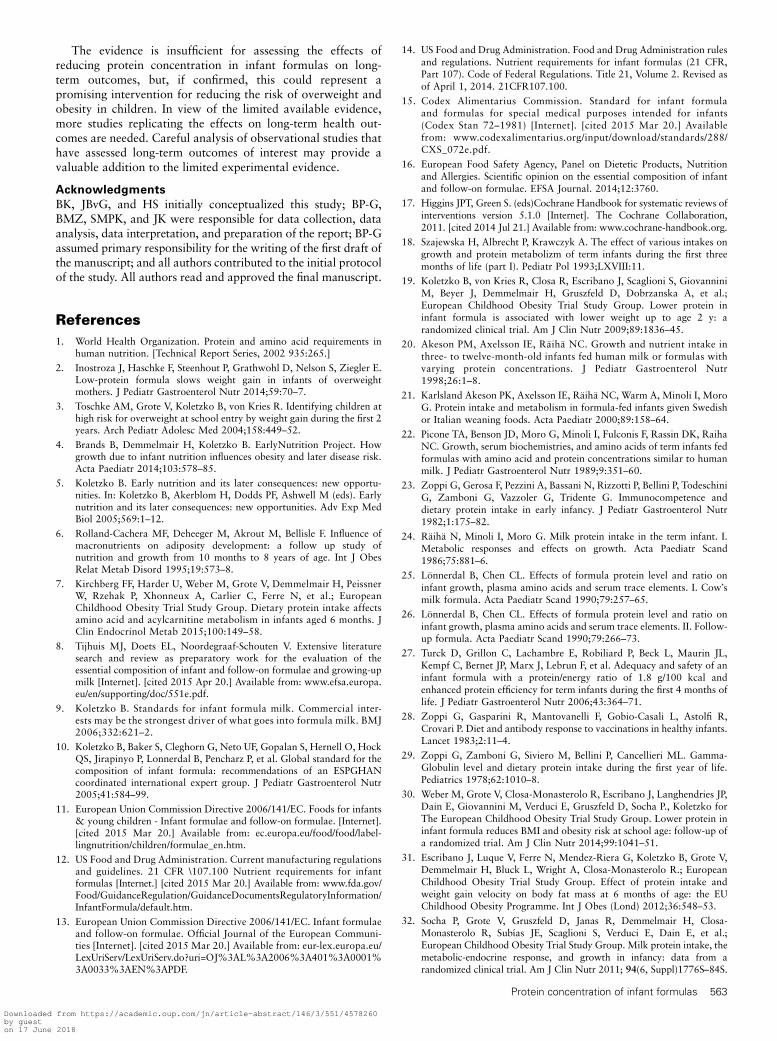
TABLE 4 Effects of different protein concentrations in infant formulas on lipid profile, IGF-I axis, and kidney size assessed duringinfancy1
Reference Outcome Results
Zoppi et al. (23) Serum cholesterol and TG concentrations at 5 mo of age Observed values largely within normal range
Concentrations reflected amount of protein consumed
No statistically significant difference between the study
groups observed
CHOP (32) IGF-I axis Higher protein intake stimulates IGF-I axis and insulin release
CHOP (33, 34) Kidney size (at 6 mo of age) Significantly increased kidney size in infants who consumed
a higher-protein formula
IGF-I in part mediates protein-induced kidney growth
Effect of higher protein intake during early infancy on long-term
kidney function requires further evaluation
1 CHOP, EU Childhood Obesity Programme; IGF-I insulin-like growth factor I.
562 Patro-Go1ab et al.
Downloaded from https://academic.oup.com/jn/article-abstract/146/3/551/4578260by gueston 17 June 2018
The evidence is insufficient for assessing the effects ofreducing protein concentration in infant formulas on long-term outcomes, but, if confirmed, this could represent apromising intervention for reducing the risk of overweight andobesity in children. In view of the limited available evidence,more studies replicating the effects on long-term health out-comes are needed. Careful analysis of observational studies thathave assessed long-term outcomes of interest may provide avaluable addition to the limited experimental evidence.
Acknowledgments
BK, JBvG, and HS initially conceptualized this study; BP-G,BMZ, SMPK, and JK were responsible for data collection, dataanalysis, data interpretation, and preparation of the report; BP-Gassumed primary responsibility for the writing of the first draft ofthe manuscript; and all authors contributed to the initial protocolof the study. All authors read and approved the final manuscript.
References
1. World Health Organization. Protein and amino acid requirements inhuman nutrition. [Technical Report Series, 2002 935:265.]
2. Inostroza J, Haschke F, Steenhout P, Grathwohl D, Nelson S, Ziegler E.Low-protein formula slows weight gain in infants of overweightmothers. J Pediatr Gastroenterol Nutr 2014;59:70–7.
3. Toschke AM, Grote V, Koletzko B, von Kries R. Identifying children athigh risk for overweight at school entry by weight gain during the first 2years. Arch Pediatr Adolesc Med 2004;158:449–52.
4. Brands B, Demmelmair H, Koletzko B. EarlyNutrition Project. Howgrowth due to infant nutrition influences obesity and later disease risk.Acta Paediatr 2014;103:578–85.
5. Koletzko B. Early nutrition and its later consequences: new opportu-nities. In: Koletzko B, Akerblom H, Dodds PF, Ashwell M (eds). Earlynutrition and its later consequences: new opportunities. Adv Exp MedBiol 2005;569:1–12.
6. Rolland-Cachera MF, Deheeger M, Akrout M, Bellisle F. Influence ofmacronutrients on adiposity development: a follow up study ofnutrition and growth from 10 months to 8 years of age. Int J ObesRelat Metab Disord 1995;19:573–8.
7. Kirchberg FF, Harder U, Weber M, Grote V, Demmelmair H, PeissnerW, Rzehak P, Xhonneux A, Carlier C, Ferre N, et al.; EuropeanChildhood Obesity Trial Study Group. Dietary protein intake affectsamino acid and acylcarnitine metabolism in infants aged 6 months. JClin Endocrinol Metab 2015;100:149–58.
8. Tijhuis MJ, Doets EL, Noordegraaf-Schouten V. Extensive literaturesearch and review as preparatory work for the evaluation of theessential composition of infant and follow-on formulae and growing-upmilk [Internet]. [cited 2015 Apr 20.] Available from: www.efsa.europa.eu/en/supporting/doc/551e.pdf.
9. Koletzko B. Standards for infant formula milk. Commercial inter-ests may be the strongest driver of what goes into formula milk. BMJ2006;332:621–2.
10. Koletzko B, Baker S, Cleghorn G, Neto UF, Gopalan S, Hernell O, HockQS, Jirapinyo P, Lonnerdal B, Pencharz P, et al. Global standard for thecomposition of infant formula: recommendations of an ESPGHANcoordinated international expert group. J Pediatr Gastroenterol Nutr2005;41:584–99.
11. European Union Commission Directive 2006/141/EC. Foods for infants& young children - Infant formulae and follow-on formulae. [Internet].[cited 2015 Mar 20.] Available from: ec.europa.eu/food/food/label-lingnutrition/children/formulae_en.htm.
12. US Food and Drug Administration. Current manufacturing regulationsand guidelines. 21 CFR \107.100 Nutrient requirements for infantformulas [Internet.] [cited 2015 Mar 20.] Available from: www.fda.gov/Food/GuidanceRegulation/GuidanceDocumentsRegulatoryInformation/InfantFormula/default.htm.
13. European Union Commission Directive 2006/141/EC. Infant formulaeand follow-on formulae. Official Journal of the European Communi-ties [Internet]. [cited 2015 Mar 20.] Available from: eur-lex.europa.eu/LexUriServ/LexUriServ.do?uri=OJ%3AL%3A2006%3A401%3A0001%3A0033%3AEN%3APDF.
14. US Food and Drug Administration. Food and Drug Administration rulesand regulations. Nutrient requirements for infant formulas (21 CFR,Part 107). Code of Federal Regulations. Title 21, Volume 2. Revised asof April 1, 2014. 21CFR107.100.
15. Codex Alimentarius Commission. Standard for infant formulaand formulas for special medical purposes intended for infants(Codex Stan 72–1981) [Internet]. [cited 2015 Mar 20.] Availablefrom: www.codexalimentarius.org/input/download/standards/288/CXS_072e.pdf.
16. European Food Safety Agency, Panel on Dietetic Products, Nutritionand Allergies. Scientific opinion on the essential composition of infantand follow-on formulae. EFSA Journal. 2014;12:3760.
17. Higgins JPT, Green S. (eds)Cochrane Handbook for systematic reviews ofinterventions version 5.1.0 [Internet]. The Cochrane Collaboration,2011. [cited 2014 Jul 21.] Available from: www.cochrane-handbook.org.
18. Szajewska H, Albrecht P, Krawczyk A. The effect of various intakes ongrowth and protein metabolizm of term infants during the first threemonths of life (part I). Pediatr Pol 1993;LXVIII:11.
19. Koletzko B, von Kries R, Closa R, Escribano J, Scaglioni S, GiovanniniM, Beyer J, Demmelmair H, Gruszfeld D, Dobrzanska A, et al.;European Childhood Obesity Trial Study Group. Lower protein ininfant formula is associated with lower weight up to age 2 y: arandomized clinical trial. Am J Clin Nutr 2009;89:1836–45.
20. Akeson PM, Axelsson IE, Raiha NC. Growth and nutrient intake inthree- to twelve-month-old infants fed human milk or formulas withvarying protein concentrations. J Pediatr Gastroenterol Nutr1998;26:1–8.
21. Karlsland Akeson PK, Axelsson IE, Raiha NC, Warm A, Minoli I, MoroG. Protein intake and metabolism in formula-fed infants given Swedishor Italian weaning foods. Acta Paediatr 2000;89:158–64.
22. Picone TA, Benson JD, Moro G, Minoli I, Fulconis F, Rassin DK, RaihaNC. Growth, serum biochemistries, and amino acids of term infants fedformulas with amino acid and protein concentrations similar to humanmilk. J Pediatr Gastroenterol Nutr 1989;9:351–60.
23. Zoppi G, Gerosa F, Pezzini A, Bassani N, Rizzotti P, Bellini P, TodeschiniG, Zamboni G, Vazzoler G, Tridente G. Immunocompetence anddietary protein intake in early infancy. J Pediatr Gastroenterol Nutr1982;1:175–82.
24. Raiha N, Minoli I, Moro G. Milk protein intake in the term infant. I.Metabolic responses and effects on growth. Acta Paediatr Scand1986;75:881–6.
25. Lonnerdal B, Chen CL. Effects of formula protein level and ratio oninfant growth, plasma amino acids and serum trace elements. I. Cow�smilk formula. Acta Paediatr Scand 1990;79:257–65.
26. Lonnerdal B, Chen CL. Effects of formula protein level and ratio oninfant growth, plasma amino acids and serum trace elements. II. Follow-up formula. Acta Paediatr Scand 1990;79:266–73.
27. Turck D, Grillon C, Lachambre E, Robiliard P, Beck L, Maurin JL,Kempf C, Bernet JP, Marx J, Lebrun F, et al. Adequacy and safety of aninfant formula with a protein/energy ratio of 1.8 g/100 kcal andenhanced protein efficiency for term infants during the first 4 months oflife. J Pediatr Gastroenterol Nutr 2006;43:364–71.
28. Zoppi G, Gasparini R, Mantovanelli F, Gobio-Casali L, Astolfi R,Crovari P. Diet and antibody response to vaccinations in healthy infants.Lancet 1983;2:11–4.
29. Zoppi G, Zamboni G, Siviero M, Bellini P, Cancellieri ML. Gamma-Globulin level and dietary protein intake during the first year of life.Pediatrics 1978;62:1010–8.
30. Weber M, Grote V, Closa-Monasterolo R, Escribano J, Langhendries JP,Dain E, Giovannini M, Verduci E, Gruszfeld D, Socha P., Koletzko forThe European Childhood Obesity Trial Study Group. Lower protein ininfant formula reduces BMI and obesity risk at school age: follow-up ofa randomized trial. Am J Clin Nutr 2014;99:1041–51.
31. Escribano J, Luque V, Ferre N, Mendez-Riera G, Koletzko B, Grote V,Demmelmair H, Bluck L, Wright A, Closa-Monasterolo R.; EuropeanChildhood Obesity Trial Study Group. Effect of protein intake andweight gain velocity on body fat mass at 6 months of age: the EUChildhood Obesity Programme. Int J Obes (Lond) 2012;36:548–53.
32. Socha P, Grote V, Gruszfeld D, Janas R, Demmelmair H, Closa-Monasterolo R, Subıas JE, Scaglioni S, Verduci E, Dain E, et al.;European Childhood Obesity Trial Study Group. Milk protein intake, themetabolic-endocrine response, and growth in infancy: data from arandomized clinical trial. Am J Clin Nutr 2011; 94(6, Suppl)1776S–84S.
Protein concentration of infant formulas 563
Downloaded from https://academic.oup.com/jn/article-abstract/146/3/551/4578260by gueston 17 June 2018
33. Luque V, Escribano J, Grote V, Ferre N, Koletzko B, Gruszfeld D,
Socha P, Langhendries JP, Goyens P, Closa-Monasterolo R.; Euro-
pean Childhood Obesity Project. Does insulin-like growth factor-
1 mediate protein-induced kidney growth in infants? A secondary
analysis from a randomized controlled trial. Pediatr Res 2013;74:
223–9.
34. Escribano J, Luque V, Ferre N, Zaragoza-Jordana M, Grote V, Koletzko
B, Gruszfeld D, Socha P, Dain E, Van Hees JN, et al. Increased protein
intake augments kidney volume and function in healthy infants. Kidney
Int 2011;79:783–90.
35. de Groof F, Huang L, van Vliet I, Voortman GJ, Schierbeek H,
Roksnoer LC, Vermes A, Chen C, Huang Y, van Goudoever JB.
Branched-chain amino acid requirements for enterally fed term neonates
in the first month of life. Am J Clin Nutr 2014;99:62–70.
36. Huang L, Hogewind-Schoonenboom JE, de Groof F, Twisk JW,
Voortman GJ, Dorst K, Schierbeek H, Boehm G, Huang Y, Chen C,
et al. Lysine requirement of the enterally fed term infant in the first
month of life. Am J Clin Nutr 2011;94:1496–503.
37. Huang L, Hogewind-Schoonenboom JE, van Dongen MJ, de Groof F,
Voortman GJ, Schierbeek H, Twisk JW, Vermes A, Chen C, Huang Y, et al.
Methionine requirement of the enterally fed term infant in the first month
of life in the presence of cysteine. Am J Clin Nutr 2012;95:1048–54.
38. Hornell A, Lagstrom H, Lande B, Thorsdottir I. Protein intake from 0 to
18 years of age and its relation to health: a systematic literature review for
the 5th Nordic Nutrition Recommendations. Food Nutr Res 2013;57:.
39. Abrams SA, Hawthorne KM, Pammi M. A systematic review of
controlled trials of lower-protein or energy-containing infant formulas
for use by healthy full-term infants. Adv Nutr 2015;6:178–88.
564 Patro-Go1ab et al.
Downloaded from https://academic.oup.com/jn/article-abstract/146/3/551/4578260by gueston 17 June 2018