protein bioinformatics: evolution - departmentsiruczins/teaching/260.655/notes/pevsner11... ·...
TRANSCRIPT

1
Protein bioinformatics: evolution
Tuesday, April 11, 2006
Protein Bioinformatics260.655
Jonathan [email protected]
Outline
Sean Prigge described properties of amino acids, andan example of a multiple sequence alignment (globins).
Today we will discuss amino acid properties, and protein relatedness from an evolutionary perspective.
1. Pairwise alignment of proteins
2. Scoring matrices: how related are amino acids?
3. Multiple sequence alignment of proteins
4. From multiple sequence alignment to phylogenetic tree
Outline
2
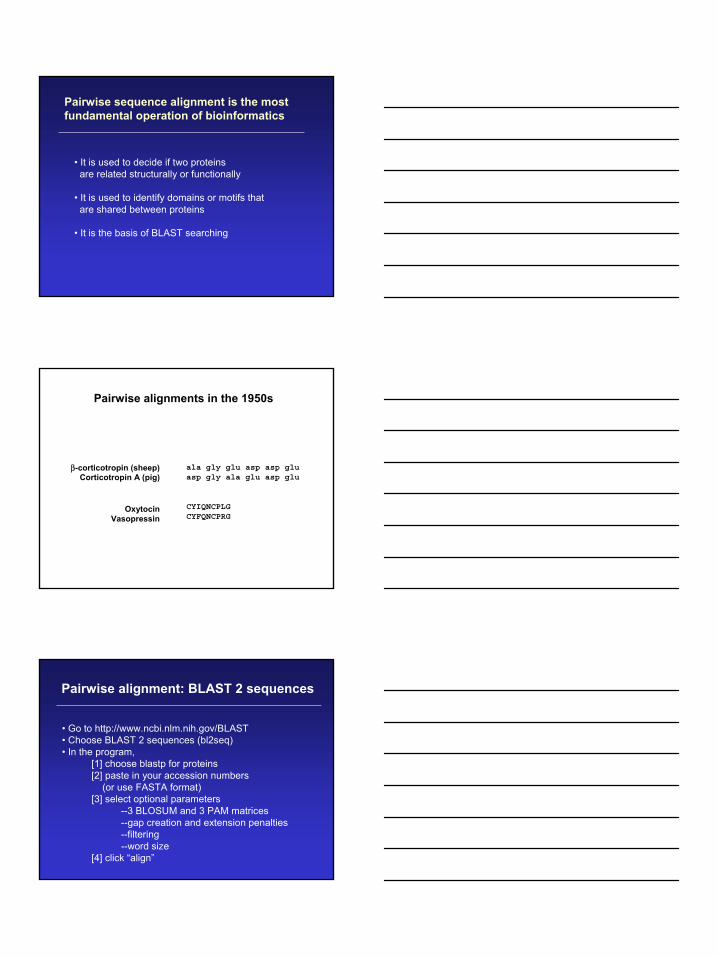
• It is used to decide if two proteinsare related structurally or functionally
• It is used to identify domains or motifs thatare shared between proteins
• It is the basis of BLAST searching
Pairwise sequence alignment is the most fundamental operation of bioinformatics
Pairwise alignments in the 1950s
β-corticotropin (sheep)Corticotropin A (pig)
ala gly glu asp asp gluasp gly ala glu asp glu
OxytocinVasopressin
CYIQNCPLGCYFQNCPRG
• Go to http://www.ncbi.nlm.nih.gov/BLAST• Choose BLAST 2 sequences (bl2seq)• In the program,
[1] choose blastp for proteins[2] paste in your accession numbers
(or use FASTA format)[3] select optional parameters
--3 BLOSUM and 3 PAM matrices--gap creation and extension penalties--filtering--word size
[4] click “align”
Pairwise alignment: BLAST 2 sequences

3
Paste in an accessionnumber…
…or sequence (FASTA)
click align
Set program toblastp (proteins)
first sequence
identity + positives
second sequence
graphical overviewsof pairwise alignment
score is based on scoring matrixExpect is ≈ probability value

4
retinol-binding protein 4(NP_006735)
β-lactoglobulin(P02754)
Pairwise alignmentThe process of lining up two or more sequences to achieve maximal levels of identity (and conservation, in the case of amino acid sequences) for the purpose of assessing the degree of similarity and the possibility of homology.
Definitions
HomologySimilarity attributed to descent from a common ancestor.
Definitions
IdentityThe extent to which two (nucleotide or amino acid) sequences are invariant.
RBP: 26 RVKENFDKARFSGTWYAMAKKDPEGLFLQDNIVA 59 + K++ + ++ GTW++MA + L + A
glycodelin: 23 QTKQDLELPKLAGTWHSMAMA-TNNISLMATLKA 55

5
OrthologsHomologous sequences in different species that arose from a common ancestral gene during speciation; may or may not be responsible for a similar function.
ParalogsHomologous sequences within a single species that arose by gene duplication.
Definitions: two types of homologs
Orthologs:members of a protein (or gene)family in variousorganisms.This tree showsRBP orthologs.
common carp
zebrafish
rainbow trout
teleost
African clawed frog
chicken
mouserat
rabbitcowpighorsehuman
10 changes
Paralogs:members of a protein (gene)family within aspecies
apolipoprotein D
retinol-bindingprotein 4
Complementcomponent 8
prostaglandinD2 synthase
neutrophilgelatinase-associatedlipocalin
10 changesLipocalin 1Odorant-bindingprotein 2A
progestagen-associatedendometrialprotein
Alpha-1Microglobulin/bikunin

6
Source: NCBI website
SimilarityThe extent to which nucleotide or protein sequences are related. It is based upon identity plus conservation.
IdentityThe extent to which two sequences are invariant.
ConservationChanges at a specific position of an amino acid sequence that preserve the physico-chemical properties of the original residue.
Definitions
1 MKWVWALLLLAAWAAAERDCRVSSFRVKENFDKARFSGTWYAMAKKDPEG 50 RBP. ||| | . |. . . | : .||||.:| :
1 ...MKCLLLALALTCGAQALIVT..QTMKGLDIQKVAGTWYSLAMAASD. 44 lactoglobulin
51 LFLQDNIVAEFSVDETGQMSATAKGRVR.LLNNWD..VCADMVGTFTDTE 97 RBP: | | | | :: | .| . || |: || |.
45 ISLLDAQSAPLRV.YVEELKPTPEGDLEILLQKWENGECAQKKIIAEKTK 93 lactoglobulin
98 DPAKFKMKYWGVASFLQKGNDDHWIVDTDYDTYAV...........QYSC 136 RBP|| ||. | :.|||| | . .|
94 IPAVFKIDALNENKVL........VLDTDYKKYLLFCMENSAEPEQSLAC 135 lactoglobulin
137 RLLNLDGTCADSYSFVFSRDPNGLPPEAQKIVRQRQ.EELCLARQYRLIV 185 RBP. | | | : || . | || |
136 QCLVRTPEVDDEALEKFDKALKALPMHIRLSFNPTQLEEQCHI....... 178 lactoglobulin
Somewhatsimilar
(one dot)
Verysimilar
(two dots)Identity
(bar)
Terminalgap
Internalgap
Pairwise alignment of retinol-binding protein 4 and β-lactoglobulin: explaining the dots and dashes

7
• Positions at which a letter is paired with a null are called gaps.
• Gap scores are typically negative.
• Since a single mutational event may cause the insertion or deletion of more than one residue, the presence of a gap is ascribed more significance than the length of the gap.
• In BLAST, it is rarely necessary to change gap values from the default.
Gaps
1 .MKWVWALLLLA.AWAAAERDCRVSSFRVKENFDKARFSGTWYAMAKKDP 48:: || || || .||.||. .| :|||:.|:.| |||.|||||
1 MLRICVALCALATCWA...QDCQVSNIQVMQNFDRSRYTGRWYAVAKKDP 47. . . . .
49 EGLFLQDNIVAEFSVDETGQMSATAKGRVRLLNNWDVCADMVGTFTDTED 98|||| ||:||:|||||.|.|.||| ||| :||||:.||.| ||| || |
48 VGLFLLDNVVAQFSVDESGKMTATAHGRVIILNNWEMCANMFGTFEDTPD 97. . . . .
99 PAKFKMKYWGVASFLQKGNDDHWIVDTDYDTYAVQYSCRLLNLDGTCADS 148||||||:||| ||:|| ||||||::||||| ||: |||| ..||||| |
98 PAKFKMRYWGAASYLQTGNDDHWVIDTDYDNYAIHYSCREVDLDGTCLDG 147. . . . .
149 YSFVFSRDPNGLPPEAQKIVRQRQEELCLARQYRLIVHNGYCDGRSERNLL 199|||:||| | || || |||| :..|:| .|| : | |:|:
148 YSFIFSRHPTGLRPEDQKIVTDKKKEICFLGKYRRVGHTGFCESS...... 192
Pairwise alignment of retinol-binding protein from human (top) and rainbow trout (O. mykiss):
two closely related proteins
General approach to pairwise alignment
• Choose two sequences• Select an algorithm that generates a score• Allow gaps (insertions, deletions)• Score reflects degree of similarity• Alignments can be global (Needleman and Wunsch,1970) or local (Smith and Waterman, 1981)
• Estimate probability that the alignmentoccurred by chance

8
Calculation of an alignment score
Source: http://www.ncbi.nlm.nih.gov/Education/BLASTinfo/Alignment_Scores2.html
1. Pairwise alignment of proteins
2. Scoring matrices: how related are amino acids?
3. Multiple sequence alignment of proteins
4. From multiple sequence alignment to phylogenetic tree
Outline
How do we decide what scores to assignin pairwise alignments?
• Zuckerkandl and Pauling (1965) made a multiple sequence alignment of hemoglobin and myoglobinfrom primates, horse, cattle, pig, lamprey, and carp. They made a “scoring matrix.”
• Margaret Dayhoff and colleagues (1960s, 1970s) studied dozens of families of proteins to create scoring matrices that describe the relationship of well-conserved (or poorly-conserved) protein families.

9
fly GAKKVIISAP SAD.APM..F VCGVNLDAYK PDMKVVSNAS CTTNCLAPLAhuman GAKRVIISAP SAD.APM..F VMGVNHEKYD NSLKIISNAS CTTNCLAPLAplant GAKKVIISAP SAD.APM..F VVGVNEHTYQ PNMDIVSNAS CTTNCLAPLAbacterium GAKKVVMTGP SKDNTPM..F VKGANFDKY. AGQDIVSNAS CTTNCLAPLAyeast GAKKVVITAP SS.TAPM..F VMGVNEEKYT SDLKIVSNAS CTTNCLAPLAarchaeon GADKVLISAP PKGDEPVKQL VYGVNHDEYD GE.DVVSNAS CTTNSITPVA
fly KVINDNFEIV EGLMTTVHAT TATQKTVDGP SGKLWRDGRG AAQNIIPASThuman KVIHDNFGIV EGLMTTVHAI TATQKTVDGP SGKLWRDGRG ALQNIIPASTplant KVVHEEFGIL EGLMTTVHAT TATQKTVDGP SMKDWRGGRG ASQNIIPSSTbacterium KVINDNFGII EGLMTTVHAT TATQKTVDGP SHKDWRGGRG ASQNIIPSSTyeast KVINDAFGIE EGLMTTVHSL TATQKTVDGP SHKDWRGGRT ASGNIIPSSTarchaeon KVLDEEFGIN AGQLTTVHAY TGSQNLMDGP NGKP.RRRRA AAENIIPTST
fly GAAKAVGKVI PALNGKLTGM AFRVPTPNVS VVDLTVRLGK GASYDEIKAKhuman GAAKAVGKVI PELNGKLTGM AFRVPTANVS VVDLTCRLEK PAKYDDIKKVplant GAAKAVGKVL PELNGKLTGM AFRVPTSNVS VVDLTCRLEK GASYEDVKAAbacterium GAAKAVGKVL PELNGKLTGM AFRVPTPNVS VVDLTVRLEK AATYEQIKAAyeast GAAKAVGKVL PELQGKLTGM AFRVPTVDVS VVDLTVKLNK ETTYDEIKKVarchaeon GAAQAATEVL PELEGKLDGM AIRVPVPNGS ITEFVVDLDD DVTESDVNAA
Multiple sequence alignment ofglyceraldehyde 3-phosphate dehydrogenases
Studying conserved (and nonconserved) residues in closely related families may reveal “rules” for amino
acid substitutions accepted by natural selection
~~~~~EIQDVSGTWYAMTVDREFPEMNLESVTPMTLTTL.GGNLEAKVTM lipocalin 1 LSFTLEEEDITGTWYAMVVDKDFPEDRRRKVSPVKVTALGGGNLEATFTF odorant-binding protein 2aTKQDLELPKLAGTWHSMAMATNNISLMATLKAPLRVHITSEDNLEIVLHR progestagen-assoc. endo.VQENFDVNKYLGRWYEIEKIPTTFENGRCIQANYSLMENGNQELRADGTV apolipoprotein DVKENFDKARFSGTWYAMAKDPEGLFLQDNIVAEFSVDETGNWDVCADGTF retinol-binding proteinLQQNFQDNQFQGKWYVVGLAGNAI.LREDKDPQKMYATIDKSYNVTSVLF neutrophil gelatinase-ass.VQPNFQQDKFLGRWFSAGLASNSSWLREKKAALSMCKSVDGGLNLTSTFL prostaglandin D2 synthaseVQENFNISRIYGKWYNLAIGSTCPWMDRMTVSTLVLGEGEAEISMTSTRW alpha-1-microglobulinPKANFDAQQFAGTWLLVAVGSACRFLQRAEATTLHVAPQGSTFRKLD... complement component 8
Multiple sequence alignment ofhuman lipocalin paralogs
Studying conserved (and nonconserved) residues in distantly related families is also informative
substitution never observedsubstitution rarely observed (<20%)very conservative substitution (>40%)
Substituent residue (percentage of total residue sites at which the substituent occurs)
Seq
uenc
e (o
rigin
al a
min
o ac
id)

10
PAM matrices are based on global alignments of closely related proteins.
The PAM1 is the matrix calculated from comparisons of sequences with no more than 1% divergence.
Other PAM matrices are extrapolated from PAM1.
All the PAM data come from closely related proteins(>85% amino acid identity)
PAM matrices:Point-accepted mutations
Dayhoff’s 34 protein superfamilies
Protein PAMs per 100 million yearsper 100 aa residues
Ig kappa chain 37kappa casein 33luteinizing hormone b 30lactalbumin 27complement component 3 27epidermal growth factor 26proopiomelanocortin 21pancreatic ribonuclease 21haptoglobin alpha 20serum albumin 19phospholipase A2, group IB 19prolactin 17carbonic anhydrase C 16hemoglobin α 12hemoglobin β 12
Dayhoff’s 34 protein superfamilies
Protein PAMs per 100 million yearsper 100 aa residues
apolipoprotein A-II 10lysozyme 9.8gastrin 9.8myoglobin 8.9nerve growth factor 8.5myelin basic protein 7.4thyroid stimulating hormone b 7.4parathyroid hormone 7.3parvalbumin 7.0trypsin 5.9insulin 4.4calcitonin 4.3arginine vasopressin 3.6adenylate kinase 1 3.2

11
Dayhoff’s 34 protein superfamilies
Protein PAMs per 100 million yearsper 100 aa residues
triosephosphate isomerase 1 2.8vasoactive intestinal peptide 2.6glyceraldehyde phosph. dehydrogease 2.2cytochrome c 2.2collagen 1.7troponin C, skeletal muscle 1.5alpha crystallin B chain 1.5glucagon 1.2glutamate dehydrogenase 0.9histone H2B, member Q 0.9ubiquitin 0
AAla
RArg
NAsn
DAsp
CCys
QGln
EGlu
GGly
AR 30
N 109 17
D 154 0 532
C 33 10 0 0
Q 93 120 50 76 0
E 266 0 94 831 0 422
G 579 10 156 162 10 30 112
H 21 103 226 43 10 243 23 10
Dayhoff’s numbers of “accepted point mutations”:what amino acid substitutions occur in proteins?
fly GAKKVIISAP SAD.APM..F VCGVNLDAYK PDMKVVSNAS CTTNCLAPLAhuman GAKRVIISAP SAD.APM..F VMGVNHEKYD NSLKIISNAS CTTNCLAPLAplant GAKKVIISAP SAD.APM..F VVGVNEHTYQ PNMDIVSNAS CTTNCLAPLAbacterium GAKKVVMTGP SKDNTPM..F VKGANFDKY. AGQDIVSNAS CTTNCLAPLA yeast GAKKVVITAP SS.TAPM..F VMGVNEEKYT SDLKIVSNAS CTTNCLAPLAarchaeon GADKVLISAP PKGDEPVKQL VYGVNHDEYD GE.DVVSNAS CTTNSITPVA
fly KVINDNFEIV EGLMTTVHAT TATQKTVDGP SGKLWRDGRG AAQNIIPASThuman KVIHDNFGIV EGLMTTVHAI TATQKTVDGP SGKLWRDGRG ALQNIIPASTplant KVVHEEFGIL EGLMTTVHAT TATQKTVDGP SMKDWRGGRG ASQNIIPSSTbacterium KVINDNFGII EGLMTTVHAT TATQKTVDGP SHKDWRGGRG ASQNIIPSSTyeast KVINDAFGIE EGLMTTVHSL TATQKTVDGP SHKDWRGGRT ASGNIIPSSTarchaeon KVLDEEFGIN AGQLTTVHAY TGSQNLMDGP NGKP.RRRRA AAENIIPTST
fly GAAKAVGKVI PALNGKLTGM AFRVPTPNVS VVDLTVRLGK GASYDEIKAK human GAAKAVGKVI PELNGKLTGM AFRVPTANVS VVDLTCRLEK PAKYDDIKKVplant GAAKAVGKVL PELNGKLTGM AFRVPTSNVS VVDLTCRLEK GASYEDVKAA bacterium GAAKAVGKVL PELNGKLTGM AFRVPTPNVS VVDLTVRLEK AATYEQIKAA yeast GAAKAVGKVL PELQGKLTGM AFRVPTVDVS VVDLTVKLNK ETTYDEIKKVarchaeon GAAQAATEVL PELEGKLDGM AIRVPVPNGS ITEFVVDLDD DVTESDVNAA
Multiple sequence alignment ofglyceraldehyde 3-phosphate dehydrogenases

12
The relative mutability of amino acids
Asn 134 His 66Ser 120 Arg 65Asp 106 Lys 56Glu 102 Pro 56Ala 100 Gly 49Thr 97 Tyr 41Ile 96 Phe 41Met 94 Leu 40Gln 93 Cys 20Val 74 Trp 18
Normalized frequencies of amino acids
Gly 8.9% Arg* 4.1%Ala 8.7% Asn 4.0%Leu* 8.5% Phe 4.0%Lys 8.1% Gln 3.8%Ser* 7.0% Ile 3.7%Val 6.5% His 3.4%Thr 5.8% Cys 3.3%Pro 5.1% Tyr 3.0%Glu 5.0% Met† 1.5%Asp 4.7% Trp† 1.0%
blue*=6 codons; red†=1 codon

13
AAla
RArg
NAsn
DAsp
CCys
QGln
EGlu
GGly
AR 30
N 109 17
D 154 0 532
C 33 10 0 0
Q 93 120 50 76 0
E 266 0 94 831 0 422
G 579 10 156 162 10 30 112
H 21 103 226 43 10 243 23 10
Dayhoff’s numbers of “accepted point mutations”:what amino acid substitutions occur in proteins?
Dayhoff’s PAM1 mutation probability matrix
AAla
RArg
NAsn
DAsp
CCys
QGln
EGlu
GGly
HHis
A 9867 2 9 10 3 8 17 21 2
R 1 9913 1 0 1 10 0 0 10
N 4 1 9822 36 0 4 6 6 21
D 6 0 42 9859 0 6 53 6 4
C 1 1 0 0 9973 0 0 0 1
Q 3 9 4 5 0 9876 27 1 23
E 10 0 7 56 0 35 9865 4 2
G 21 1 12 11 1 3 7 9935 1
H 1 8 18 3 1 20 1 0 9912
I 2 2 3 1 2 1 2 0 0
Each element of the matrix shows the probability that an originalamino acid (top) will be replaced by another amino acid (side)
A substitution matrix contains values proportional to the probability that amino acid i mutates into amino acid j for all pairs of amino acids.
Substitution matrices are constructed by assembling a large and diverse sample of verified pairwise alignments(or multiple sequence alignments) of amino acids.
Substitution matrices should reflect the true probabilities of mutations occurring through a period of evolution.
The two major types of substitution matrices arePAM and BLOSUM.
Substitution Matrix

14
PAM matrices are based on global alignments of closely related proteins.
The PAM1 is the matrix calculated from comparisons of sequences with no more than 1% divergence.
Other PAM matrices are extrapolated from PAM1.
All the PAM data come from closely related proteins(>85% amino acid identity)
PAM matrices:Point-accepted mutations
Dayhoff’s PAM0 mutation probability matrix:the rules for extremely slowly evolving proteins
PAM0 AAla
RArg
NAsn
DAsp
CCys
QGln
EGlu
A 100% 0% 0% 0% 0% 0% 0%R 0% 100% 0% 0% 0% 0% 0%N 0% 0% 100% 0% 0% 0% 0%D 0% 0% 0% 100% 0% 0% 0%C 0% 0% 0% 0% 100% 0% 0%Q 0% 0% 0% 0% 0% 100% 0%E 0% 0% 0% 0% 0% 0% 100%G 0% 0% 0% 0% 0% 0% 0%
Top: original amino acidSide: replacement amino acid
Dayhoff’s PAM2000 mutation probability matrix:the rules for very distantly related proteins
PAM∞ AAla
RArg
NAsn
DAsp
CCys
QGln
EGlu
GGly
A 8.7% 8.7% 8.7% 8.7% 8.7% 8.7% 8.7% 8.7%R 4.1% 4.1% 4.1% 4.1% 4.1% 4.1% 4.1% 4.1%N 4.0% 4.0% 4.0% 4.0% 4.0% 4.0% 4.0% 4.0%D 4.7% 4.7% 4.7% 4.7% 4.7% 4.7% 4.7% 4.7%C 3.3% 3.3% 3.3% 3.3% 3.3% 3.3% 3.3% 3.3%Q 3.8% 3.8% 3.8% 3.8% 3.8% 3.8% 3.8% 3.8%E 5.0% 5.0% 5.0% 5.0% 5.0% 5.0% 5.0% 5.0%G 8.9% 8.9% 8.9% 8.9% 8.9% 8.9% 8.9% 8.9%
Top: original amino acidSide: replacement amino acid
15
PAM250 mutation probability matrix A R N D C Q E G H I L K M F P S T W Y V A 13 6 9 9 5 8 9 12 6 8 6 7 7 4 11 11 11 2 4 9
R 3 17 4 3 2 5 3 2 6 3 2 9 4 1 4 4 3 7 2 2
N 4 4 6 7 2 5 6 4 6 3 2 5 3 2 4 5 4 2 3 3
D 5 4 8 11 1 7 10 5 6 3 2 5 3 1 4 5 5 1 2 3
C 2 1 1 1 52 1 1 2 2 2 1 1 1 1 2 3 2 1 4 2
Q 3 5 5 6 1 10 7 3 7 2 3 5 3 1 4 3 3 1 2 3
E 5 4 7 11 1 9 12 5 6 3 2 5 3 1 4 5 5 1 2 3
G 12 5 10 10 4 7 9 27 5 5 4 6 5 3 8 11 9 2 3 7
H 2 5 5 4 2 7 4 2 15 2 2 3 2 2 3 3 2 2 3 2
I 3 2 2 2 2 2 2 2 2 10 6 2 6 5 2 3 4 1 3 9
L 6 4 4 3 2 6 4 3 5 15 34 4 20 13 5 4 6 6 7 13
K 6 18 10 8 2 10 8 5 8 5 4 24 9 2 6 8 8 4 3 5
M 1 1 1 1 0 1 1 1 1 2 3 2 6 2 1 1 1 1 1 2
F 2 1 2 1 1 1 1 1 3 5 6 1 4 32 1 2 2 4 20 3
P 7 5 5 4 3 5 4 5 5 3 3 4 3 2 20 6 5 1 2 4
S 9 6 8 7 7 6 7 9 6 5 4 7 5 3 9 10 9 4 4 6
T 8 5 6 6 4 5 5 6 4 6 4 6 5 3 6 8 11 2 3 6
W 0 2 0 0 0 0 0 0 1 0 1 0 0 1 0 1 0 55 1 0
Y 1 1 2 1 3 1 1 1 3 2 2 1 2 15 1 2 2 3 31 2
V 7 4 4 4 4 4 4 5 4 15 10 4 10 5 5 5 7 2 4 17
Top: original amino acidSide: replacement amino acid
A 2 R -2 6 N 0 0 2 D 0 -1 2 4 C -2 -4 -4 -5 12 Q 0 1 1 2 -5 4 E 0 -1 1 3 -5 2 4 G 1 -3 0 1 -3 -1 0 5 H -1 2 2 1 -3 3 1 -2 6 I -1 -2 -2 -2 -2 -2 -2 -3 -2 5 L -2 -3 -3 -4 -6 -2 -3 -4 -2 -2 6 K -1 3 1 0 -5 1 0 -2 0 -2 -3 5 M -1 0 -2 -3 -5 -1 -2 -3 -2 2 4 0 6 F -3 -4 -3 -6 -4 -5 -5 -5 -2 1 2 -5 0 9 P 1 0 0 -1 -3 0 -1 0 0 -2 -3 -1 -2 -5 6 S 1 0 1 0 0 -1 0 1 -1 -1 -3 0 -2 -3 1 2 T 1 -1 0 0 -2 -1 0 0 -1 0 -2 0 -1 -3 0 1 3W -6 2 -4 -7 -8 -5 -7 -7 -3 -5 -2 -3 -4 0 -6 -2 -5 17Y -3 -4 -2 -4 0 -4 -4 -5 0 -1 -1 -4 -2 7 -5 -3 -3 0 10V 0 -2 -2 -2 -2 -2 -2 -1 -2 4 2 -2 2 -1 -1 -1 0 -6 -2 4 A R N D C Q E G H I L K M F P S T W Y V
PAM250 log oddsscoring matrix
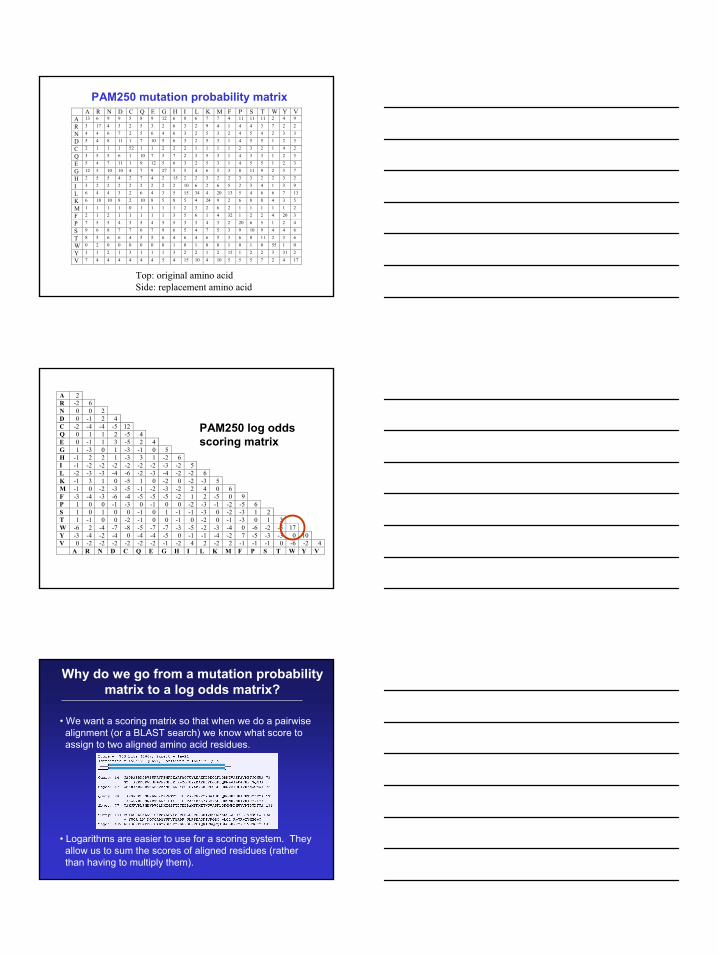
Why do we go from a mutation probabilitymatrix to a log odds matrix?
• We want a scoring matrix so that when we do a pairwisealignment (or a BLAST search) we know what score toassign to two aligned amino acid residues.
• Logarithms are easier to use for a scoring system. They allow us to sum the scores of aligned residues (rather than having to multiply them).

16
How do we go from a mutation probabilitymatrix to a log odds matrix?
• The cells in a log odds matrix consist of an “odds ratio”:
the probability that an alignment is authenticthe probability that the alignment was random
The score S for an alignment of residues a,b is given by:
S(a,b) = 10 log10 (Mab/pb)
As an example, for tryptophan,
S(a,tryptophan) = 10 log10 (0.55/0.010) = 17.4
Normalized frequencies of amino acids
Arg 4.1%Asn 4.0%Phe 4.0%Gln 3.8%Ile 3.7%His 3.4%Cys 3.3%Tyr 3.0%Met 1.5%Trp 1.0%
A R N D C Q E G H I L K M F P S T W Y V A 13 6 9 9 5 8 9 12 6 8 6 7 7 4 11 11 11 2 4 9
R 3 17 4 3 2 5 3 2 6 3 2 9 4 1 4 4 3 7 2 2
N 4 4 6 7 2 5 6 4 6 3 2 5 3 2 4 5 4 2 3 3
D 5 4 8 11 1 7 10 5 6 3 2 5 3 1 4 5 5 1 2 3
C 2 1 1 1 52 1 1 2 2 2 1 1 1 1 2 3 2 1 4 2
Q 3 5 5 6 1 10 7 3 7 2 3 5 3 1 4 3 3 1 2 3
E 5 4 7 11 1 9 12 5 6 3 2 5 3 1 4 5 5 1 2 3
G 12 5 10 10 4 7 9 27 5 5 4 6 5 3 8 11 9 2 3 7
H 2 5 5 4 2 7 4 2 15 2 2 3 2 2 3 3 2 2 3 2
I 3 2 2 2 2 2 2 2 2 10 6 2 6 5 2 3 4 1 3 9
L 6 4 4 3 2 6 4 3 5 15 34 4 20 13 5 4 6 6 7 13
K 6 18 10 8 2 10 8 5 8 5 4 24 9 2 6 8 8 4 3 5
M 1 1 1 1 0 1 1 1 1 2 3 2 6 2 1 1 1 1 1 2
F 2 1 2 1 1 1 1 1 3 5 6 1 4 32 1 2 2 4 20 3
P 7 5 5 4 3 5 4 5 5 3 3 4 3 2 20 6 5 1 2 4
S 9 6 8 7 7 6 7 9 6 5 4 7 5 3 9 10 9 4 4 6
T 8 5 6 6 4 5 5 6 4 6 4 6 5 3 6 8 11 2 3 6
W 0 2 0 0 0 0 0 0 1 0 1 0 0 1 0 1 0 55 1 0
Y 1 1 2 1 3 1 1 1 3 2 2 1 2 15 1 2 2 3 31 2
V 7 4 4 4 4 4 4 5 4 15 10 4 10 5 5 5 7 2 4 17
What do the numbers meanin a log odds matrix?
S(a,tryptophan) = 10 log10 (0.55/0.010) = 17.4
A score of +17 for tryptophan means that this alignmentis 50 times more likely than a chance alignment of twoTrp residues.
S(a,b) = 10 log10 (Mab/pb)S(a,b) = 17Probability of replacement (Mab/pb) = xThen17 = 10 log10 x1.7 = log10 x101.7 = x50 = x

17
What do the numbers meanin a log odds matrix?
A score of –10 indicates that the correspondence of two amino acids in an alignment that accurately representshomology (evolutionary descent) is one tenth as frequentas the chance alignment of these amino acids.
A score of 0 is neutral.
A score of +2 indicates that the amino acid replacementoccurs 1.6 times as frequently as expected by chance.
PAM10 log oddsscoring matrix
A 7
R -10 9
N -7 -9 9
D -6 -17 -1 8
C -10 -11 -17 -21 10
Q -7 -4 -7 -6 -20 9
E -5 -15 -5 0 -20 -1 8
G -4 -13 -6 -6 -13 -10 -7 7
H -11 -4 -2 -7 -10 -2 -9 -13 10
I -8 -8 -8 -11 -9 -11 -8 -17 -13 9
L -9 -12 -10 -19 -21 -8 -13 -14 -9 -4 7
K -10 -2 -4 -8 -20 -6 -7 -10 -10 -9 -11 7
M -8 -7 -15 -17 -20 -7 -10 -12 -17 -3 -2 -4 12
F -12 -12 -12 -21 -19 -19 -20 -12 -9 -5 -5 -20 -7 9
P -4 -7 -9 -12 -11 -6 -9 -10 -7 -12 -10 -10 -11 -13 8
S -3 -6 -2 -7 -6 -8 -7 -4 -9 -10 -12 -7 -8 -9 -4 7
T -3 -10 -5 -8 -11 -9 -9 -10 -11 -5 -10 -6 -7 -12 -7 -2 8
W -20 -5 -11 -21 -22 -19 -23 -21 -10 -20 -9 -18 -19 -7 -20 -8 -19 13
Y -11 -14 -7 -17 -7 -18 -11 -20 -6 -9 -10 -12 -17 -1 -20 -10 -9 -8 10
V -5 -11 -12 -11 -9 -10 -10 -9 -9 -1 -5 -13 -4 -12 -9 -10 -6 -22 -10 8
A R N D C Q E G H I L K M F P S T W Y V
Rat versus mouse protein
Rat versus bacterialprotein
More conserved Less conserved

18
Comparing two proteins with a PAM1 matrixgives completely different results than PAM250!
Consider two distantly related proteins. A PAM40 matrixis not forgiving of mismatches, and penalizes themseverely. Using this matrix you can find almost no match.
A PAM250 matrix is very tolerant of mismatches.
hsrbp, 136 CRLLNLDGTC btlact, 3 CLLLALALTC
* ** * **
24.7% identity in 81 residues overlap; Score: 77.0; Gap frequency: 3.7% rbp4 26 RVKENFDKARFSGTWYAMAKKDPEGLFLQDNIVAEFSVDETGQMSATAKGRVRLLNNWDV
btlact 21 QTMKGLDIQKVAGTWYSLAMAASD-ISLLDAQSAPLRVYVEELKPTPEGDLEILLQKWEN * **** * * * * ** *
rbp4 86 --CADMVGTFTDTEDPAKFKM btlact 80 GECAQKKIIAEKTKIPAVFKI
** * ** **
PAM: “Accepted point mutation”
• Two proteins with 50% identity may have 80 changesper 100 residues. Why? Because any residue can besubject to back mutations.
• Proteins with 20% to 25% identity are in the “twilight zone”and may be statistically significantly related.
• PAM or “accepted point mutation” refers to the “hits” or matches between two sequences (Dayhoff & Eck, 1968)
1. Pairwise alignment of proteins
2. Scoring matrices: how related are amino acids?
3. Multiple sequence alignment of proteins
4. From multiple sequence alignment to phylogenetic tree
Outline

19
Multiple sequence alignment: definition
• a collection of three or more protein (or nucleic acid) sequences that are partially or completely aligned
• homologous residues are aligned in columns across the length of the sequences
• residues are homologous in an evolutionary sense
• residues are homologous in a structural sense
Multiple sequence alignment: properties
• not necessarily one “correct” alignment of a protein family
• protein sequences evolve...
• ...the corresponding three-dimensional structures of proteins also evolve
• may be impossible to identify amino acid residues that align properly (structurally) throughout a multiple sequence alignment
• for two proteins sharing 30% amino acid identity, about 50% of the individual amino acids are superposable in the two structures
Multiple sequence alignment: features
• some aligned residues, such as cysteines that formdisulfide bridges, may be highly conserved
• there may be conserved motifs such as a transmembrane domain
• there may be conserved secondary structure features
• there may be regions with consistent patterns ofinsertions or deletions (indels)

20
Multiple sequence alignment: uses
• MSA is more sensitive than pairwise alignmentto detect homologs
• BLAST output can take the form of a MSA,and can reveal conserved residues or motifs
• Population data can be analyzed in a MSA (PopSet)
• A single query can be searched against a database of MSAs (e.g. PFAM)
• Regulatory regions of genes may have consensussequences identifiable by MSA
Multiple sequence alignment: methods
There are two main ways to make a multiple sequence alignment:
(1) Progressive alignment (Feng & Doolittle). We will illustrate this using ClustalW.
(2) Iterative approaches
Multiple sequence alignment: methods
Example of MSA using ClustalW: two data sets
Five distantly related lipocalins (human to E. coli)
Five closely related RBPs
When you do this, obtain the sequences of interest in the FASTA format! (You can save them in a Word document)

21
The input for ClustalW: a group of sequences(DNA or protein) in the FASTA format
Use ClustalW to do a progressive MSA
http://www2.ebi.ac.uk/clustalw/
Feng-Doolittle MSA occurs in 3 stages
[1] Do a set of global pairwise alignments(Needleman and Wunsch’s dynamic programmingalgorithm)
[2] Create a guide tree
[3] Progressively align the sequences

22
Progressive MSA stage 1 of 3:generate global pairwise alignments
five distantly related lipocalins
best score
Progressive MSA stage 1 of 3:generate global pairwise alignments
Start of Pairwise alignmentsAligning...Sequences (1:2) Aligned. Score: 84Sequences (1:3) Aligned. Score: 84Sequences (1:4) Aligned. Score: 91Sequences (1:5) Aligned. Score: 92Sequences (2:3) Aligned. Score: 99Sequences (2:4) Aligned. Score: 86Sequences (2:5) Aligned. Score: 85Sequences (3:4) Aligned. Score: 85Sequences (3:5) Aligned. Score: 84Sequences (4:5) Aligned. Score: 96
five closely related lipocalins
best score
Number of pairwise alignments needed
For n sequences, (n-1)(n) / 2
For 5 sequences, (4)(5) / 2 = 10

23
Feng-Doolittle stage 2: guide tree
• Convert similarity scores to distance scores
• A tree shows the distance between objects
• Use UPGMA (defined below)
• ClustalW provides a syntax to describe the tree
Progressive MSA stage 2 of 3:generate a guide tree calculated from
the distance matrix
Progressive MSA stage 2 of 3:generate guide tree
((gi|5803139|ref|NP_006735.1|:0.04284,(gi|6174963|sp|Q00724|RETB_MOUS:0.00075,gi|132407|sp|P04916|RETB_RAT:0.00423):0.10542):0.01900,gi|89271|pir||A39486:0.01924,gi|132403|sp|P18902|RETB_BOVIN:0.01902);
five closely related lipocalins

24
Feng-Doolittle stage 3: progressive alignment
• Make a MSA based on the order in the guide tree
• Start with the two most closely related sequences
• Then add the next closest sequence
• Continue until all sequences are added to the MSA
• Rule: “once a gap, always a gap.”
Progressive MSA stage 3 of 3:progressively align the sequences
following the branch order of the tree
Clustal W alignment of 5 closely related lipocalins
CLUSTAL W (1.82) multiple sequence alignment
gi|89271|pir||A39486 MEWVWALVLLAALGSAQAERDCRVSSFRVKENFDKARFSGTWYAMAKKDP 50gi|132403|sp|P18902|RETB_BOVIN ------------------ERDCRVSSFRVKENFDKARFAGTWYAMAKKDP 32gi|5803139|ref|NP_006735.1| MKWVWALLLLAAW--AAAERDCRVSSFRVKENFDKARFSGTWYAMAKKDP 48gi|6174963|sp|Q00724|RETB_MOUS MEWVWALVLLAALGGGSAERDCRVSSFRVKENFDKARFSGLWYAIAKKDP 50gi|132407|sp|P04916|RETB_RAT MEWVWALVLLAALGGGSAERDCRVSSFRVKENFDKARFSGLWYAIAKKDP 50
********************:* ***:*****
gi|89271|pir||A39486 EGLFLQDNIVAEFSVDENGHMSATAKGRVRLLNNWDVCADMVGTFTDTED 100gi|132403|sp|P18902|RETB_BOVIN EGLFLQDNIVAEFSVDENGHMSATAKGRVRLLNNWDVCADMVGTFTDTED 82gi|5803139|ref|NP_006735.1| EGLFLQDNIVAEFSVDETGQMSATAKGRVRLLNNWDVCADMVGTFTDTED 98gi|6174963|sp|Q00724|RETB_MOUS EGLFLQDNIIAEFSVDEKGHMSATAKGRVRLLSNWEVCADMVGTFTDTED 100gi|132407|sp|P04916|RETB_RAT EGLFLQDNIIAEFSVDEKGHMSATAKGRVRLLSNWEVCADMVGTFTDTED 100
*********:*******.*:************.**:**************
gi|89271|pir||A39486 PAKFKMKYWGVASFLQKGNDDHWIIDTDYDTYAAQYSCRLQNLDGTCADS 150gi|132403|sp|P18902|RETB_BOVIN PAKFKMKYWGVASFLQKGNDDHWIIDTDYETFAVQYSCRLLNLDGTCADS 132gi|5803139|ref|NP_006735.1| PAKFKMKYWGVASFLQKGNDDHWIVDTDYDTYAVQYSCRLLNLDGTCADS 148gi|6174963|sp|Q00724|RETB_MOUS PAKFKMKYWGVASFLQRGNDDHWIIDTDYDTFALQYSCRLQNLDGTCADS 150gi|132407|sp|P04916|RETB_RAT PAKFKMKYWGVASFLQRGNDDHWIIDTDYDTFALQYSCRLQNLDGTCADS 150
****************:*******:****:*:* ****** *********
* asterisks indicate identity in a column
25
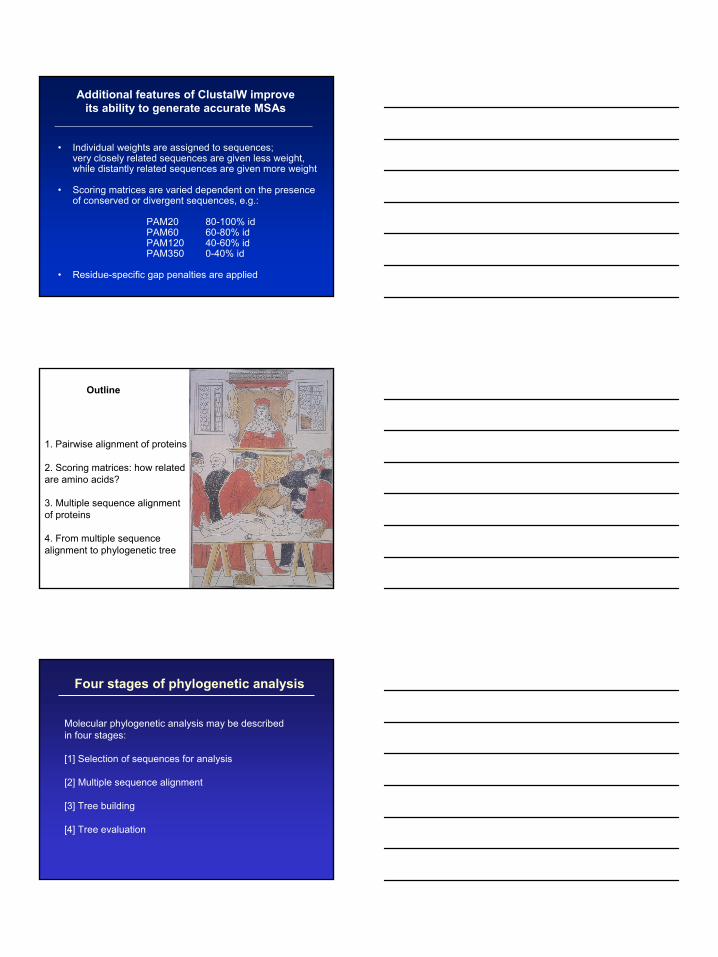
Additional features of ClustalW improveits ability to generate accurate MSAs
• Individual weights are assigned to sequences; very closely related sequences are given less weight,while distantly related sequences are given more weight
• Scoring matrices are varied dependent on the presenceof conserved or divergent sequences, e.g.:
PAM20 80-100% idPAM60 60-80% idPAM120 40-60% idPAM350 0-40% id
• Residue-specific gap penalties are applied
1. Pairwise alignment of proteins
2. Scoring matrices: how related are amino acids?
3. Multiple sequence alignment of proteins
4. From multiple sequence alignment to phylogenetic tree
Outline
Molecular phylogenetic analysis may be describedin four stages:
[1] Selection of sequences for analysis
[2] Multiple sequence alignment
[3] Tree building
[4] Tree evaluation
Four stages of phylogenetic analysis

26
For some phylogenetic studies, it may be preferableto use protein instead of DNA sequences. With DNA, one can also study synonymous versus nonsynonymous mutations, noncoding DNA, pseudogenes, etc.
Stage 1: Use of DNA, RNA, or protein
The fundamental basis of a phylogenetic tree isa multiple sequence alignment.
(If there is a misalignment, or if a nonhomologoussequence is included in the alignment, it will stillbe possible to generate a tree.)
Consider the following alignment of 13 orthologousretinol-binding proteins.
Stage 2: Multiple sequence alignment

27
Some positions of the multiple sequence alignment areinvariant (arrow 2). Some positions distinguish fish RBPfrom all other RBPs (arrow 3).
[1] Confirm that all sequences are homologous
[2] Adjust gap creation and extension penaltiesas needed to optimize the alignment
[3] Restrict phylogenetic analysis to regions of themultiple sequence alignment for which data areavailable for all taxa (delete columns havingincomplete data—even if a gap occurs in onlyone taxon).
[4] In this example, note that four RBPs are from fish,while the others are vertebrates that evolved morerecently.
Stage 2: Multiple sequence alignment
We will discuss two tree-building methods:distance-based and character-based.
Distance-based methods involve a distance metric,such as the number of amino acid changes betweenthe sequences, or a distance score. Examples ofdistance-based algorithms are UPGMA and neighbor-joining.
Stage 3: Tree-building methods
28
We will discuss two tree-building methods:distance-based and character-based.
Distance-based methods involve a distance metric,such as the number of amino acid changes betweenthe sequences, or a distance score. Examples ofdistance-based algorithms are UPGMA and neighbor-joining.
Character-based methods include maximum parsimonyand maximum likelihood. Parsimony analysis involvesthe search for the tree with the fewest amino acid(or nucleotide) changes that account for the observeddifferences between taxa.
Stage 3: Tree-building methods
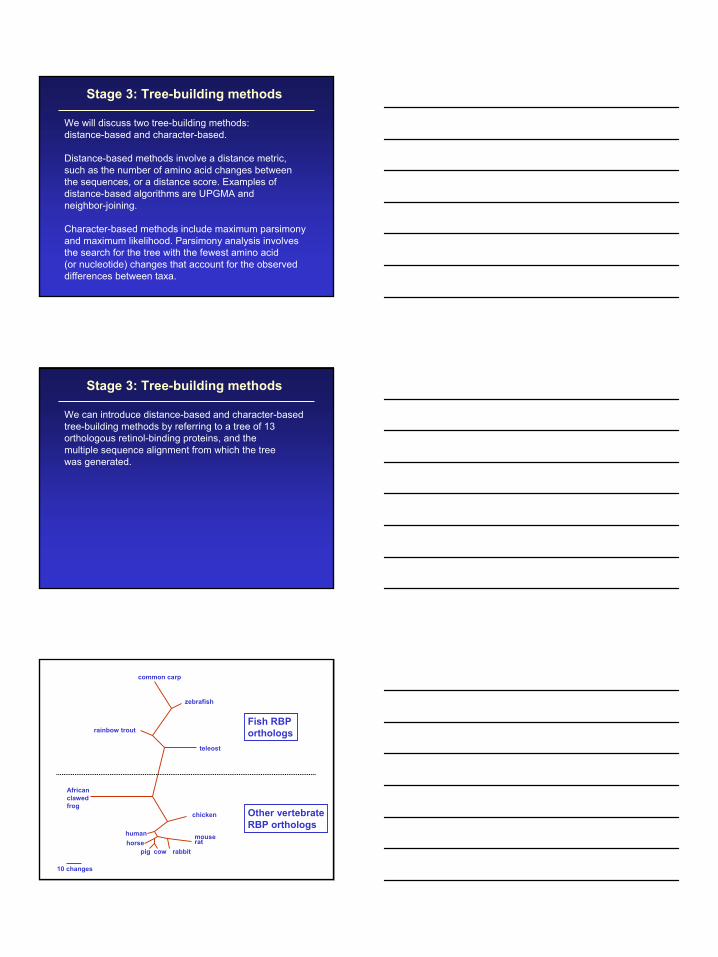
We can introduce distance-based and character-based tree-building methods by referring to a tree of 13orthologous retinol-binding proteins, and the multiple sequence alignment from which the treewas generated.
Stage 3: Tree-building methods
Fish RBP orthologs
common carp
zebrafish
rainbow trout
teleost
African clawed frog
chicken
mouserat
rabbitcowpighorsehuman
10 changes
Other vertebrateRBP orthologs

29
Distance-based treeCalculate the pairwise alignments;if two sequences are related,put them next to each other on the tree
Character-based tree: identify positions that best describe how characters (amino acids) are derived from common ancestors
How to use MEGA to make a tree
[1] Download MEGA for free (www.megasoftware.net)[2] Enter a multiple sequence alignment (.meg) file[3] Under the phylogeny menu, select one of these
four methods…
Neighbor-Joining (NJ)Minimum Evolution (ME)Maximum Parsimony (MP)UPGMA
Use of MEGA for a distance-based tree: UPGMA
Click computeto obtain tree
Click green boxesto obtain options

30
Use of MEGA for a distance-based tree: UPGMA
A variety of styles are available for tree display
Use of MEGA for a distance-based tree: UPGMA
Flipping branches around a node createsan equivalent topology
Tree-building methods: UPGMA
UPGMA is unweighted pair group methodusing arithmetic mean
1 2
34
5

31
Tree-building methods: UPGMA
Step 1: compute the pairwise distances of allthe proteins. Get ready to put the numbers 1-5at the bottom of your new tree.
1 2
34
5
Tree-building methods: UPGMA
Step 2: Find the two proteins with the smallest pairwise distance. Cluster them.
1 2
34
51 2
6
Tree-building methods: UPGMA
Step 3: Do it again. Find the next two proteins with the smallest pairwise distance. Cluster them.
1 2
34
5
1 2
6
4 5
7

32
Tree-building methods: UPGMA
Step 4: Keep going. Cluster.
1 2
34
51 2
6
4 5
7
3
8
Tree-building methods: UPGMA
Step 4: Last cluster! This is your tree.
1 2
34
51 2
6
4 5
7
3
8
9
MEGA for UPGMA: branch lengths reflect differences

33
MEGA for UPGMA: branch lengths reflect differences
[1] From main MEGAmenu, computepairwise distances
[2] Note that thesmallest distance is0.116 (from human tohorse hemoglobin).
[3] On the tree, thesetwo taxa are 0.0579+ 0.0579 = 0.116 apart!
The main criteria by which the accuracy of a phylogentic tree is assessed are consistency,efficiency, and robustness. Evaluation of accuracy can refer to an approach (e.g. UPGMA) or to a particular tree.
Stage 4: Evaluating trees
Bootstrapping is a commonly used approach tomeasuring the robustness of a tree topology.Given a branching order, how consistently doesan algorithm find that branching order in a randomly permuted version of the original data set?
Stage 4: Evaluating trees: bootstrapping

34
Bootstrapping is a commonly used approach tomeasuring the robustness of a tree topology.Given a branching order, how consistently doesan algorithm find that branching order in a randomly permuted version of the original data set?
To bootstrap, make an artificial dataset obtained by randomly sampling columns from your multiple sequence alignment. Make the dataset the same size as the original. Do 100 (to 1,000) bootstrap replicates.Observe the percent of cases in which the assignmentof clades in the original tree is supported by the bootstrap replicates. >70% is considered significant.
Stage 4: Evaluating trees: bootstrapping
In 61% of the bootstrapresamplings, ssrbp and btrbp(pig and cow RBP) formed adistinct clade. In 39% of the cases, another protein joinedthe clade (e.g. ecrbp), or oneof these two sequences joinedanother clade.