protecting people. enhancing lives./media/files/r/...protecting people. enhancing lives. interim...
TRANSCRIPT

1
Protecting People.Enhancing Lives.
Interim Results 2018
Global leaders in Pest Control and Hygiene services.

This presentation contains statements that are, or may be, forward-looking regarding the group'sfinancial position and results, business strategy, plans and objectives. Such statements involverisk and uncertainty because they relate to future events and circumstances and there areaccordingly a number of factors which might cause actual results and performance to differmaterially from those expressed or implied by such statements. Forward-looking statementsspeak only as of the date they are made and no representation or warranty, whether expressed orimplied, is given in relation to them, including as to their completeness or accuracy or the basis onwhich they were prepared. Other than in accordance with the Company’s legal or regulatoryobligations (including under the Listing Rules and the Disclosure and Transparency Rules), theCompany does not undertake any obligation to update or revise publicly any forward-lookingstatement, whether as a result of new information, future events or otherwise. Informationcontained in this announcement relating to the Company or its share price, or the yield on itsshares, should not be relied upon as an indicator of future performance. Nothing in thispresentation should be construed as a profit forecast.
22
2

Protecting People.Enhancing Lives.
Interim Results 2018
Global leaders in Pest Control and Hygiene services.
Andy RansomChief Executive Officer
3

4
Ongoing Revenue growth 14.2% in H1 2018 at CER
Organic Revenue growth 3.0% in H1 2018; under lying 3.4% *
Pest Control Revenue growth 13.0% of which 4.0% was organic growth, underlying 4.7*
Hygiene Revenue growth 30.8% reflecting Cannon and CWS acquisitions
* Underlying organic revenue growth adjusted to exclude Puerto Rico following hurricane in 2017.
14.2%
Executing our strategy in 2018
H1 2018 HighlightsRevenue growth ahead of medium-term guidance
5
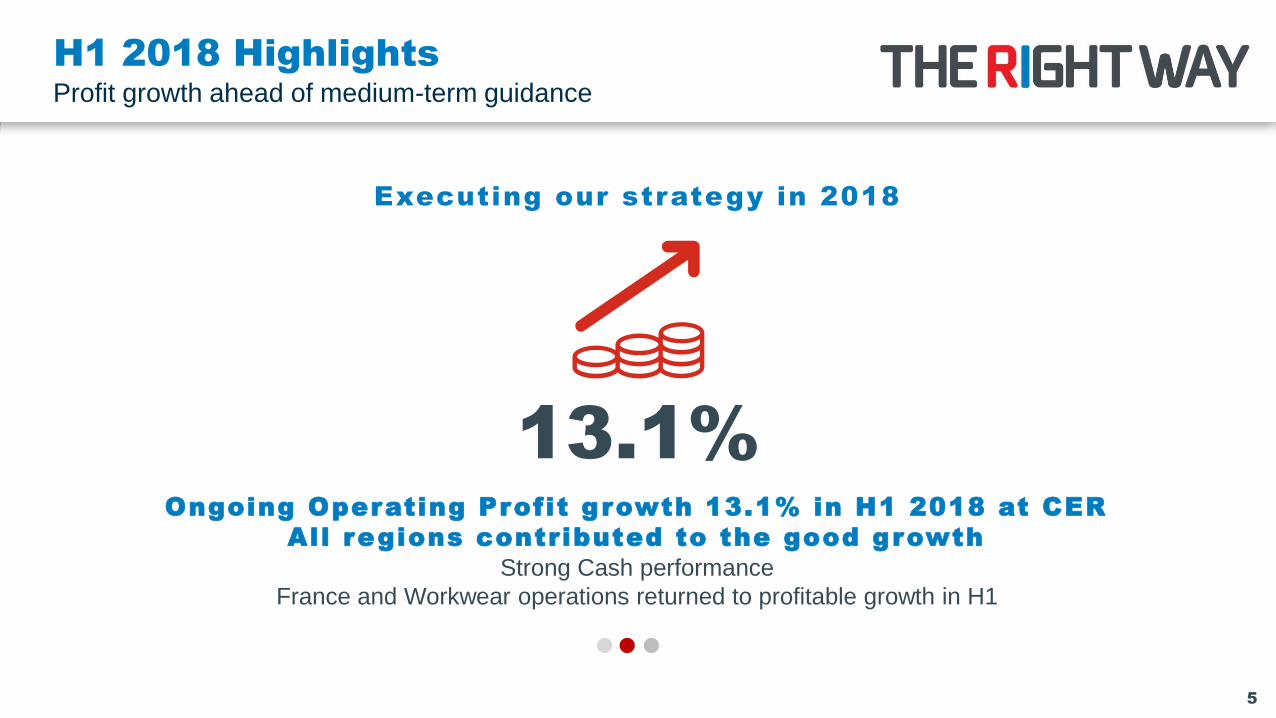
Ongoing Operating Profit growth 13.1% in H1 2018 at CER
All regions contributed to the good growth
Strong Cash performance
France and Workwear operations returned to profitable growth in H1
13.1%
Executing our strategy in 2018
H1 2018 HighlightsProfit growth ahead of medium-term guidance

6
Executing our strategy in 2018
20 acquisitions in Pest Control and 3 in Hygiene
Annualised revenues of £117.3m. Strong pipeline 8 Pest Control acquisitions in North America, annualised revenues of c. $35m
Building scale in Emerging markets – deals in Brazil, Chile, UAE and Costa Rica
23 Acquisitions
H1 2018 HighlightsStrong execution of M&A in Growth and Emerging markets

2018 Interim Results: Financial Review
Jeremy TownsendChief Financial Officer
7

Financial Highlights (Continuing Operations)
H1 2018
£ million AER CER Δ AER Δ CER
Ongoing Revenue * 1,166.5 1,197.5 10.5% 14.2%
Ongoing Operating Profit * 134.5 137.8 10.7% 13.1%
Adjusted PBTA 124.5 127.4 (1.5%) 0.9%
PBT 109.5 111.2 (81.5%) (81.3%)
Free Cash Flow 73.0
Adjusted EPS 5.25p 5.37p (1.9%) (0.1%)
Dividend 1.311p 15.0%
8
*Ongoing Revenue and Ongoing Operating Profit exclude the results of disposed businesses, including the businesses contributed into the Haniel JV and the French laundries sold to RLD

Strong Financial Progress Building a track record of delivery
Ongoing Revenue growth: 5%–8%, 3%-4% organic (CER)
Ongoing Profit growth c.10% (CER)
Strong and sustainable FCF delivery, 90% conversion (AER)
+14.2% in H1 vs. target 5%-8% +13.1% in H1 vs. target c. 10% FCF of £73m in H1, 91% conversion*
1000
1200
1400
1600
1800
2000
2200
2400
Yr toJune2015
Yr toDec2015
Yr toJune2016
Yr toDec2016
Yr toJune2017
Yr toDec2017
Yr toJune2018
10
30
50
70
90
110
130
150
170
190
Yr toJune2015
Yr toDec2015
Yr toJune2016
Yr toDec2016
Yr toJune2017
Yr toDec2017
Yr toJune2018
150
170
190
210
230
250
270
290
310
Yr toJune2015
Yr toDec2015
Yr toJune2016
Yr toDec2016
Yr toJune2017
Yr toDec2017
Yr toJune2018
Ongoing Revenue and Ongoing Operating Profit exclude the results of Disposed Businesses, including the businesses contributed into the Haniel JV and the French laundries sold to RLD
Charts calculated on a 12-month trailing basis
*Free Cash Flow conversion for the 12 months to 30 June 2018
4 YR
CAGR
12.0%
£m
£m
£m4 YR
CAGR
16.0%
4 YR
CAGR
3.0%
9

North America
• Organic Revenue growth +2.5%, impacted by 2017 Puerto Rico hurricane,
unseasonably cold weather in March and April this year and strong 2017
comparatives (esp. Products)
• Pest Control Organic growth +2.5%. Given Puerto Rico lapping in Q4 and
less challenging comparatives than H1, Organic growth expected to improve
in H2
• Net Operating Margin down -0.3% points to 11.6%:
- Partly reflecting dilutive impact of acquisitions but also reflecting lower levels
of Organic Revenue growth
- Although Organic growth lower than prior year, progress being made towards
plan to achieve 18% margins and revenues of $1.5bn by end of 2020: strong
revenue contribution from 2017 acquisitions; additional c. $35m annualised
revenues acquired in H1; and Best of Breed programme on track.
• Eight Pest Control acquisitions, combined annualised revenues of c. £27m
Strategic focus for H2:
• Stronger organic growth
• Margin improvement opportunities from M&A, scale efficiencies and density
• Continued implementation of Best of Breed programme
Ongoing Revenue +12.8%
Ongoing Group
Revenue
Ongoing Group
Operating Prof it
H1 2018 Growth
Ongoing Revenue £452.3m +12.8%
Ongoing Operating Profit £52.3m +9.4%
Operating Margin 11.6% -0.3% points
38% 29%
At constant exchange rates
10
Ongoing Operating Profit +9.4%,
reflecting impact of higher
revenues and acquisitions

Europe
• Excellent performance from Southern Europe (+60.2%), continued
strong growth in Germany (+12.4%) and improved performance in
France (+1.2%). Latin America, once again performing well (+17.9%)
• +35.4% revenue growth in Hygiene, benefitting strongly by 2017
acquisition of CWS Italy. +7.4% growth in Pest Control
• Good progress in restoring CWS-boco Italy acquisition to profitability
• Encouraging performance in France - return to profitable growth in H1
• Six acquisitions in H1 – four in Pest Control and two in Hygiene with
combined annualised revenues of c. £8.7m
• Good performance from JV businesses in first year of operation
Strategic focus for H2:
• Further organic growth in Pest Control and Hygiene
• Integration of CWS-boco Italy
• Sustained improvement in France to deliver year-on-year profitable
growth by year end
Ongoing Revenue +12.1%
(+3.3% Organic Revenue growth)
27% 32%
H1 2018 Growth
Ongoing Revenue £321.3m +12.1%
Ongoing Operating Profit £57.4m +10.8%
Operating Margin 17.9% -0.2% points
Ongoing Group
Revenue
Ongoing Group
Operating Prof it
At constant exchange rates
11
Ongoing Operating Profit +10.8%
Haniel JV
(Rentokil has 17.8% Share*)H1 2018 Growth
Ongoing Revenue £87.9m N/A
Ongoing Operating Profit £11.4m N/A
Operating Margin 13.0% N/A
*Reported within Share of Profit from Associates (net of tax)

UK and Rest of World
• +4.2% Organic growth in UK Pest Control and Hygiene, with Pest
Control benefitting from increased jobbing revenues
• Property Care continues to be impacted by weak UK housing market
• +13.1% Ongoing Revenue growth in RoW, across all regional
clusters in the Nordics, Caribbean, Africa and MENAT
• Margin decline of -0.5% points reflecting weakness in Property Care
• Three businesses acquired in H1:
• UK business of Cannon Hygiene acquired in January performing
well. Held separately from existing operations - CMA review
proceeds to Phase 2
• Two acquisitions in Pest Control in UAE and Sweden with
combined annualised revenues of c. £4.6m
Strategic focus for H2:
• Integration of recent acquisitions and continued M&A
• Plan for improved performance in Property Care
Ongoing Revenue +17.1%
(+1.7% Organic Revenue growth)
Ongoing Operating Profit +13.9%
18% 23%
H1 2018 Growth
Ongoing Revenue £220.1m +17.1%
Ongoing Operating Profit £42.4m +13.9%
Operating Margin 19.3% -0.5% points
Ongoing Group
Revenue
Ongoing Group
Operating Prof it
At constant exchange rates
12

Japanese JV
(Rentokil has 49% Share*)H1 2018 Growth
Ongoing Revenue £24.5m +3.8%
Ongoing Operating Profit £5.9m +2.6%
Operating Margin 24.0% -0.3% points
H1 2018 Growth
Ongoing Revenue £106.4m +23.5%
Ongoing Operating Profit £10.6m +25.6%
Operating Margin 9.9% +0.1% points
Asia
• Good performances in Pest Control and Hygiene. Overall good
revenue growth impacted by strong 2017 comparatives associated
with introduction of Indian Goods and Services Tax in July 2017
• +0.1% improvement in Net Operating Margin to 9.9% - growth in
Hygiene margins offset by dilutive effect of lower-margin PCI
business
• Three Pest Control acquisitions in Singapore and Malaysia in H1
with annualised revenues of c. £1.5m
Strategic focus for H2:
• Further delivery of strong revenue growth and profit leverage
• Ongoing execution of PCI joint venture and integration of
recent acquisitions. Further M&A to build scale
• Acceleration of digital platform roll-out to drive customer experience
and operational efficiency
Ongoing Revenue +23.5%
(+6.9% Organic Revenue growth)
Ongoing Operating Profit +25.6%,
reflecting higher revenue9% 6%
Ongoing Group
Revenue
Ongoing Group
Operating Prof it
At constant exchange rates
*Reported within Share of Profit from Associates (net of tax) 13

Pacific
• Revenue growth driven by solid performances across core Pest
Control and Hygiene categories and acquisition of Cannon
Hygiene business
• -1.2% decrease in Net Operating Margins to 19.7%, reflecting
dilutive impact of Cannon acquisition
• In addition to Cannon, acquisition of three small Pest Control
companies in New Zealand with combined annualised revenues of
c. £0.6m in the year prior to purchase
Strategic focus for 2018:
• Further improvements in performance through additional
acquisitions in Pest Control and Hygiene and service productivity
Ongoing Revenue +12.1%
(+3.1% Organic Revenue growth)
Ongoing Operating Profit +5.6%,
reflecting higher revenues 8% 10%
H1 2018 Growth
Ongoing Revenue £97.4m +12.1%
Ongoing Operating Profit £19.1m +5.6%
Operating Margin 19.7% -1.2% points
Ongoing Group
Revenue
Ongoing Group
Operating Prof it
At constant exchange rates
14
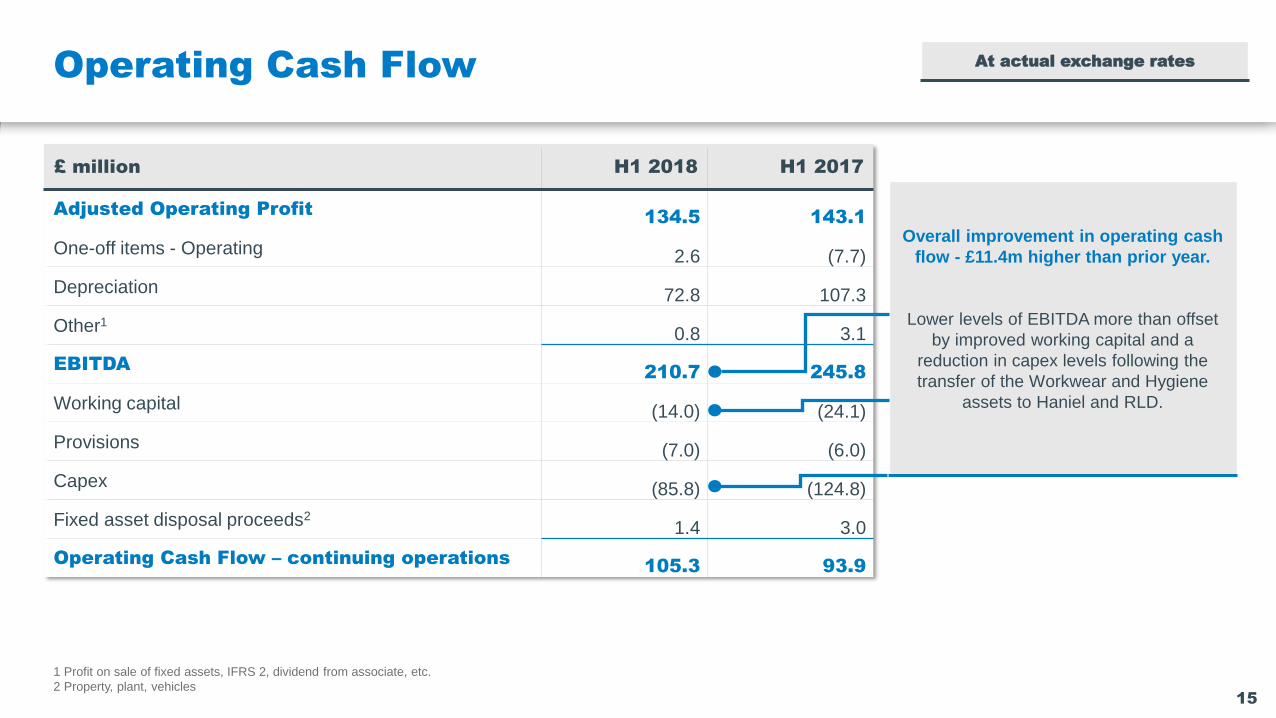
£ million H1 2018 H1 2017
Adjusted Operating Profit 134.5 143.1
One-off items - Operating 2.6 (7.7)
Depreciation 72.8 107.3
Other10.8 3.1
EBITDA 210.7 245.8
Working capital (14.0) (24.1)
Provisions (7.0) (6.0)
Capex (85.8) (124.8)
Fixed asset disposal proceeds21.4 3.0
Operating Cash Flow – continuing operations 105.3 93.9
1 Profit on sale of fixed assets, IFRS 2, dividend from associate, etc.
2 Property, plant, vehicles
Operating Cash Flow At actual exchange rates
15
Overall improvement in operating cash
flow - £11.4m higher than prior year.
Lower levels of EBITDA more than offset
by improved working capital and a
reduction in capex levels following the
transfer of the Workwear and Hygiene
assets to Haniel and RLD.

£ million H1 2018 H1 2017
Operating Cash Flow – continuing105.3 93.9
Cash interest (7.3) (6.3)
Cash tax (25.0) (19.5)
Free Cash Flow – continuing 73.0 68.1
Acquisitions (164.9) (206.8)
Disposals - 396.1
Dividends (50.2) (43.5)
FX and other (21.3) (0.7)
Movement in Net Debt (163.4) 213.2
Opening Net Debt (927.3) (1,238.7)
Closing Net Debt (1,090.7) (1,025.5)
Free Cash Flow & Movement in Net Debt At actual exchange rates
16
Cash interest £1.0m higher than prior
year, in line with P&L increase
Increase of £4.9m, driven by improved
operating cash flow offset by increased
tax payments
£21.3m increase in net debt as a result of
foreign exchange translation and other
items, leaving an overall increase in net
debt of £163.4m (vs. end 2017) and
closing net debt of £1,090.7m

17
Balance Sheet
• Net debt to EBITDA 2.4x
• Credit rating remains at BBB Stable Outlook
• £454m of centrally held funds and available undrawn committed
facilities
• Working with banks to amend and extend RCF with view to
increasing the committed amount available for cash drawings
from £360m to £600m and extending term to 2023 with two one-
year extension options – to help with 2019 refinancing
• To cover any financing risk associated with maturity of €500m
bond in September 2019
• Average cost of net debt in H1 2018 of 4.1%
Pension Scheme
• Fully funded on a technical provisions basis
• Scheme estimated to be close to level at which it would be
able to secure member's benefits using insurance policies –
known as 'buy-out'
• If implemented, buy-out would replace Company as sponsor
of the Scheme with a fully authorised UK insurance company
responsible for paying pensions in line with Scheme rules
• Valued at a technical accounting surplus of £373.2m on the
Company’s balance sheet at 30 June 2018
• This would completely extinguish all future pension liabilities
from balance sheet (and associated technical surplus) - no
Company cash payments necessary
Balance Sheet and Pension Scheme

H1 2018 Summary and 2018 Guidance
• With exception of foreign exchange, guidance for 2018 unchanged
• Central and regional overheads c. £4m higher than prior year
• Above the line restructuring costs c. £7m, in line with 2017
• Profit from associates, including share of adjusted profit from Haniel JV,
c. £20m to £25m
• Interest costs c. £46m. Cash interest in line with P&L impact
• Estimated negative impact from FX of £5m to £10m (vs. negative £10m -
£15m guidance at full year). Potential £5m improvement expected to be
largely offset by higher fuel prices which increased fuel costs by
c. £2m in H1
• Adjusted Effective Tax Rate 22.5% (in line with 2017). Cash tax payable
of £45m to £50m
• Other cash flow guidance:
- Working capital outflow c. £15m
- Net capex c. £165m to £175m (subject to FX movements)
Guidance for 2018
18
✓ +14.2% growth in Ongoing Revenue
✓ Ongoing Organic Revenue growth +3.0% and in line with financial
targets (adjusted for Puerto Rico impact, +3.4%)
✓ +13.1% increase in Ongoing Operating Profit
✓ £73.0m Free Cash Flow, representing 91.0% conversion*
✓ Encouraging return to profitable growth in France
✓ Continued strong execution of M&A - 23 businesses acquired,
revenues of £117.3m and cash spend on current and prior year
acquisitions of £164.9m
✓ Balance sheet remains robust
✓ +15.0% increase in Interim dividend at 1.311p
Summary of H1 2018
As a result of our performance in H1, we maintain our guidance for the full year
*Free Cash Flow conversion for the 12 months to 30 June 2018

Protecting People.Enhancing Lives.
Interim Results 2018
Global leaders in Pest Control and Hygiene services.
Andy RansomChief Executive Officer
19
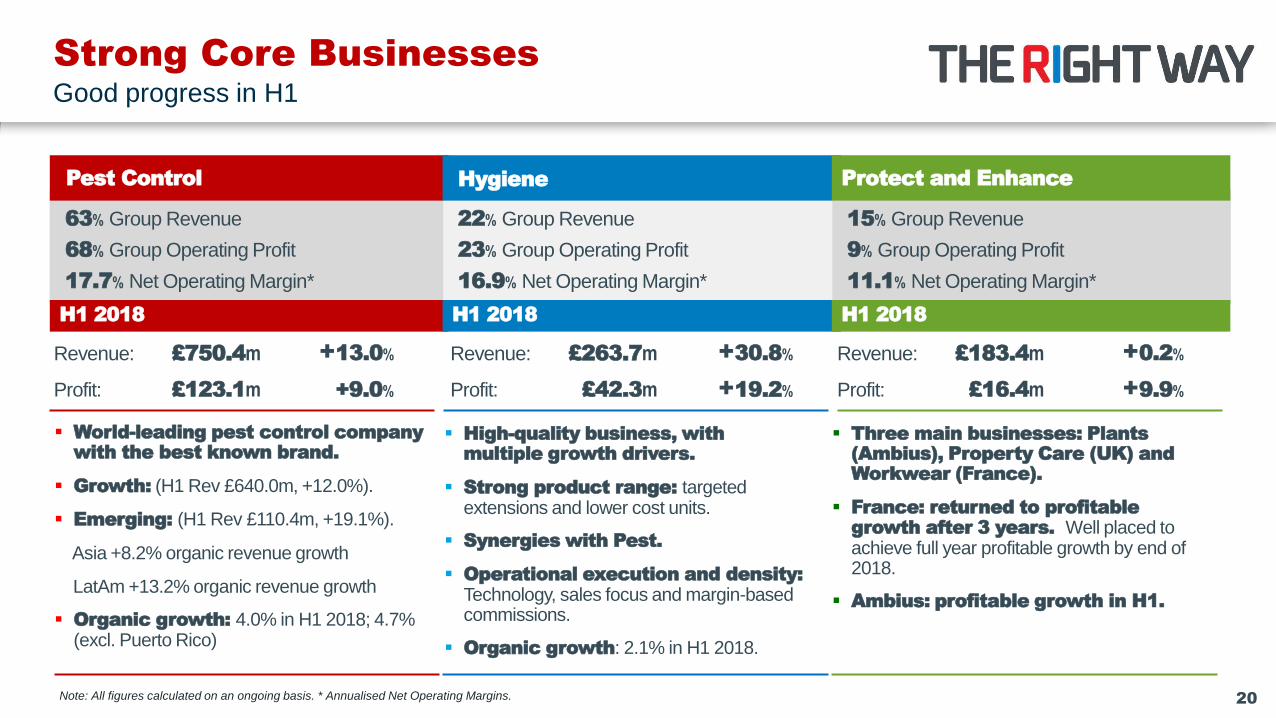
Strong Core Businesses
20
Good progress in H1
Pest Control
63% Group Revenue
68% Group Operating Profit
17.7% Net Operating Margin*
Revenue: £750.4m
Profit: £123.1m
+13.0%
+9.0%
▪ World-leading pest control company with the best known brand.
▪ Growth: (H1 Rev £640.0m, +12.0%).
▪ Emerging: (H1 Rev £110.4m, +19.1%).
Asia +8.2% organic revenue growth
LatAm +13.2% organic revenue growth
▪ Organic growth: 4.0% in H1 2018; 4.7% (excl. Puerto Rico)
H1 2018
Hygiene
22% Group Revenue
23% Group Operating Profit
16.9% Net Operating Margin*
Revenue: £263.7m
Profit: £42.3m
+30.8%
+19.2%
▪ High-quality business, with multiple growth drivers.
▪ Strong product range: targeted extensions and lower cost units.
▪ Synergies with Pest.
▪ Operational execution and density:Technology, sales focus and margin-based commissions.
▪ Organic growth: 2.1% in H1 2018.
H1 2018
Protect and Enhance
15% Group Revenue
9% Group Operating Profit
11.1% Net Operating Margin*
Revenue: £183.4m
Profit: £16.4m
+0.2%
+9.9%
▪ Three main businesses: Plants (Ambius), Property Care (UK) and Workwear (France).
▪ France: returned to profitable growth after 3 years. Well placed to achieve full year profitable growth by end of 2018.
▪ Ambius: profitable growth in H1.
H1 2018
Note: All figures calculated on an ongoing basis. * Annualised Net Operating Margins.

21
Pest Control is a non-cyclical growth
market, worth $18bn p.a. globally and
growing at c. 5% CAGR through to 2023*.
Multiple growth drivers Increasing pest pressures, urbanisation, growing middle classes,
rising consumer expectations and increasing workplace / food
regulations.
Vector control Worth an additional $3.1bn – growth in Asia and Latin America
given public health threat (Dengue, Zika, Malaria, etc.).
Highly fragmented industry 40,000 companies, good source of acquisition opportunities.
50% in North America.
Rentokil Pest ControlA compelling growth opportunity
Rentokil Pest Control
✓ Global leader in Commercial Pest Control.
✓ Strong Employer of Choice programme – outstanding
technical training.
✓ Powerful brand.
✓ Core strength in higher growth / higher margin
Commercial sector.
✓ Leader in innovation and digital.
✓ 70% contracted portfolio.
✓ H1 2014 pest control revenues of £384m increased to
£750m in H1 2018. 4-year revenue CAGR of 18.2%.
* Source: Various market reports including Allied Market Research and Genesis Market Research.

Rentokil North America
22
Building scale and density to drive margin expansion
Building scale and local density on national
footprint with +300 branches, 45 distribution
centres, +8,000 colleagues.
H1 2018: +12.8% Ongoing Revenue growth
2020 target unchanged:
$1.5bn regional business with margins of c.18% by end of 2020
Plan to end of 2020 H1 2018
4% to 6%
Organic growth
2.5% Organic growth
Adjusting for the impact of Puerto Rico, NA Pest Control
Organic growth from January to the end of April was 3.3% but
improved to 4.4% when weather patterns returned to normal
through May and June. Puerto Rico impact lapping in Q4.
8% to 10% revenue
from acquisitions
p.a.
10.3% Acquisitive growth
8 acquisitions in H1, annualised revenues of $35m.
Strong pipeline.
Total Pest Growth
12%-15%
Pest Control grew 13.8%
Best of breed back
office programme
On track
IT re-platform on track to complete in 2019.
Net Operating
Margin
Good progress on M&A and Best of Breed initiatives
- organic revenue growth expected to improve in H2.

23
Emerging MarketsStrong platform to deliver medium-term sustainable growth
A strong platform for delivering sustainable, profitable
growth in Asia, Africa, Latin America and the Middle
East. Unmatched by any competitor.
Asia Region: good progress in H1
H1 Ongoing Revenue: +23.5% (6.9% organic growth and 8.2% in pest control).
Scale: 580 locations, 7,200 pest technicians, 131 field biologists across 12 countries.
Integration of Rentokil PCI in India: proceeding to plan with management
appointed, financial systems introduced, web and mobile Apps introduced to provide
better customer service and procurement has been consolidated and streamlined.
Latin America Region: strong performance
H1 Ongoing Revenue: 17.9% (13.2% organic growth in pest control).
Acquisitions: acquired ISS pest control in Brazil in H1 to build density in São Paulo
and entered Costa Rica on 1 February - now in 9 Latin American markets.
Vector Control: continue to explore opportunities presented by the opening up of
public sector Vector Control contracts.

Leading in Innovation
24
Industry-leading innovation and technical expertise
Enhancing our core lines, meeting
emerging threats and the requirements of
new regulation.
Strong pipeline of innovations in place
Targeting key pest groups eg rodents and insects.
Lumnia
First insect light trap range to use LED lighting.
Reducing energy usage for customers by up to 60%.
Strong H1 performance: over 17,000 units shipped.
Expanding to full Lumnia range
Lumnia Ultimate (industrial and pharmaceuticals) launched in H1
and the new Compact unit (front of house) will launch in Q3.
The Queen’s Award for Enterprise – Innovation Received this prestigious award in H1 for RADAR and PestConnect.
Follows award for International Trade in 2017.
Compact
Standard
Ultimate

25
Digital Products and ServicesIncreasing demand for digital pest control
Over +750,000 customer sites and +23m
individual products now being tracked
online. Strong First Half. Extending ranges.
MyRentokil customer portal
+30 countries, +750,000 sites, +23m products.
c. 1.5m incidents of pest activity recorded in H1 2018.
63,000 customers added in H1.
Two thirds of commercial customers now using myRentokil
– good progress towards target of 100% usage.
PestConnect ‘Internet-of-Things’ devices
10 countries.
+3,500 customer sites.
Extending sensing expertise to other areas in H2, including
multi-catch rodent devices.

Bed Bug Connect Our latest Internet of Things device
26
THE PROBLEM1
● There are estimated to be 17.5m hotel rooms globally
● 75% of pest management professionals in the US reports treating bed bugs in hotel rooms each year
● c. 5% CAGR through to 2026● Current proactive tools are very
much hit & miss as there is a reliance on either chemical attraction or human mimicry
● These methods still rely on human intervention and people checking ‘things’ and do not give an automatic alarm
THE SOLUTION2
● We have conducted extensive research into the biology of bed bugs, their harborages and their dispersal patterns to give our next generation of proactive monitoring “intelligence”
● Utilising a patented smart surface and our proprietary PestConnect system the flexible surface is applied to the potential harbourages of bed bugs where they congregate and defecate
● Bed Bug defecation on smart surface triggers an alert
Going live with 1,000 units.
3-month pilot across 200 USA hotel rooms.
Fully connected using a proprietary communication protocol.
27
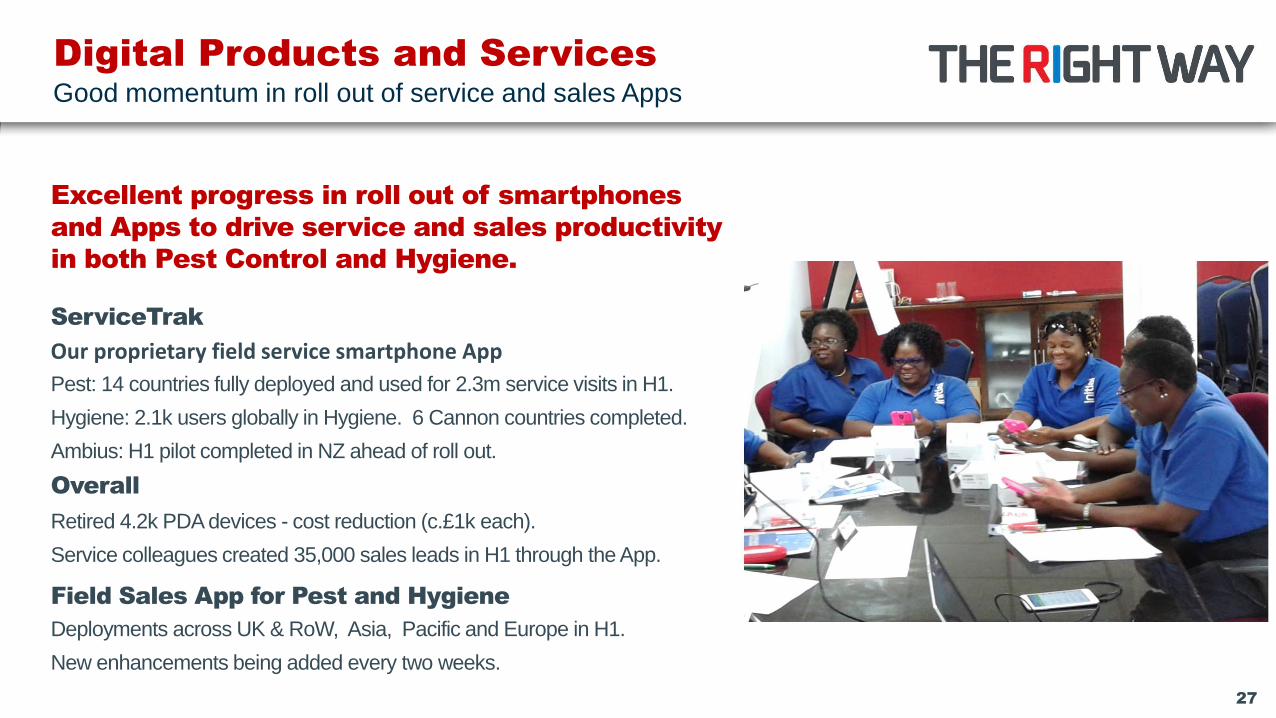
Digital Products and ServicesGood momentum in roll out of service and sales Apps
Excellent progress in roll out of smartphones
and Apps to drive service and sales productivity
in both Pest Control and Hygiene.
ServiceTrak
Our proprietary field service smartphone App
Pest: 14 countries fully deployed and used for 2.3m service visits in H1.
Hygiene: 2.1k users globally in Hygiene. 6 Cannon countries completed.
Ambius: H1 pilot completed in NZ ahead of roll out.
Overall
Retired 4.2k PDA devices - cost reduction (c.£1k each).
Service colleagues created 35,000 sales leads in H1 through the App.
Field Sales App for Pest and Hygiene
Deployments across UK & RoW, Asia, Pacific and Europe in H1.
New enhancements being added every two weeks.

Operational Focus
Operational strategy and targeted M&A to build scale and density.
Density:
customer
and
product
M&A:
city-focusedProducts:
Best in Class
Innovation
inc. digital
Service:
high quality
Hygiene
‘Execute
Now’
Initial Hygiene
28
Strong operational focus
1. Great service colleagues at the heart of the
business.
2. Best product ranges: lower cost products and
service / product innovation.
3. High customer service culture.
4. Respected brand & reputation esp. Emerging
markets.
5. Digital technology overlay for productivity.
6. Build density (customer and product) with smarter
selling – commission linked to local density.
7. Targeted M&A to build density - city-focused.
Our plan for profitable growth in Hygiene

Hygiene: Good Progress in H1
29
Operational strategy and targeted M&A
Strong growth in Hygiene with revenues up
30.8% - combination of organic growth of
2.1% in line with GDP and acquisitions. New
market entries in Chile and India.
Making good operational progress to improve lower
margin businesses acquired:
CWS Hygiene – Italy
Excellent operational progress in H1; 49 projects established - people,
service, IT, operational excellence, products, sales & marketing etc.
Loss-making business now returned to breakeven – profitability in H2.
Cannon Hygiene
Acquisition in H1 with annualised revenues of £77m across 9 countries.
8 countries integrated and performing well.
UK business subject to Competition and Marketing Authority Phase 2
review - now underway (estimate 6 months).

Protect & Enhance
30
9.9% profit growth in H1 driven mainly by France & Workwear
Profitable, cash-generative, route-based
businesses with shared overheads. 9% of
ongoing operating profit in H1.
Ambius: profitable growth in H1
Profits declined from £5m in H1 2016 to £3.2m in H1 2017.
H1 2018: returned to profitable growth increasing by +7.5%
Focus: Higher-margin services e.g. green (living) walls and premium
scenting and exploiting international agreements.
Expertise: in H1 Ambius colleagues installed 53 trees and 10,000
shrubs onto the world’s largest cruise liner (right).
Quality: 27 awards (out of 61) – US International Plantscape Awards
Property Care (UK):
Good business but UK housing market remained very weak in H1.
H1 revenues of £11.3m – down by 22%.
Impacting UK&ROW region’s Organic growth by 2% and Group
Organic growth by 0.3%.
Business improvement plan for H2.

Outstanding execution of strategy Excellent management team in place, focused on:
• Employer of Choice
• Service and product quality - leading to enhanced customer retention
• M&A including the disposal of 8 textile laundries to RLD in 2017
• Cost optimisation eg Hygiene product recycling
Encouraged by H1 Well placed to deliver full year profitable growth by the end of 2018.
France and French Workwear
31
Returned to profitable growth in H1
H1 2018 France French
Workwear
Ongoing profits +4.9% +11.5%
Ongoing revenues +1.2% +2.1%
26.4
23.120.9
21.9
2015 2016 2017 2018
France
profit
H1 £m
Following three years of profit decline, our business
in France and our French Workwear unit returned to
profitable growth in H1 2018.
+4.9%

Employer of Choice
32
Project 365 – to improve short term retention
The goal is to increase short-term sales and
service colleague retention to 90% by 2020 and
thereby reducing costs and productivity losses by
c. £10m. Good progress in H1.
All leaders agreed short-term retention targets: 10-20% improvement targets in FY 2018 vs 2017.
New global careers portal launched: Including new applicant tracking and ‘job fit’ tools to improve recruitment.
Line Manager Development programme: New 2-day programme underway in H1 targets c. 200 line managers.
Learning and development:+150% increase in courses undertaken online. Over 24,000 views per week.
Strong progress in short-term retention in H1: Two targets: retention after 0-6 months and 6-12 months.
6-12 months - all regions meeting or exceeding 2018 target of +80%.
Continued focus on retention in 0-6 month period.

Strong Execution of M&A
Strong execution of M&A in H1 with 23 businesses acquired with combined annualised revenues of £117.3m in Growth and Emerging markets.
H1 2018: 20 Pest Control, 3 in Hygiene acquisitions
8 Pest acquisitions in North America with c. $35m annualised revenues.
12 other Pest acquisitions in Emerging & Growth markets.
Countries include: Brazil, Canada, Chile, Costa Rica, Malaysia, the Netherlands, New Zealand, Singapore, Sweden, UAE and the US.
H1 cash spend on M&A of £169.5m.
Anticipated spend in 2018 remains in the region of £200m to £250m.
M&A Analysis:
We monitor the integration and performance of acquired businesses closely to ensure they meet our financial hurdles. With 54 acquisitions delivered between October 2015 and March 2017, the M&A programme continues to meet expectations and to deliver in line with our targeted returns.
33
Key part of our model for compounding growth

34
H1 2018: Progress UpdateRevenue, profit and cash ahead of medium-term guidance
Double digit Ongoing Revenue growth: +14.2%
3.0% Organic growth, 3.4% adjusted for hurricane impact in Puerto Rico. H1 Pest revenues +13.0%
Encouraging Ongoing Operating Profit improvement: +13.1%
Progress in Pest Control, Hygiene and P&E in H1. Continue to focus on density building in particular.
Strong execution of M&A: annualised revenues of £117.3m.
23 acquisitions including Cannon Hygiene with £77m revenues. Strong pipeline.
Strong performance in digital and innovation
Lumnia sales of over 17,000 in H1. Digital Pest Control performing well.
The Queen’s Award for Innovation.
Improve operational and financial performance in France and French Workwear
Returned to profitable growth in H1 2018. Well placed to achieve our plan for full year profitable growth.

Mitigating our carbon footprint
35
New partnership with Cool Earth charity
will save c. 1,000 acres of rainforest in
Papua New Guinea.
Preventing deforestation is one of the most effective
carbon mitigation strategies.
Will mitigate the equivalent of Rentokil Initial’s entire
global carbon footprint.
Highly engaging for colleagues and customers.
Great fit with our mission to Protect People and
Enhance Lives.
Rentokil Initial will be funding the programme from
unclaimed dividends.
