prospectus - asia funds, energy funds, dividend funds
TRANSCRIPT

Prospectus May 1, 2018
GUINNESS|ATKINSONTM FUNDS
• Alternative Energy Fund(GAAEX)
• Asia Focus Fund(IASMX)
• Asia Pacific Dividend Builder Fund(GAADX)
• China & Hong Kong Fund(ICHKX)
• Dividend Builder Fund(GAINX)
• Global Energy Fund(GAGEX)
• Global Innovators Fund
Investor Class(IWIRX) Institutional Class(GINNX)
• Renminbi Yuan & Bond Fund(GARBX)
The Securities and Exchange Commission has not approved or disapproved these securities or passed upon the adequacy of this prospectus. Any representation to the contrary is a criminal offense.

GUINNESS|ATKINSONTM F U N D S
Prospectus May 1, 2018 TABLE OF CONTENTS SUMMARY SECTION This important section summarizes the Funds’ investments, risks, fees and past performance.
SUMMARY SECTION ................................................................................. 1
Alternative Energy Fund .......................................................................... 1 Asia Focus Fund ...................................................................................... 6 Asia Pacific Dividend Builder Fund ........................................................ 10 China & Hong Kong Fund ...................................................................... 15 Dividend Builder Fund ........................................................................... 19 Global Energy Fund ............................................................................... 23 Global Innovators Fund ......................................................................... 27 Renminbi Yuan & Bond Fund ................................................................ 32
MORE ABOUT THE FUNDS’ INVESTMENT STRATEGIES AND RISKS 38 Alternative Energy Fund ........................................................................ 38 Asia Focus Fund .................................................................................... 40 Asia Pacific Dividend Builder Fund ........................................................ 42 China & Hong Kong Fund ...................................................................... 44 Dividend Builder Fund ........................................................................... 47 Global Energy Fund ............................................................................... 49 Global Innovators Fund ......................................................................... 51 Renminbi Yuan & Bond Fund ................................................................ 53
MANAGEMENT OF THE FUNDS ............................................................. 63 Investment Advisor ................................................................................ 63 Fund Expenses ...................................................................................... 65 Distribution and Shareholder Servicing Plans ....................................... 66
SHAREHOLDER INFORMATION ............................................................. 67 How to Purchase, Exchange, and Redeem Shares .............................. 67 Purchasing ............................................................................................. 69 Exchanging and Redeeming ................................................................. 71 Additional Exchange/Redemption Information ...................................... 74 Distributions and Taxes ......................................................................... 76
FINANCIAL HIGHLIGHTS ......................................................................... 78 Alternative Energy Fund ........................................................................ 78 Asia Focus Fund .................................................................................... 79 Asia Pacific Dividend Builder Fund ........................................................ 80 China & Hong Kong Fund ...................................................................... 81 Dividend Builder Fund ........................................................................... 82 Global Energy Fund ............................................................................... 83 Global Innovators Fund – Investor Class .............................................. 84 Global Innovators Fund – Institutional Class ......................................... 85 Renminbi Yuan & Bond Fund ................................................................ 86
INDEX DESCRIPTIONS ............................................................................ 87
MORE ABOUT THE FUNDS’ INVESTMENT STRATEGIES AND RISKS This section provides details about the Funds’ investment strategies and risks.
MANAGEMENT OF THE FUNDS Review this section for information about the organizations and people who oversee the Funds.
SHAREHOLDER INFORMATION This section explains how shares are valued and how to purchase and sell shares, and provides information on dividends, distributions and taxes.
FINANCIAL STATEMENTS Review this section for details on selected financial statements of the Funds.
INDEX DESCRIPTIONS This section provides a description of each index used as a benchmark to measure a Fund’s performance.

SUMMARY SECTION
1
SUMMARY SECTION Alternative Energy Fund Investment Objective The Alternative Energy Fund’s investment objective is long-term capital appreciation. Fees and Expenses of the Fund This table describes the fees and expenses that you may pay if you buy and hold shares of the Alternative Energy Fund:
Shareholder Fees (fees paid directly from your investment) None(1)
Annual Fund Operating Expenses (expenses that you pay each year as a percentage of the value of your investments)
Management Fees: 1.00% Distribution (12b-1) Fees: None Other Expenses: 1.74%
Shareholder Servicing Plan Fees 0.19% All Other Expenses 1.55%
Total Annual Fund Operating Expenses: 2.74% Fee Waiver/Expense Reimbursement (2): Total Annual Fund Operating Expenses After Fee Waiver and/or Expense Reimbursement (2):
-0.76% 1.98%
(1) The Fund charges a $15 fee for each payment of redemption proceeds by wire transfer. (2) The Advisor has contractually agreed to reduce its fees and/or pay Fund expenses (excluding Acquired Fund Fees and Expenses,
interest, taxes, dividends on short positions and extraordinary expenses) in order to limit the Fund’s Total Annual Operating Expenses to 1.98% through June 30, 2019. To the extent that the Advisor absorbs expenses to satisfy this cap, it may recoup a portion or all of such amounts absorbed at any time within three fiscal years after the fiscal year in which such amounts were absorbed, subject to the expense cap in place at the time recoupment is sought, which cannot exceed the expense cap at the time of the waiver. The expense limitation agreement may be terminated by the Board of the Fund at any time without penalty upon 60 days’ notice.
Example This example is intended to help you compare the cost of investing in the Alternative Energy Fund with the cost of investing in other mutual funds. The Example assumes that you invest $10,000 in the Fund for the time periods indicated. The Example also assumes that your investment has a 5% return each year and that the Fund’s operating expenses remain the same. Although your actual costs may be higher or lower, under these assumptions, your costs would be:
1 Year 3 Years 5 Years 10 Years $201 $778 $1,382 $3,015
Portfolio Turnover The Fund pays transaction costs, such as commissions, when it buys and sells securities (or “turns over” its portfolio). A higher portfolio turnover may indicate higher transaction costs and may result in higher taxes when Fund shares are held in a taxable account. These costs, which are not reflected in annual fund operating expenses or in the example, affect the Fund’s performance. During the most recent fiscal year, the Fund’s portfolio turnover rate was 32.45% of the average value of its portfolio. Principal Investment Strategies The Alternative Energy Fund invests at least 80% of its net assets (plus any borrowings for investment purposes) in equity securities of alternative energy companies (both U.S. and non-U.S.). Alternative energy companies include, but are not limited to companies that generate power through solar, wind, hydroelectric, tidal wave, geothermal, biomass or biofuels and the various companies that provide the equipment and technologies that enable these sources to be tapped, used, stored or transported, including companies that create, facilitate or improve technologies that conserve or enable more efficient use of energy. The Fund will not change this policy unless it gives shareholders at

SUMMARY SECTION
2
least 60 days’ notice. Equity securities may include common stocks, preferred stocks, securities convertible into common stocks, rights and warrants. The Fund’s concentration may vary depending on changing market conditions (including but not limited to, liquidity, volatility, and the number of companies meeting selection criteria) although the Advisor has a bias towards concentration. The degree of concentration of the portfolio will vary over time, and under normal market conditions, the Fund may have as few as 25 holdings, or may hold securities in 75 or more companies. The Advisor will invest the Fund’s assets in securities of all market capitalization companies and in companies domiciled in the U.S. and foreign countries, including, potentially, companies domiciled or traded in emerging markets. Additional information on Principal Investment Strategies can be found in the prospectus. Also see Additional Investment Strategies and Risks in the Statement of Additional Information. The Fund is designed for investors who seek long-term capital appreciation through focused investment in equity securities of companies, wherever located, engaged in the alternative energy industries. Principal Risks Your investment in the Fund is subject to the risks common to all mutual funds that invest in equity securities and there can be no assurance that the Fund will achieve its investment objective. Risks associated with investments in the Fund can increase during times of market volatility. Investing in this Fund may be more risky than investing in a fund that only invests in U.S. securities due to increased volatility of foreign markets. You may lose money by investing in this Fund. The principal risks are: Market Risk. The stock markets in which the Fund invests may experience periods of volatility and instability. These fluctuations may cause a security to be worth less than it was at the time of purchase. Market risk applies to individual securities, a particular sector or the entire economy. Equity Securities Risk. The market value of an equity security may fluctuate, sometimes rapidly and unpredictably. A variety of factors can negatively impact the value of common stocks, including a company’s financial condition, as well as economic factors such as interest rates and inflation rates and non-economic factors such as political events. Foreign Securities Risk. Foreign securities experience more volatility than their domestic counterparts, in part because of higher political and economic risks, lack of reliable information, differences in accounting, audit or reporting standards, fluctuations in currency exchange rates and the risks that a foreign government may take over assets, restrict the ability to exchange currency or restrict the delivery of securities. Emerging Markets Risk. All of the risks of investing in foreign securities are heightened by investing in emerging markets. Emerging markets have been more volatile than the markets of developed countries with more mature economies. Market Capitalization Risk. The Fund invests without regard to capitalization, and will invest in small-capitalization or mid-capitalization companies, which are generally more risky than investments in larger companies; the securities of small- and mid-cap companies may be subject to greater volatility and may have lower liquidity. Management Risk. There is a risk that the investment strategy does not achieve the Fund’s objective, or that the portfolio manager’s judgment as to the growth, income or dividend potential or value of a security proves to be wrong, or that the Advisor does not implement the strategy properly. Diversification Risk. The Fund is non-diversified. It may hold larger positions in a relatively small number of stocks. This may make the Fund’s performance more volatile than would be the case if it had a diversified investment portfolio.

SUMMARY SECTION
3
Industry Risks. Prices of energy (including traditional sources of energy such as oil, gas, or electricity) or alternative energy may fluctuate or decline due to many factors, including international political developments, production and distribution policies of the OPEC (Organization of Petroleum Exporting Countries) and other oil-producing countries, changes in governmental regulations affecting the energy sector, and changes in technology affecting the alternative energy industry. A decline in energy prices would likely have a negative effect on securities held by the Fund. The Fund’s focus on the energy sector to the exclusion of other sectors exposes the Fund to greater market risk and potential monetary losses than if the Fund’s assets were diversified among various sectors. For more information on the risks of investing in this Fund, please see the Principal Risks and Risks of Investing in Our Funds in the prospectus. You may also refer to the section Risk Factors and Special Considerations in the Statement of Additional Information. Performance The annual returns bar chart demonstrates the risks of investing in the Alternative Energy Fund by showing how the Fund’s performance has varied from year to year. The table below also demonstrates these risks by showing how the Fund’s average annual returns compare with those of a broad-based securities market index, as well as two energy-sector indices that, more closely resemble the investments of the Fund. Unlike the Fund’s returns, the index returns do not reflect any deductions for fees, expenses or taxes. For additional information on these indices, please see Index Descriptions in the prospectus. Past performance, before or after taxes, is not indicative of future performance. Updated performance information is available on the Fund’s website www.gafunds.com.
During the period shown in the bar chart, the best performance for a quarter was 33.55% (for the quarter ended June 30, 2009). The worst performance was -41.68% (for the quarter ended December 31, 2008).
-66.05%
33.42%
-21.90%
-42.53%
-15.20%
61.54%
-14.29% -11.40% -17.16%
20.68%
'08 '09 '10 '11 '12 '13 '14 '15 '16 '17

SUMMARY SECTION
4
Average Annual Total Returns as of 12/31/17 One Year Five Years Ten Years Alternative Energy Fund:
Return Before Taxes 20.68% 4.16% -14.39% Return After Taxes on Distributions(1) 20.74% 4.18% -14.57% Return After Taxes on Distributions and Sale of Fund Shares(1) 11.91% 3.26% -8.74%
Wilderhill Clean Energy Index (ECO) 39.81% 5.15% -15.04% Wilderhill New Energy Global Innovation Index (NEX) 28.90% 13.28% -6.24% MSCI World Index 23.10% 12.30% 5.68%
(1) After-tax returns are calculated using the historically highest individual federal marginal income tax rates and do not reflect the
impact of state and local taxes. Actual after-tax returns depend on an investor’s tax situation and may differ from those shown, and after-tax returns shown are not relevant to investors who hold their Fund shares through tax-deferred arrangements, such as 401(k) plans or individual retirement accounts. In certain cases, the figure representing “Return After Taxes on Distributions and Sale of Fund Shares” may be higher than the other return figures for the same period. A higher after-tax return results when a capital loss occurs upon redemption and provides an assumed tax deduction that benefits the investor.
Investment Advisor Guinness AtkinsonTM Asset Management, Inc. For more information on the Investment Advisor, please see Management of the Funds in the prospectus and The Investment Advisor in the Statement of Additional Information. Portfolio Manager Edward Guinness, Portfolio Manager, has been lead manager of the Fund since April 2013 and was co-manager of the Fund from February 2007 through April 2013. Mr. Guinness is primarily responsible for the day-to-day management of the Fund’s portfolio. For additional information, please see Portfolio Management in the prospectus and Portfolio Managers in the Statement of Additional Information. Purchase and Sale of Fund Shares Investors may purchase or redeem Fund shares on any business day by written request, wire transfer, or telephone. You may conduct transactions by mail (Guinness AtkinsonTM Funds, c/o U.S. Bancorp Fund Services, LLC, 615 East Michigan Street, 3rd Floor, Milwaukee, WI 53201-0701), or by telephone at 1-800-915-6566. (Redemptions by telephone are only permitted upon previously receiving appropriate authorization.) Investors who wish to purchase, exchange or redeem Fund shares through a broker-dealer should contact the broker-dealer directly. The minimum initial and subsequent investment amounts for various types of accounts are shown below, although we may reduce or waive the minimums in some cases. The minimum initial investment is waived for broker-dealers who have entered into an agreement with the Funds’ distributor and hold shares in an omnibus account.
Type of Account Minimum Initial Investments
Subsequent Investments
Regular (new shareholder to the Guinness AtkinsonTM Fund family) $5,000 $250 Regular (current shareholder of another Guinness AtkinsonTM Fund) $2,500 $250 Retirement $1,000 $250 Gift (UGMA/UTMA) $250 $250 Automatic investment plan (initial and installment payments) $100 $100
For additional information, please see How to Purchase, Exchange and Redeem Shares in the prospectus and Additional Purchase and Redemption Information in the Statement of Additional Information. Tax Information The Fund’s distributions are taxable, and will be taxed as ordinary income or capital gains, unless you are investing through a tax-deferred arrangement, such as a 401(k) plan or an individual retirement account. Withdrawal of monies from such tax-deferred arrangements may be taxable. For additional information, please see Distributions and Taxes in the prospectus and Tax Matters in the Statement of Additional Information. Payments to Broker-Dealers and Other Financial Intermediaries If you purchase the Fund through a broker-dealer or other financial intermediary (such as a bank), the Fund and its related companies may pay the intermediary for the sale of Fund shares and related services. These payments may create a conflict of interest by influencing the broker-dealer or other intermediary and your salesperson to recommend

SUMMARY SECTION
5
the Fund over another investment. Ask your salesperson or visit your financial intermediary’s Web site for more information. Also see Distribution and Shareholder Servicing Plans in the prospectus and Distribution Agreement, Distribution Plan and Shareholder Servicing Plan and Additional Marketing and Support Payments in the Statement of Additional Information.

SUMMARY SECTION
6
Asia Focus Fund Investment Objective The Asia Focus Fund’s investment objective is long-term capital appreciation. Fees and Expenses of the Fund This table describes the fees and expenses that you may pay if you buy and hold shares of the Asia Focus Fund:
Annual Fund Operating Expenses (expenses that you pay each year as a percentage of the value of your investments)
Management Fees: 1.00% Distribution (12b-1) Fees: None Other Expenses: 1.22%
Shareholder Servicing Plan Fees 0.13% All Other Expenses 1.09%
Total Annual Fund Operating Expenses (2): 2.22% Fee Waiver/Expense Reimbursement (2): -0.24% Total Annual Fund Operating Expenses After Fee Waiver and/or Expense Reimbursement (2): 1.98% (1) The Fund charges a $15 fee for each payment of redemption proceeds by wire transfer. (2) The Advisor has contractually agreed to reduce its fees and/or pay Fund expenses (excluding Acquired Fund Fees and
Expenses, interest, taxes, dividends on short positions and extraordinary expenses) in order to limit the Fund’s Total Annual Operating Expenses to 1.98% through June 30, 2019. To the extent that the Advisor absorbs expenses to satisfy this cap, it may recoup a portion or all of such amounts absorbed at any time within three fiscal years after the fiscal year in which such amounts were absorbed, subject to the expense cap in place at the time recoupment is sought, which cannot exceed the expense cap at the time of the waiver. The expense limitation agreement may be terminated by the Board of the Fund at any time without penalty upon 60 days’ notice.
Example This example is intended to help you compare the cost of investing in the Asia Focus Fund with the cost of investing in other mutual funds. The Example assumes that you invest $10,000 in the Fund for the time periods indicated. The Example also assumes that your investment has a 5% return each year and that the Fund’s operating expenses remain the same. Although your actual costs may be higher or lower, under these assumptions, your costs would be:
1 Year 3 Years 5 Years 10 Years $201 $671 $1,168 $2,536
Portfolio Turnover The Fund pays transaction costs, such as commissions, when it buys and sells securities (or “turns over” its portfolio). A higher portfolio turnover may indicate higher transaction costs and may result in higher taxes when Fund shares are held in a taxable account. These costs, which are not reflected in annual fund operating expenses or in the example, affect the Fund’s performance. During the most recent fiscal year, the Fund’s portfolio turnover rate was 13.24% of the average value of its portfolio. Principal Investment Strategies The Asia Focus Fund invests at least 80% of its net assets (plus any borrowings for investment purposes) in equity securities of Asian companies (excluding Japan). Equity securities may include common stocks, preferred stocks, securities convertible into common stocks, rights and warrants. Under normal market conditions the Asia Focus Fund will invest in securities of at least four different countries, which include but are not limited to Mainland China, Hong Kong, Taiwan, South Korea, Singapore, Thailand, Malaysia, Philippines, Vietnam, Indonesia, India, Pakistan, Bangladesh, and Sri Lanka. The Fund’s concentration may vary depending on changing market conditions (including but not limited to, liquidity, volatility, and the number of companies meeting selection criteria) although the Advisor has a bias towards concentration. The degree of concentration of the portfolio will vary over time, and under normal
Shareholder Fees (fees paid directly from your investment(1) Redemption/Exchange Fee for shares held less than 30 days from purchase (as a percentage of amount redeemed) (plus a $15 wire fee, if applicable): 2.00%

SUMMARY SECTION
7
market conditions, the Fund may have as few as 25 holdings, or may hold securities in 75 or more companies. The Advisor will invest the Fund’s assets in securities of all market capitalization companies, including companies in emerging markets. Additional information on Principal Investment Strategies can be found in the prospectus. Also see Additional Investment Strategies and Risks in the Statement of Additional Information. The Fund is designed for investors who seek long-term capital appreciation through focused investment in Asian companies (excluding Japan). Principal Risks Your investment in the Fund is subject to the risks common to all mutual funds that invest in equity securities and there can be no assurance that the Fund will achieve its investment objective. Risks associated with investments in the Fund can increase during times of market volatility. Investing in this Fund may be more risky than investing in a fund that only invests in U.S. securities due to increased volatility of foreign markets. You may lose money by investing in this Fund. The principal risks are: Market Risk. The Asian stock markets in which the Fund invests may experience periods of volatility and instability. These fluctuations may cause a security to be worth less than it was at the time of purchase. Market risk applies to individual securities, a particular sector or the entire economy. Asian stocks may fall out of favor with investors, the value of Asian currencies may decline relative to the U.S. dollar and/or Asian stock markets may decline generally. Some domestic China “A” Shares are available through the Hong Kong Stock Connect or Shenzhen Stock Connect, which may be subject to risks of trading suspensions, quota limitations and additional risks that could affect liquidity and settlement, which differ from comparable risks associated with Chinese securities traded on other securities markets. Equity Securities Risk. The market value of an equity security may fluctuate, sometimes rapidly and unpredictably. A variety of factors can negatively impact the value of common stocks, including a company’s financial condition, as well as economic factors such as interest rates and inflation rates and non-economic factors such as political events. Foreign Securities Risk. Foreign securities experience more volatility than their domestic counterparts, in part because of higher political and economic risks, lack of reliable information, differences in accounting, audit or reporting standards, fluctuations in currency exchange rates and the risks that a foreign government may take over assets, restrict the ability to exchange currency or restrict the delivery of securities. Emerging Markets Risk. All of the risks of investing in foreign securities are heightened by investing in emerging markets. Emerging markets have been more volatile than the markets of developed countries with more mature economies. Market Capitalization Risk. The Fund invests without regard to capitalization, and will invest in small-capitalization or mid-capitalization companies, which are generally more risky than investments in larger companies; the securities of small- and mid-cap companies may be subject to greater volatility and may have lower liquidity. Management Risk. There is a risk that the investment strategy does not achieve the Fund’s objective, or that the portfolio manager’s judgment as to the growth, income or dividend potential or value of a security proves to be wrong, or that the Advisor does not implement the strategy properly. Diversification Risk. The Fund is non-diversified. It may hold larger positions in a relatively small number of stocks. This may make the Fund’s performance more volatile than would be the case if it had a diversified investment portfolio. The Fund’s focus on Asian stocks to the exclusion of other regions exposes the Fund to great market risk and potential monetary losses than if the Fund’s assets were diversified among other regions. For more information on the risks of investing in this Fund, please see the Principal Risks, Risks of Investing in Asia, and Risks of Investing in Our Funds in the prospectus. You may also refer to the section Risk Factors and Special Considerations in the Statement of Additional Information.

SUMMARY SECTION
8
Performance The annual returns bar chart demonstrates the risks of investing in the Asia Focus Fund by showing how the Fund’s performance has varied from year to year. The table below also demonstrates these risks by showing how the Fund’s average annual returns compare with those of two broad-based securities market indices. Unlike the Fund’s returns, the index returns do not reflect any deductions for fees, expenses or taxes. For additional information on these indices, please see Index Descriptions in the prospectus. Past performance, before or after taxes, is not indicative of future performance. Updated performance information is available on the Fund’s website www.gafunds.com.
During the period shown in the bar chart, the best performance for a quarter was 46.66% (for the quarter ended June 30, 2009). The worst performance was -33.27% (for the quarter ended September 30, 2008). Average Annual Total Returns as of 12/31/17 One Year Five Years Ten Years Asia Focus Fund:
Return Before Taxes 47.10% 5.38% 1.09% Return After Taxes on Distributions(1) 47.32% 5.40% 0.97% Return After Taxes on Distributions and Sale of Fund Shares(1) 27.45% 4.45% 0.98%
MSCI AC Far East ex Japan Index 42.32% 8.15% 4.63% (1) After-tax returns are calculated using the historically highest individual federal marginal income tax rates and do not reflect the impact of state and local taxes. Actual after-tax returns depend on an investor’s tax situation and may differ from those shown, and after-tax returns shown are not relevant to investors who hold their Fund shares through tax-deferred arrangements, such as 401(k) plans or individual retirement accounts. In certain cases, the figure representing “Return After Taxes on Distributions and Sale of Fund Shares” may be higher than the other return figures for the same period. A higher after-tax return results when a capital loss occurs upon redemption and provides an assumed tax deduction that benefits the investor.
Investment Advisor Guinness AtkinsonTM Asset Management, Inc. For more information on the Investment Advisor, please see Management of the Funds in the prospectus and The Investment Advisor in the Statement of Additional Information. Portfolio Manager Edmund Harriss, Portfolio Manager, has been the portfolio manager of the Fund since 2003, and is primarily responsible for the day-to-day management of the Fund’s portfolio. For additional information, please see Portfolio Management in the prospectus and Portfolio Managers in the Statement of Additional Information. Purchase and Sale of Fund Shares Investors may purchase or redeem Fund shares on any business day by written request, wire transfer, or telephone. You may conduct transactions by mail (Guinness AtkinsonTM Funds, c/o U.S. Bancorp Fund Services, LLC, 615 East Michigan Street, 3rd Floor, Milwaukee, WI 53201-0701), or by telephone at 1-800-915-6566. (Redemptions by telephone are only permitted upon previously receiving appropriate authorization.) Investors who wish to purchase, exchange or redeem Fund shares through a broker-dealer should contact the broker-dealer directly. The minimum
-57.38%
86.05%
20.43%
-22.35%
15.71%
-10.24%
1.91%
-11.56%
9.20%
47.10%
'08 '09 '10 '11 '12 '13 '14 '15 '16 '17

SUMMARY SECTION
9
initial and subsequent investment amounts for various types of accounts are shown below, although we may reduce or waive the minimums in some cases. The minimum initial investment is waived for broker-dealers who have entered into an agreement with the Funds’ distributor and hold shares in an omnibus account.
Type of Account Minimum Initial Investments
Subsequent Investments
Regular (new shareholder to the Guinness AtkinsonTM Fund family) $5,000 $250 Regular (current shareholder of another Guinness AtkinsonTM Fund) $2,500 $250 Retirement $1,000 $250 Gift (UGMA/UTMA) $250 $250 Automatic investment plan (initial and installment payments) $100 $100
For additional information, please see How to Purchase, Exchange and Sell Shares in the prospectus and Additional Purchase and Redemption Information in the Statement of Additional Information. Tax Information The Fund’s distributions are taxable, and will be taxed as ordinary income or capital gains, unless you are investing through a tax-deferred arrangement, such as a 401(k) plan or an individual retirement account. Withdrawal of monies from such tax-deferred arrangements may be taxable. For additional information, please see Distributions and Taxes in the prospectus and Tax Matters in the Statement of Additional Information. Payments to Broker-Dealers and Other Financial Intermediaries If you purchase the Fund through a broker-dealer or other financial intermediary (such as a bank), the Fund and its related companies may pay the intermediary for the sale of Fund shares and related services. These payments may create a conflict of interest by influencing the broker-dealer or other intermediary and your salesperson to recommend the Fund over another investment. Ask your salesperson or visit your financial intermediary’s Web site for more information. Also see Distribution and Shareholder Servicing Plans in the prospectus and Distribution Agreement, Distribution Plan and Shareholder Servicing Plan and Additional Marketing and Support Payments in the Statement of Additional Information.
SUMMARY SECTION
10
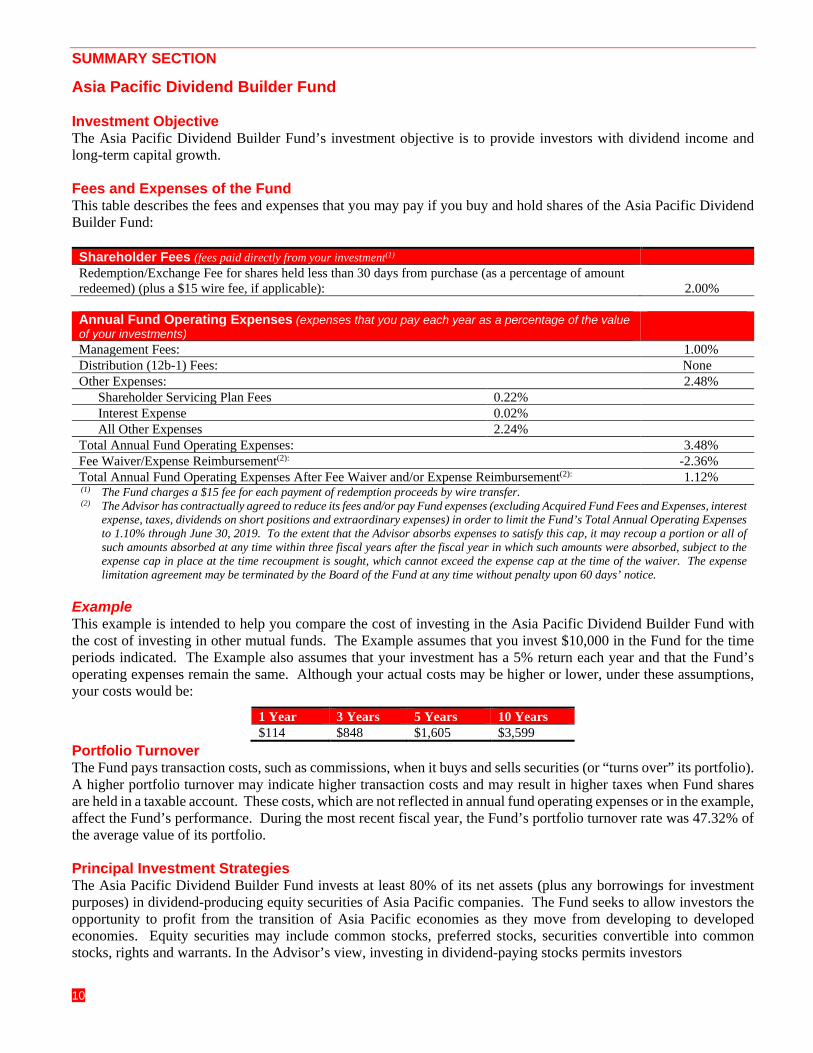
Asia Pacific Dividend Builder Fund Investment Objective The Asia Pacific Dividend Builder Fund’s investment objective is to provide investors with dividend income and long-term capital growth. Fees and Expenses of the Fund This table describes the fees and expenses that you may pay if you buy and hold shares of the Asia Pacific Dividend Builder Fund: Shareholder Fees (fees paid directly from your investment(1) Redemption/Exchange Fee for shares held less than 30 days from purchase (as a percentage of amount redeemed) (plus a $15 wire fee, if applicable): 2.00%
Annual Fund Operating Expenses (expenses that you pay each year as a percentage of the value of your investments)
Management Fees: 1.00% Distribution (12b-1) Fees: None Other Expenses: 2.48%
Shareholder Servicing Plan Fees 0.22% Interest Expense 0.02% All Other Expenses 2.24%
Total Annual Fund Operating Expenses: 3.48% Fee Waiver/Expense Reimbursement(2): -2.36% Total Annual Fund Operating Expenses After Fee Waiver and/or Expense Reimbursement(2): 1.12% (1) The Fund charges a $15 fee for each payment of redemption proceeds by wire transfer. (2) The Advisor has contractually agreed to reduce its fees and/or pay Fund expenses (excluding Acquired Fund Fees and Expenses, interest
expense, taxes, dividends on short positions and extraordinary expenses) in order to limit the Fund’s Total Annual Operating Expenses to 1.10% through June 30, 2019. To the extent that the Advisor absorbs expenses to satisfy this cap, it may recoup a portion or all of such amounts absorbed at any time within three fiscal years after the fiscal year in which such amounts were absorbed, subject to the expense cap in place at the time recoupment is sought, which cannot exceed the expense cap at the time of the waiver. The expense limitation agreement may be terminated by the Board of the Fund at any time without penalty upon 60 days’ notice.
Example This example is intended to help you compare the cost of investing in the Asia Pacific Dividend Builder Fund with the cost of investing in other mutual funds. The Example assumes that you invest $10,000 in the Fund for the time periods indicated. The Example also assumes that your investment has a 5% return each year and that the Fund’s operating expenses remain the same. Although your actual costs may be higher or lower, under these assumptions, your costs would be:
1 Year 3 Years 5 Years 10 Years $114 $848 $1,605 $3,599
Portfolio Turnover The Fund pays transaction costs, such as commissions, when it buys and sells securities (or “turns over” its portfolio). A higher portfolio turnover may indicate higher transaction costs and may result in higher taxes when Fund shares are held in a taxable account. These costs, which are not reflected in annual fund operating expenses or in the example, affect the Fund’s performance. During the most recent fiscal year, the Fund’s portfolio turnover rate was 47.32% of the average value of its portfolio. Principal Investment Strategies The Asia Pacific Dividend Builder Fund invests at least 80% of its net assets (plus any borrowings for investment purposes) in dividend-producing equity securities of Asia Pacific companies. The Fund seeks to allow investors the opportunity to profit from the transition of Asia Pacific economies as they move from developing to developed economies. Equity securities may include common stocks, preferred stocks, securities convertible into common stocks, rights and warrants. In the Advisor’s view, investing in dividend-paying stocks permits investors

SUMMARY SECTION
11
to gain access to the more established companies in the region. The Advisor seeks to invest in companies that have returned a real cash flow return on investment of at least 8% for each of the last eight years, and, in the opinion of the Advisor, are likely to grow their dividend over time. Under normal market conditions the Asia Pacific Dividend Builder Fund will invest in at least four different countries, which include but are not limited to Australia, Bangladesh, China, Hong Kong, India, Japan, Indonesia, Malaysia, New Zealand, Pakistan, Philippines, Singapore, South Korea, Sri Lanka, Taiwan, Thailand and Vietnam. The Fund’s concentration may vary depending on changing market conditions (including but not limited to, liquidity, volatility, and the number of companies meeting selection criteria) although the Advisor has a bias towards concentration. The degree of concentration of the portfolio will vary over time, and under normal market conditions, the Fund may have as few as 25 holdings, or may hold securities in 75 or more companies. The Advisor will invest the Fund’s assets in securities of all market capitalization companies that are dividend-producing and in companies domiciled in the Asia Pacific region, including, potentially, companies domiciled or traded in emerging markets. Additional information on Principal Investment Strategies can be found in the prospectus. Also see Additional Investment Strategies and Risks in the Statement of Additional Information. The Fund is designed for investors who seek dividend income and long-term capital appreciation through focused investment in dividend-producing stocks of Asia Pacific companies. Principal Risks Your investment in the Fund is subject to the risks common to all mutual funds that invest in equity securities and there can be no assurance that the Fund will achieve its investment objective. Risks associated with investments in the Fund can increase during times of market volatility. Investing in this Fund may be more risky than investing in a fund that only invests in U.S. securities due to increased volatility of foreign markets. You may lose money by investing in this Fund. The principal risks are: Market Risk. The Asia Pacific stock markets in which the Fund invests may experience periods of volatility and instability. These fluctuations may cause a security to be worth less than it was at the time of purchase. Market risk applies to individual securities, a particular sector or the entire economy. Asia Pacific stocks may fall out of favor with investors, the value of Asia Pacific currencies may decline relative to the U.S. dollar and/or Asia Pacific stock markets may decline generally. Some domestic China “A” Shares are available through the Hong Kong Stock Connect or Shenzhen Stock Connect, which may be subject to risks of trading suspensions, quota limitations and additional risks that could affect liquidity and settlement, which differ from comparable risks associated with Chinese securities traded on other securities markets. Equity Securities Risk. The market value of an equity security may fluctuate, sometimes rapidly and unpredictably. A variety of factors can negatively impact the value of common stocks, including a company’s financial condition, as well as economic factors such as interest rates and inflation rates and non-economic factors such as political events. Foreign Securities Risk. Foreign securities experience more volatility than their domestic counterparts, in part because of higher political and economic risks, lack of reliable information, differences in accounting, audit or reporting standards, fluctuations in currency exchange rates and the risks that a foreign government may take over assets, restrict the ability to exchange currency or restrict the delivery of securities. Emerging Markets Risk. All of the risks of investing in foreign securities are heightened by investing in emerging markets. Emerging markets have been more volatile than the markets of developed countries with more mature economies. Market Capitalization Risk. The Fund invests without regard to capitalization, and will invest in small-capitalization or mid-capitalization companies, which are generally more risky than investments in larger companies; the securities of small- and mid-cap companies may be subject to greater volatility and may have lower liquidity.
SUMMARY SECTION
12
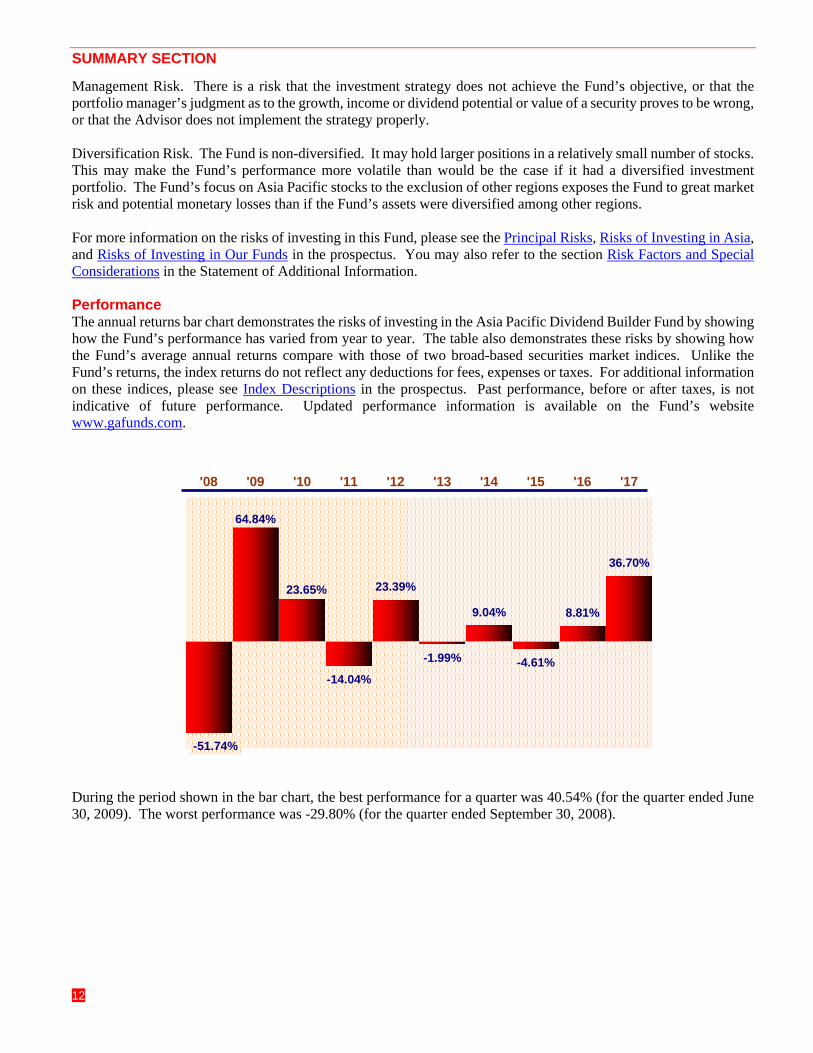
Management Risk. There is a risk that the investment strategy does not achieve the Fund’s objective, or that the portfolio manager’s judgment as to the growth, income or dividend potential or value of a security proves to be wrong, or that the Advisor does not implement the strategy properly. Diversification Risk. The Fund is non-diversified. It may hold larger positions in a relatively small number of stocks. This may make the Fund’s performance more volatile than would be the case if it had a diversified investment portfolio. The Fund’s focus on Asia Pacific stocks to the exclusion of other regions exposes the Fund to great market risk and potential monetary losses than if the Fund’s assets were diversified among other regions. For more information on the risks of investing in this Fund, please see the Principal Risks, Risks of Investing in Asia, and Risks of Investing in Our Funds in the prospectus. You may also refer to the section Risk Factors and Special Considerations in the Statement of Additional Information. Performance The annual returns bar chart demonstrates the risks of investing in the Asia Pacific Dividend Builder Fund by showing how the Fund’s performance has varied from year to year. The table also demonstrates these risks by showing how the Fund’s average annual returns compare with those of two broad-based securities market indices. Unlike the Fund’s returns, the index returns do not reflect any deductions for fees, expenses or taxes. For additional information on these indices, please see Index Descriptions in the prospectus. Past performance, before or after taxes, is not indicative of future performance. Updated performance information is available on the Fund’s website www.gafunds.com.
During the period shown in the bar chart, the best performance for a quarter was 40.54% (for the quarter ended June 30, 2009). The worst performance was -29.80% (for the quarter ended September 30, 2008).
-51.74%
64.84%
23.65%
-14.04%
23.39%
-1.99%
9.04%
-4.61%
8.81%
36.70%
'08 '09 '10 '11 '12 '13 '14 '15 '16 '17

SUMMARY SECTION
13
Average Annual Total Returns as of 12/31/17 One Year Five Years Ten Years Asia Pacific Dividend Builder Fund:
Return Before Taxes 36.70% 8.68% 4.69% Return After Taxes on Distributions(1) 36.32% 8.07% 4.00% Return After Taxes on Distributions and Sale of Fund Shares(1) 21.90% 6.80% 3.61%
MSCI AC Pacific ex Japan Index 37.51% 7.64% 4.73%
(1) After-tax returns are calculated using the historically highest individual federal marginal income tax rates and do not reflect the impact
of state and local taxes. Actual after-tax returns depend on an investor’s tax situation and may differ from those shown, and after-tax returns shown are not relevant to investors who hold their Fund shares through tax-deferred arrangements, such as 401(k) plans or individual retirement accounts. In certain cases, the figure representing “Return After Taxes on Distributions and Sale of Fund Shares” may be higher than the other return figures for the same period. A higher after-tax return results when a capital loss occurs upon redemption and provides an assumed tax deduction that benefits the investor.
Investment Advisor Guinness AtkinsonTM Asset Management, Inc. For more information on the Investment Advisor, please see Management of the Funds in the prospectus and The Investment Advisor in the Statement of Additional Information. Portfolio Manager Edmund Harriss, Portfolio Manager, has been the lead portfolio manager of the Fund since inception in March 2006. Mark Hammonds, Portfolio Manager, has been the co-portfolio manager of the Fund since May 2017. Messrs. Harriss and Hammonds are jointly and primarily responsible for the day-to-day management of the Fund’s portfolio. For additional information, please see Portfolio Management in the prospectus and Portfolio Managers in the Statement of Additional Information. Purchase and Sale of Fund Shares Investors may purchase or redeem Fund shares on any business day by written request, wire transfer, or telephone. You may conduct transactions by mail (Guinness AtkinsonTM Funds, c/o U.S. Bancorp Fund Services, LLC, 615 East Michigan Street, 3rd Floor, Milwaukee, WI 53201-0701), or by telephone at 1-800-915-6566. (Redemptions by telephone are only permitted upon previously receiving appropriate authorization.) Investors who wish to purchase, exchange or redeem Fund shares through a broker-dealer should contact the broker-dealer directly. The minimum initial and subsequent investment amounts for various types of accounts are shown below, although we may reduce or waive the minimums in some cases. The minimum initial investment is waived for broker-dealers who have entered into an agreement with the Funds’ distributor and hold shares in an omnibus account.
Type of Account Minimum Initial Investments
Subsequent Investments
Regular (new shareholder to the Guinness AtkinsonTM Fund family) $5,000 $250 Regular (current shareholder of another Guinness AtkinsonTM Fund) $2,500 $250 Retirement $1,000 $250 Gift (UGMA/UTMA) $250 $250 Automatic investment plan (initial and installment payments) $100 $100
For additional information, please see How to Purchase, Exchange and Redeem Shares in the prospectus and Additional Purchase and Redemption Information in the Statement of Additional Information. Tax Information The Fund’s distributions are taxable, and will be taxed as ordinary income or capital gains, unless you are investing through a tax-deferred arrangement, such as a 401(k) plan or an individual retirement account. Withdrawals of monies from such tax-deferred arrangements may be taxable. For additional information, please see Distributions and Taxes in the prospectus and Tax Matters in the Statement of Additional Information. Payments to Broker-Dealers and Other Financial Intermediaries If you purchase the Fund through a broker-dealer or other financial intermediary (such as a bank), the Fund and its related companies may pay the intermediary for the sale of Fund shares and related services. These payments may

SUMMARY SECTION
14
create a conflict of interest by influencing the broker-dealer or other intermediary and your salesperson to recommend the Fund over another investment. Ask your salesperson or visit your financial intermediary’s Web site for more information. Also see Distribution and Shareholder Servicing Plans in the prospectus and Distribution Agreement, Distribution Plan and Shareholder Servicing Plan and Additional Marketing and Support Payments in the Statement of Additional Information.

SUMMARY SECTION
15
China & Hong Kong Fund Investment Objective The China & Hong Kong Fund’s investment objective is long-term capital appreciation primarily through investments in securities of China and Hong Kong. Fees and Expenses of the Fund This table describes the fees and expenses that you may pay if you buy and hold shares of the China & Hong Kong Fund:
Shareholder Fees (fees paid directly from your investment(1) Redemption/Exchange Fee for shares held less than 30 days from purchase (as a percentage of amount redeemed) ( plus a $15 wire fee, if applicable): 2.00%
Annual Fund Operating Expenses (expenses that you pay each year as a percentage of the value of your investments)
Management Fees: 1.00% Distribution (12b-1) Fees: None Other Expenses: 0.64%
Shareholder Servicing Plan Fees 0.12% All Other Expenses 0.52%
Total Annual Fund Operating Expenses: 1.64% (1) The Fund charges a $15 fee for each payment of redemption proceeds by wire transfer.
Example This example is intended to help you compare the cost of investing in the China & Hong Kong Fund with the cost of investing in other mutual funds. The Example assumes that you invest $10,000 in the Fund for the time periods indicated. The Example also assumes that your investment has a 5% return each year and that the Fund’s operating expenses remain the same. Although your actual costs may be higher or lower, under these assumptions, your costs would be:
1 Year 3 Years 5 Years 10 Years $167 $517 $892 $1,944
Portfolio Turnover The Fund pays transaction costs, such as commissions, when it buys and sells securities (or “turns over” its portfolio). A higher portfolio turnover may indicate higher transaction costs and may result in higher taxes when Fund shares are held in a taxable account. These costs, which are not reflected in annual fund operating expenses or in the example, affect the Fund’s performance. During the most recent fiscal year, the Fund’s portfolio turnover rate was 20.78% of the average value of its portfolio. Principal Investment Strategies The China & Hong Kong Fund invests at least 80% of its net assets (plus any borrowings for investment purposes) in equity securities of companies that are either primarily traded on the China or Hong Kong exchanges or that derive at least 50% of their revenues from business activities in China and/or Hong Kong, but which may be listed and traded elsewhere. Equity securities may include common stocks, preferred stocks, securities convertible into common stocks, rights and warrants. The Fund’s concentration may vary depending on changing market conditions (including but not limited to, liquidity, volatility, and the number of companies meeting selection criteria) although the Advisor has a bias towards concentration. The degree of concentration of the portfolio will vary over time, and under normal market conditions, the Fund may have as few as 25 holdings, or may hold securities in 75 or more companies. The Advisor will invest the Fund’s assets in securities of all market capitalization companies, including companies in emerging markets. Additional information on Principal Investment Strategies can be found in the prospectus. Also see Additional Investment Strategies and Risks in the Statement of Additional Information.

SUMMARY SECTION
16
The Fund is designed for investors who seek long-term capital appreciation through focused investment in securities of companies traded in or economically tied to China and Hong Kong. Principal Risks Your investment in the Fund is subject to the risks common to all mutual funds that invest in equity securities and there can be no assurance that the Fund will achieve its investment objective. Risks associated with investments in the Fund can increase during times of market volatility. Investing in this Fund may be more risky than investing in a fund that only invests in U.S. securities due to increased volatility of foreign markets. You may lose money by investing in this Fund. The principal risks are: Market Risk. The China and/or Hong Kong stock markets in which the Fund invests may experience periods of volatility and instability. These fluctuations may cause a security to be worth less than it was at the time of purchase. Market risk applies to individual securities, a particular sector or the entire economy. China and/or Hong Kong stocks may fall out of favor with investors, the value of Chinese currencies may decline relative to the U.S. dollar and/or China or Hong Kong stock markets may decline generally. Equity Securities Risk. The market value of an equity security may fluctuate, sometimes rapidly and unpredictably. A variety of factors can negatively impact the value of common stocks, including a company’s financial condition, as well as economic factors such as interest rates and inflation rates and non-economic factors such as political events. Stocks in the portfolio may not perform well. Foreign Securities Risk. Foreign securities experience more volatility than their domestic counterparts, in part because of higher political and economic risks, lack of reliable information, differences in accounting, audit or reporting standards, fluctuations in currency exchange rates and the risks that a foreign government may take over assets, restrict the ability to exchange currency or restrict the delivery of securities. Emerging Markets Risk. All of the risks of investing in foreign securities are heightened by investing in emerging markets. Emerging markets have been more volatile than the markets of developed countries with more mature economies. Market Capitalization Risk. The Fund invests without regard to capitalization, and will invest in small-capitalization or mid-capitalization companies, which are generally more risky than investments in larger companies; the securities of small- and mid-cap companies may be subject to greater volatility and may have lower liquidity. Management Risk. There is a risk that the investment strategy does not achieve the Fund’s objective, or that the portfolio manager’s judgment as to the growth, income or dividend potential or value of a security proves to be wrong, or that the Advisor does not implement the strategy properly. Diversification Risk. The Fund is non-diversified. It may hold larger positions in a relatively small number of stocks. This may make the Fund’s performance more volatile than would be the case if it had a diversified investment portfolio. The Fund’s focus on stocks connected to China and/or Hong Kong to the exclusion of other regions exposes the Fund to great market risk and potential monetary losses than if the Fund’s assets were diversified among other regions. For more information on the risks of investing in this Fund, please see the Principal Risks, Risks of Investing in Asia, and Risks of Investing in Our Funds in the prospectus. You may also refer to the section Risk Factors and Special Considerations in the Statement of Additional Information. Performance The annual returns bar chart demonstrates the risks of investing in the China & Hong Kong Fund by showing how the Fund’s performance has varied from year to year. The table also demonstrates these risks by showing how the Fund’s average annual returns compare with those of three broad-based securities market indices. Unlike the Fund’s returns, the index returns do not reflect any deductions for fees, expenses or taxes. For additional information on

SUMMARY SECTION
17
these indices, please see Index Descriptions in the prospectus. Past performance, before or after taxes, is not indicative of future performance. Updated performance information is available on the Fund’s website www.gafunds.com.
During the period shown in the bar chart, the best performance for a quarter was 44.53% (for the quarter ended June 30, 2009). The worst performance was -30.04% (for the quarter ended September 30, 2011).
Average Annual Total Returns as of 12/31/17 One Year Five Years Ten Years China & Hong Kong Fund:
Return Before Taxes 48.85% 8.13% 2.18% Return After Taxes on Distributions(1) 46.77% 5.82% 0.76% Return After Taxes on Distributions and Sale of Fund Shares(1) 29.69% 6.01% 1.51%
Hang Seng Composite Index 41.91% 9.39% 3.82%
(1) After-tax returns are calculated using the historically highest individual federal marginal income tax rates and do not reflect the impact of state and local taxes. Actual after-tax returns depend on an investor’s tax situation and may differ from those shown, and after-tax returns shown are not relevant to investors who hold their Fund shares through tax-deferred arrangements, such as 401(k) plans or individual retirement accounts. In certain cases, the figure representing “Return After Taxes on Distributions and Sale of Fund Shares” may be higher than the other return figures for the same period. A higher after-tax return results when a capital loss occurs upon redemption and provides an assumed tax deduction that benefits the investor.
Investment Advisor Guinness AtkinsonTM Asset Management, Inc. For more information on the Investment Advisor, please see Management of the Funds in the prospectus and The Investment Advisor in the Statement of Additional Information. Portfolio Manager Edmund Harriss, Portfolio Manager, has been the portfolio manager of the Fund since 1998, and is primarily responsible for the day-to-day management of the Fund’s portfolio. For additional information, please see Portfolio Management in the prospectus and Portfolio Managers in the Statement of Additional Information. Purchase and Sale of Fund Shares Investors may purchase or redeem Fund shares on any business day by written request, wire transfer, or telephone. You may conduct transactions by mail (Guinness AtkinsonTM Funds, c/o U.S. Bancorp Fund Services, LLC, 615 East Michigan Street, 3rd Floor, Milwaukee, WI 53201-0701), or by telephone at 1-800-915-6566. (Redemptions by telephone are only permitted upon previously receiving appropriate authorization.) Investors who wish to purchase, exchange or redeem Fund shares through a broker-dealer should contact the broker-dealer directly. The minimum initial and subsequent investment amounts for various types of accounts are shown below, although we may reduce
-54.47%
92.76%
15.38%
-27.52%
14.42% 6.45%
-1.97% -7.58%
2.95%
48.85%
'08 '09 '10 '11 '12 '13 '14 '15 '16 '17

SUMMARY SECTION
18
or waive the minimums in some cases. The minimum initial investment is waived for broker-dealers who have entered into an agreement with the Funds’ distributor and hold shares in an omnibus account.
Type of Account Minimum Initial Investments
Subsequent Investments
Regular (new shareholder to the Guinness AtkinsonTM Fund family) $5,000 $250 Regular (current shareholder of another Guinness AtkinsonTM Fund) $2,500 $250 Retirement $1,000 $250 Gift (UGMA/UTMA) $250 $250 Automatic investment plan (initial and installment payments) $100 $100
For additional information, please see How to Purchase, Exchange and Redeem Shares in the prospectus and Additional Purchase and Redemption Information in the Statement of Additional Information. Tax Information The Fund’s distributions are taxable, and will be taxed as ordinary income or capital gains, unless you are investing through a tax-deferred arrangement, such as a 401(k) plan or an individual retirement account. Withdrawals of monies from such tax-deferred arrangements may be taxable. For additional information, please see Distributions and Taxes in the prospectus and Tax Matters in the Statement of Additional Information. Payments to Broker-Dealers and Other Financial Intermediaries If you purchase the Fund through a broker-dealer or other financial intermediary (such as a bank), the Fund and its related companies may pay the intermediary for the sale of Fund shares and related services. These payments may create a conflict of interest by influencing the broker-dealer or other intermediary and your salesperson to recommend the Fund over another investment. Ask your salesperson or visit your financial intermediary’s Web site for more information. Also see Distribution and Shareholder Servicing Plans in the prospectus and Distribution Agreement, Distribution Plan and Shareholder Servicing Plan and Additional Marketing and Support Payments in the Statement of Additional Information.

SUMMARY SECTION
19
Dividend Builder Fund Investment Objective The Dividend Builder Fund seeks a moderate level of current income and consistent dividend growth at a rate that exceeds inflation. Fees and Expenses of the Fund This table describes the fees and expenses that you may pay if you buy and hold shares of the Dividend Builder Fund. Shareholder Fees (fees paid directly from your investment) None((1)
Annual Fund Operating Expenses (expenses that you pay each year as a percentage of the value of your investments) Management Fees: 0.45% Distribution (12b-1) Fees: None Other Expenses: 1.61%
Shareholder Servicing Plan Fees 0.23% All Other Expenses 1.38%
Total Annual Fund Operating Expenses: 2.06% Fee Waiver/Expense Reimbursement(2): -1.38% Total Annual Fund Operating Expenses After Waiver and/or Expense Reimbursement (2): 0.68%
(1) The Fund charges a $15 fee for each payment of redemption proceeds by wire transfer. (2) The Advisor has contractually agreed to reimburse expenses (excluding Acquired Fund Fees and Expenses, interest, taxes,
dividends on short positions and extraordinary expenses) in order to limit the Fund’s Total Annual Operating Expenses to 0.68% through June 30, 2019. To the extent that the Advisor absorbs expenses to satisfy this cap, it may recoup a portion or all of such amounts absorbed at any time within three fiscal years after the fiscal year in which such amounts were absorbed, subject to the expense cap in place at the time recoupment is sought, which cannot exceed the expense cap at the time of the waiver. The expense limitation agreement may be terminated by the Board of the Fund at any time without penalty upon 60 days’ notice.
Example This example is intended to help you compare the cost of investing in the Dividend Builder Fund with the cost of investing in other mutual funds. The Example assumes that you invest $10,000 in the Fund for the time periods indicated. The Example also assumes that your investment has a 5% return each year and that the Fund’s operating expenses remain the same. Although your actual costs may be higher or lower, under these assumptions, your costs would be:
1 Year 3 Years 5 Years 10 Years $69 $512 $981 $2,279
Portfolio Turnover The Fund pays transaction costs, such as commissions, when it buys and sells securities (or “turns over” its portfolio). A higher portfolio turnover rate may indicate higher transaction costs and may result in higher taxes when Fund shares are held in a taxable account. These costs, which are not reflected in the annual fund operating expenses or in the example, affect the Fund’s performance. During the most recent fiscal year, the Fund’s portfolio turnover rate was 18.61% of the average value of its portfolio. Principal Investment Strategies The Dividend Builder Fund will invest at least 80% of its net assets (plus any borrowings for investment purposes) in equity securities in dividend-paying companies that the Advisor believes have the ability to consistently increase their dividend payments over the medium term. The Advisor uses fundamental analysis to assess a company’s ability to maintain consistent, real (after inflation) dividend growth. One key measure of a company’s ability to achieve consistent, real dividend growth is its consistency in generating high returns on capital. The Advisor seeks to invest

SUMMARY SECTION
20
in companies that have returned a real cash flow return on investment of at least 10% for each of the last 10 years and, in the opinion of the Advisor, are likely to grow their dividend over time. The Fund will not change this strategy unless it gives shareholders at least 60 days’ notice. Equity Securities may include common stocks, preferred stocks, securities convertible into common stocks, rights and warrants. The Fund will consider all companies in the world’s developed and emerging markets. The Advisor will invest the Fund’s assets in securities of all market capitalization companies. Additional information on Principal Investment Strategies can be found in the prospectus. Also see Additional Investment Strategies and Risks in the Statement of Additional Information. The Fund is designed for investors who seek a moderate level of current income and investments in dividend paying companies that have the ability to increase their dividends consistently over time. Principal Risks Your investment in the Fund is subject to the risks common to all mutual funds that invest in equity securities and there can be no assurance that the Fund will achieve its investment objective. Risks associated with investments in the Fund can increase during times of market volatility. Investing in this Fund may be more risky than investing in a fund that only invests in U.S. securities due to increased volatility of foreign markets. You may lose money by investing in this Fund. The principal risks are: Market Risk. The stock markets in which the Fund invests may experience periods of volatility and instability. These fluctuations may cause a security to be worth less than it was at the time of purchase. Market risk applies to individual securities, a particular sector or the entire economy. Specific or all stocks may fall out of favor with investors, the value of foreign currencies may decline relative to the U.S. dollar and/or stock markets may decline generally. Equity Securities Risk. The market value of an equity security may fluctuate, sometimes rapidly and unpredictably. A variety of factors can negatively impact the value of common stocks, including a company’s financial condition, as well as economic factors such as interest rates and inflation rates and non-economic factors such as political events. Foreign Securities Risk. Foreign securities experience more volatility than their domestic counterparts, in part because of higher political and economic risks, lack of reliable information, differences in accounting, audit or reporting standards, fluctuations in currency exchange rates and the risks that a foreign government may take over assets, restrict the ability to exchange currency or restrict the delivery of securities. Emerging Markets Risk. All of the risks of investing in foreign securities are heightened by investing in emerging markets. Emerging markets have been more volatile than the markets of developed countries with more mature economies. Market Capitalization Risk. The Fund invests without regard to capitalization, and will invest in small-capitalization or mid-capitalization companies, which are generally more risky than investments in larger companies; the securities of small- and mid-cap companies may be subject to greater volatility and may have lower liquidity. Management Risk. There is a risk that the investment strategy does not achieve the Fund’s objective, or that the portfolio manager’s judgment as to the growth, income or dividend potential or value of a security proves to be wrong, or that the Advisor does not implement the strategy properly. Inflation Risk. Inflation is the rise in the costs of goods and services, i.e., reduced purchasing power. When the inflation rate is high, the value of stocks may decline. Dividend distributions normally offset a decline in value of a stock. Inflation risk is the risk that the rise in inflation rate is greater than expected, that markets respond differently to changes in the inflation rate than the Advisor expects, or that inflation manifests in such a way that the Fund is unable to provide reasonable protection against inflation.

SUMMARY SECTION
21
For more information on the risks of investing in this Fund please see the Principal Risks and Risks of Investing in Our Fund in the prospectus. You may also refer to the section Risk Factors and Special Considerations in the Statement of Additional Information. Performance The annual returns bar chart demonstrates the risks of investing in the Dividend Builder Fund by showing how the Fund’s performance has varied from year to year. The table also demonstrates these risks by showing how the Fund’s average annual returns compare with those of a broad-based securities market index. Unlike the Fund’s returns, the index return does not reflect any deductions for fees, expenses or taxes. For additional information on this index, please see Index Descriptions in the prospectus. Past performance, before or after taxes, is not indicative of future performance. Updated performance information is available on the Fund’s website: www.gafunds.com.
During the period shown in the bar chart, the best performance for a quarter was 8.99% (for the quarter ended March 31, 2013). The worst performance was -7.55% (for the quarter ended September 30, 2015).
Average Annual Total Returns as of 12/31/17 One Year Five Years Since Inception (March 30, 2012)
Dividend Builder Fund: Return Before Taxes 21.34% 11.24% 10.60% Return After Taxes on Distributions(1) 20.86% 10.35% 9.77% Return After Taxes on Distributions and Sale of Fund Shares(1)
12.82% 8.88% 8.43%
MSCI World Index 23.10% 12.30% 11.42%
(1) After-tax returns are calculated using the historical highest individual federal marginal income tax rates and do not reflect the impact of state and local taxes. Actual after-tax returns depend on an investor’s tax situation and may differ from those shown, and after-tax returns shown are not relevant to investors who hold their Fund shares through tax-deferred arrangements, such as 401(k) plans or individual retirement accounts. In certain cases, the figure representing “Return After Taxes on Distributions and Sale of Fund Shares” may be higher than the other return figures for the same period. A higher after-tax return results when a capital loss occurs upon redemption and provides an assumed tax deduction that benefits the investor.
Investment Advisor Guinness Atkinson™ Asset Management, Inc. For more information on the Investment Advisor, please see Management of the Fund in the prospectus and the Investment Advisor in the Statement of Additional Information. Portfolio Managers Dr. Ian Mortimer, Portfolio Manager, and Matthew Page, Portfolio Manager, have been the portfolio managers of the Fund since March 2012. Messrs. Page and Mortimer are jointly and primarily responsible for the day-to-day management of the Fund’s portfolio. For additional information, please see Portfolio Management in the
29.87%
4.99%
-3.61%
6.83%
21.34%
'13 '14 '15 '16 '17

SUMMARY SECTION
22
prospectus and Portfolio Managers in the Statement of Additional Information. Purchase and Sale of Fund Shares Investors may purchase or redeem Fund shares on any business day by written request, wire transfer, or telephone. You may conduct transactions by mail (Guinness Atkinson™ Funds, c/o U.S. Bancorp Fund Services, LLC, 615 East Michigan Street, 3rd Floor, Milwaukee, WI 53201-0701), or by telephone at 1-800-915-6566. (Redemptions by telephone are only permitted upon previously receiving appropriate authorization.) Investors who wish to purchase, exchange or redeem Fund shares through a broker-dealer should contact the broker-dealer directly. The minimum initial and subsequent investment amounts for various types of accounts are shown below, although we may reduce or waive the minimums in some cases. The minimum initial investment is waived for broker-dealers who have entered into an agreement with the Funds’ distributor and hold shares in an omnibus account.
Type of Account Minimum Initial Investment
Subsequent Investments
Regular (new shareholder to the Guinness Atkinson™ Fund Family) $10,000 $1,000 Regular (current shareholder of another Guinness Atkinson™ Fund) $5,000 $1,000 Retirement $5,000 $1,000 Gift (UGMA/UTMA) $5,000 $1,000
Account minimums at broker-dealer firms may be lower for omnibus account investments. For additional information, please see How to Purchase, Exchange and Redeem Shares in the prospectus and Additional Purchase and Redemption Information in the Statement of Additional Information. Tax Information The Fund’s distributions are taxable, and will be taxed as ordinary income or capital gains, unless you are investing through a tax-deferred arrangement, such as a 401(k) plan or an individual retirement account. Withdrawals of monies from such tax-deferred arrangements may be taxable. For additional information, please see Distributions and Taxes in the prospectus and Tax Matters in the Statement of Additional Information. Payments to Broker-Dealers and Other Financial Intermediaries If you purchase the Fund through a broker-dealer or other financial intermediary (such as a bank), the Fund and its related companies may pay the intermediary for the sale of Fund shares and related services. These payments may create a conflict of interest by influencing the broker-dealer or other intermediary and your salesperson to recommend the Fund over another investment. Ask your salesperson or visit your financial intermediary’s Web site for more information. Also see Distribution and Shareholder Servicing Plans in the prospectus and Distribution Agreement, Distribution Plan and Shareholder Servicing Plan and Additional Marketing and Support Payments in the Statement of Additional Information.

SUMMARY SECTION
23
Global Energy Fund Investment Objective The Global Energy Fund’s investment objective is long-term capital appreciation. Fees and Expenses of the Fund This table describes the fees and expenses that you may pay if you buy and hold shares of the Global Energy Fund: Shareholder Fees (fees paid directly from your investment None(1) Annual Fund Operating Expenses (expenses that you pay each year as a percentage of the value of your investments)
Management Fees: 0.75% Distribution (12b-1) Fees: None Other Expenses: 0.87%
Shareholder Servicing Plan Fees 0.22% All Other Expenses 0.65%
Total Annual Fund Operating Expenses: 1.62% Fee Waiver/Expense Reimbursement(2): -0.17% Total Annual Fund Operating Expenses After Waiver and/or Expense Reimbursement (2): 1.45% (1) The Fund charges a $15 fee for each payment of redemption proceeds by wire transfer. (2) The Advisor has contractually agreed to reimburse expenses (excluding Acquired Fund Fees and Expenses, interest, taxes, dividends on
short positions and extraordinary expenses) in order to limit the Fund’s Total Annual Operating Expenses to 1.45% through June 30, 2019. To the extent that the Advisor absorbs expenses to satisfy this cap, it may recoup a portion or all of such amounts absorbed at any time within three fiscal years after the fiscal year in which such amounts were absorbed, subject to the expense cap in place at the time recoupment is sought, which cannot exceed the expense cap at the time of the waiver. The expense limitation agreement may be terminated by the Board of the Fund at any time without penalty upon 60 days’ notice.
Example This example is intended to help you compare the cost of investing in the Global Energy Fund with the cost of investing in other mutual funds. The Example assumes that you invest $10,000 in the Fund for the time periods indicated. The Example also assumes that your investment has a 5% return each year and that the Fund’s operating expenses remain the same. Although your actual costs may be higher or lower, under these assumptions, your costs would be:
1 Year 3 Years 5 Years 10 Years $148 $495 $865 $1,908
Portfolio Turnover The Fund pays transaction costs, such as commissions, when it buys and sells securities (or “turns over” its portfolio). A higher portfolio turnover may indicate higher transaction costs and may result in higher taxes when Fund shares are held in a taxable account. These costs, which are not reflected in annual fund operating expenses or in the example, affect the Fund’s performance. During the most recent fiscal year, the Fund’s portfolio turnover rate was 6.25% of the average value of its portfolio. Principal Investment Strategies The Global Energy Fund invests at least 80% of its net assets (plus any borrowings for investment purposes) in equity securities of both U.S. and non-U.S. companies principally engaged in the production, exploration or discovery, or distribution of energy including the research and development or production of alternative energy sources. Equity securities may include common stocks, preferred stocks, securities convertible into common stocks, rights and warrants. The Advisor believes that growing demands on existing energy supplies, in particular petroleum-based energy supplies, could lead to higher prices for this and other traditional energy sources and the profitable development of alternative sources of energy. The Fund’s concentration may vary depending on changing market conditions (including but not limited to, liquidity, volatility, and the number of companies meeting selection criteria) although the Advisor has a bias towards concentration. The degree of concentration of the portfolio will vary over

SUMMARY SECTION
24
time, and under normal market conditions, the Fund may have as few as 25 holdings, or may hold securities in 75 or more companies. The Fund will invest in securities of companies without regard to market capitalization and in companies domiciled in the U.S. and foreign countries, including, potentially, companies domiciled or traded in emerging markets. The Fund expects that normally, at least 40% of the Fund’s assets will be invested in global securities. For this purpose, “global securities” means securities issued by companies with significant business activities outside the U.S. Additional information on Principal Investment Strategies can be found in the prospectus. Also see Additional Investment Strategies and Risks in the Statement of Additional Information. The Fund is designed for investors who seek long term capital appreciation primarily through investments in companies engaged in the exploration, production or distribution of oil, gas and other energy sources. Principal Risks Your investment in the Fund is subject to the risks common to all mutual funds that invest in equity securities and there can be no assurance that the Fund will achieve its investment objective. Risks associated with investments in the Fund can increase during times of market volatility. Investing in this Fund may be more risky than investing in a fund that only invests in U.S. securities due to increased volatility of foreign markets. You may lose money by investing in this Fund. The principal risks are: Market Risk. The stock markets in which the Fund invests may experience periods of volatility and instability. These fluctuations may cause a security to be worth less than it was at the time of purchase. Market risk applies to individual securities, a particular sector or the entire economy. Equity Securities Risk. The market value of an equity security may fluctuate, sometimes rapidly and unpredictably. A variety of factors can negatively impact the value of common stocks, including a company’s financial condition, as well as economic factors such as interest rates and inflation rates and non-economic factors such as political events. Foreign Securities Risk. Foreign securities experience more volatility than their domestic counterparts, in part because of higher political and economic risks, lack of reliable information, differences in accounting, audit or reporting standards, fluctuations in currency exchange rates and the risks that a foreign government may take over assets, restrict the ability to exchange currency or restrict the delivery of securities. Emerging Markets Risk. All of the risks of investing in foreign securities are heightened by investing in emerging markets. Emerging markets have been more volatile than the markets of developed countries with more mature economies. Market Capitalization Risk. The Fund invests without regard to capitalization, and will invest in small-capitalization or mid-capitalization companies, which are generally more risky than investments in larger companies; the securities of small- and mid-cap companies may be subject to greater volatility and may have lower liquidity. Management Risk. There is a risk that the investment strategy does not achieve the Fund’s objective, or that the portfolio manager’s judgment as to the growth, income or dividend potential or value of a security proves to be wrong, or that the Advisor does not implement the strategy properly. Diversification Risk. The Fund is non-diversified. It may hold larger positions in a relatively small number of stocks. This may make the Fund’s performance more volatile than would be the case if it had a diversified investment portfolio. For more information on the risks of investing in this Fund please see the Principal Risks and Risks of Investing in Our Funds in the prospectus. You may also refer to the section Risk Factors and Special Considerations in the Statement of Additional Information.

SUMMARY SECTION
25
Performance The annual returns bar chart demonstrates the risks of investing in the Global Energy Fund by showing how the Fund’s performance has varied from year to year. The table also demonstrates these risks by showing how the Fund’s average annual returns compare with those of a broad-based securities market index, as well as energy sector index that, more closely resembles the investments of the Fund. Unlike the Fund’s returns, the index returns do not reflect any deductions for fees, expenses or taxes. For additional information on these indices, please see Index Descriptions in the prospectus. Past performance, before or after taxes, is not indicative of future performance. Updated performance information is available on the Fund’s website www.gafunds.com.
During the period shown in the bar chart, the best performance for a quarter was 32.52% (for the quarter ended June 30, 2009). The worst performance was -34.08% (for the quarter ended September 30, 2008).
Average Annual Total Returns as of 12/31/17 One Year Five Years Ten Years Global Energy Fund:
Return Before Taxes -1.06% -1.67% -2.10% Return After Taxes on Distributions(1) -0.92% -1.75% -2.24% Return After Taxes on Distributions and Sale of Fund Shares(1) 0.13% -1.09% -1.45%
MSCI World Energy Index 5.95% 2.20% 0.26%
(1) After-tax returns are calculated using the historically highest individual federal marginal income tax rates and do not reflect the impact of state and local taxes. Actual after-tax returns depend on an investor’s tax situation and may differ from those shown, and after-tax returns shown are not relevant to investors who hold their Fund shares through tax-deferred arrangements, such as 401(k) plans or individual retirement accounts. In certain cases, the figure representing “Return After Taxes on Distributions and Sale of Fund Shares” may be higher than the other return figures for the same period. A higher after-tax return results when a capital loss occurs upon redemption and provides an assumed tax deduction that benefits the investor.
Investment Advisor Guinness AtkinsonTM Asset Management, Inc. For more information on the Investment Advisor, please see Management of the Funds in the prospectus and The Investment Advisor in the Statement of Additional Information. Portfolio Managers Timothy W.N. Guinness, Chief Investment Officer, has been a portfolio manager of the Fund since the Fund’s inception in 2004. Will Riley, Portfolio Manager, has been a portfolio manager of the Fund since May 2010. Jonathan Waghorn, Portfolio Manager, has been a portfolio manager of the Fund since September 2013. Messrs. Guinness, Riley and Waghorn are jointly and primarily responsible for the day-to-day management of the Fund’s portfolio.
For additional information, please see Portfolio Management in the prospectus and Portfolio Managers in the Statement of Additional Information. Purchase and Sale of Fund Shares Investors may purchase or redeem Fund shares on any business day by written request, wire transfer, or telephone. You may conduct transactions by mail (Guinness Atkinson™ Funds, c/o U.S. Bancorp Fund Services, LLC, 615 East
-48.56%
63.27%
16.63%
-13.16%
3.46%
24.58%
-19.63%-26.97%
27.04%
-1.06%
'08 '09 '10 '11 '12 '13 '14 '15 '16 '17

SUMMARY SECTION
26
Michigan Street, 3rd Floor, Milwaukee, WI 53201-0701), or by telephone at 1-800-915-6566. (Redemptions by telephone are only permitted upon previously receiving appropriate authorization.) Investors who wish to purchase, exchange or redeem Fund shares through a broker-dealer should contact the broker-dealer directly. The minimum initial and subsequent investment amounts for various types of accounts are shown below, although we may reduce or waive the minimums in some cases. The minimum initial investment is waived for broker-dealers who have entered into an agreement with the Funds’ distributor and hold shares in an omnibus account.
Type of Account Minimum Initial Investments
Subsequent Investments
Regular (new shareholder to the Guinness AtkinsonTM Fund family) $5,000 $250 Regular (current shareholder of another Guinness AtkinsonTM Fund) $2,500 $250 Retirement $1,000 $250 Gift (UGMA/UTMA) $250 $250 Automatic investment plan (initial and installment payments) $100 $100
For additional information, please see How to Purchase, Exchange and Redeem Shares in the prospectus and Additional Purchase and Redemption Information in the Statement of Additional Information. Tax Information The Fund’s distributions are taxable, and will be taxed as ordinary income or capital gains, unless you are investing through a tax-deferred arrangement, such as a 401(k) plan or an individual retirement account. Withdrawals of monies from such tax-deferred arrangements may be taxable. For additional information, please see Distributions and Taxes in the prospectus and Tax Matters in the Statement of Additional Information. Payments to Broker-Dealers and Other Financial Intermediaries If you purchase the Fund through a broker-dealer or other financial intermediary (such as a bank), the Fund and its related companies may pay the intermediary for the sale of Fund shares and related services. These payments may create a conflict of interest by influencing the broker-dealer or other intermediary and your salesperson to recommend the Fund over another investment. Ask your salesperson or visit your financial intermediary’s Web site for more information. Also see Distribution and Shareholder Servicing Plans in the prospectus and Distribution Agreement, Distribution Plan and Shareholder Servicing Plan and Additional Marketing and Support Payments in the Statement of Additional Information.
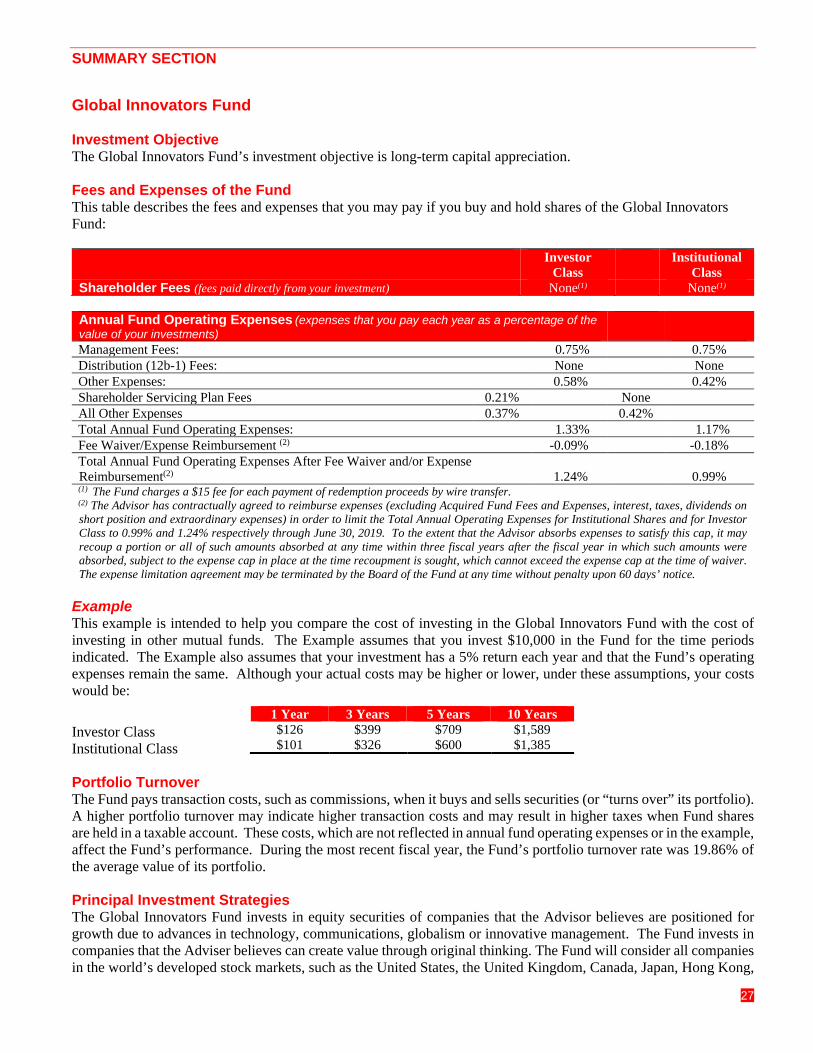
SUMMARY SECTION
27
Global Innovators Fund Investment Objective The Global Innovators Fund’s investment objective is long-term capital appreciation. Fees and Expenses of the Fund This table describes the fees and expenses that you may pay if you buy and hold shares of the Global Innovators Fund: Investor
Class Institutional
Class Shareholder Fees (fees paid directly from your investment) None(1) None(1)
Annual Fund Operating Expenses (expenses that you pay each year as a percentage of the value of your investments)
Management Fees: 0.75% 0.75% Distribution (12b-1) Fees: None None Other Expenses: 0.58% 0.42% Shareholder Servicing Plan Fees 0.21% None All Other Expenses 0.37% 0.42% Total Annual Fund Operating Expenses: 1.33% 1.17% Fee Waiver/Expense Reimbursement (2) -0.09% -0.18% Total Annual Fund Operating Expenses After Fee Waiver and/or Expense Reimbursement(2) 1.24%
0.99%
(1) The Fund charges a $15 fee for each payment of redemption proceeds by wire transfer. (2) The Advisor has contractually agreed to reimburse expenses (excluding Acquired Fund Fees and Expenses, interest, taxes, dividends on short position and extraordinary expenses) in order to limit the Total Annual Operating Expenses for Institutional Shares and for Investor Class to 0.99% and 1.24% respectively through June 30, 2019. To the extent that the Advisor absorbs expenses to satisfy this cap, it may recoup a portion or all of such amounts absorbed at any time within three fiscal years after the fiscal year in which such amounts were absorbed, subject to the expense cap in place at the time recoupment is sought, which cannot exceed the expense cap at the time of waiver. The expense limitation agreement may be terminated by the Board of the Fund at any time without penalty upon 60 days’ notice.
Example This example is intended to help you compare the cost of investing in the Global Innovators Fund with the cost of investing in other mutual funds. The Example assumes that you invest $10,000 in the Fund for the time periods indicated. The Example also assumes that your investment has a 5% return each year and that the Fund’s operating expenses remain the same. Although your actual costs may be higher or lower, under these assumptions, your costs would be:
Investor Class Institutional Class Portfolio Turnover The Fund pays transaction costs, such as commissions, when it buys and sells securities (or “turns over” its portfolio). A higher portfolio turnover may indicate higher transaction costs and may result in higher taxes when Fund shares are held in a taxable account. These costs, which are not reflected in annual fund operating expenses or in the example, affect the Fund’s performance. During the most recent fiscal year, the Fund’s portfolio turnover rate was 19.86% of the average value of its portfolio. Principal Investment Strategies The Global Innovators Fund invests in equity securities of companies that the Advisor believes are positioned for growth due to advances in technology, communications, globalism or innovative management. The Fund invests in companies that the Adviser believes can create value through original thinking. The Fund will consider all companies in the world’s developed stock markets, such as the United States, the United Kingdom, Canada, Japan, Hong Kong,
1 Year 3 Years 5 Years 10 Years $126 $399 $709 $1,589 $101 $326 $600 $1,385

SUMMARY SECTION
28
Singapore, Australia, New Zealand and other stock markets in the European Union. The Fund also may consider investments in emerging stock markets, such as in China, Korea, Taiwan, Malaysia, Thailand, South Africa and Mexico. The Fund considers “emerging stock markets” to be stock markets in countries considered to be emerging market countries by any of the World Bank, the International Monetary Fund or any widely-recognized index of emerging market securities (e.g., Dow Jones, FTSE, S&P, MSCI). The Advisor will invest the Fund’s assets in a company’s securities without regard to the issuer’s market capitalization. The Fund expects that normally, at least 40% of the Fund’s assets will be invested in global securities. For this purpose, “global securities” means securities issued by companies with significant business activities outside the U.S. Additional information on Principal Investment Strategies can be found in the prospectus. Also see Additional Investment Strategies and Risks in the Statement of Additional Information. The Fund is designed for investors who seek long-term capital appreciation through focused investment in companies, wherever located, that the Advisor believes are positioned to benefit from innovations in technology, communication, globalism or management strategies. Principal Risks Your investment in the Fund is subject to the risks common to all mutual funds that invest in equity securities, and there can be no assurance that the Fund will achieve its investment objective. Risks associated with investments in the Fund can increase during times of market volatility. Investing in this Fund may be more risky than investing in a fund that only invests in U.S. securities due to increased volatility of foreign markets. You may lose money by investing in this Fund. The principal risks are: Market Risk. The stock markets in which the Fund invests may experience periods of volatility and instability. These fluctuations may cause a security to be worth less than it was at the time of purchase. Market risk applies to individual securities, a particular sector or the entire economy. Equity Securities Risk. The market value of an equity security may fluctuate, sometimes rapidly and unpredictably. A variety of factors can negatively impact the value of common stocks, including a company’s financial condition, as well as economic factors such as interest rates and inflation rates and non-economic factors such as political events. Foreign Securities Risk. Foreign securities experience more volatility than their domestic counterparts, in part because of higher political and economic risks, lack of reliable information, differences in accounting audit or reporting standards, fluctuations in currency exchange rates and the risks that a foreign government may take over assets, restrict the ability to exchange currency or restrict the delivery of securities. Emerging Markets Risk. All of the risks of investing in foreign securities are heightened by investing in emerging markets. Emerging markets have been more volatile than the markets of developed countries with more mature economies. Industry Risks. The technology, internet and communications industries or sectors are extremely competitive and subject to rapid rates of change. The competitive nature of these industries or sectors and rapid rate of change places a challenge on the management of these companies to be successful. The Fund may have more investments in these areas than other equity funds that do not focus on companies implementing innovation.
Market Capitalization Risk. The Fund invests without regard to capitalization, and will invest in small-capitalization or mid-capitalization companies, which are generally more risky than investments in larger

SUMMARY SECTION
29
companies; the securities of small- and mid-cap companies may be subject to greater volatility and may have lower liquidity. Management Risk. There is a risk that the investment strategy does not achieve the Fund’s objective, or that the portfolio manager’s judgment as to the growth, income or dividend potential or value of a security proves to be wrong, or that the Advisor does not implement the strategy properly. Diversification Risk. The Fund is non-diversified. It may hold larger positions in a relatively small number of stocks. This may make the Fund’s performance more volatile than would be the case if it had a diversified investment portfolio.
For more information on the risks of investing in this Fund please see the Principal Risks and Risks of Investing in Our Funds in the prospectus. You may also refer to the section Risk Factors and Special Considerations in the Statement of Additional Information. Performance The annual returns bar chart demonstrates the risks of investing in the Global Innovators Fund by showing how the performance of the Fund’s Investor Class shares has varied from year to year. The table also demonstrates these risks by showing how the Fund’s average annual returns compare with those of two broad-based securities market indices. Unlike the Fund’s returns, the index returns do not reflect any deductions for fees, expenses or taxes. For additional information on these indices, please see Index Descriptions in the prospectus. Past performance, before or after taxes, is not indicative of future performance. Updated performance information is available on the Fund’s website: www.gafunds.com.
During the period shown in the bar chart, the best performance for a quarter was 21.12% (for the quarter ended June 30, 2009). The worst performance was -22.86% (for the quarter ended December 31, 2008).
Average Annual Total Returns as of 12/31/17 One Year Five Years Ten Years Global Innovators Fund:
Investor Class Return Before Taxes 34.75% 18.53% 9.29% Investor Class Return After Taxes on Distributions(1) 33.93% 17.96% 8.95% Investor Class Return After Taxes on Distributions and Sale of Fund Shares(1)
20.15% 14.97% 7.55%
Institutional Class Return Before Taxes* 35.07% 18.65% 9.35% MSCI World Index 23.10% 12.30% 5.68% Nasdaq Composite Index 29.71% 19.18% 11.35%
* The Fund’s Institutional Class shares were issued on December 31, 2015. Performance information shown for the Institutional Class prior to December 31, 2015, is based on the performance of the Investor Class.
-45.42%
45.20%
17.00%
-6.51%
19.91%
45.29%
12.55%
-3.04%
9.51%
34.75%
'08 '09 '10 '11 '12 '13 '14 '15 '16 '17

SUMMARY SECTION
30
(1) After-tax returns are calculated using the historical highest individual federal marginal income tax rates and do not reflect the impact of state and local taxes. Actual after-tax returns depend on an investor’s tax situation and may differ from those shown, and after-tax returns shown are not relevant to investors who hold their Fund shares through tax-deferred arrangements, such as 401(k) plans or individual retirement accounts. In certain cases, the figure representing “Return After Taxes on Distributions and Sale of Fund Shares” may be higher than the other return figures for the same period. A higher after-tax return results when a capital loss occurs upon redemption and provides an assumed tax deduction that benefits the investor.
Investment Advisor Guinness AtkinsonTM Asset Management, Inc. For more information on the Investment Advisor, please see Management of the Funds in the prospectus and The Investment Advisor in the Statement of Additional Information. Portfolio Managers Matthew Page, CFA, Portfolio Manager, has been a portfolio manager of the Fund since May 2010. Dr. Ian Mortimer, CFA, Portfolio Manager, has been a portfolio manager of the Fund since May 2011. Messrs. Page and Mortimer are jointly and primarily responsible for the day-to-day management of the Fund’s portfolio. For additional information, please see Portfolio Management in the prospectus and Portfolio Managers in the Statement of Additional Information. Purchase and Sale of Fund Shares The Fund operates in a multiple class structure. A multiple class fund is an open-end investment company that issues two or more classes of shares representing interests in the same investment portfolio, and having common rights and privileges. Each class in a multiple class fund has its own transaction minimums and may vary with respect to expenses for distribution, administration and shareholder services. Performance among share classes may also differ. Financial intermediaries who receive compensation for selling Fund shares may receive a different amount of compensation for selling different classes of shares. The minimum initial investment is waived for broker-dealers who have entered into an agreement with the Funds’ distributor and hold shares in an omnibus account. Investors may purchase or redeem Fund shares on any business day by written request, wire transfer, or telephone. You may conduct transactions by mail (Guinness AtkinsonTM Funds, c/o U.S. Bancorp Fund Services, LLC, 615 East Michigan Street, 3rd Floor, Milwaukee, WI 53201-0701), or by telephone at 1-800-915-6566. (Redemptions by telephone are only permitted upon previously receiving appropriate authorization.) Investors who wish to purchase, exchange or redeem Fund shares through a broker-dealer should contact the broker-dealer directly. The minimum initial and subsequent investment amounts for various types of accounts are shown below, although we may reduce or waive the minimums in some cases. The minimum initial investment is waived for broker-dealers who have entered into an agreement with the Funds’ distributor and hold shares in an omnibus account. The Fund offers two classes of shares – Institutional Class shares and Investor Class shares. Shares of both classes are available for purchase at NAV without an initial sales charge. Investor Class shares charge a shareholder servicing fee of 0.25% per annum of average daily net assets. Institutional Class shares do not charge a shareholder servicing fee.
Type of Account Minimum Initial Investments
Subsequent Investments
Institutional Class Regular (new shareholder to the Guinness AtkinsonTM Fund family) $100,000 $5,000 Regular (current shareholder of another Guinness AtkinsonTM Fund) $100,000 $5,000 Retirement $100,000 $5,000 Gift (UGMA/UTMA) $100,000 $5,000 Investor Class Regular (new shareholder to the Guinness AtkinsonTM Fund family) $5,000 $250 Regular (current shareholder of another Guinness AtkinsonTM Fund) $2,500 $250 Retirement $1,000 $250 Gift (UGMA/UTMA) $250 $250 Automatic investment plan (initial and installment payments) $100 $100

SUMMARY SECTION
31
Shareholders of the Global Innovators Fund at the time of the inception of the Institutional Class shares are permitted to purchase Investor Class shares without regard to account or investment minimums. For additional information, please see How to Purchase, Exchange and Redeem Shares in the prospectus and Additional Purchase and Redemption Information in the Statement of Additional Information. Tax Information The Fund’s distributions are taxable, and will be taxed as ordinary income or capital gains, unless you are investing through a tax-deferred arrangement, such as a 401(k) plan or an individual retirement account. Withdrawals of monies from such tax-deferred arrangements may be taxable. For additional information please see Distributions and Taxes in the prospectus and Tax Matters in the Statement of Additional Information. Payments to Broker-Dealers and Other Financial Intermediaries If you purchase the Fund through a broker-dealer or other financial intermediary (such as a bank), the Fund and its related companies may pay the intermediary for the sale of Fund shares and related services. These payments may create a conflict of interest by influencing the broker-dealer or other intermediary and your salesperson to recommend the Fund over another investment. Ask your salesperson or visit your financial intermediary’s Web site for more information. Also see Distribution and Shareholder Servicing Plans in the prospectus and Distribution Agreement, Distribution Plan and Shareholder Servicing Plan and Additional Marketing and Support Payments in the Statement of Additional Information.

SUMMARY SECTION
32
Renminbi Yuan & Bond Fund Investment Objective The Renminbi Yuan & Bond Fund seeks total return. Total return means the combination of capital appreciation and investment income, which includes changes in the value of the Renminbi, the currency of China of which the Yuan is the unit. Fees and Expenses of the Fund This table describes the fees and expenses that you may pay if you buy and hold shares of the Renminbi Yuan & Bond Fund: Shareholder Fees (fees paid directly from your investment(1) Redemption/Exchange Fee for shares held less than 30 days from purchase (as a percentage of amount redeemed) (plus a $15 wire fee, if applicable): 2.00%
Annual Fund Operating Expenses (expenses that you pay each year as a percentage of the value of your investments)
Management Fees: 0.55% Distribution (12b-1) Fees: None Other Expenses: 3.62%
Shareholder Servicing Plan Fees 0.08% All Other Expenses 3.54%
Total Annual Fund Operating Expenses: 4.17% Fee Waiver/Expense Reimbursement(2): -3.27% Total Annual Fund Operating Expenses After Waiver and/or Expense Reimbursement (2): 0.90%
(1) The Fund charges a $15 fee for each payment of redemption proceeds by wire transfer. (2) The Advisor has contractually agreed to reimburse expenses (excluding Acquired Fund Fees and Expenses, interest, taxes, dividends on
short positions and extraordinary expenses) in order to limit the Fund’s Total Annual Operating Expenses to 0.90% through June 30, 2019. To the extent that the Advisor absorbs expenses to satisfy this cap, it may recoup a portion or all of such amounts absorbed at any time within three fiscal years after the fiscal year in which such amounts were absorbed, subject to the expense cap in place at the time recoupment is sought, which cannot exceed the expense cap at the time of the waiver. The expense limitation agreement may be terminated by the Board of the Fund at any time without penalty upon 60 days’ notice.
Example This example is intended to help you compare the cost of investing in the Renminbi Yuan & Bond Fund with the cost of investing in other mutual funds. The Example assumes that you invest $10,000 in the Fund for the time periods indicated. The Example also assumes that your investment has a 5% return each year and that the Fund’s operating expenses remain the same. Although your actual costs may be higher or lower, under these assumptions, your costs would be:
1 Year 3 Years 5 Years 10 Years $92 $967 $1,857 $4,148
Portfolio Turnover The Fund pays transaction costs, such as commissions, when it buys and sells securities (or “turns over” its portfolio). A higher portfolio turnover rate may indicate higher transaction costs and may result in higher taxes when Fund shares are held in a taxable account. These costs, which are not reflected in annual fund operating expenses or in the example, affect the Fund’s performance. During the most recent fiscal year, the Fund’s portfolio turnover rate was 66.21% of the average value of its portfolio. Principal Investment Strategies The Renminbi Yuan & Bond Fund normally will invest at least 80% of its net assets (plus any borrowings for investment purposes) in a combination of Renminbi Yuan-denominated bonds that are issued by corporations and by the Chinese government (including its agencies or instrumentalities) and traded (i) over the counter in London, Hong

SUMMARY SECTION
33
Kong or on Euroclear or (ii) in other developing markets, including the China Interbank Bond Market (“CIBM”), and in cash and cash equivalents, bank deposits, certificates of deposit and short-term commercial paper denominated in Renminbi or Yuan. Renminbi (or “RMB”) is the officially currency of China, with the principal unit being the Yuan. The Fund may, when desirable, invest up to 20% of its net assets in convertible securities of companies connected to the China region. The Fund also may invest in commercial paper, convertible securities and equity-linked notes, denominated in RMB or Yuan or other currencies. The Fund expects that it may hold a significant portion of its assets in cash and cash equivalents denominated in Renminbi or Yuan. The market for Renminbi Yuan denominated securities is centered in Hong Kong, while foreign exchange can be traded in Hong Kong, London and New York. The Advisor expects that the Fund’s investments will be in sovereign, supranational and corporate issuers which may or may not be connected to the China region but which will be denominated in Renminbi Yuan. These instruments are often traded over the counter in Hong Kong and Europe, and may also be included on the CIBM. The bond market is heavily weighted toward China sovereign and corporate financial issuers (both Chinese and non-Chinese). The Adviser therefore expects the portfolio to have sector concentration in both sovereign and financial issues. The Fund’s concentration may vary depending on changing market conditions (including but not limited to, liquidity, volatility, and the number of issuers and terms of bond issues). The degree of concentration of the portfolio will vary over time, and under normal market conditions, the Fund may have fewer holdings than a fund that is not concentrated. The Fund may hold securities of all market capitalization companies, including companies in emerging markets. The Fund may invest in securities having short, medium or long-term maturities. The Fund may invest in securities that are considered “investment grade” or “high yield.” Additional information on Principal Investment Strategies can be found in the prospectus. Also see Additional Investment Strategies and Risks in the Statement of Additional Information. The Fund is designed for investors who seek a moderate level of current income and investments in dividend paying companies that have the ability to increase their dividends consistently over time. Principal Risks Your investment in the Fund is subject to the risks common to all mutual funds that invest in fixed income securities and there can be no assurance that the Fund will achieve its investment objective. Risks associated with investments in the Fund can increase during times of market volatility. The principal risks are: Market Risk. The markets in which the Fund invests may experience periods of volatility and instability. These fluctuations may cause a security to be worth less than it was at the time of purchase. Market risk applies to individual securities, a particular sector or the entire economy. Specific or all securities of a particular market may fall out of favor with investors, the value of foreign currencies may decline relative to the U.S. dollar and/or stock markets may decline generally. Interest Rate Risk. Interest rate fluctuations or adverse news about an issuer may cause the Fund’s investments to decline in value. An increase in interest rates could cause the Fund’s investments to decline in value, and a change in interest rates could have a greater effect on the Fund’s longer term investments. China Risk. Political, social, currency-rate fluctuations or economic instability within China, or a decline or volatility of investor interest in China could cause the Fund’s investments to decline in value. The Fund could become adversely affected by restrictions or changes in restrictions on foreign ownership or currency exchange controls. Currency Risk. The Fund invests in securities denominated in the Renminbi (“RMB”) and Yuan (traded as “CNH” in Hong Kong and “CNY” in mainland China. The Fund’s investments could decline in value if these currencies diverge from each other, or if Chinese currencies decline in value relative to the U.S. dollar. Concentration Risk. The Fund’s investments are concentrated in sovereign debt of China, and weighted in issuers in the banking and finance industries. The Fund’s investments could decline if these investment sectors decline in value.

SUMMARY SECTION
34
The Fund could face difficulty in selling its Renminbi Yuan bond holdings due to low liquidity or high volatility, and this risk would be enhanced due to its concentration in China investments. Credit Risk. The risk that issuers of the Fund’s securities do not make interest or principal payments when due, or “pre-pay” or “extend” their obligations, or that the Fund invests in an unsecured debt instrument and the issuer defaults, any of which could cause the Fund’s investments to decline in value. Foreign Securities Risk. Foreign securities experience more volatility than their domestic counterparts, in part because of higher political and economic risks, lack of reliable information, differences in accounting, audit or reporting standards, fluctuations in currency exchange rates and the risks that a foreign government, such as the government of China, may take over assets, restrict the ability to exchange currency or restrict the delivery of securities or currency in payment of interest or principal, and liquidity risks, and these may be heightened. China Emerging Markets Risk. All of the risks of investing in foreign securities are heightened by investing in emerging markets. Emerging markets have been more volatile than the markets of developed countries with more mature economies. China remains designated as an emerging markets economy although it is the second largest economy in the world. The Fund’s investments in issuers connected to China involve risks and considerations not typically associated with investments in more developed economies or markets. Offshore Renminbi Yuan-denominated bond issues are growing in number and issue with new supply but are still smaller compared to dollar-denominated issues and more developed markets which can result in less liquidity and greater price volatility. The number of new issues may vary and supply of new issues may be constrained. Market Capitalization Risk. The Fund invests without regard to capitalization, and will invest in small-capitalization or mid-capitalization companies, which are generally more risky than investments in larger companies; the securities of small- and mid-cap companies may be subject to greater volatility and may have lower liquidity. Management Risk. There is a risk that the investment strategy does not achieve the Fund’s objective, or that the portfolio manager’s judgment as to the growth, income or dividend potential or value of a security proves to be wrong, or that the Advisor does not implement the strategy properly. Debt Securities Risk. Numerous factors can negatively impact the value of debt securities, including economic factors, such as the ability of issuers to pay principal and interest as the debt becomes due, interest rate fluctuations and inflation rates, as well as non-economic factors such as foreign government regulation and political events. The Fund may invest in securities of any maturity and quality and may invest without limit in securities that are rated below “investment grade” or the unrated equivalent. Many of the Renminbi Yuan bonds in which the Fund invests will not have a credit rating issued by a nationally recognized statistical ratings organization (“NRSRO”), and the Advisor will conduct its own determination of creditworthiness of the issuer. China Currency Risk. China’s currency, the Renminbi (RMB), may be traded offshore (primarily in Hong Kong, at present) or in mainland China. At present, the Fund can buy Renminbi only at the offshore exchange rate. The offshore and the onshore Renminbi exchange rates may diverge in value, which could decrease the value of the Fund’s investments if the currency is more desirable in one market than in another. Fund will have to acquire RMB to make investments, and convert RMB to US dollars to pay redemptions. There is no guarantee that the Fund will be able to obtain access to the relatively more desirable currency, for investment purposes, and the Fund’s ability to convert RMB to U.S. dollars may be limited. Diversification Risk. The Renminbi Yuan & Bond Fund is non-diversified. It may hold larger positions in a relatively small number of fixed income securities and may be exposed to fewer issuers. This may make the Fund’s performance more volatile than would be the case if it had a diversified investment portfolio. The Fund’s focus on a smaller number of issues or issuers including foreign companies and sovereign debt of exposes the Fund to great market risk and potential monetary losses than if the Fund’s assets were invested only in U.S. stocks. Small Companies. The Fund’s investments in securities issued by small companies may be more volatile in price than those of larger companies and involve substantial risks. Small issuers may be more sensitive to economic conditions,

SUMMARY SECTION
35
have more variable growth prospects, lack management experience and may have less capital for growth and development and limited product lines and markets; and may be more sensitive to interest rate increases, because it may be more difficult for these issuers to borrow money to invest in their businesses, and it may be more difficult for these issuers to repay loans. Redemption Risk. It is possible that the Fund could lose money if it had to sell securities to meet redemption requests, if redemptions are large, occur during volatile market periods, or when the Fund’s investments have declined in value, or if the securities to be sold become undesirable or illiquid. Equity Securities Risk. The Fund may hold equity securities. The market value of an equity security may fluctuate, sometimes rapidly and unpredictably. A variety of factors can negatively impact the value of common stocks, including a company’s financial condition, as well as economic factors such as interest rates and inflation rates and non-economic factors such as political events. Risk of Large Shareholder Redemptions. Certain entities, accounts, individuals may from time to time own (beneficially or of record) or control a significant percentage of the Fund’s shares. Redemptions by these entities, accounts or individuals of their holdings in the Fund may impact the Fund’s liquidity and NAV. These redemptions may also force the Fund to sell securities, which may negatively impact the Fund’s brokerage and tax costs. For more information on the risks of investing in this Fund, please see the Principal Risks and Risks of Investing in Our Funds in the prospectus. You may also refer to the section Risk Factors and Special Considerations in the Statement of Additional Information. Performance The annual returns bar chart demonstrates the risks of investing in the Renminbi Yuan & Bond Fund by showing how the Fund’s performance has varied from year to year. The table also demonstrates these risks by showing how the Fund’s average annual returns compare with those of a broad-based securities market index, as well as two indices of currency performance Unlike the Fund’s returns, the index returns do not reflect any deductions for fees, expenses or taxes. For additional information on these indices, please see Index Descriptions in the prospectus. Past performance, before or after taxes, is not indicative of future performance. Updated performance information is available on the Fund’s website www.gafunds.com.
During the period shown in the bar chart, the best performance for a quarter was 2.66% (for the quarter ended December 31, 2013). The worst performance was -5.00% (for the quarter ended December 31, 2016).
3.88%5.26%
-0.92%
-4.05% -3.52%
9.79%
'12 '13 '14 '15 '16 '17

SUMMARY SECTION
36
Average Annual Total Returns as of 12/31/17 One Year Five Years Since Inception (June 30, 2011)
Renminbi Yuan & Bond Fund: Return Before Taxes 9.79% 1.17% 1.52% Return After Taxes on Distributions(1) 9.40% 0.32% 0.73% Return After Taxes on Distributions and Sale of Fund Shares(1) 5.53% 0.51% 0.82%
RMB Cash Offshore (CNH)* 7.09% -0.91% -0.12% RMB Cash Onshore (CNY)* 6.73% -0.86% -0.10% iBoxx Hang Seng Markit Offshore RMB Overall Index 11.19% 2.84% 2.72%
(1) After-tax returns are calculated using the historical highest individual federal marginal income tax rates and do not reflect the impact
of state and local taxes. Actual after-tax returns depend on an investor’s tax situation and may differ from those shown, and after-tax returns shown are not relevant to investors who hold their Fund shares through tax-deferred arrangements, such as 401(k) plans or individual retirement accounts. In certain cases, the figure representing “Return After Taxes on Distributions and Sale of Fund Shares” may be higher than the other return figures for the same period. A higher after-tax return results when a capital loss occurs upon redemption and provides an assumed tax deduction that benefits the investor.
* Net change in exchange rate versus the U.S. Dollar Investment Advisor Guinness AtkinsonTM Asset Management, Inc. For more information on the Investment Advisor, please see Management of the Fund in the prospectus and The Investment Advisor in the Statement of Additional Information. Portfolio Manager Edmund Harriss, Portfolio Manager, has been the Fund’s portfolio manager since June 2011, and is primarily responsible for the day-to-day management of the Fund’s portfolio. For additional information, please see Portfolio Management in the prospectus and Portfolio Managers in the Statement of Additional Information. Purchase and Sale of Fund Shares Investors may purchase or redeem Fund shares on any business day by written request, wire transfer, or telephone. You may conduct transactions by mail (Guinness AtkinsonTM Funds, c/o U.S. Bancorp Fund Services, LLC, 615 East Michigan Street, 3rd Floor, Milwaukee, WI 53201-0701), or by telephone at 1-800-915-6566. (Redemptions by telephone are only permitted upon previously receiving appropriate authorization.) Investors who wish to purchase, exchange or redeem Fund shares through a broker-dealer should contact the broker-dealer directly. The minimum initial and subsequent investment amounts for various types of accounts are shown below, although we may reduce or waive the minimums in some cases. The minimum initial investment is waived for broker-dealers who have entered into an agreement with the Funds’ distributor and hold shares in an omnibus account. Type of Account Minimum Initial
Investments Subsequent Investments
Regular (new shareholder to the Guinness AtkinsonTM Fund family) $10,000 $1,000 Regular (current shareholder of another Guinness AtkinsonTM Fund) $5,000 $1,000 Retirement $5,000 $1,000 Gift (UGMA/UTMA) $5,000 $1,000
Account minimums at broker-dealer firms may be lower for omnibus account investments. For additional information, please see How to Purchase, Exchange and Redeem Shares in the prospectus and Additional Purchase and Redemption Information in the Statement of Additional Information. Tax Information The Fund’s distributions are taxable, and will be taxed as ordinary income or capital gains, unless you are investing through a tax-deferred arrangement, such as a 401(k) plan or an individual retirement account. Withdrawals of monies from such tax deferred arrangements may be taxable. For additional information, please see Distributions and Taxes in the prospectus and Tax Matters in the Statement of Additional Information.

SUMMARY SECTION
37
Payments to Broker-Dealers and Other Financial Intermediaries If you purchase the Fund through a broker-dealer or other financial intermediary (such as a bank), the Fund and its related companies may pay the intermediary for the sale of Fund shares and related services. These payments may create a conflict of interest by influencing the broker-dealer or other intermediary and your salesperson to recommend the Fund over another investment. Ask your salesperson or visit your financial intermediary’s Web site for more information. Also see Distribution and Shareholder Servicing Plans in the prospectus and Distribution Agreement, Distribution Plan and Shareholder Servicing Plan and Additional Marketing and Support Payments in the Statement of Additional Information.

MORE ABOUT THE FUNDS’ INVESTMENT STRATEGIES AND RISKS
38
MORE ABOUT THE FUNDS’ INVESTMENT STRATEGIES AND RISKS
Alternative Energy Fund
Return to Alternative Energy Fund Summary Section Investment Objective The Alternative Energy Fund’s investment objective is long-term capital appreciation. Principal Investment Strategies The Alternative Energy Fund invests at least 80% of its net assets (plus any borrowings for investment purposes) in equity securities of alternative energy companies (both U.S. and non-U.S.). Alternative energy companies include, but are not limited to companies that generate power through solar, wind, hydroelectric, tidal wave, geothermal, biomass or biofuels and the various companies that provide the equipment and technologies that enable these sources to be tapped, used, stored or transported, including companies that create, facilitate or improve technologies that conserve or enable more efficient use of energy. The Fund will not change this policy unless it gives shareholders at least 60 days’ notice. Equity securities may include common stocks, preferred stocks, securities convertible into common stocks, rights and warrants. The Fund’s concentration may vary depending on changing market conditions (including but not limited to, liquidity, volatility, and the number of companies meeting selection criteria) although the Advisor has a bias towards concentration. The degree of concentration of the portfolio will vary over time, and under normal market conditions, the Fund may have as few as 25 holdings, or may hold securities in 75 or more companies. The number of holdings in the Fund as of December 31, 2017 was 31. The Advisor will invest the Fund’s assets in securities of all market capitalization companies and in companies domiciled in the U.S. and foreign countries, including, potentially, companies domiciled or traded in emerging markets. Except as noted above, the Fund’s Board of Trustees (the “Board”) may change the Alternative Energy Fund’s investment policies and strategies without prior notice to shareholders. When current market, economic, political or other conditions are unstable and would impair the pursuit of the Alternative Energy Fund’s investment objective, the Fund may temporarily invest up to 100% of its assets in cash, cash investments or high quality short-term money market instruments. When the Fund takes a temporary defensive position, the Fund may not achieve its investment objective. The Fund will not engage in market timing. The philosophy of the Fund is to remain fully invested. Principal Risks
Return to Alternative Energy Fund Summary Section As discussed in the Summary Section and described further below, the Alternative Energy Fund is subject to the risks common to all mutual funds that invest in equity securities and foreign securities. Investing in this Fund may be more risky than investing in a fund that only invests in U.S. securities due to increased volatility of foreign markets. You may lose money by investing in this Fund. In addition, investing in common stocks entails a number of risks. The stock markets in which the Alternative Energy Fund invests may experience periods of volatility and instability. A variety of factors can negatively impact the value of common stocks. These factors include a number of economic factors such as interest rates and inflation rates as well as non-economic factors such as political events. Foreign securities experience more volatility than their domestic counterparts, in part because of higher political and economic risks, lack of reliable information, fluctuations in currency exchange rates and the risks that a foreign government may take over assets, restrict the ability to exchange currency or restrict the delivery of securities. All of the risks of investing in foreign securities are heightened by investing in emerging markets. Emerging markets have been more volatile than the markets of developed countries with more mature economies.

MORE ABOUT THE FUNDS’ INVESTMENT STRATEGIES AND RISKS
39
The Alternative Energy Fund is non-diversified. It may hold larger positions in a relatively small number of stocks. This may make the Fund’s performance more volatile than would be the case if it had a diversified investment portfolio. The Alternative Energy Fund will concentrate its investments (that is, invest more than 25% of its total assets) in the following group of industries: solar energy, wind energy, biofuels, hydrogen, geothermal energy, energy efficiency, and hydroelectricity. A downturn in this group of industries would have a larger impact on the Fund than on a fund that does not concentrate in these sectors. The Advisor determines an issuer’s industry classification based on Standard Industry Codes established by the Securities and Exchange Commission and the Advisor’s evaluation of the issuer’s operations. The Fund is subject to the risk that the earnings, dividends, and securities prices of energy companies will be greatly affected by changes in the prices and supplies of oil and other energy fuels. Prices and supplies of energy may fluctuate significantly over any time period due to many factors, including international political developments; production and distribution policies of the Organization of Petroleum Exporting Countries (OPEC) and other oil-producing countries; relationships among OPEC members and other oil-producing countries and between these countries and oil-importing nations; energy conservation; foreign, federal and state regulatory environments; tax policies; and the economic growth and political stability of the key energy-consuming and energy-producing countries. See “Risks of Investing in Our Funds” for a general discussion of the risks associated with investing in the Alternative Energy Fund.

MORE ABOUT THE FUNDS’ INVESTMENT STRATEGIES AND RISKS
40
Asia Focus Fund Return to Asia Focus Fund Summary Section
Investment Objective The Asia Focus Fund’s investment objective is long-term capital appreciation. Principal Investment Strategies The Asia Focus Fund invests at least 80% of its net assets (plus any borrowings for investment purposes) in equity securities of Asian companies (excluding Japan). These equity securities include common stocks, preferred stocks, securities convertible into common stocks, rights and warrants. The Fund considers an issuer of securities to be an Asian company if: (1) it is organized under the laws of a country in Asia or has a principal office in a country in Asia; (2) it derives a significant portion (i.e., 50% or more) of its total revenues from business in the Asia region; or (3) its equity securities are traded principally on a stock exchange in Asia or in an over-the-counter market in Asia. By applying this test, it is possible that a particular issuer could be deemed to be from more than one region or country. The Fund will not change this policy unless it gives shareholders at least 60 days’ notice. Under normal market conditions the Asia Focus Fund will invest in at least four different countries. These countries include but are not limited to:
• Bangladesh • Malaysia • Sri Lanka • China • Pakistan • Taiwan • Hong Kong • Philippines • Thailand • India • Singapore • Vietnam • Indonesia • South Korea
The Fund’s concentration may vary depending on changing market conditions (including but not limited to, liquidity, volatility, and the number of companies meeting selection criteria) although the Advisor has a bias towards concentration. The degree of concentration of the portfolio will vary over time, and under normal market conditions, the Fund may have as few as 25 holdings, or may hold securities in 75 or more companies. The number of holdings in the Fund as of December 31, 2017 was 35. The Advisor will invest the Fund’s assets in securities of all market capitalization companies, including companies in emerging markets. Except as noted above, the Board may change the Asia Focus Fund’s investment policies and strategies without prior notice to shareholders. When current market, economic, political or other conditions are unstable and would impair the pursuit of the Fund’s investment objective, the Fund may temporarily invest up to 100% of its assets in cash, cash equivalents or high quality short-term money market instruments. When the Fund takes a temporary defensive position, it may not achieve its investment objective. The Fund will not engage in market timing. The philosophy of the Fund is to remain invested. Principal Risks
Return to Asia Focus Fund Summary Section
As discussed in the Summary Section and described further below, the Asia Focus Fund is subject to the risks common to all mutual funds that invest in equity securities and foreign securities. Investing in this Fund may be more risky than investing in a Fund that invests in U.S. securities due to increased volatility of foreign markets. You may lose money by investing in this Fund. In addition, investing in common stocks entails a number of risks. The stock markets in which the Asia Focus Fund invests may experience periods of volatility and instability. A variety of factors can negatively impact the value of common stocks. These factors include a number of economic factors such as interest rates and inflation rates as well as non-economic factors such as political events.

MORE ABOUT THE FUNDS’ INVESTMENT STRATEGIES AND RISKS
41
Foreign securities experience more volatility than their domestic counterparts, in part because of higher political and economic risks, lack of reliable information, fluctuations in currency exchange rates and the risks that a foreign government may take over assets, restrict the ability to exchange currency or restrict the delivery of securities. All of the risks of investing in foreign securities are heightened by investing in emerging markets. Emerging markets have been more volatile than the markets of developed countries with more mature economies. The Asia Focus Fund is non-diversified. It may hold larger positions in a relatively small number of stocks. This may make the Fund’s performance more volatile than would be the case if it had a diversified investment portfolio. See “Risks of Investing in Our Funds” for a general discussion of the risks associated with investing in the Asia Focus Fund.

MORE ABOUT THE FUNDS’ INVESTMENT STRATEGIES AND RISKS
42
Asia Pacific Dividend Builder Fund
Return to Asia Pacific Dividend Builder Fund Summary Section Investment Objective The Asia Pacific Dividend Builder Fund’s investment objective is to provide investors with dividend income and long-term capital growth. Principal Investment Strategies The Asia Pacific Dividend Builder Fund invests at least 80% of its net assets (plus any borrowings for investment purposes) in dividend-producing equity securities of Asia Pacific companies. These equity securities include common stocks, preferred stocks, securities convertible into common stocks, rights and warrants. The Fund considers an issuer of securities to be an Asia Pacific company if: (1) it is organized under the laws of a country in the Asia Pacific region or has its headquarters in a country in the Asia Pacific region; (2) it derives a significant portion (i.e., 50% or more) of its total revenues from business in the Asia Pacific region but is listed elsewhere; or (3) its equity securities are traded principally on a stock exchange in the Asia Pacific region or in an over-the-counter market in the region. By applying this test, it is possible that a particular issuer could be deemed to be from more than one region or country. The Fund will not change this policy unless it gives shareholders at least 60 days’ notice. The Advisor seeks to invest in companies that have returned a real cash flow return on investment of at least 8% for each of the last 8 years, and, in the opinion of the Advisor, are likely to grow their dividend over time. The Asia Pacific Dividend Builder Fund seeks to allow investors the opportunity to profit from the transition of Asia Pacific economies as they move from developing to developed economies. In the Advisor’s view, investing in dividend-paying stocks permits investors to gain access to the more established companies in the region. This strategy is designed to both reduce risk and provide some income. Under normal market conditions the Asia Pacific Dividend Builder Fund will invest in at least four different countries. These countries include but are not limited to:
• Australia • Indonesia • South Korea • Bangladesh • Malaysia • Sri Lanka • China • New Zealand • Taiwan • Hong Kong • Pakistan • Thailand • India • Philippines • Vietnam • Japan • Singapore
The Fund’s concentration may vary depending on changing market conditions (including but not limited to, liquidity, volatility, and the number of companies meeting selection criteria) although the Advisor has a bias towards concentration. The degree of concentration of the portfolio will vary over time, and under normal market conditions, the Fund may have as few as 25 holdings, or may hold securities in 75 or more companies. The number of holdings in the Fund as of December 31, 2017 was 36. The Advisor will invest the Fund’s assets in securities of all market capitalization companies that are dividend-producing and in companies domiciled in the Asia Pacific region, including, potentially, companies domiciled or traded in emerging markets. The Advisor may also consider investing in securities that are deemed likely to become income-producing. Except as noted above, the Board may change the Asia Pacific Dividend Builder Fund’s investment policies and strategies without prior notice to shareholders. When current market, economic, political or other conditions are unstable and would impair the pursuit of the Fund’s investment objective, the Fund may temporarily invest up to 100% of its assets in cash, cash equivalents

MORE ABOUT THE FUNDS’ INVESTMENT STRATEGIES AND RISKS
43
or high quality short-term money market instruments. When the Fund takes a temporary defensive position, it may not achieve its investment objective. The Fund will not engage in market timing. The philosophy of the Fund is to remain invested. Principal Risks
Return to Asia Pacific Dividend Builder Fund Summary Section As discussed in the Summary Section and described further below, the Asia Pacific Dividend Builder Fund is subject to the risks common to all mutual funds that invest in equity securities and foreign securities. Investing in this Fund may be more risky than investing in a fund that invests in U.S. securities due to increased volatility of foreign markets. You may lose money by investing in this Fund. In addition, investing in common stocks entails a number of risks. The stock markets in which the Asia Pacific Dividend Builder Fund invests may experience periods of volatility and instability. A variety of factors can negatively impact the value of common stocks. These factors include a number of economic factors such as interest rates and inflation rates as well as non-economic factors such as political events. Foreign securities experience more volatility than their domestic counterparts, in part because of higher political and economic risks, lack of reliable information, fluctuations in currency exchange rates and the risks that a foreign government may take over assets, restrict the ability to exchange currency or restrict the delivery of securities. All of the risks of investing in foreign securities are heightened by investing in emerging markets. Emerging markets have been more volatile than the markets of developed countries with more mature economies. The Asia Pacific Dividend Builder Fund is non-diversified. It may hold larger positions in a relatively small number of stocks. This may make the Fund’s performance more volatile than would be the case if it had a diversified investment portfolio. See “Risks of Investing in Our Funds” for a general discussion of the risks associated with investing in the Asia Pacific Dividend Builder Fund.

MORE ABOUT THE FUNDS’ INVESTMENT STRATEGIES AND RISKS
44
China & Hong Kong Fund
Return to China & Hong Kong Fund Summary Section Investment Objective The China & Hong Kong Fund’s investment objective is long-term capital appreciation primarily through investments in securities of China and Hong Kong. Principal Investment Strategies The China & Hong Kong Fund invests at least 80% of its net assets (plus any borrowings for investment purposes) in the following types of equity securities:(1) equity securities of companies organized under the laws of China or Hong Kong;(2) equity securities of companies that derive at least 50% of their revenues from business activities in China and/or Hong Kong, but which are listed and traded elsewhere; or (3) equity securities of companies that are primarily traded on the China or Hong Kong exchanges. By applying this test, it is possible that a particular issuer could be deemed to be from more than one region or country. The Fund will not change this policy unless it gives shareholders at least 60 days’ notice. Equity securities include common stocks, preferred stocks, securities convertible into common stocks, rights and warrants. The Advisor will invest the Fund’s assets in securities of all market capitalization companies, including companies in emerging markets. Except as noted above, the Board may change the China & Hong Kong Fund’s investment policies and strategies without prior notice to shareholders. When current market, economic, political or other conditions are unsuitable and would impair the pursuit of the China & Hong Kong Fund’s investment objective, the Fund may temporarily invest up to 100% of its assets in cash, cash equivalents or high quality short-term money market instruments. When the Fund takes a temporary defensive position, it may not achieve its investment objective. The Fund will not engage in market timing. The philosophy of the Fund is to remain invested. Principal Risks
Return to China & Hong Kong Fund Summary Section As discussed in the Summary Section and described further below, the China & Hong Kong Fund is subject to the risks common to all mutual funds that invest in equity securities and foreign securities. Investing in this Fund may be more risky than investing in a Fund that invests in U.S. securities due to increased volatility of foreign markets. You may lose money by investing in this Fund. In addition, investing in common stocks entails a number of risks. The stock markets in which the China & Hong Kong Fund invests may experience periods of volatility and instability. A variety of factors can negatively impact the value of common stocks. These factors include a number of economic factors such as interest rates and inflation rates as well as non-economic factors such as political events. Foreign securities experience more volatility than their domestic counterparts, in part because of higher political and economic risks, lack of reliable information, fluctuations in currency exchange rates and the risks that a foreign government may take over assets, restrict the ability to exchange currency or restrict the delivery of securities. All of the risks of investing in foreign securities are heightened by investing in emerging markets. Emerging markets have been more volatile than the markets of developed countries with more mature economies. The China & Hong Kong Fund is non-diversified. It may hold larger positions in a relatively small number of stocks. This may make the Fund’s performance more volatile than would be the case if it had a diversified investment portfolio.

MORE ABOUT THE FUNDS’ INVESTMENT STRATEGIES AND RISKS
45
The following additional risks apply to the China & Hong Kong Fund:
China’s system of government is totalitarian and has been run by the Communist Party of China since the founding of the People’s Republic of China in 1949. The system is not democratic, there is no popular representation and decision making can be both opaque and arbitrary.
China has a long history of tensions with its neighbors. There have been long-running territorial disputes with several neighbors, including a continuing dispute over the status of Taiwan. Military conflict with other countries could disrupt economic development and could destabilize the entire region.
China’s growing economic power has changed the geopolitical picture in Asia with growing tensions between China and the other Asian giants, Japan and India. China is also exposed to possible upheavals in the Korean peninsula. All of these carry the risk of weakening economic growth and development.
Social tensions stemming from China’s rapid growth have increased alongside growing income inequality. The risk of social unrest, as happened in 1989 in Tiananmen Square and across China or more recently in Tibet, could precipitate a government reaction that could reverse China’s recent growth policies.
A program of economic and administrative reform was begun in 1978. These reforms cover state-owned industrial enterprises, the establishment of privately owned businesses, private property ownership, deregulation of prices and trade tariffs and reform of the legal system. These have all contributed a substantial rise in prosperity over the last thirty years but they could be altered, stopped or reversed at any time.
The risk of nationalization, expropriation or confiscation of property may be higher in China than in other countries.
The legal system is still based on statutes promulgated by various state bodies dealing with economic matters such as foreign investment, company organization and governance, commerce, taxation and trade. However, these laws are quite recent with published court decisions based on these being limited and non-binding. This makes the interpretation and enforcement of these laws and regulations uncertain.
China is still a developing economy with significant disparities in progress both geographically and between sectors. This puts strain on China ageing infrastructure and on its financial system. This presents a number of risks to businesses by increasing volatility and the possibility of loss.
While China’s domestic economy is now large, the consumer sector is still in its infancy and China therefore relies on exports to a significant degree. The risk of trade disputes with China’s major trading partners in the US and EU could damage trade.
China’s increasing search for supplies of natural resources is leading it to develop trade relations with countries which are, or may become, subject to sanctions imposed by the United Nations and/or the United States and European Union.
There is also risk posed by changes in the value of the currency against the U.S. dollar and the currencies of China’s trading partners; China’s currency is not yet freely convertible; and there is also the risk that an increase in inflationary pressures may push interest rates significantly higher.
Investments in this Fund are not diversified across other countries and exposure to China-specific risks is much higher than would be for a more geographically diversified fund and may result in greater volatility.
Investments in companies exposed to China may be affected by inflation, interest rate and inflation rate fluctuations that are specific to China.
The Fund may invest in domestic China securities (China A shares) listed on either of the Shanghai or Shenzhen Stock Exchanges via the Shanghai Hong Kong Stock Connect scheme or the Shenzhen Hong Kong Stock Connect scheme. These Stock Connect schemes are relatively new and investors are subject to trading suspensions, quota limitations and market suspensions, clearing, settlement and custody risks that differ from such risk associated with Chinese securities that trade in other markets.

MORE ABOUT THE FUNDS’ INVESTMENT STRATEGIES AND RISKS
46
See “Risks of Investing in Our Funds” for a general discussion of the risks associated with investing in the China & Hong Kong Fund.

MORE ABOUT THE FUNDS’ INVESTMENT STRATEGIES AND RISKS
47
Dividend Builder Fund Return to Dividend Builder Fund Summary Section
Investment Objective The Dividend Builder Fund seeks a moderate level of current income and consistent dividend growth at a rate that exceeds inflation. Principal Investment Strategies The Dividend Builder Fund will invest at least 80% of its net assets (plus any borrowings for investment purposes) in equity securities in dividend-paying companies that the Advisor believes have the ability to consistently increase their dividend payments over the medium term. The Advisor uses fundamental analysis to assess a company’s ability to maintain consistent, real (after inflation) dividend growth. One key measure of a company’s ability to achieve consistent, real dividend growth is its consistency in generating high returns on capital. The Advisor seeks to invest in companies that have returned a real cash flow return on investment of at least 10% for each of the last 10 years and, in the opinion of the Advisor, is likely to grow its dividend over time. The Fund will not change this policy unless it gives shareholders at least 60 days’ notice. Equity Securities may include common stocks, preferred stocks, securities convertible into common stocks, rights and warrants. Except as noted above, the Board may change the investment policies and strategies of the Dividend Builder Fund without prior notice to shareholders. When current market, economic, political or other conditions are unsuitable and would impair the Fund’s pursuit of its investment objective, the Fund may temporarily invest up to 100% of its assets in cash, cash equivalents or high quality short-term money market instruments. When the Fund takes a temporary defensive position, it may not achieve its investment objective. The Fund will not engage in market timing. The philosophy of the Fund is to remain invested. Principal Risks
Return to Dividend Builder Fund Summary Section As discussed in the Summary Section and described further below, the Dividend Builder Fund is subject to the risks common to all mutual funds that invest in equity securities and foreign securities. Investing in the Fund may be more risky than investing in a fund that invests only in U.S. securities due to the increased volatility of foreign markets. You may lose money by investing in this Fund. In addition, investing in equity securities entails a number of risks. The stock markets in which the Dividend Builder Fund invests may experience periods of volatility and instability. A variety of factors can negatively impact the value of common stocks. These factors include a number of economic factors such as interest rates and inflation rates as well as non-economic factors such as political events. Foreign securities experience more volatility than their domestic counterparts, in part because of higher political and economic risks, lack of reliable information, fluctuations in currency exchange rates and the risks that a foreign government may take over assets, restrict the ability to exchange currency or restrict the delivery of securities. All of the risks of investing in foreign securities are heightened by investing in emerging markets. Emerging markets have been more volatile than the markets of developed countries with more mature economies. Risks of Investing in Small- or Mid-Cap Companies The Fund will invest in securities issued by companies of all capitalization. The following risks are common to all mutual funds that are exposed to small-capitalization or mid-capitalization companies (those with a market value of less than U.S. $1 billion or U.S. $5 billion, respectively). As a general rule, investments in small- or mid-cap companies are more risky than investments in larger companies for the following reasons, among others:
MORE ABOUT THE FUNDS’ INVESTMENT STRATEGIES AND RISKS
48
• Limited Product Line. Small-or mid-cap companies tend to rely on more limited product lines and business
activities, which make them more susceptible to setbacks or downturns; • Illiquidity. Securities of small- or mid-cap companies may be traded less frequently than that of larger
companies; • Limited Resources. Small- or mid-cap companies have more limited financial resources; and • Volatility. The performance of small- or mid-cap companies may be more volatile.
See “Risks of Investing in Our Funds” for a general discussion of the risks associated with investing in the Dividend Builder Fund.

MORE ABOUT THE FUNDS’ INVESTMENT STRATEGIES AND RISKS
49
Global Energy Fund
Return to Global Energy Fund Summary Section Investment Objective The Global Energy Fund’s investment objective is long-term capital appreciation. Principal Investment Strategies The Global Energy Fund invests at least 80% of its net assets (plus any borrowings for investment purposes) in equity securities of both U.S. and non-U.S. companies principally engaged in the production, exploration or discovery, or distribution of energy including the research and development or production of alternative energy sources. For purposes of this policy, the term “principally engaged” means that the company must derive at least 50% of its annual gross revenues from the activities listed above. The Fund will not change this policy unless it gives shareholders at least 60 days advance notice. The Advisor believes that growing demands on existing energy supplies, in particular petroleum-based energy supplies, could lead to higher prices for this and other traditional energy sources and the profitable development of alternative sources of energy. These equity securities include common stocks, preferred stocks, securities convertible into common stocks, rights and warrants. The Fund expects that normally, at least 40% of the Fund’s assets will be invested in global securities. For this purpose, a “global security” means a security issued by a company with significant business activities outside the U.S., including but not limited to:
• Having significant assets, revenues or profits coming from outside the U.S.; • Operating significant business activities outside the U.S.; • Having shares principally traded on an exchange or market outside the U.S.; • Organized under the laws of a country other than the U.S.; • Receiving significant economic inputs (including but not limited to raw materials, components or
supplies) from sources outside the U.S.; • Forming part of a benchmark of an index and identified by the index creator as a non-U.S. security; or • Accessing capital markets outside the U.S.
By applying these tests, it is possible that a particular issuer could be deemed to be from more than one region or country. The Fund’s concentration may vary depending on changing market conditions (including but not limited to, liquidity, volatility, and the number of companies meeting selection criteria) although the Advisor has a bias towards concentration. The degree of concentration of the portfolio will vary over time, and under normal market conditions, the Fund may have as few as 25 holdings, or may hold securities in 75 or more companies. The number of holdings in the Fund as of December 31, 2017 was 39. The Fund will invest in securities of companies without regard to market capitalization and in companies domiciled in the U.S. and foreign countries, including, potentially, companies domiciled or traded in emerging markets. Except as noted above, the Board may change the Global Energy Fund’s investment policies and strategies without prior notice to shareholders. When current market, economic, political or other conditions are unstable and would impair the pursuit of the Global Energy Fund’s investment objective, the Fund may temporarily invest up to 100% of its assets in cash, cash equivalents or high quality short-term money market instruments. When the Fund takes a temporary defensive position, it may not achieve its investment objective. The Fund will not engage in market timing. The philosophy of the Fund is to remain invested.
MORE ABOUT THE FUNDS’ INVESTMENT STRATEGIES AND RISKS
50
Principal Risks
Return to Global Energy Fund Summary Section As discussed in the Summary Section and described further below, the Global Energy Fund is subject to the risks common to all mutual funds that invest in equity securities and foreign securities. Investing in the Fund may be more risky than investing in a fund that invests in U.S. securities due to increased volatility of foreign markets. You may lose money by investing in this Fund. In addition, investing in common stocks entails a number of risks. The stock markets in which the Global Energy Fund invests may experience periods of volatility and instability. A variety of factors can negatively impact the value of common stocks. These factors include a number of economic factors such as interest rates and inflation rates as well as non-economic factors such as political events. The Fund is subject to the risk that the earnings, dividends, and securities prices of energy companies will be greatly affected by changes in the prices and supplies of oil and other energy fuels. Prices and supplies of energy may fluctuate significantly over any time period due to many factors, including international political developments; production and distribution policies of the Organization of Petroleum Exporting Countries (OPEC) and other oil-producing countries; relationships among OPEC members and other oil-producing countries and between these countries and oil-importing nations; energy conservation; foreign, federal and state regulatory environments; tax policies; and the economic growth and political stability of the key energy-consuming and energy-producing countries. Foreign securities experience more volatility than their domestic counterparts, in part because of higher political and economic risks, lack of reliable information, fluctuations in currency exchange rates and the risks that a foreign government may take over assets, restrict the ability to exchange currency or restrict the delivery of securities. All of the risks of investing in foreign securities are heightened by investing in emerging markets. Emerging markets have been more volatile than the markets of developed countries with more mature economies. The Global Energy Fund is non-diversified. It may hold larger positions in a relatively smaller number of stocks. This may make the Fund’s performance more volatile than would be the case if it had a diversified investment portfolio. See “Risks of Investing in Our Funds” for a general discussion of the risks associated with investing in the Global Energy Fund.

MORE ABOUT THE FUNDS’ INVESTMENT STRATEGIES AND RISKS
51
Global Innovators Fund Return to Global Innovators Fund Summary Section
Investment Objective The Global Innovators Fund’s investment objective is long-term capital appreciation. Principal Investment Strategies The Global Innovators Fund will seek to obtain its investment objectives through focused investment in securities of companies that the Advisor believes are positioned from one or more of the following: advances in technology, advances in communications, globalism or innovative management. The Global Innovators Fund invests in securities of companies that the Advisor believes are positioned for growth due to advances in technology, communications, globalism or innovative management. The Fund invests in companies that the Adviser believes can create value through original thinking. The Fund will consider all companies in the world’s developed stock markets, such as the United States, the United Kingdom, Canada, Japan, Hong Kong, Singapore, Australia, New Zealand and other stock markets in the European Union. The Fund also may consider investments in emerging stock markets, such as in China, Korea, Taiwan, Malaysia, Thailand and Mexico. The Fund considers “emerging stock markets” to be stock markets in countries considered to be emerging market countries by any of the World Bank, the International Monetary Fund or any widely-recognized index of emerging market securities (e.g., Dow Jones, FTSE, S&P, MSCI). The Fund expects that normally, at least 40% of the Fund’s assets will be invested in global securities. For this purpose, a “global security” means a security issued by a company with significant business activities outside the U.S., including but not limited to:
• Having significant assets, revenues or profits coming from outside the U.S.; • Operating significant business activities outside the U.S.; • Having shares principally traded on an exchange or market outside the U.S.; • Organized under the laws of a country other than the U.S.; • Receiving significant economic inputs (including but not limited to raw materials, components or
supplies) from sources outside the U.S.; • Forming part of a benchmark of an index and identified by the index creator as a non-U.S. security; or • Accessing capital markets outside the U.S.
By applying these tests, it is possible that a particular issuer could be deemed to be from more than one region or country. The Fund’s concentration may vary depending on changing market conditions (including but not limited to, liquidity, volatility, and the number of companies meeting selection criteria) although the Advisor has a bias towards concentration. The degree of concentration of the portfolio will vary over time, and under normal market conditions, the Fund may have as few as 25 holdings, or may hold securities in 75 or more companies. The number of holdings in the Fund as of December 31, 2017 was 30. The Advisor will invest the Global Innovators Fund’s assets in a company’s securities without regard to the issuer’s market capitalization. The Advisor identifies companies with favorable characteristics on innovation from the identifiable universe of companies, and performs research and fundamental analysis to understand the company’s business model, valuation and potential for return. The Advisor then monitors potential or actual investments for performance and risk perspectives, as well as to quantify drivers of return and assess company performance versus expectations. The Board may change the Global Innovators Fund’s investment policies and strategies without prior notice to shareholders. When current market, economic, political or other conditions are unstable and would impair the pursuit of the Global Innovators Fund’s investment objective, the Fund may temporarily invest up to 100% of its assets in cash, cash equivalents or high quality short-term money market instruments. When the Fund takes a temporary defensive

MORE ABOUT THE FUNDS’ INVESTMENT STRATEGIES AND RISKS
52
position, it may not achieve its investment objective. The Fund will not engage in market timing. The philosophy of the Fund is to remain invested. Principal Risks
Return to Global Innovators Fund Summary Section As discussed in the Summary Section and described further below, the Global Innovators Fund is subject to the risks common to all mutual funds that invest in equity securities. Investing in this Fund may be more risky than investing in a fund that only invests in U.S. securities due to increased volatility of foreign markets. You may lose money by investing in this Fund. The Fund’s investment strategy gives risk to the following specific risk: Industry Risks. Many of the Fund’s investments will be in companies in the technology, internet and communications industries or sectors, because there are many innovative companies in those sectors. These industries or sectors are extremely competitive and subject to rapid rates of change or development. The competitive nature of these industries or sectors and the rate of change pose a challenge on the management of these companies to be successful. The Fund may have more investments in these areas than other equity funds that do not focus on companies implementing innovation. See “Risks of Investing in Our Funds” for a general discussion of the risks associated with investing in the Global Innovators Fund.

MORE ABOUT THE FUNDS’ INVESTMENT STRATEGIES AND RISKS
53
Renminbi Yuan & Bond Fund Return to Renminbi Yuan & Bond Fund Summary Section
Investment Objective The Fund’s investment objective is total return. Total return means the combination of capital appreciation and investment income, which includes changes in the value of the Renminbi, the currency of China of which the Yuan is the unit. Principal Investment Strategies Under normal conditions, the Fund will invest a substantial portion of its net assets in Renminbi Yuan-denominated debt instruments that are issued corporations and by the Chinese government (including its agencies or instrumentalities) and traded (i) over the counter in London, Hong Kong or on Euroclear or (ii) in other developing markets, including the China Interbank Bond Market (“CIBM”), and in cash and cash equivalents, bank deposits, certificates of deposit and short-term commercial paper denominated in Renminbi or Yuan. Renminbi (or “RMB”) is the official currency of China, with the principal unit being the Yuan. The Fund may invest up to 20% of its net assets in convertible securities of companies connected to the China region when desirable. The Fund will also invest in other instruments denominated in Renminbi, Yuan or other currencies, including cash or cash items, bank deposits, certificates of deposit, commercial paper, convertible securities and equity-linked notes. The Fund will not change this policy unless it gives shareholders at least 60 days’ notice. Renminbi Yuan-denominated bonds are primarily issued by governmental agencies of China, banking and finance companies, other China issuers and have also been issued by global multinational corporations. The Renminbi Yuan bond markets in London and Hong Kong are newly-developed markets, with a relatively small number of issuers. Some Renminbi Yuan bonds may trade and settle on Euroclear. China recently permitted foreign investors to access CIBM, an over the counter bond market in mainland China. The Fund intends to purchase and sell Renminbi Yuan-denominated bonds in any permissible market. The Advisor expects that the Fund’s investments will be connected to the China region, although non-Chinese issuers have issued Renminbi Yuan bonds that are available in the over the counter markets. The Advisor believes that as the markets develop and more issuers elect to participate, the Fund’s holdings will diversify into issuers not directly connected with the economic performance in China. The Fund’s portfolio will be heavily weighted to banking and finance companies, sovereign debt issued by China and its agencies and instrumentalities, Chinese companies and companies with significant connections to the Chinese economy. For this purpose, securities issued by “the government of China, its agencies and instrumentalities” do not include securities issued by separately incorporated enterprises (even if the government of China is a principal investor). The Fund’s concentration may vary depending on changing market conditions (including but not limited to, liquidity, volatility, and the number of issuers and terms of bond issues). The degree of concentration of the portfolio will vary over time, and under normal market conditions, the Fund may have a limited number of holdings. The Fund may hold securities of all market capitalization companies, including companies in emerging markets. The Fund may invest in securities having short, medium or long-term maturities, which may be “investment grade” or below “investment grade”. The People’s Bank of China recently adopted a pilot program for foreign investors to participate in the CIBM, an over the counter bond market in which investors can trade certain sovereign instruments and corporate debt obligations denominated in RMB. Commercial banks in China are required to conduct bond activity via the CIBM. Currently, the Fund intends to seek to obtain access to the CIBM when an application by the Fund is permissible. There can be no assurance that access to the CIBM will be permitted, obtained or continued. Additional information about these markets is available in the Statement of Additional Information under the heading Renminbi Bond Market Risks.

MORE ABOUT THE FUNDS’ INVESTMENT STRATEGIES AND RISKS
54
When current market, economic, political or other conditions are unsuitable and would impair the pursuit of the Renminbi Yuan & Bond Fund’s investment objective, the Fund may temporarily invest up to 100% of its assets in cash, cash equivalents or high quality short-term money market instruments. When the Fund takes a temporary defensive position, it may not achieve its investment objective. The Fund will not engage in market timing. The philosophy of the Fund is to remain invested. Principal Risks
Return to Renminbi Yuan & Bond Fund Summary Section
As discussed in the Summary Section and described further below, the Renminbi Yuan & Bond Fund is subject to the risks common to all mutual funds that invest in fixed income securities and foreign securities. Investing in this Fund may be more risky than investing in a fund that invests in U.S. securities due to increased volatility of foreign markets. You may lose money by investing in this Fund. An investment in a fund with exposure to the securities markets in the China region involves certain risks and special considerations not typically associated with investment in more developed economies or markets. These risks include greater government control over the economy, political and legal uncertainty, currency fluctuations or exchange limitations, the risk that China’s government may decide not to continue to support economic reform programs and the risk of nationalization or expropriation of assets. Additionally, the markets for Renminbi Yuan bonds are emerging markets characterized by relatively few numbers of issuers and relatively low trading volume, resulting in substantially less liquidity and greater price volatility as compared to more developed markets. Newly developed securities markets may be subject to additional risks, including lack of developed regulation, periods of volatility and instability and market suspension. Methods of settlement and clearing in newly developed markets may be subject to increased risks of error or inefficiency. Moreover, information about issuers in emerging markets including China may not be as complete, accurate or timely as information about listed companies in other more developed economies or markets. In addition, investing in debt securities entails a number of risks. A variety of factors can negatively impact the value of debt securities. These factors include economic factors, such as the ability of issuers to pay principal and interest as the debt becomes due, interest rate fluctuations and inflation rates, as well as non-economic factors such as foreign government regulation and political events. The types of debt issues currently available for the Fund to purchase are issued by mid-cap or larger issuers, many of which have maturities of five years or less. Longer term debt instruments are usually more sensitive to interest rate changes. The Fund may invest in securities of any maturity and quality and may invest without limit in securities that are rated below investment grade (commonly known as junk bonds) or the unrated equivalent. Most of the Renminbi Yuan bonds in which the Fund invests will not have a credit rating issued by a Nationally Recognized Statistical Ratings Organization (“NRSRO”), and the Advisor will conduct its own determination of creditworthiness of the issuer. The debt securities in which the Fund will invest likely will be unsecured obligations. Debt securities are also subject to liquidity risk, and prepayment risk and extension risk (the risk that borrowers will prepay or defer their payment obligations). There is no guarantee that new issuer will be available for the Fund to invest in. Foreign securities experience more volatility than their domestic counterparts, in part because of higher political and economic risks, lack of reliable information, fluctuations in currency exchange rates and the risks that a foreign government may take over assets, restrict the ability to exchange currency or restrict the delivery of securities or currency in payment of interest or principal. Moreover, a lack of liquidity or the inability to exchange currency may limit the Fund’s ability to sell securities or to fund redemption requests. All of the risks of investing in foreign securities are heightened by investing in emerging markets. Emerging markets have been more volatile than the markets of developed countries with more mature economies. Foreign securities markets may have lower volumes of trading, and may involve longer settlement periods and higher transaction costs compared to U.S. markets. The Fund’s investments will be made in China’s currency, the Renminbi (RMB), which can be traded offshore (primarily in Hong Kong, at present) or in mainland China. At present, the Fund can buy Renminbi only at the offshore exchange rate. The offshore and the onshore Renminbi exchange rates may diverge in value, which could

MORE ABOUT THE FUNDS’ INVESTMENT STRATEGIES AND RISKS
55
decrease the value of the Fund’s investments if the currency is more desirable in one market than in another. In previous years, the divergence between the offshore and onshore rates has been pronounced but has since narrowed. The government of China may take action that will result in this divergence increasing or decreasing, or may take no action at all. The Fund will have to acquire RMB to make investments, and convert RMB to US dollars to pay redemptions. There is no guarantee that the Fund will be able to obtain access to the relatively more desirable currency, for investment purposes, and the Fund’s ability to convert RMB to U.S. dollars may be limited. The Renminbi Yuan & Bond Fund is non-diversified. It may hold larger positions in a relatively small number of fixed income securities and may be exposed to fewer issuers. This may make the Fund’s performance more volatile than would be the case if it had a diversified investment portfolio. The following additional risks apply to the Renminbi Yuan & Bond Fund:
China’s system of government is totalitarian and has been run by the Communist Party of China since the founding of the People’s Republic of China in 1949. The system is not democratic, there is no popular representation and decision making can be both opaque and arbitrary.
China has a long history of tensions with its neighbors. There have been long-running territorial disputes with several neighbors, including a continuing dispute over the status of Taiwan. Military conflict with other countries could disrupt economic development and could destabilize the entire region.
China’s growing economic power has changed the geopolitical picture in Asia with growing tensions between China and the other Asian giants, Japan and India. China also is exposed to possible upheavals in the Korean peninsula. All of these carry the risk of weakening economic growth and development.
Social tensions stemming from China’s rapid growth have increased alongside growing income inequality. The risk of social unrest, as happened in 1989 in Tiananmen Square and across China or more recently in Tibet, could precipitate a government reaction that could reverse China’s recent growth policies.
A program of economic and administrative reform was begun in 1978. These reforms cover state-owned industrial enterprises, the establishment of privately owned businesses, private property ownership, deregulation of prices and trade tariffs and reform of the legal system. These all have contributed a substantial rise in prosperity over the last thirty years but they could be altered, stopped or reversed at any time.
The risk of nationalization, expropriation or confiscation of property may be higher in China than in other countries.
The legal system is still based on statutes enacted by various state bodies dealing with economic matters such as foreign investment, company organization and governance, commerce, taxation and trade. These laws are quite recent with published court decisions based on these being limited and non-binding. This makes the interpretation and enforcement of these laws and regulations uncertain.
China is still a developing economy with significant disparities in progress both geographically and across sectors. This puts strain on China’s aging infrastructure and on its financial system. This presents a number of risks to businesses by increasing volatility and the possibility of loss.
While China’s domestic economy is now large, the consumer sector is still in its infancy and China therefore relies on exports to a significant degree. The risk of trade disputes with China’s major trading partners in the U.S. and EU could damage trade.
There is also risk posed by changes in the value of the currency against the U.S. dollar and the currencies of China’s trading partners; China’s currency is not yet freely convertible in all markets; and there is also the risk that an increase in inflationary pressures may push interest rates significantly higher. The imposition of additional currency exchange limitations could affect the Renminbi Yuan bond markets generally and cause the investments to become illiquid.
The government of China could impose controls on currency conversion and movements in RMB exchange rates that could adversely affect companies in the China region, including issuers of debt instruments in which the Fund invests.

MORE ABOUT THE FUNDS’ INVESTMENT STRATEGIES AND RISKS
56
Investments in this Fund are not diversified across other countries and exposure to China-specific risks is much higher than would be for a more geographically diversified fund and may result in greater volatility.
Investments in this Fund may be concentrated in securities issued by the government of China, its agencies and instrumentalities, or banking and financial institutions (organized in China or elsewhere).
Investments in companies exposed to China may be affected by inflation, interest rate and inflation rate fluctuations that are specific to China.
See “Risks of Investing in Our Funds” for a general discussion of the risks associated with investing in the Renminbi Yuan & Bond Fund.

MORE ABOUT THE FUNDS’ INVESTMENT STRATEGIES AND RISKS
57
Risks of Investing in Our Funds General Risks
Return to Alternative Energy Fund Summary Section Return to Asia Focus Fund Summary Section
Return to Asia Pacific Dividend Builder Fund Summary Section Return to China & Hong Kong Fund Summary Section
Return to Dividend Builder Fund Summary Section Return to Global Energy Fund Summary Section
Return to Global Innovators Fund Summary Section Return to Renminbi Yuan & Bond Fund Summary Section
As with all mutual funds, investing in our Funds involves certain risks. We cannot guarantee that a Fund will meet its investment objective or that a Fund will perform as it has in the past. You may lose money if you invest in one of our Funds. The Funds may use various investment techniques, some of which involve greater amounts of risk. We discuss these investment techniques in detail in the Funds’ Statement of Additional Information (the “SAI”). To reduce risk, the Funds are subject to certain limitations and restrictions, which we also describe in the SAI. You should consider the risks described below before you decide to invest in our Funds. Except as noted, each of these risks applies to each Fund. Risks of Investing in Mutual Funds The following risks are common to all mutual funds: Market Risk. The market value of a security may go up or down, sometimes rapidly and unpredictably. These
fluctuations may cause a security to be worth less than it was at the time of purchase. Market risk applies to individual securities, a particular sector or the entire economy. Recently, global financial markets have experienced a period of extreme stress which has resulted in unusual and extreme volatility in the equity markets and in the prices of individual securities. In some cases, the prices of securities issued by individual companies have been negatively impacted even though there may be little or no apparent degradation in the financial conditions or prospects of that company. These market conditions add significantly to the risk of short term volatility of a Fund.
Management Risk. There is a risk that the investment strategy does not achieve the Fund’s objective, or that the
portfolio manager’s judgment as to the growth, income or dividend potential or value of a security proves to be wrong, or that the Advisor does not implement the strategy properly.
Redemption Risk. There is a risk that a Fund could lose money if it had to sell its securities to meet redemption
requests if the redemption requests are unusually large, occur in times of overall market turmoil or when the Fund’s portfolio securities have declined in value, or if the securities the Advisor wishes to sell to satisfy the redemption requests become illiquid.
The following risk is common to all mutual funds that trade actively: Portfolio Turnover Risk. We may trade actively and frequently to achieve a Fund’s goals. This may result in
higher capital gains distributions, which may increase your tax liability if your Fund shares are held in a taxable account. Frequent trading may also increase the Fund’s costs which would affect the Fund’s performance over time.

MORE ABOUT THE FUNDS’ INVESTMENT STRATEGIES AND RISKS
58
The following risk is common to all mutual funds that use derivative instruments: Derivative Risk. Derivatives are instruments that derive their value from a reference asset, rate or index.
Derivatives are complex in nature and may be more sensitive to changes in economic or market conditions, and contain embedded leverage, which can amplify profits or losses. Derivatives may not accurately track the value of the underlying asset, rate or index they are designed to track. Derivatives can be mispriced or improperly valued, which can result in increased obligations to counterparties or increased losses. Using derivatives will also expose the Renminbi Yuan & Bond Fund to the risk that the derivative counterparty will not perform its obligations. The Advisor’s use of derivative instruments may not achieve the Renminbi Yuan & Bond Fund’s investment goals. The Advisor intends to use forward currency contracts for settlement purposes, and may use derivatives as a substitute for conventional securities, to gain access to Renminbi- and Yuan-denominated investments when conventional securities are not available. The Advisor considers these types of derivative investments to be within the Renminbi Yuan & Bond Fund’s 80% investment in Renminbi- and Yuan-denominated investments.
Risk of Investing in Fixed Income Instruments The following risks are common to mutual funds that invest in fixed income securities: Main Risks of Debt Securities. Debt securities may be subject to:
• Credit Risk - The risk that the issuer might not make interest and principal payments when due. • Interest Rate Risk - The risk that interest rates rise, decreasing the value of the debt security. • Prepayment Risk - The risk that borrowers repay an obligation early, which reduces its value and
requires the Fund to make new investments at a potentially lower interest rate. • Extension Risk - The risk that borrowers will repay a debt obligation more slowly, because interest
rates have increased or for other reasons.
Fixed Income Market Risks. Economic and other market developments can adversely affect global fixed income securities markets. Investors may develop concerns about the ability of issuers of debt securities to make timely principal and interest payments, or the ability of financial institutions to facilitate or maintain an orderly market in debt securities. These concerns can contribute to increased volatility in the securities in which the Fund invests. Under some circumstances, such as in 2008 and 2009, debt securities markets can experience reduced liquidity or other adverse credit conditions. These types of market conditions may limit the Fund’s ability to sell the debt securities in which it invests or to find and purchase suitable debt instruments.
Risks of Investing in Foreign Securities The following risks are common to mutual funds that invest in foreign securities: Legal System and Regulation Risks. Foreign countries have different legal systems and different regulations
concerning financial disclosure, accounting, and auditing standards. Corporate financial information that would be disclosed under U.S. law may not be available. Foreign accounting and auditing standards may render a foreign corporate balance sheet more difficult to understand and interpret than a balance sheet subject to U.S. law and standards. Additionally, government oversight of foreign securities exchanges and brokerage industries may be less stringent than in the United States.
Currency and Currency Exchange Risk. Most foreign stocks are denominated in the currency of the country
where they are traded. Each Fund’s net asset value per share (“NAV”) is denominated in U.S. dollars. The exchange rate between the U.S. dollar and most foreign currencies fluctuates; therefore the NAV of a Fund will be affected by a change in the exchange rate between the U.S. dollar and the currencies in which the Fund’s stocks are denominated. The Renminbi Yuan & Bond Fund’s investments are primarily denominated in Renminbi (which is not currently a freely convertible currency and is subject to exchange controls and restrictions) or other currencies. Accordingly, investments in and by the Renminbi Yuan & Bond Fund will be subject to currency fluctuations. There can be no assurance that the Renminbi will not be subject to devaluation or revaluation or

MORE ABOUT THE FUNDS’ INVESTMENT STRATEGIES AND RISKS
59
that shortages in the availability of foreign currency will not develop. The Renminbi Yuan & Bond Fund’s ability to convert Renminbi to other currencies may be limited by supplies of Renminbi in Hong Kong banks. The Funds may also incur transaction costs associated with exchanging foreign currencies into U.S. dollars.
Foreign Securities Market Risks. Foreign securities markets generally have less volume than U.S. markets,
which means it may be more difficult for a Fund to buy or sell shares of foreign securities, which increases the volatility of share prices on such markets. Additionally, trading on foreign securities markets may involve longer settlement periods and higher transaction costs.
Market Concentration. Many foreign securities markets are more concentrated than the U.S. securities market
as a smaller number of companies make up a larger percentage of the market. Therefore, the performance of a single company or group of companies could have a much greater impact on a foreign securities market than a single company or group of companies would on the U.S. securities market.
Expropriation Risk. Foreign governments may expropriate a Fund’s investments either directly by restricting
the Fund’s ability to sell a security, or by imposing exchange controls that restrict the sale of a currency, or indirectly by taxing the Fund’s investments at such high levels as to constitute confiscation of the security. There may be limitations on a Fund’s ability to pursue and collect a legal judgment against a foreign government.
Special Risks of Developing and Emerging Markets. Economies of developing or emerging market countries
may be more dependent on relatively few industries and may be more responsive to local and global changes. Governments of developing and emerging market countries may be more unstable as compared to more developed countries. Developing and emerging market countries may have less developed securities markets or exchanges, and legal and accounting systems. It may be more difficult to sell securities at acceptable prices and security prices may be more volatile than in countries with more mature markets. Currency values may fluctuate more in developing or emerging markets. Developing or emerging market countries may be more likely to impose government restrictions, including confiscatory taxation, expropriation or nationalization of a company’s assets, restrictions on foreign ownership of local companies and restrictions on withdrawing assets from the country. Investments in companies in developing or emerging market countries may be considered speculative.
Return to Asia Focus Fund Summary Section
Return to Asia Pacific Dividend Builder Fund Summary Section Return to China & Hong Kong Fund Summary Section
Return to Renminbi Yuan & Bond Fund Summary Section Risks of Investing in Asia The following risks are common to all mutual funds that invest in Asia: Currency Devaluation. Over 1997 and 1998, the values of many Asian currencies declined because, among
other things, corporations in these countries had to buy U.S. dollars to pay large U.S. dollar-denominated debts. The decline in the value of these currencies triggered a loss of investor confidence that resulted in a decline in the value of the stock markets of the affected countries. Similar devaluations could occur in countries that have not yet experienced currency devaluation or could continue to occur in countries that have already experienced such devaluations.
Political Instability. The economic reforms that Asian nations are instituting under the guidelines of the
International Monetary Fund could cause higher interest rates and higher unemployment. This could, in turn, cause political instability as the people in these nations feel the effects of higher interest rates and higher unemployment, which could cause some Asian nations to abandon economic reform or could result in the election or installation of new governments.
Foreign Trade. Asian nations tend to be very export-oriented. Countries that receive large amounts of Asian
exports could enact protectionist trade barriers in response to cheaper Asian exports, which would hurt the profits of Asian exporters.

MORE ABOUT THE FUNDS’ INVESTMENT STRATEGIES AND RISKS
60
The following risks are also common to all mutual funds that invest in Chinese securities and Renminbi Yuan-denominated instruments: China Risk. Investing in securities of Chinese companies involves special risks, including fluctuations in the
rate of exchange between China’s currency, the Renminbi, and the U.S. dollar, greater price volatility, illiquid markets, investment and repatriation controls, less developed corporate disclosure and governance standards, and market concerns about China’s ability to develop and sustain a credible legal, regulatory, monetary, and socioeconomic system. Chinese issuers may be subject to changes in regulations and tax policies going forward as China has joined the World Trade Organization and has been engaged in economic and financial market liberalization. The Fund’s investments in Chinese issuers may be subject to large fluctuations over short periods of time, and governmental involvement in and influence on the private sector may also impact a Fund as the Chinese government continues to liberalize its economy and regulatory system.
Foreign Exchange Controls and Foreign Currency Considerations. Chinese law requires that all domestic
transactions be settled in Chinese currency, the Renminbi, and places significant restrictions on the remittance of foreign currency and strictly regulates currency exchange from Renminbi. Foreign investors may exchange foreign currencies only at specially authorized banks after complying with documentation requirements. These restrictions may adversely affect foreign investors such as the Renminbi Yuan & Bond Fund. The government of China could devalue the RMB or impose restrictions that would limit a Fund’s ability to profit from appreciation in the RMB.
Competition for Investments. The Funds may face competition from other purchasers for the same investment
opportunities, which could adversely affect a Fund in light of the limited number of issuers. Special Risks of Lower-Grade Securities. Lower-grade securities, whether rated or unrated, may be subject to
wider market fluctuation, greater credit risk and greater risk of loss of income and principal than investment-grade securities. The market for lower-grade securities may be less liquid and therefore they may be harder to sell at an acceptable price, especially during times of market volatility or decline.
China Tax Risk. The Funds may establish a reserve for Chinese tax liabilities. If there is a shortfall in a Fund’s
reserve, the Fund’s NAV may go down because the Fund will ultimately have to pay the additional tax liabilities. A Fund may have to comply with China tax withholding regulations, and may incur and pay tax liabilities that cannot be reclaimed.
Liquidity Risk. The Renminbi Yuan bonds in which the Renminbi Yuan & Bond Fund invests currently are
traded in over the counter markets in London and Hong Kong and on Euroclear. These instruments also are traded in the CIBM which imposes restrictions on access by foreign investors. The over the counter and CIBM markets may not be liquid or active at all times. Therefore the Fund may be subject to the risk of not being able to sell its bonds on a timely basis, or will have to sell at a deep-discount to their face values and, as a result, the Fund’s value and liquidity would be adversely affected.
China/Single Country Risk. The markets in the China region that are open to foreign investors are at a
developing stage and the market capitalization and trading volume may be lower than those in more developed financial markets. Market volatility and potential lack of liquidity due to low trading volumes in China’s debt markets may result in prices of securities traded on such markets fluctuating significantly, and may result in substantial volatility in the share price of the Fund. A Fund’s holdings could be adversely affected if the government of China imposes export restrictions or protectionist trade barriers on the export of goods or services, because these could reduce the ability or desire of an issuer to repay its obligations.
Stock Connect Schemes. The Funds may invest in domestic China securities (China A shares) listed on either of
the Shanghai or Shenzhen Stock Exchanges via the Shanghai Hong Kong Stock Connect scheme or the Shenzhen Hong Kong Stock Connect scheme. These Stock Connect schemes are still developing and have risks of

MORE ABOUT THE FUNDS’ INVESTMENT STRATEGIES AND RISKS
61
illiquidity, trading suspensions, quota limitations and market suspensions, clearing, settlement and custody risks that differ from such risk associated with Chinese securities that trade in other markets. Not all domestic China securities are available through Stock Connect, and securities acquired through Stock Connect are held in nominee name by the clearing company
Other Offshore Investor Risk. The opportunity for foreign investors to access certain markets can be limited
due to a variety of factors including government regulations, adverse tax treatment, and currency convertibility issues. These limitations and restrictions may impact the availability, liquidity and pricing of securities designed to provide foreign investors with exposure to such markets. As a result, foreign investors could have lower returns than domestic investors in the selected countries.
Emerging Trading Market Risk. Renminbi Yuan-denominated bonds are traded in emerging trading markets
characterized by relatively few numbers of issuers and relatively low trading volume, resulting in substantially less liquidity and greater price volatility as compared to more developed markets. Newly developed securities markets may be subject to additional risks, including lack of developed regulation, periods of volatility and instability and market suspension. Methods of settlement and clearing in newly developed markets may be subject to increased risks of error or inefficiency.
Over the Counter (“OTC”) Risk. OTC transactions involve risks in addition to those associated with
transactions traded on exchanges. The value of securities that are traded over the counter may be more volatile than exchange-listed securities and the Fund may be subject to liquidity risk, which may cause the Fund to experience difficulty in purchasing or selling these securities at a fair price. The Fund may be subject to the credit risk of its counterparty to an OTC transaction. Generally, OTC markets are not as transparent as exchange traded markets. There is no guarantee that the OTC market in Hong Kong for Renminbi Yuan bonds will be sustained on a long-term basis, or that the Fund will obtain access to the CIBM.
Return to Alternative Energy Fund Summary Section
Return to Asia Focus Fund Summary Section Return to Asia Pacific Dividend Builder Fund Summary Section
Return to China & Hong Kong Fund Summary Section Return to Dividend Builder Fund Summary Section
Return to Global Energy Fund Summary Section Return to Global Innovators Fund Summary Section
Return to Renminbi Yuan & Bond Fund Summary Section Risks of Investing in Small- or Mid-Cap Companies The following risks are common to all mutual funds that invest in small-capitalization or mid-capitalization companies (those with a market value of less than U.S. $1 billion or U.S. $5 billion, respectively). As a general rule, investments in securities of small- or mid-cap companies are more risky than investments in the securities of larger companies for the following reasons, among others: Limited Product Line. Small-or mid-cap companies tend to rely on more limited product lines and business
activities, which make them more susceptible to setbacks or downturns; Illiquidity. The securities of small- or mid-cap companies may be traded less frequently than that of larger
companies; Limited Resources. Small- or mid-cap companies have more limited financial resources; and Volatility: The securities’ price performance of small- or mid-cap companies may be more volatile.

MORE ABOUT THE FUNDS’ INVESTMENT STRATEGIES AND RISKS
62
Risk of Investing in a Non-Diversified Fund Except for the Dividend Builder Fund, each Fund is a “non-diversified” Fund. This means that, as compared to mutual funds that are diversified, each Fund may invest a greater percentage of its total assets in the securities of a single issuer. As a result, the Fund may hold larger positions in a relatively small number of stocks as compared to many other mutual funds. This may make a Fund’s performance more volatile than would be the case if it had a diversified investment portfolio.

MANAGEMENT OF THE FUNDS
63
MANAGEMENT OF THE FUNDS
Investment Advisor
Return to Alternative Energy Fund Summary Section Return to Asia Focus Fund Summary Section
Return to Asia Pacific Dividend Builder Fund Summary Section Return to China & Hong Kong Fund Summary Section
Return to Dividend Builder Fund Summary Section Return to Global Energy Fund Summary Section
Return to Global Innovators Fund Summary Section Return to Renminbi Yuan & Bond Fund Summary Section
Guinness AtkinsonTM Asset Management, Inc. is the investment advisor for the Guinness AtkinsonTM Funds. Guinness AtkinsonTM supervises all aspects of the Funds’ operations and advises the Funds, subject to oversight by the Board. For providing these services, during the fiscal year ended December 31, 2017, the Funds paid Guinness AtkinsonTM the annual advisory fees shown below, expressed as a percentage of the Funds’ average daily net assets, after waivers and expense reimbursements. Fee waivers and expense reimbursements are discussed further under Fund Expenses.See worksheets
Effective Advisory Fee Rate Paid During 2017 Alternative Energy Fund 0.24% Asia Focus Fund 0.76% Asia Pacific Dividend Builder Fund 0.00%(1) China & Hong Kong Fund 1.00% Dividend Builder Fund 0.00%(1) Global Energy Fund 0.58% Global Innovators Fund(2) 0.64% Renminbi Yuan & Bond Fund 0.00%(1)
(1)The Advisor waived its entire advisory fee during the year ended December 31, 2017. (2)The Advisor charges the Fund the following breakpoint fee schedule as a percentage 0.75% for the first $500 million; and 0.60% on assets in excess of $500 million.
A discussion regarding the basis for the Board of Trustees’ approval of the Investment Advisory Agreement for the Guinness AtkinsonTM Funds is available in these Funds’ Semi-Annual Report to shareholders dated June 30, 2017. Guinness AtkinsonTM is a Delaware corporation with offices in the United States and London. The U.S. offices are located at 225 South Lake Avenue, Suite 201, Pasadena, California 91101. Guinness Atkinson’s London office is located at 14 Queen Anne’s Gate, London, England, SW1H 9AA. Founded in November 2002 by then-current and former senior executives of Investec Asset Management Limited, Guinness AtkinsonTM, as of February 28, 2018, managed approximately $392 million in mutual fund assets. Guinness AtkinsonTM is under common control with Guinness Asset Management Limited and Guinness Capital Management Limited, also located at 14 Queen Anne’s Gate, London, England, SW1H 9AA. These three entities share offices and other resources. Portfolio Management. The Funds’ portfolios are managed by experienced portfolio managers as described below. The SAI provides additional information about the portfolio managers’ method of compensation, other accounts managed by the portfolio managers and the portfolio managers’ ownership of the Funds’ shares.

MANAGEMENT OF THE FUNDS
64
Portfolio Manager Business Experience During the Past Five Years Timothy W.N. Guinness Global Energy Fund
Timothy W.N. Guinness is the co-manager of the Global Energy Fund (since June 2004). Previously, he also served as lead manager of the Global Innovators Fund (2003 to April 2013) and the Alternative Energy Fund (2006 to April 2010), and co-manager of the Asia Focus Fund (2003 to April 2010), Asia Pacific Dividend Builder Fund (since inception—March 2006 to April 2010), China & Hong Kong Fund (2003 to April 2010), and the Renminbi Yuan & Bond Fund (since inception in June 2011 to April 2013). Mr. Guinness has served as Guinness AtkinsonTM’s Chairman and Chief Investment Officer since the firm’s founding. Mr. Guinness graduated from Cambridge University in 1968 with an MA in Engineering and an MSc in Management Science from Massachusetts Institute of Technology in 1970.
Edmund Harriss Asia Focus Fund Asia Pacific Dividend Builder Fund China & Hong Kong Fund Renminbi Yuan & Bond Fund
Edmund Harriss is the lead manager of the Asia Focus Fund (since 2003), Asia Pacific Dividend Builder Fund (since March 2006), China & Hong Kong Fund (since 1998) and Renminbi Yuan & Bond Fund (since June 2011) Previously, he also served as co-manager of the Global Energy Fund (2004 to April 2010) and Global Innovators Fund (2003 to April 2010). Mr. Harriss joined Guinness AtkinsonTM in April 2003, prior to which he was employed by Investec from July 1993 to April 2003. Mr. Harriss graduated from Oxford University in 1991 with an M.Phil in Management Studies.
Mark Hammonds Asia Pacific Dividend Builder Fund
Mark Hammonds is a co-manager of the Asia Pacific Dividend Builder Fund (since May 2017). He joined Guinness AtkinsonTM in September 2012, prior to which he worked at Ernst & Young, where he qualified as a Chartered Accountant. Mr. Hammonds graduated from Corpus Christi College, Cambridge with a First Class degree in Management Studies in 2007. He is a CFA charterholder.
Matthew Page, CFA Global Innovators Fund Dividend Builder Fund
Matthew Page is a co-manager of the Global Innovators Fund (since May 2010) and the Dividend Builder Fund (since March 2012). Previously, he also served as co-manager of the Alternative Energy Fund (February 2007to April 2013). He joined Guinness AtkinsonTM in September 2005, prior to which he was employed by Goldman Sachs from July 2004 to August 2005. He graduated from Oxford University with a Masters in Physics in June 2004.
Edward Guinness Alternative Energy Fund
Edward Guinness is the lead manager of the Alternative Energy Fund (since April 2013) and co-manager (February 2007 to April 2013). He joined Guinness AtkinsonTM in 2006, where he is responsible for managing assets in both the energy and alternative energy sectors. Prior to Guinness AtkinsonTM, Edward worked as an analyst at Tiedemann Investment Group in New York from 2003 to 2006. Prior to that, Mr. Guinness worked in the corporate finance department at HSBC Investment Bank in London between 1998 and 2002. Mr. Guinness has an MA in Engineering and Management Studies from Cambridge. Edward Guinness is the son of Timothy W.N. Guinness.
Dr. Ian Mortimer, CFA Global Innovators Fund Dividend Builder Fund
Dr. Ian Mortimer is a co-manager of the Global Innovators Fund (since May 2011) and the Dividend Builder Fund (since March 2012). Previously, he also served as co-manager of the Global Energy Fund (May 2010 to September 2013). He joined Guinness AtkinsonTM as an analyst in December 2006. From September 2003 to December 2006, Dr. Mortimer completed a PhD in experimental physics at the University of Oxford between September 2003 and November 2006. Dr. Mortimer graduated from University College London with a Masters in Physics in June 2003.
Will Riley Global Energy Fund
Will Riley is the co- manager of the Global Energy Fund (since May 2010). He joined Guinness AtkinsonTM as an analyst in May 2007. Mr. Riley worked for PricewaterhouseCoopers LLP from 2002 to 2007 having qualified as a Chartered Accountant in 2003. Mr. Riley graduated from Cambridge University with a Masters in Geography in 1999.

MANAGEMENT OF THE FUNDS
65
Portfolio Manager Business Experience During the Past Five Years Jonathan Waghorn Global Energy Fund
Jonathan Waghorn is a co-manager of the Global Energy Fund (since September 2013). He joined Guinness AtkinsonTM in September 2013. Mr. Waghorn was employed as co-portfolio manager of the Investec Global Energy Fund (the “Investec Fund”) from 2008 to 2012, succeeding Tim Guinness who managed the Investec Fund from 1998 to 2008. Prior to Investec, he served as co-head of Goldman Sachs’ energy equity research team. Mr. Waghorn graduated from the University of Bristol with a Masters in Physics in 1995.
Fund Expenses
Return to Alternative Energy Fund Summary Section Return to Asia Focus Fund Summary Section
Return to Asia Pacific Dividend Builder Fund Summary Section Return to China & Hong Kong Fund Summary Section
Return to Dividend Builder Fund Summary Section Return to Global Energy Fund Summary Section
Return to Global Innovators Fund Summary Section Return to Renminbi Yuan & Bond Fund Summary Section
In addition to the advisory fees discussed above, the Funds incur other expenses such as shareholder servicing, custodian, transfer agency, interest, Acquired Fund Fees and Expenses and other customary Fund expenses. The Advisor has contractually agreed to reduce its fees and/or pay Fund expenses (excluding Acquired Fund Fees and Expenses, interest, taxes, dividends on short positions and extraordinary expenses) in order to limit Total Annual Fund Operating Expenses for the Funds to the amounts (“Expense Caps”) shown below of the respective Fund’s average net assets:
Expense Cap through June 30, 2019 Alternative Energy Fund 1.98% Asia Focus Fund 1.98% Asia Pacific Dividend Builder Fund 1.10% China & Hong Kong Fund 1.98% Dividend Builder Fund 0.68% Global Energy Fund 1.45% Global Innovators Fund Investor Class 1.24% Institutional Class 0.99% Renminbi Yuan & Bond Fund 0.90%
Any reduction in advisory fees or payment of expenses made by the Advisor is subject to reimbursement by a Fund if requested by the Advisor, and the Board approves such reimbursement in subsequent fiscal years. This reimbursement may be requested by the Advisor if the aggregate amount actually paid by a Fund toward operating expenses for such fiscal year (taking into account any reimbursements) does not exceed the Expense Cap. The Advisor is permitted to be reimbursed for fee reductions and/or expense payments it made in the prior three fiscal years. The Funds must pay their current ordinary operating expenses before the Advisor is entitled to any reimbursement of fees and/or expenses. The current Expense Caps are in place through June 30, 2019 and may be renewed annually by the Board.

MANAGEMENT OF THE FUNDS
66
Distribution and Shareholder Servicing Plans Return to Alternative Energy Fund Summary Section
Return to Asia Focus Fund Summary Section Return to Asia Pacific Dividend Builder Fund Summary Section
Return to China & Hong Kong Fund Summary Section Return to Dividend Builder Fund Summary Section
Return to Global Energy Fund Summary Section Return to Global Innovators Fund Summary Section
Return to Renminbi Yuan & Bond Fund Summary Section
Distribution Plan. The Funds have adopted a Distribution Plan under Rule 12b-1 of the Investment Company Act of 1940. However, currently under this plan, no separate payments from the Funds’ assets are authorized. Shareholder Servicing Plan. Each Fund has adopted a Shareholder Servicing Plan. Shareholder servicing agents provide administrative and support services to their customers, which may include establishing and maintaining accounts and records relating to shareholders, processing dividend and distribution payments from the Funds on behalf of shareholders, responding to routine inquiries from shareholders concerning their investments, assisting shareholders in changing dividend options, account designations and addresses, and other similar services. For these services a Fund may pay a fee at an annual rate of up to 0.25% of its average daily net assets of the shares serviced by the agent. The Funds may enter into agreements with various shareholder servicing agents, including financial institutions and securities brokers. The Funds may pay a servicing fee to broker-dealers and others who sponsor “no transaction fee” or similar programs for the purchase of shares. Shareholder servicing agents may waive all or a portion of their fee periodically. Additional Payments to Dealers. The Advisor and the Distributor (and their affiliates) may make substantial payments to dealers or other financial intermediaries and service providers for distribution and/or shareholder servicing activities, out of their own resources, including the profits from the advisory fees the Advisor receives from the Funds. Some of these distribution-related payments may be made to dealers or financial intermediaries for marketing, promotional or related expenses; these payments are often referred to as “revenue sharing.” In some circumstances, those types of payments may create an incentive for a dealer or financial intermediary or its representatives to recommend or offer shares of the Funds to its customers. You should ask your dealer or financial intermediary for more details about any such payments it receives.
SHAREHOLDER INFORMATION
67
SHAREHOLDER INFORMATION
How to Purchase, Exchange, and Redeem Shares
Return to Alternative Energy Fund Summary Section Return to Asia Focus Fund Summary Section
Return to Asia Pacific Dividend Builder Fund Summary Section Return to China & Hong Kong Fund Summary Section
Return to Dividend Builder Fund Summary Section Return to Global Energy Fund Summary Section
Return to Global Innovators Fund Summary Section Return to Renminbi Yuan & Bond Fund Summary Section
Investors can open an account using any of the account types shown below with at least the investment minimum amount provided earlier in the Funds’ Summary Sections.
Regular Retirement Individual Roth IRA Joint Tenant Regular IRA UGMA/UTMA Rollover IRA Trust Roth Conversion Corporate SEP IRA 401 (k)
Investors may purchase, exchange or redeem each Fund’s shares at the Fund’s NAV next computed after receipt of the order. Transactions will only occur on days the New York Stock Exchange (the “NYSE”) is open. To purchase, exchange or redeem shares of the Funds, investors must submit orders to the Funds by the applicable cut-off time to receive the NAV calculated on that day. If an order is received after the applicable cut-off time, it will be processed the next business day. The cut-off time for the Guinness AtkinsonTM Funds is the close of the NYSE (generally 4:00 p.m. Eastern Time). Investors who wish to purchase, exchange or redeem Fund shares through a broker-dealer should contact the broker-dealer regarding the hours during which orders to purchase, exchange or redeem shares of the Funds may be placed. The Funds’ transfer agent is open from 9:00 a.m. to 8:00 p.m. Eastern Time for purchase, exchange or redemption orders. Please note that the value of your account may be transferred to your state of residence if no activity occurs in the account within the time period specified by your State’s abandoned property laws. Householding. In an effort to decrease costs, Guinness AtkinsonTM Funds will reduce the number of duplicate prospectuses and annual and semi-annual reports that you receive by sending only one copy of each to those addresses shown by two or more accounts. Please call the transfer agent toll free at 1-800-915-6566 to request individual copies of these documents. Guinness AtkinsonTM Funds will begin sending individual copies 30 days after receiving your request. This policy does not apply to account statements. Electronic Delivery. The Guinness Atkinson™ Funds offer shareholders the option to receive account statements, prospectuses, tax forms and reports online. To sign up for eDelivery, please visit www.gafunds.com or contact the Funds at 1-800-915-6565. Frequent Trading or Market Timing. Each Fund has a long-term investment outlook and generally undertakes a “buy and hold” strategy in order to reduce turnover and maximize after-tax returns. Frequent trading of Fund shares or market timing can disrupt a Fund’s investment program and create additional transaction costs that are

SHAREHOLDER INFORMATION
68
borne by all shareholders. Therefore, the Funds do not believe that it is in the interests of their shareholders to accommodate market timing, and have adopted policies and procedures designed to discourage these practices. To discourage market timing activity, the Funds reserve the right to restrict or refuse any purchase orders or exchanges, in whole or in part, for any reason (including, without limitation, purchases by persons whose trading activity in Fund shares is believed by the Advisor to be harmful to the Funds) and without prior notice. The Funds may reject any purchase or exchange request that the Funds regard as disruptive to efficient portfolio management. The advisor believes that four of the Guinness Atkinson Funds are more susceptible to frequent trading. These Funds are the Asia Focus Fund, Asia Pacific Dividend Builder Fund, the China & Hong Kong Fund and the Renminbi Yuan & Bond Fund. What makes these Funds more vulnerable is the fact that they hold securities in markets that open and close before the US markets begin daily operations and there is an inherent time lag between the last valuation point in these markets and the valuation point for the Funds. Each of these Funds systematically utilizes fair value pricing to prevent market timers from engaging in time zone arbitrage. In addition, these four Funds impose fees on certain redemptions. A redemption fee is uniformly imposed on all Fund shares of these Funds held for 30 days or less, except as otherwise described in “Redemption Fees” below. The advisor has some limited procedures in place to identify abusive trading. Identifying abusive trading activity is complex and subjective and the Funds may not identify all trades or trading practices that might be considered abusive, in part because the Funds receive purchase and sale orders through group or omnibus accounts. The Funds have entered into information sharing agreements with financial intermediaries under which these intermediaries must provide the Funds, at the Funds’ request, with information about their customers that invest in the Funds through omnibus accounts. The Funds will use this information, if possible, to identify abusive trades or trading practices and restrict or reject trades and impose the redemption fee. The financial intermediaries are contractually required to follow the Funds’ instructions to restrict or prohibit future purchases by shareholders that are found to have engaged in abusive trading in violation of the Funds’ policies. There is no guarantee that information provided by financial intermediaries will be accurate or that the Funds will be able to use that information to discover and restrict or prevent abusive trading. The Funds’ ability to monitor or discourage abusive trading practices in omnibus accounts may be limited. Funds that primarily hold foreign securities often value their assets as of the close of the relevant local markets, although the time at which these funds calculate their net asset value per share (the “Valuation Point”) may be much later in the day. The resulting potential arbitrage between a security’s value at the local market close and the Valuation Point may give rise to market timing of such funds. The fair value pricing procedure is one measure to discourage such behavior, as is the redemption fee which is imposed on the Asia Focus Fund, Asia Pacific Dividend Builder Fund, China & Hong Kong Fund and the Renminbi Yuan & Bond Fund. Conversion of Shares. A share conversion is a transaction in which shares of one class of the Fund are exchanged for shares of another class of the Fund. Share conversions can occur between each share class of the Fund. Generally, share conversions occur when a shareholder becomes eligible for another share class of the Fund or no longer meets the eligibility criteria of the share class owned by the shareholder (and another class exists for which the shareholder would be eligible). Please note that a share conversion is generally a non-taxable event, but you should consult with your personal tax advisor on your particular circumstances. Please note, all share conversion requests must be approved by the Advisor. The Fund’s frequent trading policies will not be applicable to share conversions. If you hold your shares through a financial intermediary, please contact the financial intermediary for more information on share conversions. Please note that certain financial intermediaries may not permit all types of share conversions. The Fund reserves the right to terminate, suspend or modify the share conversion privilege for any shareholder or group of shareholders. The Fund reserves the right to automatically convert shareholders from one class to another if they either no longer qualify as eligible for their existing class or if they become eligible for another class. Such mandatory conversions may be as a result of a change in value of an account due to market movements, exchanges or redemptions. The Fund will notify affected shareholders in writing prior to any mandatory conversion.

SHAREHOLDER INFORMATION
69
Purchasing How to Purchase Shares. You may purchase shares of any Guinness AtkinsonTM Fund or Prime Obligations Fund by mail, wire or through the Automatic Investment Plan. You may exchange shares of any Guinness AtkinsonTM Fund for shares of another Guinness AtkinsonTM Fund or First American Prime Obligations by mail or phone. A broker may charge you a transaction fee for making a purchase for you. Mail To purchase by mail, you should: Complete and sign the account application; To open an account, write a check payable to: “Guinness AtkinsonTM Funds”; Send your account application and check or exchange request to one of the following addresses:
For regular mail delivery: For an overnight delivery: Guinness AtkinsonTM Funds c/o U.S. Bancorp Fund Services, LLC P.O. Box 701 Milwaukee, Wisconsin 53201-0701
Guinness AtkinsonTM Funds c/o U.S. Bancorp Fund Services, LLC 615 East Michigan Street, 3rd Floor Milwaukee, Wisconsin 53202-5207
The Guinness AtkinsonTM Funds do not consider the U.S. Postal Service or other independent delivery services to be its agents. Therefore, deposit in the mail or with such services, or receipt at U.S. Bancorp Fund Services, LLC post office box, of purchase orders or redemption requests does not constitute receipt by the transfer agent of the funds. Receipt of purchase orders or redemption requests is based on when the order is received at the transfer agent’s offices. Guinness AtkinsonTM Funds will not accept payment in cash or money orders. To prevent check fraud, the Funds will not accept third party checks, Treasury checks, credit card checks, traveler’s checks or starter checks for the purchase of shares. All purchases must be made in U.S. dollars drawn on a bank located in the United States. The Funds are unable to accept post-dated checks or any conditional order or payment. Additionally, shares of the Funds have not been registered for sale outside of the United States. Wire To open an account by wire, a completed account application is required before your wire can be accepted. You can mail or overnight deliver your account application to the transfer agent. Upon receipt of your completed application, an account will be established for you. The account number assigned will be required as part of the instruction that should be given to your bank to send the wire. Your bank must include the name of the Fund you are purchasing, the account number and your name so that monies can be correctly applied. Call the transfer agent at 1-800-915-6566 between 9:00 a.m. and 8:00 p.m. Eastern Time on any day the NYSE is open for business to advise of your intent to wire. This will ensure proper credit.
Instruct your bank to send the wire to: U.S. Bank, N.A. 777 East Wisconsin Avenue Milwaukee, Wisconsin 53202 ABA #075000022 Credit: U.S. Bancorp Fund Services, LLC Account #112-952-137 Further Credit: Guinness AtkinsonTM Funds, [Name of Fund] (Shareholder Name, Shareholder Account #)
Your bank may impose a fee for investments by wire. Neither the relevant Fund nor the transfer agent will be responsible for delays resulting from the banking or Federal Reserve wire systems. You will receive the NAV from

SHAREHOLDER INFORMATION
70
the day that your wired funds have been received by the relevant Fund or the transfer agent. Wires received after the close of the NYSE will be considered received by the next business day. Telephone You can make additional investments into your account by telephone by first checking the appropriate box on your account application form authorizing telephone purchases. If your account has been open for at least 15 days, call the Funds toll free at 1-800-915-6566 and you will be allowed to move amounts of $250 or more from your bank account to your Fund account upon request. Shares of the Funds will be purchased in your account at the NAV determined on the day your order is placed prior to market close (generally 4:00 p.m. Eastern Time); any purchase requests made after market close will receive the Funds next calculated NAV price. Only bank accounts held at domestic institutions that are Automated Clearing House (“ACH”) members may be used for telephone transactions. For security reasons, requests by telephone will be recorded. Automatic Investment Plan If you intend to use the Automatic Investment Plan (“AIP”), you may open your account with an initial minimum investment of $100. Once an account has been opened, you can make additional purchases of shares of the Funds through an AIP. The AIP provides a convenient method to have monies deducted directly from your bank account for investment into the Funds. AIP is not available for the Dividend Builder Fund and the Renminbi Yuan & Bond Fund. You can make automatic monthly, quarterly or annual purchases of $100 or more into the Funds. Only bank accounts held at domestic institutions that are ACH members may be used for this option. If you wish to change the amount of your investment or to terminate the plan, please contact the transfer agent 5 days prior to the effective date. Additionally, the transfer agent will charge a $25 fee for any payment returned. The Funds may alter, modify or terminate the AIP at any time. To begin participating in the AIP, please complete the Automatic Investment Plan section found on the account application or contact the Funds at 1-800-915-6566 for instructions. Purchase Order Cut-Off We may cease taking purchase orders for the Funds at any time when we believe that it is in the best interest of our current shareholders. The purpose of such action is to limit increased Fund expenses incurred when certain investors buy and sell shares of the Funds for the short-term when the markets are highly volatile.
SHAREHOLDER INFORMATION
71
Exchanging and Redeeming How to Exchange and Redeem Shares. You may exchange or redeem shares by mail or telephone. When you exchange shares in any Fund for shares in an identically registered account of any other Fund, you are treated for federal income tax purposes as if you sold shares of one Guinness AtkinsonTM Fund and bought shares of another Fund or of the First American Prime Obligations Fund. You may realize either a gain or loss on the shares exchanged or redeemed and will be responsible for paying the appropriate taxes. If you exchange or redeem through a broker, the broker may charge you a transaction fee. If you purchased your shares by check, or electronic funds transfer through the ACH network, you may not receive your redemption proceeds until your purchase amount has cleared, which may take up to 15 calendar days. Redemptions and exchanges will be processed only on a day during which the NYSE is open for business. You may receive the proceeds of redemption by check, electronic funds transfer through the ACH network, wire or through a systematic withdrawal plan as described below. Please note that certain fees may apply depending on the timing or manner in which you redeem or exchange shares. These are further described below. Requests to redeem or exchange shares are processed at the NAV next calculated after we receive your request in proper form. Except as noted above, each Fund typically expects to mail or wire redemption proceeds between one to three days following the receipt of the redemption request in good order. A Fund may temporarily suspend the right of redemption or postpone payments under certain emergency circumstances or when the SEC orders a suspension. Under normal market conditions, each Fund typically expects to meet redemption requests through holdings of cash or cash equivalents through sales of portfolio securities or short-term borrowings from its custodian. In unusual or stressed market conditions, in addition to the methods used in normal market conditions, a Fund may meet redemption requests through redemptions in kind, or such other liquidity means or facilities as the Fund may have in place from time to time. Shareholders who have an IRA or other retirement plan must indicate on their written redemption request whether or not the Fund should withhold federal income tax from the redemption proceeds. Redemption requests failing to indicate an election not to have tax withheld will generally be subject to withholding equal to 10% of the redemption proceeds. Shares held in IRA and other retirement accounts may be redeemed by telephone at 1-800-915-6566. Investors will be asked whether or not to withhold taxes from any distribution. Mail To exchange or redeem by mail, please: Provide your name and account number; Specify the number of shares or dollar amount and the Fund name or number; To exchange shares, specify the name of the Fund (either another Guinness AtkinsonTM Fund or the First
American Prime Obligations Fund) you want to purchase; Sign the redemption or exchange request (the signature must be exactly the same as the one on your account
application). Make sure that all parties that are required by the account registration sign the request, and any applicable signature guarantees are on the request; and
Send your request to the appropriate address as given under purchasing by mail. If your exchange represents an initial investment into the First American Prime Obligations Fund, a new account application will be required and the minimum initial investment must be met. First American Prime Obligations Fund Although Guinness AtkinsonTM does not operate a money market fund, you may exchange shares of the Funds for shares of the First American Prime Obligations Fund (“Prime Obligations”). U.S. Bancorp Asset Management, Inc., an affiliate of the Funds’ transfer agent, advises Prime Obligations. U.S. Bancorp Asset Management, Inc.’s address is 800 Nicollet Mall, Minneapolis, Minnesota 55402. You may only exchange into shares of Prime Obligations if they are available to residents of the state in which you reside. Please obtain and read the Prime

SHAREHOLDER INFORMATION
72
Obligations prospectus before you decide to invest. You may request a Prime Obligations prospectus and the necessary account applications by calling 1-800-915-6566. Exchanges into Prime Obligations must meet the minimums as stated in the prospectus and a separate application form will be required for any initial investment. This exchange privilege does not constitute an offering or recommendation on the part of the Funds or Advisor of an investment in Prime Obligations. This exchange privilege is offered as a convenience to the Funds’ shareholders. Please note that when exchanging from a Fund into Prime Obligations, you will begin accruing income from Prime Obligations the day following the exchange. When exchanging less than all of the balance from Prime Obligations to a Guinness AtkinsonTM Fund, your exchange proceeds will exclude accrued and unpaid income from Prime Obligations through the date of exchange. An exchange is considered to be a sale of shares for federal income tax purposes on which you may realize a taxable gain or loss. Telephone You may redeem or exchange your shares of your Guinness AtkinsonTM Fund by telephone if you authorized telephone redemption and/or exchange on your account application. In order to arrange for the telephone redemption option after your account has been established, or to change the bank account or address designated to which redemption proceeds are sent, you must send the transfer agent a written request. The request must be signed by each shareholder of the account. The transfer agent may require a signature(s) guarantee. To exchange or redeem by telephone, call the transfer agent at 1-800-915-6566 between the hours of 9:00 a.m. and 8:00 p.m. Eastern Time on a day the NYSE is open for business. Shares of the Fund will be sold or exchanged in your account at the NAV determined on the day your order is placed prior to market close (generally 4:00 p.m. Eastern Time); any exchange or redemption requests made after market close will receive the Funds next calculated NAV price. For your protection against fraudulent telephone transactions, we will use reasonable procedures to verify your identity. As long as we follow these procedures, we will not be liable for any loss or cost to you if we act on instructions to redeem your account that we reasonably believe to be authorized by you. If an account has more than one owner or authorized person, the Fund will accept telephone instructions from any one owner or authorized person. You will be notified if we refuse telephonic redemption or exchange transaction. Once a telephone transaction is placed, it cannot be cancelled or modified after the close of regular trading on the NYSE (generally, 4:00 p.m., Eastern time). Telephone exchanges or redemptions may be difficult during periods of extreme market or economic conditions. If this is the case, please send your exchange or redemption request by mail or overnight courier. Proceeds If elected on your account application, you may have the proceeds of the redemption request sent by check to your address of record, by wire to a pre-determined bank, or by electronic funds transfer via the ACH network to the bank account designated by you on your fund account application. The minimum wire amount is $500 and there is a $15 fee for each wire transfer. When proceeds are sent via the ACH network, the funds are usually available in 2-3 business days. Systematic Withdrawal Plan If you own or are purchasing shares of a Fund having a current value of at least $1,000, you may participate in a Systematic Withdrawal Plan (“SWP”). The SWP provides for automatic redemptions of at least $100 on a monthly, quarterly, semi-annually or annual basis. These redemptions may result in a taxable gain or loss. You may have the proceeds of the SWP sent by check to your address of record or by electronic funds transfer via the ACH network to the bank account designated by you on your Fund account application. You may establish the SWP by completing this section on the account application or by calling the Funds at 1-800-915-6566 for instructions. You may terminate or modify your participation in the Plan by calling the Transfer Agent five days prior to the next scheduled payment. Signature Guarantee If (a) the proceeds of any redemption exceed $50,000, (b) the redemption proceeds are to be payable or sent to a person, address or bank account not on record, (c) when a redemption is received by the transfer agent and the account address has changed within the last 15 calendar days, or (d) when ownership changes on an account, the signature(s) on the redemption request must be stamped with a signature guarantee from either a Medallion program member or a non-Medallion program member. Signature guarantees will generally be accepted from domestic

SHAREHOLDER INFORMATION
73
banks, brokers, dealers, credit unions, national securities exchanges, registered securities associations, clearing agencies and savings associations, as well as from participants in the NYSE Medallion Signature Program and the Securities Transfer Agents Medallion Program (“STAMP”). A notary public is not an acceptable signature guarantor. Additional documentation may be required for the redemption of shares held in corporate, partnership or fiduciary accounts. In case of any questions, please contact the Funds in advance by calling 1-800-915-6566. The Funds or the transfer agent may require a signature guarantee in other instances. Non financial transactions, including establishing or modifying certain services on an account, may require a signature guarantee, signature verification from a Signature Validation Program member, or other acceptable form of authentication from a financial institution source. Investment Broker or Dealer You may buy and sell shares of the Funds through certain brokers (and their agents) that have made arrangements with the Funds to sell their shares. When you place your order with such a broker or its authorized agent, your order is treated as if you had placed it directly with the transfer agent, and you will pay or receive the NAV next calculated by the Funds. The broker (or agent) holds your shares in an omnibus account in the broker’s (or agent’s) name, and the broker (or agent) maintains your individual ownership records. Certain brokers may have an earlier cut-off time for placing orders. The Funds may pay the broker or its agent for maintaining these records as well as providing other shareholder services. The broker (or its agent) may charge you a fee for handling your order. The broker (or agent) is responsible for processing your order correctly and promptly, keeping you advised regarding the status of your individual account, confirming your transactions and ensuring that you receive copies of the Funds’ prospectus.
SHAREHOLDER INFORMATION
74
Additional Exchange/Redemption Information Redemption Fee
Return to Alternative Energy Fund Summary Section Return to Asia Focus Fund Summary Section
Return to Asia Pacific Dividend Builder Fund Summary Section Return to China & Hong Kong Fund Summary Section
Return to Dividend Builder Fund Summary Section Return to Global Energy Fund Summary Section
Return to Global Innovators Fund Summary Section Return to Renminbi Yuan & Bond Fund Summary Section
You will be charged a redemption fee of 2.00% of the value of the shares being redeemed if you redeem or exchange your shares of the Asia Focus Fund, Asia Pacific Dividend Builder Fund, China & Hong Kong Fund or the Renminbi Yuan & Bond Fund within 30 days of purchase. There will be no redemption fee on the redemption or exchanges of shares acquired through reinvestment of distributions. The “first in, first out” (“FIFO”) method is used to determine the holding period; this means that if you bought shares on different days, the shares purchased first will be redeemed first for the purpose of determining whether the redemption fee applies. The redemption fee is deducted from your proceeds and is retained by the Funds for the benefit of its long-term shareholders. Although each Fund aims to apply the redemption fee uniformly, the redemption fee may not apply in certain circumstances including when it is not currently practicable for the Fund to impose the fee, such as redemptions of shares held in certain omnibus accounts or retirement plans that cannot implement the redemption fee, or upon redemptions by seed investors. Small Accounts. To reduce our expenses, we may redeem an account if the total value of the account falls below $500 due to redemptions. You will be given 30 days prior written notice of this redemption. During that period, you may purchase additional shares to avoid the redemption. Check Clearance. The proceeds from a redemption request may be delayed up to 15 calendar days from the date of the receipt of a purchase by check or electronic funds transfer through the ACH network until the purchase amount clears. If the payment for the purchase does not clear, you will be responsible for any losses suffered by the relevant Fund as well as a $25 service charge imposed by the transfer agent. This delay can be avoided by purchasing shares by wire. Exchange Limit. In order to limit expenses, we reserve the right to limit the total number of exchanges you can make in any year to four. Customer Identification Program. Please note that, in compliance with the USA Patriot Act of 2001, the transfer agent will verify certain information on your account application as part of the Funds’ Anti-Money Laundering Program. As requested on the application, you must supply your full name, date of birth, social security number and permanent street address. Effective May 11, 2018, f you are opening the account in the name of a legal entity (e.g., partnership, limited liability company, business trust, corporation, etc.), you must also supply the identity of the beneficial owners. Mailing addresses containing only a P.O. Box will not be accepted. If you do not supply the necessary information, the transfer agent may not be able to open your account. Please contact the transfer agent at 1-800-915-6566 if you need additional assistance when completing your application. If the transfer agent is unable to verify your identity or that of another person authorized to act on your behalf, or if it believes it has identified potentially criminal activity, the Funds reserve the right to close your account or take any other action they deem reasonable or required by law.

SHAREHOLDER INFORMATION
75
Pricing Fund Shares Net Asset Value. The NAVs of all of the Guinness AtkinsonTM Funds are determined at the close of business of the NYSE (generally 4:00 p.m. Eastern Time). Each Fund’s NAV is calculated by (1) subtracting the Fund’s liabilities from its assets and then (2) dividing that number by the total number of outstanding shares. This procedure is in accordance with Generally Accepted Accounting Principles. Each Fund’s securities are based upon readily available price quotations. Securities without a readily available price quotation will be priced at fair value, as determined in good faith by, or under the supervision of, the Funds’ officers under methods authorized by the Board. Because each Fund holds portfolio securities that are primarily listed on foreign exchanges that trade on days when the Funds do not price their shares, the NAV of each Fund’s shares may change on days when shareholders will not be able to purchase or redeem the Fund’s shares. Fair Value Pricing. The occurrence of certain events after the close of foreign markets, but before a Fund’s NAV is calculated (such as a significant surge or decline in the U.S. or other markets) often will result in an adjustment to the trading prices of foreign securities when foreign markets open on the following business day. If such events occur, an affected Fund will value foreign securities at fair value, taking into account such events, in calculating NAV. In such cases, use of fair valuation can reduce an investor’s ability to seek to profit by estimating the Fund’s NAV in advance of the time the NAV is calculated. With respect to all of the Funds, if market quotations do not accurately reflect fair value for a security, or if a security’s value has been materially affected by events occurring after the close of the exchange or market on which the security is principally traded, that security may be valued by another method that the Board believes accurately reflects fair value. The Board has adopted fair valuation procedures to be used when any assets for which reliable market quotations are not readily available or for which the Funds’ pricing service does not provide a valuation or provides a valuation that, in the judgment of the Fund’s Valuation Committee, does not represent fair value. The Funds also may fair value a security if the Fund’s Valuation Committee believes that the market price is stale and does not reflect a fair market value. There can be no assurance that any Fund could purchase or sell a portfolio security at the price used to calculate the Fund’s NAV. In the case of fair valued portfolio securities, lack of information and uncertainty as to the significance of information may lead to a conclusion that a prior valuation is the best indication of a portfolio security’s current value. Fair valuations generally remain unchanged until new information becomes available. Consequently, changes in the fair valuation of portfolio securities may be less frequent and of greater magnitude than changes in the price of portfolio securities valued by an independent pricing service or based on market quotations.

SHAREHOLDER INFORMATION
76
Distributions and Taxes Return to Alternative Energy Fund Summary Section
Return to Asia Focus Fund Summary Section Return to Asia Pacific Dividend Builder Fund Summary Section
Return to China & Hong Kong Fund Summary Section Return to Dividend Builder Fund Summary Section
Return to Global Energy Fund Summary Section Return to Global Innovators Fund Summary Section
Return to Renminbi Yuan & Bond Fund Summary Section Dividends and Capital Gains Distributions. All Funds distribute all or most of their net investment income and net capital gains to shareholders. Dividends (investment income) for all the Funds, except for the Asia Pacific Dividend Builder Fund, the Dividend Builder Fund and the Renminbi Yuan & Bond Fund, are normally declared and paid annually, in December. Each of the Asia Pacific Dividend Builder Fund, the Dividend Builder Fund and the Renminbi Yuan & Bond Fund normally declare and pay investment income dividends quarterly. Net capital gains for all Funds are normally distributed in December. When calculating the amount of its capital gain a Fund can offset any capital gain with net capital loss (which may be carried forward from a previous year). Your dividends and/or capital gains distributions will be automatically reinvested on the ex-dividend date when there is a distribution, unless you elect otherwise, so that you will be buying more of both full and fractional shares of a Fund. You will be buying those new shares at the NAV on the ex-dividend date. You may choose to have dividends and/or capital gains distributions paid to you in cash. You may change your election by writing or calling the transfer agent at least five days prior to the record date of the next distribution. Dividends and other distributions are treated in the same manner for federal income tax purposes whether paid in cash or reinvested. If you elect to receive dividends and/or distributions in cash and the U.S. Postal Service cannot deliver your check, or if a check remains uncashed for six months, each Fund reserves the right to reinvest the check in your account at the Fund’s then current NAV and to reinvest all subsequent dividends and distributions. You may also choose to reinvest dividends and/or capital gains distributions in shares of another Guinness AtkinsonTM Fund. You may authorize either of these options by calling the transfer agent at 1-800-915-6566 and requesting an optional shareholder services form. You must complete the form and return it to the transfer agent before the record date in order for the change to be effective for that dividend or capital gains distribution. Buying Before a Dividend. If you purchased shares of a Fund on or before the record date for a dividend or capital gains distribution, you will receive a dividend or capital gains distribution. The dividend or distribution will lower the NAV of the Fund on that date and represents, in substance, a return of basis (your cost); however you will be subject to federal income taxes on this dividend or distribution. Tax Issues. The following tax information is based on U.S. federal tax laws and regulations in effect on the date of this prospectus. These laws and regulations are subject to change. Shareholders should consult a tax professional for the U.S. federal tax consequences of investing in our Funds as well as for information on foreign, state and local taxes which may apply. A statement that provides the U.S. federal income tax status of the Funds’ distributions will be sent to shareholders promptly after the end of each year. Distributions to Shareholders. Qualified dividends received from a Fund by noncorporate shareholders will be taxed at long-term capital gain rates to the extent attributable to qualified dividends received by the Fund. Nonqualified dividends, dividends received by corporate shareholders and dividends from a Fund’s short-term capital gains are taxable as ordinary income. Dividends from a Fund’s long-term capital gains are taxable as long-term capital gains. You have to pay taxes on distributions even though you have them automatically reinvested. On some occasions a distribution made in January will be treated for tax purposes as having been distributed on December 31st of the prior year. Gain or Loss on Sale of Shares of a Fund. You may recognize either a gain or loss when you sell shares of a Fund. The gain or loss is the difference between the proceeds of the sale (the per share NAV of the Fund on the

SHAREHOLDER INFORMATION
77
date of sale times the number of shares sold) and your adjusted basis in those shares. Any loss realized on a taxable sale of shares held for six months or less will be treated as a long-term capital loss, to the extent of the amount of capital gain dividends received on such shares. If you sell shares of a Fund at a loss and purchase shares of the same Fund within 30 days before or after the sale (a wash sale), a deduction for the loss is generally disallowed. Foreign Source Income and Withholding Taxes. Some of the Funds’ investment income may be subject to foreign income taxes that are withheld at the source. If the Funds meet certain legal requirements, they may elect to “pass-through” these foreign taxes to shareholders. If a Fund so elects, shareholders would be required to include in gross income, even though not actually received, their pro rata share of such foreign taxes and would therefore be allowed to claim a foreign tax credit or a deduction for their share of foreign taxes paid, subject to applicable limitations. Exchanges. For tax purposes, an exchange of shares of one Guinness AtkinsonTM Fund for shares of another (or for shares of the First American Prime Obligations Fund) will be treated as a sale of shares.
Return to Alternative Energy Fund Summary Section Return to Asia Focus Fund Summary Section
Return to Asia Pacific Dividend Builder Fund Summary Section Return to China & Hong Kong Fund Summary Section
Return to Dividend Builder Fund Summary Section Return to Global Energy Fund Summary Section
Return to Global Innovators Fund Summary Section Return to Renminbi Yuan & Bond Fund Summary Section

FINANCIAL HIGHLIGHTS
78
FINANCIAL HIGHLIGHTS Alternative Energy Fund
Return to Alternative Energy Fund Summary Section This financial highlights table is intended to help you understand the Alternative Energy Fund’s financial performance for the past five years. Certain information reflects financial results for a single share of the Fund. The total returns in the table represent the rate that an investor would have earned or lost on an investment in the Fund assuming reinvestment of all dividends and distributions. The information in the table was audited by Tait, Weller & Baker LLP, whose report, along with the Fund’s financial statements, is included in the Fund’s Annual Report, which is available upon request by calling 1-800-915-6566.
For a capital share outstanding throughout each period. Year Ended December 31, 2017 2016 2015 2014 2013 Net asset value, beginning of period $2.51 $3.03 $3.42 $3.99 $2.47 Income from investment operations:
Net investment income (loss) — 0.01 (0.03) (0.04) (0.04) Net realized and unrealized gain (loss) on investments and foreign currency 0.52 (0.53)(3) (0.36) (0.53) 1.55
Total from investment operations 0.52 (0.52) (0.39) (0.57) 1.51 Less distributions:
From net investment income (0.01) — — — — Total distributions (0.01) — — — — Redemption fee proceeds — — — (1) — (1) 0.01 Net asset value, end of period $3.02 $2.51 $3.03 $3.42 $3.99 Total return 20.68% (17.16)% (11.40)% (14.29)% 61.54% Ratios/supplemental data: Net assets, end of period (millions) $10.6 $10.2 $13.6 $15.2 $23.8 Ratio of expenses to average net assets:
Before fees waived/recaptured 2.74% 2.60% 2.31% 2.06% 2.13% After fees waived/recaptured 1.98% 1.99% 1.98% 2.02% 2.00% After fees waived/recaptured excluding interest expense(2) 1.98% 1.98% 1.98% 1.98% 1.98%
Ratio of net investment income (loss) to average net assets:
Before fees waived/recaptured (0.88)% (0.38)% (1.32)% (0.74)% (1.37)% After fees waived/recaptured (0.12)% 0.23% (0.99)% (0.70)% (1.24)%
Portfolio turnover rate 32.45% 63.95% 28.67% 42.27% 60.20%
(1) Amount represents less than $0.01 per share. (2) The Advisor has contractually agreed to limit the operating expenses of the Fund to 1.98%, excluding interest expense, expenses related
to dividends on short positions, brokerage commissions, taxes and other extraordinary expenses. (3) The Advisor reimbursed the Fund $16,892 for a trade error. As of December 31, 2016, the reimbursement amount represents $0.004 per
share.

FINANCIAL HIGHLIGHTS
79
Asia Focus Fund Return to Asia Focus Fund Summary Section
This financial highlights table is intended to help you understand the Asia Focus Fund’s financial performance for the past five years. Certain information reflects financial results for a single share of the Fund. The total returns in the table represent the rate that an investor would have earned or lost on an investment in the Fund assuming reinvestment of all dividends and distributions. The information in the table was audited by Tait, Weller & Baker LLP, whose report, along with the Fund’s financial statements, is included in the Fund’s Annual Report, which is available upon request by calling 1-800-915-6566.
For a capital share outstanding throughout each period. Year Ended December 31, 2017 2016 2015 2014 2013 Net asset value, beginning of period $15.50 $14.40 $16.47 $16.33 $18.56 Income from investment operations:
Net investment income 0.16 0.15 0.21 0.16 0.21 Net realized and unrealized gain (loss) on investments and foreign currency 7.11 1.17 (2.11) 0.15 (2.14)
Total from investment operations 7.27 1.32 (1.90) 0.31 (1.93) Less distributions:
From net investment income (0.20) (0.22) (0.17) (0.17) (0.30) Total distributions (0.20) (0.22) (0.17) (0.17) (0.30) Redemption fee proceeds 0.01 — — (1) — (1) — (1) Net asset value, end of period $22.58 $15.50 $14.40 $16.47 $16.33 Total return 47.10% 9.20% (11.56)% 1.91% (10.38)% Ratios/supplemental data: Net assets, end of period (millions) $20.2 $15.5 $15.3 $19.7 $21.9 Ratio of expenses to average net assets:
Before fees waived 2.22% 2.24% 1.98% 1.91% 1.87% After fees waived 1.98% 1.98% 1.98% 1.91% 1.87% After fees waived excluding interest expense(2) 1.98% 1.98% 1.97% 1.90% 1.85%
Ratio of net investment income to average net assets: Before fees waived 0.60% 0.75% 1.24% 0.90% 0.73% After fees waived 0.84% 1.01% 1.24% 0.90% 0.73%
Portfolio turnover rate 13.24% 38.07% 8.64% 23.16% 7.43% (1) Amount represents less than $0.01 per share. (2) The Advisor has contractually agreed to limit the operating expenses of the Fund to 1.98%, excluding interest expense, expenses related
to dividends on short positions, brokerage commissions, taxes and other extraordinary expenses.

FINANCIAL HIGHLIGHTS
80
Asia Pacific Dividend Builder Fund Return to Asia Pacific Dividend Builder Fund Summary Section
This financial highlights table is intended to help you understand the Asia Pacific Dividend Builder Fund’s financial performance for the past five years. Certain information reflects financial results for a single share of the Fund. The total returns in the table represent the rate that an investor would have earned or lost on an investment in the Fund assuming reinvestment of all dividends and distributions. The information in the table was audited by Tait, Weller & Baker LLP, whose report, along with the Fund’s financial statements, is included in the Fund’s Annual Report, which is available upon request by calling 1-800-915-6566.
For a capital share outstanding throughout each period. Year Ended December 31, 2017 2016 2015 2014 2013 Net asset value, beginning of period $13.43 $12.79 $13.83 $12.95 $13.52 Income from investment operations:
Net investment income 0.40 0.42 0.39 0.31 0.27 Net realized and unrealized gain (loss) on investments and foreign currency 4.47 0.71 (1.01) 0.85 (0.54)
Total from investment operations 4.87 1.13 (0.62) 1.16 (0.27) Less distributions:
From net investment income (0.46) (0.49) (0.42) (0.28) (0.30) Total distributions (0.46) (0.49) (0.42) (0.28) (0.30) Redemption fee proceeds 0.01 — (1) — (1) — (1) — (1) Net asset value, end of period $17.85 $13.43 $12.79 $13.83 $12.95 Total return 36.70% 8.81% (4.61)% 9.04% (2.06)% Ratios/supplemental data: Net assets, end of period (millions) $7.6 $8.5 $7.3 $4.1 $4.3 Ratio of expenses to average net assets:
Before fees waived 3.48% 3.14% 3.87% 3.91% 3.56% After fees waived 1.12% 1.11% 1.98% 1.99% 1.98% After fees waived excluding interest expense(2) 1.10% 1.10% 1.98% 1.98% 1.98%
Ratio of net investment income to average net assets: Before fees waived 1.20% 1.11% 0.36% 0.37% 0.39% After fees waived 2.56% 3.14% 2.25% 2.29% 1.97%
Portfolio turnover rate 47.32% 30.91% 28.59% 15.76% 56.96%
(1) Amount represents less than $0.01 per share. (2) The Advisor has contractually agreed to limit the operating expenses of the Fund to 1.10%, prior to December 31, 2015 the limit on
operating expenses was 1.98%, excluding interest expense, expenses related to dividends on short positions, brokerage commissions, taxes and other extraordinary expenses.

FINANCIAL HIGHLIGHTS
81
China & Hong Kong Fund Return to China & Hong Kong Fund Summary Section
This financial highlights table is intended to help you understand the China & Hong Kong Fund’s financial performance for the past five years. Certain information reflects financial results for a single share of the Fund. The total returns in the table represent the rate that an investor would have earned or lost on an investment in the Fund assuming reinvestment of all dividends and distributions. The information in the table was audited by Tait, Weller & Baker LLP, whose report, along with the Fund’s financial statements, is included in the Fund’s Annual Report, which is available upon request by calling 1-800-915-6566.
For a capital share outstanding throughout each period. Year Ended December 31, 2017 2016 2015 2014 2013 Net asset value, beginning of period $19.09 $19.50 $23.65 $30.86 $29.81 Income from investment operations:
Net investment income 0.29 0.34 0.34 0.48 0.46 Net realized and unrealized gain (loss) on investments and foreign currency 8.95 0.26 (2.11) (1.12) 1.45
Total from investment operations 9.24 0.60 (1.77) (0.64) 1.91 Less distributions:
From net investment income (0.16) (0.27) (0.45) (0.45) (0.43) From net realized gain (1.63) (0.74) (1.94) (6.13) (0.44)
Total distributions (1.79) (1.01) (2.39) (6.58) (0.87) Redemption fee proceeds 0.01 — (1) 0.01 0.01 0.01 Net asset value, end of period $26.55 $19.09 $19.50 $23.65 $30.86 Total return 48.85% 2.95% (7.58)% (1.97)% 6.45% Ratios/supplemental data: Net assets, end of period (millions) $78.2 $58.2 $65.9 $85.6 $109.9 Ratio of expenses to average net assets:
Before fees waived 1.64% 1.66% 1.54% 1.52% 1.53% After fees waived 1.64% 1.66% 1.54% 1.52% 1.53% After fees waived excluding interest expense(2) 1.64% 1.66% 1.53% 1.51% 1.52%
Ratio of net investment income to average net assets: 1.17% 1.70% 1.23% 1.51% 1.27% Portfolio turnover rate 20.78% 28.02% 26.50% 15.11% 6.90% (1) Amount represents less than $0.01 per share. (2) The Advisor has contractually agreed to limit the operating expenses of the Fund to 1.98%, excluding interest expense, expenses related
to dividends on short positions, brokerage commissions, taxes and other extraordinary expenses.

FINANCIAL HIGHLIGHTS
82
Dividend Builder Fund Return to Dividend Builder Fund Summary Section
This financial highlights table is intended to help you understand the Dividend Builder Fund’s financial performance since its commencement of operations. Certain information reflects financial results for a single share of the Fund. The total returns in the table represent the rate that an investor would have earned or lost on an investment in the Fund assuming reinvestment of all dividends and distributions. The information in the table was audited by Tait, Weller & Baker LLP, whose report, along with the Fund’s financial statements, is included in the Fund’s Annual Report, which is available upon request by calling 1-800-915-6566.
For a capital share outstanding throughout the period. Year Ended December 31, 2017 2016 2015 2014 2013 Net asset value, beginning of period $15.28 $14.75 $15.83 $15.64 $12.80 Income from investment operations:
Net investment income 0.41 0.46 0.42 0.52 0.41 Net realized and unrealized gain on investments and foreign currency 2.82 0.54(3) (0.99) 0.26 3.35
Total from investment operations 3.23 1.00 (0.57) 0.78 3.76 Less distributions:
From net investment income (0.42) (0.47) (0.46) (0.47) (0.45) From net realized gain — — (0.05) (0.12) (0.47)
Total distributions (0.42) (0.47) (0.51) (0.59) (0.92) Redemption fee proceeds — — — (1) — (1) — (1) Net asset value, end of period $18.09 $15.28 $14.75 $15.83 $15.64 Total return 21.34% 6.83% (3.61)% 4.99% 29.77% Ratios/supplemental data: Net assets, end of period (millions) $9.0 $7.8 $11.0 $5.2 $3.1 Ratio of expenses to average net assets:
Before fees waived 2.06% 2.11% 1.77% 2.96% 5.47% After fees waived 0.68% 0.70% 0.68% 0.68% 0.68% After fees waived excluding interest expense(2) 0.68% 0.68% 0.68% 0.68% 0.68%
Ratio of net investment income (loss) to average net assets:
Before fees waived /recaptured 1.07% 1.41% 1.76% 1.18% (2.04)% After fees waived/recaptured 2.45% 2.82% 2.86% 3.46% 2.75%
Portfolio turnover rate 18.61% 21.57% 24.94% 7.60% 24.88%
(1) Amount represents less than $0.01 per share. (2) The Advisor has contractually agreed to limit the operating expenses of the Fund to 0.68%, excluding interest expense, expenses related
to dividends on short positions, brokerage commissions, taxes and other extraordinary expenses. (3) An affiliate of the Fund reimbursed the Fund $203.00 for a trade error. As of December 31, 2016, the reimbursement amount represents
$0.000 per share.

FINANCIAL HIGHLIGHTS
83
Global Energy Fund Return to Global Energy Fund Summary Section
This financial highlights table is intended to help you understand the Global Energy Fund’s financial performance for the past five years. Certain information reflects financial results for a single share of the Fund. The total returns in the table represent the rate that an investor would have earned or lost on an investment in the Fund assuming reinvestment of all dividends and distributions. The information in the table was audited by Tait, Weller & Baker LLP, whose report, along with the Fund’s financial statements, is included in the Fund’s Annual Report, which is available upon request by calling 1-800-915-6566.
For a capital share outstanding throughout each period. Year Ended December 31, 2017 2016 2015 2014 2013 Net asset value, beginning of period $23.29 $18.54 $25.73 $32.45 $26.19 Income from investment operations:
Net investment income 0.30 0.26 0.26 0.28 0.18 Net realized and unrealized gain (loss) on investments and foreign currency (0.56) 4.75 (7.20) (6.66) 6.23
Total from investment operations (0.26) 5.01 (6.94) (6.38) 6.41 Less distributions:
From net investment income (0.32) (0.26) (0.25) (0.22) (0.15) From net realized gain — — — (1) (0.13) —
Total distributions (0.32) (0.26) (0.25) (0.35) (0.15) Redemption fee proceeds — — (1) — (1) 0.01 — (1) Net asset value, end of period $22.71 $23.29 $18.54 $25.73 $32.45 Total return (1.06)% 27.04% (26.97)% (19.63)% 24.48% Ratios/supplemental data: Net assets, end of period (millions) $31.8 $49.0 $44.0 $62.9 $72.3 Ratio of expenses to average net assets:
Before fees waived 1.62% 1.53% 1.41% 1.30% 1.35% After fees waived 1.45% 1.45% 1.41% 1.30% 1.35% After fees waived excluding interest expense (2) 1.45% 1.45% 1.41% 1.30% 1.34%
Ratio of net investment income to average net assets: Before fees waived/recaptured 1.01% 1.10% 1.07% 0.76% 0.77% After fees waived/recaptured 1.18% 1.18% 1.07% 0.76% 0.77%
Portfolio turnover rate 6.25% 14.96% 15.70% 39.33% 8.19%
(1) Amount represents less than $0.01 per share. (2) The Advisor has contractually agreed to limit the operating expenses of the Fund to 1.45%, excluding interest expense, expenses related
to dividends on short positions, brokerage commissions, taxes and other extraordinary expenses.

FINANCIAL HIGHLIGHTS
84
Global Innovators Fund – Investor Class Return to Global Innovators Fund Summary Section
This financial highlights table is intended to help you understand the Global Innovators Fund’s financial performance for the past five years. Certain information reflects financial results for a single share of the Fund. The total returns in the table represent the rate that an investor would have earned or lost on an investment in the Fund assuming reinvestment of all dividends and distributions. The information in the table was audited by Tait, Weller & Baker LLP, whose report, along with the Fund’s financial statements, is included in the Fund’s Annual Report, which is available upon request by calling 1-800-915-6566.
For a capital share outstanding throughout each period. Year Ended December 31, 2017 2016 2015 2014 2013 Net asset value, beginning of period $34.15 $31.47 $34.00 $30.65 $21.18 Income from investment operations:
Net investment income 0.09 0.30 0.26 0.28 0.07 Net realized and unrealized gain (loss) on investments 11.76 2.69 (1.28)(3) 3.57 9.52
Total from investment operations 11.85 2.99 (1.02) 3.85 9.59 Less distributions:
From net investment income (0.04) (0.31) (0.24) (0.26) (0.12) From net realized gain (0.98) — (1.27) (0.24) —
Total distributions (1.02) (0.31) (1.51) (0.50) (0.12) Redemption fee proceeds — — — (1) — (1) — (1) Net asset value, end of period $44.98 $34.15 $31.47 $34.00 $30.65 Total return 34.75% 9.51% (3.04)% 12.55% 45.29% Ratios/supplemental data: Net assets, end of period (millions) $185.9 $133.7 $164.9 $157.5 $50.7 Ratio of expenses to average net assets:
Before fees waived/recaptured 1.33% 1.35% 1.27% 1.26% 1.47% After fees waived/recaptured 1.24% 1.24% 1.27% 1.26% 1.47% After fees waived/recaptured excluding interest expense(2) 1.24% 1.24% 1.27% 1.26% 1.46%
Ratio of net investment income to average net assets: Before fees waived/recaptured 0.13% 0.71% 0.69% 1.25% 0.31% After fees waived/recaptured 0.22% 0.82% 0.69% 1.25% 0.31%
Portfolio turnover rate 19.86% 31.25% 37.59% 14.40% 29.63%
(1) Amount represents less than $0.01 per share. (2) The Advisor has contractually agreed to limit the operating expenses of the Fund to 1.24%, prior to December 31, 2015 the limit on
operating expenses was 1.55%, excluding interest expense, expenses related to dividends on short positions, brokerage commissions, taxes and other extraordinary expenses.
(3) The advisor reimbursed the Fund $10,554 for trade errors. As of December 31, 2015, the reimbursement amount represents $0.002 per share.

FINANCIAL HIGHLIGHTS
85
Global Innovators Fund – Institutional Class
For a capital share outstanding throughout each period.
Year Ended December 31, For the
Period Ended December 31,
2015 (1) 2017 2016 Net asset value, beginning of period $34.20 $31.47 $31.47 Income from investment operations:
Net investment income 0.16 0.20 — Net realized and unrealized gain on investments 11.82 2.88 —
Total from investment operations 11.98 3.08 — Less distributions:
From net investment income (0.12) (0.35) — From net realized gain (0.98) — —
Total distributions (1.10) (0.35) — Redemption fee proceeds — — — Net asset value, end of period $45.08 $34.20 $31.47 Total return 35.07% 9.81% 0.00% Ratios/supplemental data: Net assets, end of period (millions) $44.1 $25.7 $0.0 Ratio of expenses to average net assets:
Before fees waived/recaptured 1.17% 1.38% 0.00% After fees waived/recaptured 0.99% 0.99% 0.00% After fees waived/recaptured excluding interest expense(2) 0.99% 0.99% 0.00%
Ratio of net investment income (loss) to average net assets: Before fees waived/recaptured 0.30% 0.68% 0.00% After fees waived/recaptured 0.48% 1.07% 0.00%
Portfolio turnover rate 19.86% 31.25% 0.00%
(1) Commencement of Operations. (2) The Advisor has contractually agreed to limit the operating expenses of the Fund to 0.99%, excluding interest expense, expenses related
to dividends on short positions, brokerage commissions, taxes and other extraordinary expenses.

FINANCIAL HIGHLIGHTS
86
Renminbi Yuan & Bond Fund Return to Renminbi Yuan & Bond Fund Summary Section
This financial highlights table is intended to help you understand the Renminbi Yuan & Bond Fund’s financial performance since its commencement of operations. Certain information reflects financial results for a single share of the Fund. The total returns in the table represent the rate that an investor would have earned or lost on an investment in the Fund assuming reinvestment of all dividends and distributions. The information in the table was audited by Tait, Weller & Baker LLP, whose report, along with the Fund’s financial statements, is included in the Fund’s Annual Report, which is available upon request by calling 1-800-915-6566.
For a capital share outstanding throughout the period. Year Ended December 31, 2017 2016 2015 2014 2013 Net asset value, beginning of period $11.03 $11.63 $12.42 $12.95 $12.71 Income from investment operations:
Net investment income 0.23 0.19 0.63 0.32 0.28 Net realized and unrealized gain on investments and foreign currency 0.85 (0.59) (1.12) (0.44) 0.38
Total from investment operations 1.08 (0.40) (0.49) (0.12) 0.66 Less distributions:
From net investment income (0.09) — (0.27) (0.41) (0.42) Return of capital (0.02) (0.20) (0.03) — —
Total distributions (0.11) (0.20) (0.30) (0.41) (0.42) Redemption fee proceeds — — (1) — (1) — (1) — (1) Net asset value, end of period $12.00 $11.03 $11.63 $12.42 $12.95 Total return 9.79% (3.52)% (4.05)% (0.92)% 5.26% Ratios/supplemental data: Net assets, end of period (millions) $2.6 $2.3 $7.1 $100.6 $94.2 Ratio of expenses to average net assets:
Before fees waived/recaptured 4.17% 4.35% 1.05% 0.95% 0.97% After fees waived/recaptured 0.90% 1.00% 0.93% 0.90% 0.90% After fees waived/recaptured excluding interest expense(2) 0.90% 0.90% 0.90% 0.90% 0.90%
Ratio of net investment income to average net assets: Before fees waived/recaptured (1.33)% (0.71)% 2.68% 2.49% 2.11% After fees waived/recaptured 1.94% 2.64% 2.80% 2.54% 2.18%
Portfolio turnover rate 66.21% 13.00% 15.85% 28.19% 12.32% (1) Amount represents less than $0.01 per share. (2) The Advisor has contractually agreed to limit the operating expenses of the Fund to 0.90%, excluding interest expense, expenses
related to dividends on short positions, brokerage commissions, taxes and other extraordinary expenses.

INDEX DESCRIPTIONS
87
INDEX DESCRIPTIONS The iBoxx Hang Seng Markit Offshore RMB Overall Index is designed to track the performance of the offshore RMB bond market. The Hang Seng Composite Index is a market capitalization weighted index that covers about 95% of the total market capitalization of companies listed on the main board of the Hong Kong Stock Exchange.
The MSCI AC (All Country) Far East ex Japan Index is a free float-adjusted market capitalization weighted index that is designed to measure the equity market performance of the Far East, excluding Japan. As of December 2017, the MSCI AC Far East ex Japan Index consisted of the following 9 developed and emerging market country indices: China, Hong Kong, Indonesia, Korea, Malaysia, Philippines, Singapore, Taiwan, and Thailand.
The MSCI AC (All Country) Pacific ex Japan Index is a free float-adjusted market capitalization weighted index that is designed to measure the equity market performance of the developed and emerging markets in the Pacific region, excluding Japan. As of December 2017, the MSCI AC Pacific Free ex Japan Index consisted of the following 13 developed and emerging market countries: Australia, China, Hong Kong, India, Indonesia, Korea, Malaysia, New Zealand, Pakistan, Philippines, Singapore, Taiwan, and Thailand.
The MSCI World Index is a free float-adjusted market capitalization weighted index that is designed to measure the equity market performance of developed markets. As of December 2017 the MSCI World Index consisted of the following 23 developed market country indices: Australia, Austria, Belgium, Canada, Denmark, Finland, France, Germany, Hong Kong, Ireland, Israel, Italy, Japan, Netherlands, New Zealand, Norway, Portugal, Singapore, Spain, Sweden, Switzerland, the United Kingdom, and the United States.
The MSCI World Energy Index is the Energy sector of the MSCI World Index.
The Nasdaq Composite Index is a market capitalization weighted index that tracks the performance of domestic common stocks traded on the regular Nasdaq market, as well as National Market System-traded foreign common stocks and ADRs.
The RMB Cash Offshore (CNH) is the currency code for renminbi traded outside China in the offshore market.
The RMB Cash Onshore (CNY) is the international currency code for the renminbi.
The Wilderhill Clean Energy Index is a modified equal dollar weighted index comprised of publicly traded companies whose businesses stand to benefit substantially from societal transition toward the use of cleaner energy and conservation.
The Wilderhill New Energy Global Innovation Index is a modified dollar weighted index of publicly traded companies that are active in renewable and low-carbon energy, and that stand to benefit from responses to climate change and energy security concern.
INDEX DESCRIPTIONS
88
Statement of Additional Information. The SAI provides a more complete discussion about the Funds and is
incorporated by reference into this prospectus, which means that it is considered a part of this prospectus. Annual and Semi-Annual Reports. The annual and semi-annual reports to shareholders contain additional
information about each Fund’s investments. In the Funds’ annual report, you will find a discussion of the market conditions and principal investment strategies that significantly affected each Fund’s performance during its last fiscal year.
To Review or Obtain this Information: The SAI and annual and semi-annual reports are available without charge upon your request by sending an e-mail request to [email protected], calling Guinness AtkinsonTM at 1-800-915-6566, visiting the Funds’ website www.gafunds.com or by calling or writing a broker-dealer or other financial intermediary that sells our Funds. To request other information about the Funds and to make shareholder inquiries, please call 1-800-915-6566. This information may be reviewed at the Public Reference Room of the Securities and Exchange Commission in Washington, DC or by visiting the SEC’s website at http://www.sec.gov. In addition, this information may be obtained for a fee by writing or emailing the Public Reference Room of the Securities and Exchange Commission, Washington, DC 20549-1520, e-mail [email protected], or call (202) 551-8090 for information on the operation of the Public Reference Room.
Return to Alternative Energy Fund Summary Section Return to Asia Focus Fund Summary Section
Return to Asia Pacific Dividend Builder Fund Summary Section Return to China & Hong Kong Fund Summary Section
Return to Dividend Builder Fund Summary Section Return to Global Energy Fund Summary Section
Return to Global Innovators Fund Summary Section Return to Renminbi Yuan & Bond Fund Summary Section
Contact Guinness AtkinsonTM Funds Website: www.gafunds.com Email: [email protected] Shareholder Services: 1-800-915-6566 Literature Request: 1-800-915-6565
Investment Company Act file no. 811-08360