prospects for lng imports 07. 23
TRANSCRIPT

chris rumley, marina kim, allison ball, and robert curtotti
december 2007
abare research report 07. 23
abare abar
ein
nova
tion
in e
cono
mic
s
natural gas in india prospects for LNG imports
abareconomics.com

ii
© Commonwealth of Australia 2007
This work is copyright. The Copyright Act 1968 permits fair dealing for study, research, news reporting, criticism or review. Selected passages, tables or diagrams may be reproduced for such purposes provided acknowledgment of the source is included. Major extracts or the entire document may not be reproduced by any process without the written permission of the Executive Director, ABARE.
ISSN 1037-8286ISBN 978-1-921448-07-2
Rumley, C., Kim, M., Ball, A. and Curtotti, R. 2007, Natural Gas in India — Prospects for LNG Imports, ABARE Research Report 07.23 Prepared for the Australian Government Department of Resources, Energy and Tourism, Canberra, December.
Australian Bureau of Agricultural and Resource EconomicsGPO Box 1563 Canberra 2601
Telephone +61 2 6272 2000 Facsimile +61 2 6272 2001Internet abareconomics.com
ABARE is a professionally independent government economic research agency.
ABARE project 3126
iii
natural gas in india » abare research report 07.23
foreword
Consumption of natural gas in India has the potential to rise signifi cantly, on the basis of robust economic growth, an expanding population and recent large domestic gas discoveries. However, realising this potential will depend on addressing several issues, including further deregulation of the gas sector, reforms in gas pricing and in key consumer markets, and the development of further gas infrastructure. These issues are creating signifi cant uncertainties about the prospects for future LNG imports, which play a small but growing role in the domestic gas market.
The objective in this study is to assess the potential growth in natural gas demand in India over the period to 2025 and to consider how such demand might be met. A number of gas supply options are considered, including the delivery of gas from existing and recently discovered domestic gas sources, the commence-ment of pipeline gas imports from Iran, and increased imports of LNG. The study concludes that LNG imports are likely to rise, particularly from the middle of the next decade, but that the share of LNG will be affected by the rate at which other gas supply options are developed.
The study also considers whether India will be able to secure the additional LNG it requires. Existing and planned LNG terminal capacity is expected to be suffi cient to meet India’s gas requirements over the medium to longer term. However, compe-tition from major LNG consuming countries that are willing to pay high prices may be a constraint to India’s ability to secure long term LNG supplies.
Phillip GlydeExecutive Director
December 2007

iv
natural gas in india » abare research report 07.23
acknowledgments
This study was funded by the Australian Government Department of Resources, Energy and Tourism, with assistance from BHP Billiton Petroleum Pty Ltd and Santos Ltd.
The authors wish to thank several colleagues for their valuable contributions throughout the course of the study: in ABARE, Karen Schneider, Terry Sheales, Jane Melanie, Paul Ross, Leanna Tedesco and Andrew Schultz; in the Department of Resources, Energy and Tourism, Geoff Stone and Willie Senanayake; in the Australian High Commission, New Delhi, Victoria Walker.
In addition, the authors gratefully acknowledge the information, insights and comments on a draft report that were provided by BHP Billiton Petroleum Pty Ltd, Chevron Australia Pty Ltd, ExxonMobil Australia Pty Ltd, ConocoPhillips Australia Pty Ltd, North West Shelf Australia LNG Pty Ltd, Santos Ltd, Shell Development (Australia) Pty Ltd and Woodside Energy Ltd.
Many organisations in India also provided valuable information and insights. The authors are grateful for contributions from: The Energy and Resources Institute (TERI), ExxonMobil Gas (India) Private Limited, GAIL (India) Limited, Indian Council of World Affairs, India Energy Forum, Ministry of Petroleum and Natural Gas, National Thermal Power Corporation (NTPC) Limited, Observer Research Foundation, Petro-leum and Natural Gas Regulatory Board, Petronet LNG Limited, Planning Commis-sion of India, PricewaterhouseCoopers Pvt Ltd and Reliance Industries Limited (RIL) .
conversions for natural gas and LNG
billion billion million million trillion cubic metres cubic feet tonnes oil tonnes British NG NG equivalent LNG thermal units
1 billion cubic metres NG 1.00 35.30 0.90 0.73 36.00
1 billion cubic feet NG 0.028 1.00 0.026 0.021 1.03
1 million tonnes oil equivalent 1.111 39.20 1.00 0.805 40.40
1 million tonnes LNG 1.38 48.70 1.23 1.00 52.00
1 trillion British thermal units 0.028 0.98 0.025 0.02 1.00Source: BP (2007).

v
natural gas in india » abare research report 07.23
contentssummary 1
1 introduction 8
2 energy and natural gas in India 11
primary energy consumption 11natural gas consumption 18natural gas supply 23gas pricing 33
3 factors affecting India’s future natural gas demand 38
gas market reform 38end use market reforms 40security of energy supply 45environmental issues 46
4 projecting natural gas demand in India 48
analytical framework 48key assumptions 49outlook for energy consumption, by fuel 52outlook for natural gas demand, by sector 58
5 natural gas supply considerations 61
domestic natural gas production 61cross border pipelines 63existing LNG import contracts 67natural gas supply and demand balance 67LNG import infrastructure 70international LNG outlook 71prospects for Australian LNG 75
6 conclusions 79
references 81

vi
natural gas in india » abare research report 07.23
boxes 1 recent economic performance in India 122 household consumption of noncommercial fuels in India 213 structure of the natural gas sector in India 274 evolution of gas pricing in India 345 alternative projections for India’s energy outlook to 2025 536 coal seam methane potential in India 637 international pipelines and LNG 65
fi guresA natural gas consumption, by sector, 2005 – India 2B natural gas consumption, by sector, reference case – India 4C potential gas demand and supply – India 6
1 total primary energy consumption – India 112 international comparison of primary energy
consumption, 2005 113 GDP and per person income – India 124 distribution of India’s population, 2005 125 foreign direct investment in India 136 structure of the Indian economy 137 international comparison of energy intensity, 2005 148 international comparison of energy consumption per
person, 2005 159 fuel mix in primary energy consumption – India 1610 electricity output, by fuel – India 1711 annual growth in electricity generation, by fuel,
1990–2005 – India 1812 natural gas consumption, by end use – India 1913 energy consumption in key sectors, by fuel – India 2014 energy consumption in the residential sector, by fuel – India 2115 natural gas supply – India 2516 LNG imports, by source – India 2617 natural gas sector structure – India 2718 gas pricing reform direction – India 35

vii
natural gas in india » abare research report 07.23
19 trends in population growth – India 5020 assumed fuel mix in electricity generation, reference case
– India 5121 fuel mix in electricity generation, 2025 – India 5322 comparison of energy consumption growth projections,
2005–25 – India 5423 comparison of natural gas demand projections,
2025 – India 5424 total primary energy consumption, by fuel – India 5625 projected average annual growth in energy consumption,
2005–25 – India 5626 fuel mix in total primary energy consumption – India 5727 projected electricity generation, by fuel – India 5828 natural gas consumption, by sector – India 5929 distribution of population between urban and rural areas
– India 6030 natural gas production scenarios – India 6231 potential gas demand and supply – India 6832 potential LNG imports – India 6933 world LNG trade 7134 Australian gas production and LNG exports 7735 Australian LNG exports, by destination 7736 outlook for LNG capacity in Australia 77
maps1 natural gas reserves – India 242 natural gas infrastructure – India 333 proposed international pipeline routes serving India 654 Australia’s natural gas reserves and infrastructure 76

viii
natural gas in india » abare research report 07.23
tablesA India’s total primary energy consumption, 2005 2B India’s LNG imports, by source, 2006 4C potential gas demand and supply balance – India 7
1 major energy and economic indicators – India 152 total primary energy consumption – India 163 installed electricity generation capacity, 2004-05 – India 174 natural gas consumption, by end use – India 185 city gas consumer base – India 226 distribution and consumption of compressed natural gas
in India, 2005-06 237 natural gas production – India 258 existing LNG terminals – India 299 changes in natural gas prices, by sector – India 3610 regions and sectors in GTEM in this study 4911 GDP and population assumptions – India 5012 growth in India’s GDP and primary energy consumption 5513 potential international gas pipeline projects – India 6714 potential gas demand and supply balance – India 6815 LNG terminals in India 7016 existing LNG plants – Asia Pacifi c market 7217 LNG plants under construction and planned
– Asia Pacifi c market 74

1
natural gas in india » abare research report 07.23
summary
» Since the discovery of large gas reserves off the west coast of India in the 1970s, natural gas has played an increasingly important role in meeting India’s growing energy demand. This trend is expected to continue, with forecast strong growth in natural gas demand over the period to 2025. Until recently, India relied on state controlled domestic production to meet its natural gas requirements. However, with mature domestic gas fi elds facing a decline in production, India is embracing the need for increased private sector partici-pation in the gas supply chain.
» Following the commissioning of India’s fi rst LNG (liquefi ed natural gas) import terminal in 2004, LNG imports rose to 6.2 million tonnes in 2006, just under a quarter of India’s natural gas consumption. LNG imports will continue to play an important role in supplying India’s demand for natural gas.
» The outlook is for increasing natural gas demand in India, given an expected combination of high economic growth, an expanding population and recent large domestic gas fi nds. However, realising this potential depends on addressing several major issues, including further deregulation of the gas sector, reforms in gas pricing and key consumer markets, such as electricity generation and fertiliser production, and the development of a national gas grid linking gas sources with geographically dispersed demand centres. These issues, particularly uncertainties about the prospects for domestic gas produc-tion and pricing, are creating some uncertainty over the outlook for LNG imports and future LNG procurement.
» While there are ambitious LNG import plans in India, this is not likely to translate into a signifi cant increase in LNG imports in the short to medium term. Pipeline natural gas imports could also provide an additional source of gas supply over the longer term, although these projects face signifi cant obstacles.
energy and natural gas consumption in India» Energy consumption in India has increased by almost 5 per cent a year since
1990, driven by rapid growth in economic output and population, and rising personal incomes. Total primary energy consumption (excluding noncommer-cial fuels, referred to as combustible renewables and waste) reached 379

2
natural gas in india » abare research report 07.23
million tonnes of oil equivalent (Mtoe) in 2005, compared with 186 million tonnes of oil equivalent in 1990. Coal is the main source of energy in India, accounting for 55 per cent of primary energy consumption in 2005, followed by oil, natural gas, renewable energy and nuclear power (table A).
» Natural gas use in India has grown at an average rate of more than 7 per cent a year since 1990, albeit from a small base. It accounted for 8 per cent of primary energy consumption in 2005. This rapid growth has been driven by government poli-cies to encourage natural gas use, including gas allocations to priority sectors such as electricity and fertilisers at subsidised prices, and expansions in gas infrastructure. In 2005, natural gas consumption in India was 32 billion cubic metres (equivalent to 23.4 million tonnes of LNG). Consumption, however, has been constrained by natural gas availability and, as such, does not refl ect the true potential for natural gas demand in the country.
» The electricity and fertiliser sectors are the main consumers of natural gas in India, partly subsidised by the government. These sectors, including captive electricity generation, accounted for 70 per cent of India’s natural gas consumption in 2005 (fi gure A; IEA 2007a).
» The use of LNG has been growing rapidly since its introduction to the Indian gas market in 2004. India currently has two operational LNG terminals on the west coast — Dahej and Hazira — with a combined capacity of 8.9 million tonnes. The Dahej terminal is supplied from Ras Gas in Qatar under a long term contract, supplemented by spot cargoes from other
table A India’s total primary energy consumption, 2005
consumption share Mtoe %
coal 208.0 54.9oil 128.6 33.9natural gas 28.8 7.6nuclear 4.5 1.2renewables a 9.1 2.4
total 379.0 100.0a Includes hydro/solar/wind/other; excludes combus-tible renewables and waste.Source: IEA (2007a).
other 3%residential 2%
other industries 25%
fertiliser 26%
electricity 44%
2005
natural gas consumption, by sectorfig AIndia

3
natural gas in india » abare research report 07.23
sources, while the Hazira terminal imports spot LNG cargoes as required (table B). India’s third LNG terminal, Dabhol in the south west, with an annual capacity of 5 million tonnes, is expected to be commissioned toward 2009.
factors affecting India’s future natural gas demand» A range of factors will affect the extent and profi le of India’s future natural gas
demand, including the development of a national gas pipeline network and the implementation of energy market and broader economic reforms. One of the most important factors will be the continuing deregulation of the domestic gas market. The government has made signifi cant progress in developing a regulatory framework to facilitate open access to the pipeline network and to promote public and private investment in gas pipeline infrastructure. The establishment of an independent regulator to monitor pipeline access and gas transport tariffs is expected to facilitate the development of a market based regime in India’s natural gas sector.
» The continuing transition from state administered, subsidised gas pricing toward market pricing is also a key factor in improving the overall availability of natural gas in India and will affect gas demand over the outlook period. The complex mix of administered and market gas prices that vary across consumer segments reduces incentive to invest in the expansion of domestic gas production and LNG imports.
» The reform processes in key end use markets, such as electricity and fertilisers, are also likely to have a direct impact on future gas demand in India. Recent policy initiatives in the fertiliser industry seek to convert the majority of nitrog-enous fertiliser production in India to natural gas. Electricity market reform, including government plans for substantial generation capacity augmentation, is likely to provide incentives for new investment in gas fi red power plants. The extent of natural gas use in electricity generation, as well as in fertiliser produc-tion, will depend to a large extent on gas availability and pricing.
projecting natural gas demand in India» The analysis of the potential demand for natural gas in India over the period
to 2025 presented in this report is based on results from ABARE’s global trade and environment model (GTEM). The projections of energy demand are based on an assumption that India’s GDP will grow at an average annual rate of 6.5 per cent over the period 2005–25 in the ‘reference case’. In an

4
natural gas in india » abare research report 07.23
alternative ‘high growth’ scenario, GDP growth is assumed to average 9.0 per cent a year over the same period, supported by higher levels of economic reform and productivity growth than in the reference case. This higher rate of GDP growth is consistent with the upper range of Indian Government projections.
» The projections are also based on assumptions relating to the fuel mix in electricity generation. In India there is considerable uncertainty about the expected fuel mix over the period to 2025. This is refl ected in the wide range of alterna-tive projections from Indian and international sources. In this study, the share of natural gas in electricity generation is assumed to be 7 per cent in 2025, around 2 percentage points lower than in 2005. This refl ects an assumed continued expansion in nuclear and coal fi red electricity generation over the projection period (IEA 2006a).
» On the basis of these assumptions, total primary energy consumption in India is projected to expand by 4 per cent a year to reach 837 million tonnes of oil equivalent in 2025. Natural gas consumption is projected to grow by 5 per cent a year between 2005 and 2025 to reach 74 million tonnes of oil equiva-lent in the reference case in 2025 (equivalent to 82 billion cubic metres and 60 million tonnes of LNG) (fi gure B). In the high growth scenario, gas consumption is projected to reach 89 million tonnes of oil equivalent in 2025 (equivalent to 99 billion cubic metres and 72 million tonnes of LNG). Driving this growth will be increases in demand in the fertilisers and other industrial sectors. This growth, however, will be dependent on the development of natural gas infrastructure, including transmission networks, and new sources of supply.
table B India’s LNG imports, by source, 2006
imports share Mt %
Qatar 5.19 84.3Egypt 0.42 6.8Oman 0.19 3.1Australia 0.12 1.9Abu Dhabi 0.06 1.0Malaysia 0.06 1.0Algeria 0.06 1.0Trinidad 0.06 1.0
total 6.16 100.0Source: FGE (2007a).
20
10
30
bm3
India
200520152025
residentialother industry
fertiliserelectricity
natural gas consumption, by sector, reference casefig B

5
natural gas in india » abare research report 07.23
natural gas supply considerations» India has three options to meet the anticipated growth in natural gas demand
over the period to 2025 — increase domestic gas production; increase LNG imports; and import natural gas via pipeline.
» It is assumed that there is a continued decline in production from existing mature domestic gas fi elds. However, the rate of this decline is expected to be slowed by the production of gas from recently discovered fi elds in the offshore Krishna Godavari (KG) basin from late 2008. While this and other new natural gas discoveries have the potential to expand domestic output signifi -cantly, the production timetables of these fi elds remain highly uncertain.
» Over the longer term, there is potential to develop pipeline natural gas imports. Several international pipelines have been under discussion in India for many years, including from Iran, Turkmenistan and Myanmar. Only the Iran–Pakistan–India pipeline project is considered to have potential as a source of supply to India over the period to 2025. Given the uncertainties that surround the supply of pipeline gas from Iran, a possible startup date is assumed to be after 2020.
» India’s decision to import pipeline gas will depend signifi cantly on geopolitical and energy security issues but the competitiveness of pipeline gas with other sources of gas will also play an important role. Distance and volume are key variables that affect the unit cost of transporting LNG and pipeline gas. While transporting natural gas via pipeline can be more cost effective than transporting LNG in some cases, the political risks associated with transiting through other countries can increase the costs of pipeline projects. In contrast, the fl exibility of LNG supply can largely avoid geopolitical sensitivities and may address some of the energy security concerns of gas importing countries.
indicative gas supply and demand balance» A potential natural gas supply and demand balance for India is provided in
fi gure C and table C, based on demand projections and current and expected gas supply. This balance assumes that production from gas fi elds in the KG basin would add supply of around 14.6 billion cubic metres a year to existing domestic production, starting from late 2008. Production from fi elds operational as at June 2007 is assumed to gradually decline over the outlook period. It is also assumed that the supply of LNG under long term contract with Qatar reaches 7.5 million tonnes a year (10.4 billion cubic metres) from 2009 and that an international pipeline from Iran could add 37 billion cubic metres a year after 2020.

6
natural gas in india » abare research report 07.23
» Based on these assumptions, it is expected that around 4.0 billion cubic metres (2.9 million tonnes) of additional gas will need to be procured by 2015. Additional gas requirements are projected to expand to 18.6 billion cubic metres (13.6 million tonnes) in 2020, and 31.6 billion cubic metres (23.1 million tonnes) in 2025. Assuming that this additional gas will be sourced from LNG, India’s total LNG imports are projected to reach 10.5 million tonnes in 2015 and 21.1 million tonnes in 2020. The introduction of imported pipeline gas from Iran by 2025 could meet the requirement in that year. However, if the pipeline does not proceed, India’s total LNG imports would be 30.6 million tonnes in 2025.
» In the high growth scenario, additional gas requirements are projected to be 6.9 billion cubic metres (5.1 million tonnes) in 2015 and 27.1 billion cubic metres (19.8 million tonnes) in 2020. Signifi cant additional gas is still required in 2025 even if the pipeline from Iran eventuates. This implies that India’s total LNG imports in the high growth scenario would be 12.6 million tonnes in 2015 and 27.3 million tonnes in 2020. If the pipeline from Iran does not proceed by 2025, total LNG imports would be 42.7 million tonnes in 2025.
» While existing and planned LNG terminal capacity should be adequate to meet India’s LNG requirements over the medium to longer term, sourcing the additional gas and uncertainty about domestic and imported gas timetables
60
40
20
80
60
40
20
80
bm3 bm3
India
reference case high growth case
2025Iran
pipeline
2025no Iran pipeline
202020152005 2025Iran
pipeline
2025no Iran pipeline
202020152005
pipeline gas from Irangas supply shortfall/additional LNG
actual gas consumptiondomestic gas supply contracted LNG supply
potential gas demand and supplyfig C

7
natural gas in india » abare research report 07.23
are likely to provide a challenge for India in the coming years. It also suggests that new long term LNG supply contracts will be required to meet demand.
» There are currently a number of LNG supply projects in the Asia Pacifi c region, both existing and planned, that have the capacity to meet India’s long term gas requirements. However, the current world LNG market is characterised by a tight supply–demand situation. Hence, competition from major LNG importing countries that are willing to pay high prices may be a constraint to India securing long term LNG supplies.
» Over the period to 2025 there is the potential for Australia to become a more signifi cant supplier of LNG, including to India. A number of LNG projects currently under construction or in the planning stage could add substantial capacity to Australia’s LNG export infrastructure. Other areas of potential future cooperation between Australia and India include research and develop-ment and the transfer of technology (for example, in the development of coal seam methane resources) and investment in upstream and downstream gas sectors in each country.
table C potential gas demand and supply balance – India
2015 2020 2025 2015 2020 2025 billion m3 billion m3 billion m3 Mt Mt Mt
assumed natural gas supplycontracted LNG supply 10.4 10.4 10.4 7.5 7.5 7.5domestic gas supply 43.1 40.6 40.5 31.5 29.6 29.6pipeline gas from Iran 0 0 37.0 0 0 27.0total 53.4 51.0 87.8 39.0 37.2 64.1
projected natural gas consumption – reference case 57.4 69.5 82.4 41.9 50.8 60.2– high growth scenario 60.4 78.1 99.0 44.1 57.0 72.3
gas supply shortfall/possible additional LNG – including pipeline gas from Iran– reference case 4.0 18.6 – 2.9 13.6 –– high growth scenario 6.9 27.1 11.2 5.1 19.8 8.2
gas supply shortfall/possible additional LNG – excluding pipeline gas from Iran– reference case 4.0 18.6 31.6 2.9 13.6 23.1– high growth scenario 6.9 27.1 48.2 5.1 19.8 35.2
total LNG imports – excluding pipeline gas from Iran– reference case 14.4 28.9 41.9 10.5 21.1 30.6 – high growth scenario 17.3 37.4 58.5 12.6 27.3 42.7

8
introduction
India’s economy has undergone signifi cant transformation since a range of struc-tural reforms were undertaken in the 1990s. These reforms included opening the economy to more international trade and investment, abolishing industrial licensing, fl oating the exchange rate, and increasing domestic and foreign private partici-pation in fi nancial markets. The reform process has stimulated strong economic growth in India, with gross domestic product (GDP) expanding at an average rate of 6.1 per cent a year between 1990 and 2006. As a result, India now has the world’s third largest economy (on a purchasing power parity basis).
The expansion in economic output, supported by a large and growing population, has led to a strong rise in energy consumption in India. Primary energy consump-tion (excluding combustible renewables and waste) has increased at an average annual rate of nearly 5.0 per cent since 1990, and India now ranks fi fth in the world in terms of energy consumption. However, unlike many other countries in Asia that have had sustained periods of high economic growth, including China, much of India’s growth has been led by the services sector. This sector is less energy intensive than the industry sector and has moderated the rate of growth in India’s energy requirements. Even so, because of India’s sheer size, the actual expansion in energy consumption has been signifi cant.
India’s energy mix is currently dominated by coal and oil, although the role of natural gas has been increasing. Natural gas consumption grew by 7.4 per cent a year between 1990 and 2005 and accounted for nearly 8 per cent of primary energy consumption in 2005. The main natural gas consumers in India are the electricity generation and fertiliser industries, which account for more than two-thirds of natural gas use. The consumption of natural gas in other industries and in households is relatively small, although growing rapidly.
While demand for natural gas in India is strong, actual consumption has been constrained by the availability of natural gas supplies. India has relatively large natural gas reserves and prospects for further discoveries are good. However, the natural gas market has been dominated by government owned companies selling gas at heavily subsidised prices, reducing incentives for private investment in production facilities. Production of gas from mature domestic fi elds is dwindling, and has resulted in the Indian Government restricting gas supplies to mainly the
1

9
natural gas in india » abare research report 07.23
priority sectors. However, private sector participation in India’s gas market is increasing, which should lead to an increase in domestic gas production. Gas sold privately is based on market prices, creating a complex domestic gas pricing system.
Imports of liquefi ed natural gas (LNG) to India commenced in 2004, after more than a decade of planning. In 2005, LNG imports accounted for around a fi fth of natural gas consumption in India. Two LNG import terminals are operational on the west coast of India, and a third is near completion, although imports are still well under capacity. To date, LNG imports have mainly been sourced from Qatar under a long term contract. But with high natural gas demand, India has also imported a number of spot cargoes of LNG, including from Australia. In 2006, India accounted for 6 per cent of Asia’s total LNG imports.
Natural gas demand is expected to continue to grow strongly in India, fuelled mainly by continued economic and population growth and hence growing demand for electricity. Continued switching to natural gas by fertiliser plants will also be a key driver of demand, particularly given the high price of alternative oil based feedstock. Realising this potential growth will depend on the availability and competitiveness of natural gas supplies, both domestic and imports, and the rate of development of gas infrastructure. Other factors likely to affect the outlook for natural gas demand include the pace of market oriented reforms in gas, elec-tricity and fertiliser markets, including in gas pricing, and an increasing emphasis on energy security and environmental concerns.
There are plans to expand LNG import infrastructure signifi cantly in India, although there is considerable uncertainty about the likely size of India’s future LNG market. The availability and competitiveness of other gas supplies and other fuels and the development of infrastructure will govern the penetration of LNG in India, as will developments in international LNG markets. In the next few years, the outlook for the supply–demand balance in the international LNG market is expected to become increasingly tight, in which case India would need to be willing to pay higher prices to secure additional LNG cargoes. Over the longer term, there is suffi cient potential in the Middle East and the Asia Pacifi c, including in Australia, to supply LNG to India, although many potential projects will require a commitment to long term contracts from buyers to underpin their development.
Natural gas imports via pipeline could also provide an additional source of supply to the Indian market over the longer term. Several options have been under consid-eration for some time, including from Iran. In addition to cost effectiveness, these

10
natural gas in india » abare research report 07.23
projects will have to overcome signifi cant geopolitical issues and the associated development risks that have stalled their development to date.
The key objective in this study is to assess the potential growth in natural gas demand in India and, in particular, the role that LNG could play in that market. A range of projections of energy and natural gas demand in India are presented, refl ecting the uncertainty surrounding prospects for India’s gas market. As well as economic and population growth, other factors that could infl uence the outlook for natural gas in India are examined, including further reforms in gas and end user markets and environmental and energy security policies.
Potential sources of natural gas supply are also assessed, including the capacity to expand domestic gas production, options for natural gas imports by pipeline, and the scope for increasing LNG imports. An update of recent developments in international LNG markets, including the potential for Australia to supply LNG to India, is also provided.

11
energy and natural gas in India
primary energy consumption Primary energy consumption in India has grown rapidly since 1990, at an average rate of 4.8 per cent a year. (The focus in this study is commercial fuels. Unless otherwise noted, references to energy consumption exclude noncommercial fuels, principally combustible renewables and waste.) In 2005, primary energy consumption was 379 million tonnes of oil equivalent, compared with 186 million tonnes of oil equivalent in 1990 (fi gure 1; IEA 2007a). India was the world’s fi fth largest energy user in 2005, behind the United States, China, the Russian Federation and Japan (fi gure 2; IEA 2007a,b).
Driving the growth in energy consumption has been India’s increasing population and strong economic performance. Together these factors have underpinned rising personal incomes and increasing urbanisation. GDP in India grew at an average annual rate of 6.1 per cent between 1990 and 2006, following the implementation of reforms in the early 1990s (box 1).
2
300
100
200
Mtoe
1990 1995 20052000
renewablesnucleargas
oil
coal
total primary energy consumption Indiafig 1
2000
1000
500
1500
MtoeAustraliaIndiaJapanRussian
FederationChinaUnited
States
international comparison of primary energy consumption, 2005fig 2

12
natural gas in india » abare research report 07.23
box 1 recent economic performance in India
The Indian economy has grown strongly since the early 1990s. The strengthening of economic activity has been underpinned by broad based structural reforms imple-mented in 1991. These included liberalisation of tax and tariff policies, the opening of fi fteen industries that had previously been restricted to the public sector, liber-alisation of parts of the fi nancial sector, and an easing of foreign direct investment
restrictions.
Average annual growth in the Indian economy between 1990 and 2004 was around 5.7 per cent. In the three years since then, GDP growth has increased even further, to average 8.9 per cent a year (fi gure 3; IMF 2007a). Higher growth rates have led to strong increases in per person incomes and signifi cant falls in the proportion of the population living in poverty. In addition, there has been steady growth in the share of the population living in urban areas (fi gure 4; World Bank 2007). India’s infl ation performance has also improved, despite sustained capital infl ows and continued increases in fuel prices.
Although India has had several governments since the program of reforms began, each government has made growth and reform a focus of its economic agenda. This continued commitment to reform has encour-aged both Indian and foreign busi-nesses to substantially increase their investment in the economy. From
4000
2000
1000
3000
US$PPP
1992 200720021997
%
2
4
6
8
annual GDP growthGDPper
person
GDP and per person incomeIndia
fig 3
1000
600
400
200
800
million
rural populationurban population
1990 1995 20052000
distribution of India’s population, 2005fig 4
continued...

13
natural gas in india » abare research report 07.23
box 1 recent economic performance in India continued
1992-93 to 2006-07 investment spending grew from 1.8 trillion Indian rupees (US$42.8 billion) to 12.2 trillion Indian rupees (US$182.8 billion) (IMF 2007b). Although the share of foreign direct investment is still low relative to the size of India’s economy, in real terms it has increased by around 27 per cent a year to reach more than US$15.7 billion in 2006-07 (fi gure 5; Ministry of Commerce and Industry 2007).
The services sector has been the main driver of economic growth in India, accounting for more than half of economic output in 2005 and contrib-uting almost three-quarters to overall growth over the period 1990–2005 (fi gure 6; ADB 2006). The growth in the services sector is mainly due to its lower reliance on India’s weak infra-structure (for example, electricity and transport) and its ability to benefi t from technological changes, particularly IT.
After an initial decline in the post-reform period, the industry sector has begun a gradual recovery, supported by growth in both domestic and export demand. The manufacturing sector, in particular, has benefi ted from licensing and trade reforms. Although the share of agriculture in the economy fell from 31 per cent in 1990 to 19 per cent in 2005, the sector provides employment for more than 60 per cent of the workforce. Lifting the growth rate in the agriculture sector is one of the major challenges faced by the Indian Government in ensuring an ongoing reduction in poverty.
2006-07US$b
1994-95
1998-99
2006-07
2002-03
8
4
12
foreign direct investment in India fig 5
services 41%
industry 28%
agriculture 31%
services 54%
industry 27%
agriculture 19%
1990
2005
structure of the Indian economyfig 6

14
natural gas in india » abare research report 07.23
India’s energy intensity, or energy consumption per unit of economic output, declined by 15 per cent between 1990 and 2005, as the services sector, which is less energy intensive than the industry sector, continued to expand its share of the economy (table 1). The current level of energy intensity in India, at 0.1 tonnes of oil equivalent per US$1000, is low relative to other major energy consuming econo-
mies (fi gure 7; IEA 2007a,b).
Energy consumption per person has risen by more than 58 per cent since 1990 to 0.35 tonnes of oil equivalent in 2005. India’s popula-tion expanded by almost a third over the same period, to reach 1.1 billion in 2005 as a result of a historically high fertility rate and a declining mortality rate. Energy consumption per person in India is one of the lowest in the world and is signifi cantly lower than in other major energy consuming countries (fi gure 8; IEA 2007a,b).
0.4
0.2
0.1
0.3
Australia IndiaJapanRussian Federation
ChinaUnited States
toe/2000US$'000
international comparison of energy intensity, 2005fig 7
box 1 recent economic performance in India continued
To sustain high rates of economic growth, India needs to undertake further structural reforms, particularly those leading to improvement in the state of its physical infra-structure, notably roads, ports and electricity. Recognising that infrastructure defi cit is a major barrier to India’s long term growth potential, the government is working to address regulatory and investment issues in order to attract foreign investment into the sector. Another key challenge is to improve education and labour policies to take advantage of India’s imminent demographic dividend — the expansion in the working age population that has the potential to create growth in both the supply of labour and domestic saving. Ongoing effort to continue fi scal consolidation, agricul-tural and trade liberalisation, and reforms in the areas of energy, environment, health and welfare is also required.
Sources: Reserve Bank of India (2007); McKinsey and Co (2007).

15
natural gas in india » abare research report 07.23
fuel mix in primary energy consumption
Coal accounts for the largest share of primary energy consumption in India, at 55 per cent in 2005 (fi gure 9; IEA 2007a). Strong economic growth has led to an increase in coal use in the past few years. Demand for coal grew at an average rate of 4.6 per cent a year from 1990 to 2005 reaching 208 million tonnes of oil equivalent in that year (table 2). India has large reserves of coal, which is its most abundant domestic energy source. The country is the world’s third largest coal producer and consumer after China and the United States (MoC 2006).
Oil is also an important energy source in India, accounting for 34 per cent of primary energy consumption in 2005. Oil consumption grew at an average rate of 4.9 per cent a year between 1990 and 2005 and its share of primary energy consumption remained largely unchanged. The combination of rising oil consump-tion and fairly stable production has left India increasingly dependent on imports.
table 1 major energy and economic indicators – India
annual growth
1990 2000 1990 2000 2005 –2000 –2005 % %
energy consumption a Mtoe 186.3 310.7 379.0 5.2 4.1GDP b US$b 1 406.3 2 402.1 3 362.1 5.5 7.0GDP per person b US$ 1 655.4 2 364.4 3071.5 3.6 5.4population million 849.5 1 015.9 1 094.6 1.8 1.5energy intensity a b toe/US$’000 0.13 0.13 0.11 –0.2 –2.7energy consumption per person a toe 0.22 0.31 0.35 3.4 2.5a Excludes combustible renewables and waste. b In 2000 US dollars on a purchasing power parity basis.Source: IEA (2007a).
6
4
2
Australia IndiaJapanRussian Federation
ChinaUnited States
toe
international comparison of energy consumption per person, 2005fig 8

16
natural gas in india » abare research report 07.23
India’s oil import dependency (imports as a share of consump-tion) increased from 48 per cent in 1990 to 88 per cent in 2005 (IEA 2007a), giving rise to concerns over energy security.
India’s consumption of natural gas rose at an average rate of 7.4 per cent a year from 1990 to 2005, reaching 29 million tonnes of oil equivalent (equivalent to 32 billion cubic metres of gas or 23 million tonnes of LNG) in 2005. This rapid growth, albeit from a small
base, is a result of the increasing importance of natural gas as a fuel in electricity generation, and the production of fertiliser and steel. Until 2004 when LNG imports commenced, natural gas consumption was met entirely from domestic production.
Renewable energy, including hydropower, contributes only a small part of India’s primary energy consumption, at 2 per cent in 2005. Supportive government programs providing subsidies and tax and fi nancial incentives seek to increase the use of renewable energy as a means of achieving a cleaner fuel mix and meeting energy security objectives. Although use of nuclear power has grown steadily, it accounted for only 1 per cent of total primary energy consumption in 2005. The pace of nuclear power development has been constrained by modest domestic uranium resources.
renewablesnucleargasoilcoal
%
1990 1995 20052000
40
20
80
60
fuel mix in primary energy consumption Indiafig 9
table 2 total primary energy consumption – India
1990 2000 2005
Mtoe % Mtoe % Mtoe %coal 106.1 56.9 164.3 52.9 208.0 54.9oil 62.6 33.6 114.4 36.9 128.6 33.9natural gas 9.8 5.3 21.0 6.8 28.8 7.6nuclear 1.6 0.9 4.4 1.4 4.5 1.2renewables a 6.2 3.3 6.5 2.1 9.1 2.4
total 186.3 100.0 310.7 100.0 379.0 100.0a Includes hydro/solar/wind/other. Excludes combustible renewables and waste.Source: IEA (2007a).

17
natural gas in india » abare research report 07.23
electricity generation
Electricity consumption in India grew more rapidly than overall energy use in the period 1990–2005, at 6.1 per cent a year, to reach 699 terawatt hours in 2005. The largest electricity consumers in India are the industry sector, accounting for nearly half of electricity use in 2005, and the residential and services sectors at 22 per cent and 20 per cent respectively (IEA 2007a). Electricity generation is dominated by state owned utilities, which account for almost 90 per cent of India’s total installed capacity. However, the share of private sector generators is growing, particularly in captive or own use electricity genera-tion.
Electricity generated from coal is the largest source of electricity genera-tion in India, at 69 per cent in 2005 (fi gure 10; IEA 2007a). Current coal fi red power plant capacity repre-sents more than half of total electricity generation capacity in the country. The share of hydroelectricity, the next largest source of electricity generation in India, has declined from 25 per cent in 1990 to 14 per cent in 2005, as the growth in thermal generating capacity has outstripped that of hydro (table 3).
Natural gas represented nearly 9 per cent of electricity generation in 2005, compared with 3 per cent in 1990 and was the fastest growing thermal fuel (fi gure 11; IEA 2007a). It is being used in gas turbine and combined cycle gas power plants, which currently account for more than 10 per cent of India’s elec-tricity generation capacity. Oil fi red elec-tricity generation accounted for 4.5 per cent, while nuclear power accounted for 2.5 per cent in 2005. Electricity genera-tion from renewables other than hydro accounted for around 1 per cent of total generation in 2005.
table 3 installed electricity generation capacity, 2004-05 – India
capacity share GW %
coal 67.8 57.2oil 1.2 1.0natural gas 11.9 10.1nuclear 2.8 2.3hydro 30.9 26.1other renewables 3.8 3.2
total 118.4 100.0Source: CEA (2006a).
%
1990 20052000
40
20
80
60
hydro + otherrenewablesnucleargasoilcoal
electricity output, by fuelIndia
fig 10

18
natural gas in india » abare research report 07.23
natural gas consumptionAs discussed above, natural gas consumption in India has grown steadily over recent years, at an average rate of more than 7 per cent a year since 1990. In 2005, consumption of natural gas by end use sectors was 32.0 billion cubic metres (equivalent to 23.4 million tonnes of LNG), compared with 10.9 billion cubic metres (7.9 million tonnes) in 1990 (table 4). These consumption levels do not, however, refl ect the underlying demand for natural gas in India over this period as consumption has been limited by natural gas supplies.
Until recently, all natural gas produced in India was subject to allocation by the Ministry of Petroleum and Natural Gas, on the recommendation of the intermin-
isterial Gas Linkage Committee. Natural gas allocations were based on sectoral priorities, gas availability and potential gas markets in particular regions. At present, a large proportion of natural gas continues to be allo-cated to priority consumers such as the electricity generation and ferti-liser sectors, while the remaining quantity is traded directly between buyers and sellers.
30 40% 10 20
other renewables
natural gas
oil
nuclear
coal
hydro
annual growth in electricity generation, by fuel, 1990–2005 Indiafig 11
table 4 natural gas consumption by end use – India
1990 2000 2005 billion m3 billion m3 billion m3
electricity 3.8 10.3 14.2fertiliser 5.9 9.8 8.3other industries 1.1 2.7 8.0residential 0.0 0.3 0.7other 0.1 0.2 0.9
total 10.9 23.3 32.0– LNG equivalent (million tonnes) 8.0 17.0 23.4Source: IEA (2007a).

19
natural gas in india » abare research report 07.23
gas consumption, by sector
Electricity generation currently accounts for almost half of India’s natural gas consumption. Natural gas use by electricity utilities grew at an average rate of over 9 per cent a year, from 3.8 billion cubic metres in 1990 to 14.2 billion cubic metres in 2005 (table 4 and fi gure 12; IEA 2007a).
Existing gas fi red power plants in India require more than 19 billion cubic metres of natural gas a year to operate at full capacity. However, as a result of diffi culties in securing natural gas supply, gas fi red power plants have been running at less than full capacity, switching to higher cost liquid fuels such as naphtha where feasible.
The fertiliser sector is the second largest consumer of natural gas in India, accounting for around a quarter of natural gas consumption in 2005. Demand for natural gas from the fertiliser industry grew at an average annual rate of 2 per cent from 1990, to reach 8.3 billion cubic metres in 2005 (IEA 2007a). The expansion in the use of natural gas by the fertiliser industry refl ects the high priority placed by the government on boosting agricultural production through greater fertiliser use.
India currently produces nitrogenous (mainly urea) and phosphatic fertilisers, with natural gas used as a feedstock in urea production. During 2004-05, natural gas based fertiliser production accounted for 66 per cent of total fertiliser production. Production based on naphtha, fuel oil and low sulfur heavy stock (a residual fuel processed from crude oil that can be used in the place of fuel oil) constituted the remaining 34 per cent (MoPNG 2006a). Gas prices for both electricity generation and fertiliser production are partly subsidised by the government.
Other industrial users, including iron and steel, glass, ceramic and elec-tronics manufacturers are rapidly increasing their share of natural gas consumption. Gas consumption in the industry sector has grown at an average rate of 14 per cent a year, from 1.1 billion cubic metres in 1990 to 8.0 billion cubic metres in 2005. There has been substitution away
30
10
20
25
5
15
billionm3
1990 1995 20052000
other
other industry
fertiliser
electricity
residential
natural gas consumption, by end use Indiafig 12

20
natural gas in india » abare research report 07.23
from coal in this sector toward electricity and, to a lesser extent, natural gas (fi gure 13; IEA 2007a).
While small in absolute terms, natural gas use in the residential sector has grown strongly, at an average rate of 20 per cent a year since 1990. Household natural gas consumption was virtually nonexistent in 1990, but rose to more than 0.7 billion cubic metres in 2005. Rapid economic growth and rising incomes have led to a shift in consumer preferences from coal and noncommercial fuels to more convenient and clean fuels such as petroleum products and electricity (see box 2). Natural gas constitutes a marginal share in the residential fuel mix, although use of natural gas has been growing rapidly in recent years following an expansion in gas supply infrastructure.
city gas
Natural gas is supplied to residential, commercial and industrial consumers via underground pipeline distribution networks within metropolitan areas. Residential consumers use city gas for cooking, water and space heating, and air condi-tioning, while commercial and industrial consumers also use gas for steam raising and power generation, dryers, furnaces and boilers.
City gas distribution systems in India are not well developed, primarily as a result of limited supplies of natural gas and the allocation of gas to priority sectors such as electricity generation and fertilisers. However, city gas distribution has been
%
1990 1990 20052005 20002000industrial residential
40
20
80
60
electricitynatural gaspetroleum productscoal
energy consumption in key sectors, by fuel Indiafig 13

21
natural gas in india » abare research report 07.23
box 2 household consumption of noncommercial fuels in India
Indian households have traditionally relied on noncommercial or biomass fuels, including fi rewood, crop residue and animal waste, as a source of energy, primarily for cooking. In 2004, 69 per cent of the Indian population, or 740 million people, are estimated to have relied on biomass resources as their primary fuel for cooking, predominantly in rural households (IEA 2006a, 2007a).
If noncommercial fuels are included in the residential fuel mix, they constitute the largest share of residential energy consumption in India, at 124 million tonnes of oil equiva-lent in 2005, or 79 per cent of energy consumption in the sector. While demand for noncommercial fuels has traditionally been strong, their share has declined from 84 per cent in 1990 (fi gure 14, which includes combustible renewables and waste; IEA 2007a). However, there are some uncertainties over the reliability of these data, given the informal nature of the sector.
In the past, the Indian Government has initiated various measures to promote the use of cleaner fuels in the residen-tial sector, primarily by subsidising petroleum products such as kerosene and liquefi ed petroleum gas. This approach had limited success, particu-larly in lower income households, which still rely predominantly on noncommercial fuels. Abundant supplies of biomass fuels at zero cost, together with low afford-ability and poor delivery infrastructure for commercial fuels have inhibited and will continue to inhibit wider penetration of modern fuels in the residential sector.
Some reluctance to discontinue cooking with fi rewood may also refl ect taste prefer-ences and the familiarity of cooking with traditional technologies. For instance, many wealthy households in India retain a wood stove for baking traditional breads. As incomes increase and fuel options widen, the fuel mix may change, but wood is unlikely to be entirely excluded (IEA 2006a).
%
1990 20052000
40
20
80
60
electricitynatural gaspetroleum productscoalcombustible renewables and waste
energy consumption in the residential sector, by fuel Indiafig 14

22
natural gas in india » abare research report 07.23
growing rapidly over the past few years, from two cities — Delhi and Mumbai — in 2002-03 to ten cities in 2005-06 across the western, northern and southern regions of the country (MoPNG 2006a).
The largest city gas distribution networks currently operate in the cities of Mumbai and Delhi, and the state of Gujarat (cities of Surat, Bharuch and Ankleshwar), with more than 500 000 consumers in various sectors. City gas sales grew to almost 2 billion cubic metres in 2005-06, compared with 1.6 billion cubic metres the previous year, an increase of 22 per cent (table 5).
compressed natural gas
Compressed natural gas (CNG) is used as an automotive fuel in a limited number of cities in India. The initially sluggish growth in CNG demand from the automotive sector has picked up as a result of recent directives by the Supreme Court of India to control air pollution caused by vehicular traffi c through the promotion of CNG use. The directives included expansion of CNG infrastructure, conversion of buses, taxis and auto-rickshaws from liquid fuel to CNG, and allocation of natural gas to the transport sector in Delhi and Mumbai.
In 2003, the Supreme Court ordered the government to draw up plans for the introduction of clean fuels such as CNG in eleven cities apart from Delhi and Mumbai — Kolkata, Chennai, Bangalore, Hyderabad, Ahmedabad, Sholapur, Surat, Lucknow, Kanpur, Agra and Pune (De 2004).
table 5 city gas consumer base in India
sales volume
industrial commercial residential total 2005-06 a 2004-05 a no. no. no. no. million m3 million m3
MGL (Mumbai) 40 819 258 433 259 292 455 413IGL (Delhi) 47 215 46 727 46 989 445 405GGCL (Gujarat) 750 2 500 200 000 203 250 1 088 813
total 837 3 534 505 160 509 531 1 988 1 631a Includes CNG. MGL = Mahanagar Gas Ltd; IGL = Indraprastha Gas Ltd; GGCL = Gujarat Gas Company Ltd.Sources: MGL (2007); IGL (2007); GGCL (2007).

23
natural gas in india » abare research report 07.23
CNG sales have grown recently at an average rate of 61 per cent a year, from around 69 million cubic metres in 2000-01 to around 690 million cubic metres in 2005-06 (MoPNG 2006a). In 2005-06, the CNG distribution network included 281 stations in Delhi, Mumbai and Gujarat, with CNG powering more than 300 000 vehicles in these cities (table 6; MoPNG 2006a).
natural gas supply
domestic gas reserves
India’s proved natural gas reserves have increased from 0.7 trillion cubic metres in 1990 to more than 1 trillion cubic metres in 2006. This represents less than 1 per cent of total proved gas reserves in the world. These reserves can sustain the current level of production for around 34 years (BP 2007). Around 70 per cent of India’s proved gas reserves are located in offshore basins (map 1; IEA 2007c).
The recent discovery of natural gas in the Krishna–Godavari basin and neigh-bouring areas, off the east coast of India, was the biggest gas fi nd since the Bombay High (now Mumbai High) discovery on India’s western offshore territory in the 1970s. Reliance Industries Ltd (RIL) was the fi rst to announce a gas discovery in the Krishna–Godavari basin in 2002, followed by a number of discoveries by Gujarat State Petroleum Corporation Ltd (GSPC) and Oil and Natural Gas Corporation Ltd (ONGC). Estimated gas reserves of these combined discoveries, yet to be certifi ed, exceed 1.5 trillion cubic metres (IEA 2006a).
Substantial parts of India’s territory remain unexplored, suggesting potential for further growth in domestic gas reserves from future gas discoveries and more accu-rate estimation of existing reserves.
table 6 distribution and consumption of compressed natural gas in India, 2005-06
Delhi Mumbai Gujarat total
CNG stations units 146 120 15 281CNG vehicles units 106 483 170 003 33 403 309 889price Indian rupees/kg 18.00 20.19–21.30 22.55–23.41 consumption billion m3 a year 0.47 0.29 na na Not available.Source: MoPNG (2006a).

24
natural gas in india » abare research report 07.23
natural gas reserves Indiamap 1
gas and oil field
gas and oil basin
gas field
BANGLADESH
BHUTANNEPAL
Mumbaioffshore
Krishna–Godavari Basin

25
natural gas in india » abare research report 07.23
domestic gas production
Natural gas production in India increased at an average rate of 4 per cent a year, from 11.9 billion cubic metres in 1990 to 28.8 billion cubic metres in 2005 (fi gure 15; IEA 2007d), although estimates of India’s gas production vary between sources. Around 70 per cent of domestic produc-tion comes from offshore fi elds, operated by ONGC and private sector companies/joint ventures. The Mumbai High fi elds account for almost three-quarters of India’s offshore gas production (table 7).
20
10
30
1990 200520001995
billion m3
imports
domestic gas production
natural gas supply India fig 15
table 7 natural gas production – India
1990-91 2000-01 2004-05 2005-06 s billion m3 billion m3 billion m3 billion m3
onshore Gujarat 1.70 3.15 3.71 3.83Assam/Nagaland 2.01 2.20 2.25 2.41Arunachal Pradesh 0.03 0.03 0.04 0.05Tripura 0.07 0.38 0.50 0.48Tamil Nadu 0.06 0.20 0.68 0.91Andhra Pradesh 0.05 1.60 1.71 1.66Rajasthan nil 0.16 0.21 0.24
total onshore 3.92 7.73 9.09 9.58
of which OIL 1.52 1.86 2.01 2.27ONGC 2.40 5.56 5.66 5.75joint ventures/private nil 0.31 1.43 1.56
offshore ONGC (Mumbai High) 14.08 18.47 17.31 16.82joint ventures/private nil 3.29 5.36 5.80
total offshore 14.08 21.75 22.67 22.62
grand total 18.00 29.48 31.76 32.20s Estimated. Note: These data for total gas production differ from IEA (2007a,d). For consistency, IEA data have been used throughout this report, however, these data have been included to provide state based data that are not available from the IEA.Source: MoPNG (2006a).

26
natural gas in india » abare research report 07.23
Until the opening up of the oil and gas sector to private participation in the late 1990s, natural gas production in India was dominated by two national oil compa-nies, ONGC and OIL (box 3). These companies still account for the largest share of domestic gas production, at 77 per cent in 2005-06. Private companies/joint ventures, which make up the rest of India’s gas production, have increased their share rapidly from nil in 1990-91 to nearly 23 per cent in 2005-06.
Existing onshore and offshore gas fi elds operated by national oil companies are facing declining production over the medium term, which places an increased emphasis on identifying new sources of gas supply, either domestic or imported.
LNG imports
India has placed increasing focus on LNG imports as a potential means of meeting domestic natural gas demand. LNG imports have risen steadily since the commis-sioning of India’s fi rst LNG terminal at Dahej in the State of Gujarat in early 2004. From just under 2 million tonnes that year, LNG imports reached more than 6 million tonnes in 2006. In the fi rst half of 2007, LNG imports by India were 4.1 million tonnes, a rise of more than 66 per cent compared with the fi rst half of 2006.
While Qatar was the sole supplier of LNG to India in 2004 and remains the largest LNG supplier at present, the range of suppliers is becoming increasingly diverse. In 2005, India imported LNG from Australia and Oman. Additional
supplies were sourced from Egypt, Trinidad and Tobago, Abu Dhabi, Malaysia and Algeria in 2006 (fi gure 16; FGE 2007a).
At present, India has two opera-tional LNG import terminals — Dahej and Hazira — in Gujarat state, while a third terminal at Dabhol in the state of Maharashtra is under construction (table 8). There are several other proposed LNG terminals in various stages of plan-ning. These are discussed further in chapter 5.
Mt
200620052004
6
4
2
Australia
otherEgypt
OmanQatar
LNG import capacity
LNG imports, by source countryIndia
fig 16
27
natural gas in india » abare research report 07.23
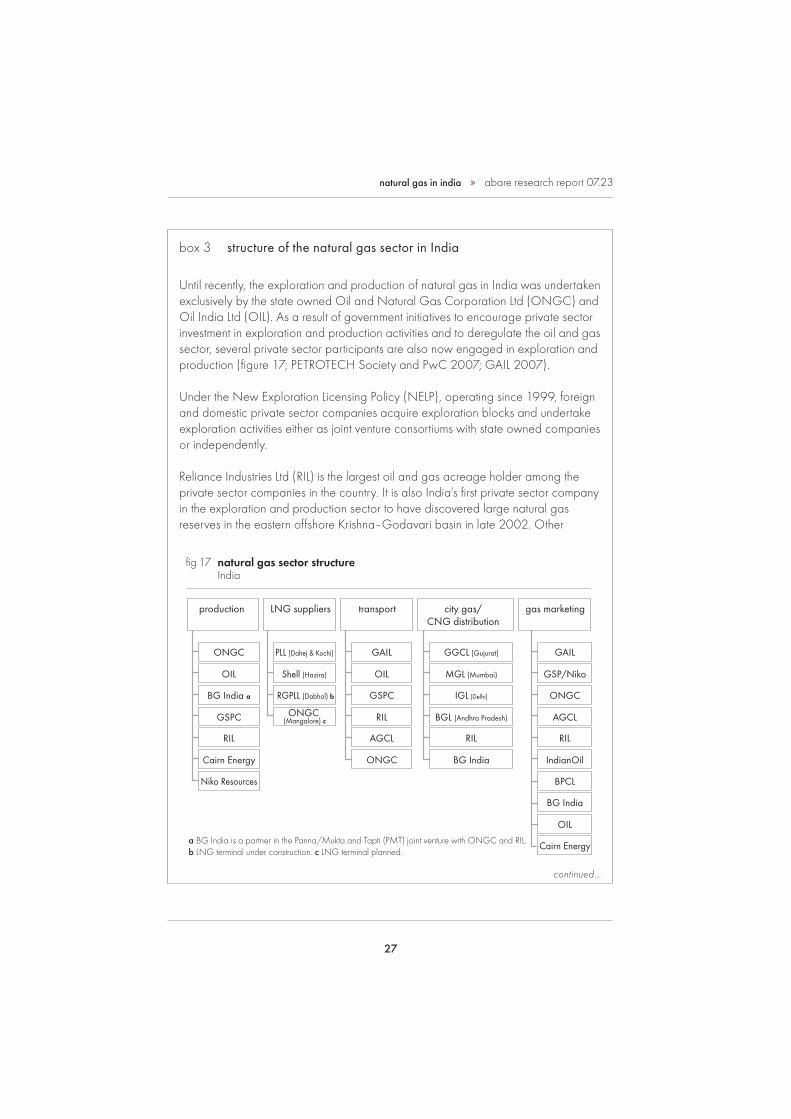
box 3 structure of the natural gas sector in India
Until recently, the exploration and production of natural gas in India was undertaken exclusively by the state owned Oil and Natural Gas Corporation Ltd (ONGC) and Oil India Ltd (OIL). As a result of government initiatives to encourage private sector investment in exploration and production activities and to deregulate the oil and gas sector, several private sector participants are also now engaged in exploration and production (fi gure 17; PETROTECH Society and PwC 2007; GAIL 2007).
Under the New Exploration Licensing Policy (NELP), operating since 1999, foreign and domestic private sector companies acquire exploration blocks and undertake exploration activities either as joint venture consortiums with state owned companies or independently.
Reliance Industries Ltd (RIL) is the largest oil and gas acreage holder among the private sector companies in the country. It is also India’s fi rst private sector company in the exploration and production sector to have discovered large natural gas reserves in the eastern offshore Krishna–Godavari basin in late 2002. Other
continued...
natural gas sector structure Indiafig 17
production LNG suppliers transport city gas/CNG distribution
gas marketing
GAIL GAILONGC PLL (Dahej & Kochi) GGCL (Gujurat)
OIL GSP/NikoOIL Shell (Hazira) MGL (Mumbai)
GSPC ONGCBG India a RGPLL (Dabhol) b IGL (Delhi)
RIL AGCLGSPC ONGC(Mangalore) c BGL (Andhra Pradesh)
AGCL RILRIL RIL
ONGC IndianOilCairn Energy BG India
BPCLNiko Resources
BG India
OIL
Cairn Energya BG India is a partner in the Panna/Mukta and Tapti (PMT) joint venture with ONGC and RIL. b LNG terminal under construction. c LNG terminal planned.

28
natural gas in india » abare research report 07.23
box 3 structure of the natural gas sector in India continued
private sector participants in exploration and production activities include BG India, Niko Resources and Cairn Energy.
Pipeline gas transport is primarily undertaken by state owned GAIL (India) Ltd, formerly the Gas Authority of India Ltd. GAIL is India’s largest gas transmission and marketing company, with a high pressure pipeline network of around 5600 kilome-tres. The largest pipeline network, Hazira–Vijaipur–Jagdishpur, with a total length of more than 2800 kilometres, covers the states of Gujarat, Rajasthan, Madhya Pradesh, Uttar Pradesh, Haryana and Delhi in the north west of the country. The 610 kilometre long Dahej–Vijaipur pipeline owned by GAIL transports regasifi ed LNG received at the Dahej terminal operated by Petronet LNG Ltd (PLL).
GAIL also has regional gas distribution grids, totalling around 1 800 kilometres of varying length and diameter in Ahmedabad, Assam, Baroda, Cauvery basin, Hazira, Krishna-Godavari basin, Mumbai, Rajasthan and Tripura. Other regional natural gas pipeline operators include Gujarat Gas Company Ltd (GGCL) and Gujarat State Petronet Ltd (GSPL) in Gujarat, Assam Gas Company Ltd (AGCL) and Tripura Natural Gas Company Ltd (TNGCL) in Assam and Tripura respectively. Indraprastha Gas Ltd (IGL) in Delhi, Mahanagar Gas Ltd (MGL) in Mumbai and GGCL in Gujarat are also developing city gas distribution networks for the supply of compressed natural gas (CNG) and city gas in their respective areas.
The gas produced by ONGC and part of the gas from joint venture consortiums, such as the Panna/Mukta and Tapti joint venture formed by BG India, ONGC and RIL, is marketed by GAIL. The gas produced by OIL is marketed by OIL itself, except in Rajasthan where GAIL markets its gas. Gas produced by Cairn Energy and Gujarat State Petroleum Corporation Ltd (GSPC) is being sold directly by the respective companies.
Companies operating India’s LNG import facilities include Petronet LNG Ltd (PLL) and Shell Hazira. PLL, the operator of India’s fi rst LNG receiving and regasifi cation terminal at Dahej, Gujarat, is comprised of four state owned oil and gas companies — GAIL, ONGC, Indian Oil Corporation Ltd (IndianOil) and Bharat Petroleum Corporation Ltd (BPCL). The Hazira LNG Terminal and Port is partnered by Shell Gas BV and Total Gaz Electricité Holdings France, representing two of the largest private LNG suppliers in the world.
continued...

29
natural gas in india » abare research report 07.23
Dahej terminal, Gujarat
Petronet LNG Ltd (PLL) was formed by the Indian Government as a joint venture to set up LNG terminals and import LNG. GAIL, ONGC, Indian Oil Corporation Ltd (IndianOil) and Bharat Petroleum Corporation Ltd (BPCL) are the key partners and promoters of PLL. The terminal at Dahej has an annual design capacity of 6.5 million tonnes of LNG. The company plans to expand the capacity to 10 million tonnes of LNG a year by the end of the decade.
table 8 existing LNG terminals – India
project commis- potential location developer capacity supplier sioned expansion Mt pa
Dahej, Petronet LNG Ltd (PLL) 6.5 a RasGas, Qatar; 2004 10 million tonnes a Gujarat spot cargoes year by 2010
Hazira, Shell Hazira LNG 2.4 spot cargoes 2005 planned expansion Gujarat Terminal and Port to 5–10 million tonnes a yearDabhol, Ratnagiri Gas and 5.0 yet to be delayed by Maharashtra Power Private Ltd fi nalised various issues, (RGPPL) expected 2009 a Debottlenecking increased capacity from 5 million tonnes a year to 6.5 million tonnes a year in early 2007.Sources: PLL (2007a); Shell (2007).
box 3 structure of the natural gas sector in India continued
Ratnagiri Gas and Power Private Ltd (RGPPL) is a special purpose organisation that has been incorporated to take over assets and revive the former Dabhol Power Company project in the state of Maharashtra. The Dabhol project is an integrated facility consisting of a gas fi red power plant and an associated LNG receiving and regasifi cation terminal. The RGPPL shareholders include GAIL, state owned National Thermal Power Corporation Ltd (NTPC), Maharashtra State Electricity Board Holding Co Ltd (MSEB) and Indian fi nancial institutions.

30
natural gas in india » abare research report 07.23
PLL has a long term sale and purchase agreement with Ras Laffan LNG Company Ltd (RasGas) for the phased supply of 7.5 million tonnes of LNG a year from Qatar to India, starting in 2004 and expiring in 2029. The fi rst phase of 5 million tonnes of LNG a year is already in progress, while the second phase of an additional 2.5 million tonnes of LNG a year is due to begin in 2009. GAIL, the sole transporter of the regasifi ed LNG, has upgraded the Hazira–Vijaipur–Jagdishpur (HVJ) pipeline from Dahej to Vijaipur to synchronise with the LNG terminal.
GAIL, IndianOil and BPCL market the regasifi ed LNG to their respective customers. The gas is sold to existing industrial customers requiring increased volumes of gas or to those who currently use liquid fuels such as naphtha or fuel oil in their manu-facturing process. These customers are located in the states of Gujarat, Mahar-ashtra and along the HVJ pipeline.
Hazira terminal, Gujarat
The Hazira terminal in the state of Gujarat is partnered by Shell Gas BV and Total Gaz Electricité Holdings France. The fi rst LNG shipment, sourced from Australia, arrived at the terminal in April 2005. The Hazira terminal has an annual capacity of 2.4 million tonnes, which can be increased to 5–10 million tonnes a year, if required. To date the Hazira LNG terminal has been operating well below capacity. Terminal partners source LNG from various projects around the world as required, rather than on a long term contract basis.
The Hazira LNG terminal has access to existing pipeline infrastructure to transport and deliver gas to customers. A pipeline from Hazira to Mora has been laid to connect to the Gujarat grid operated by Gujarat State Petronet Ltd (GSPL). The terminal is also connected to GAIL’s pipeline network, and Shell and GAIL have initialled a broad framework of agreement to deliver gas from the Hazira terminal to GAIL’s customers.
Dabhol terminal, Maharashtra
Ratnagiri Gas and Power Private Ltd (RGPPL) was set up in 2005 under the Indian Government’s restructuring plan to take over the assets and revive the former Dabhol Power Company project. The project includes a 2184 megawatt gas fi red power plant and a linked LNG import and regasifi cation facility. The Dabhol power project was shut down in May 2001 following a power tariff dispute between its initial promoter, Enron Power Corporation, and the only customer, Maharashtra State Electricity Board Holding Co Ltd (MSEB).

31
natural gas in india » abare research report 07.23
RGPPL is now a wholly owned Indian project with GAIL, National Thermal Power Corporation Ltd (NTPC), MSEB and Indian fi nancial institutions as the main share-holders. GAIL was given the mandate to revive the LNG facility, while NTPC was to revive the associated power plant. The power plant resumed operation in April 2006 using naphtha as fuel in the absence of gas supply. In July 2006 the power plant was shut down again as a result of the high cost of naphtha supplies. The plant restarted in late August 2007, using imported LNG (Platts 2007a).
The Dabhol LNG import terminal is planned to have an annual capacity of 5 million tonnes of LNG, of which 2.1 million tonnes is required for the power plant, with the remaining quantity available for supply to various consumers. Commis-sioning of the terminal has been delayed, primarily as a result of signifi cant cost overruns, and is now expected to occur toward 2009 after the completion of associated facilities.
In the absence of long term supply contracts, RGPPL has entered into a medium term arrangement with PLL for the supply of spot LNG to be delivered at PLL’s Dahej terminal and transported to Dabhol via the recently completed Dahej–Dabhol pipeline. PLL signed a short term LNG import agreement in mid-2007 with Qatari supplier Rasgas to meet RGPPL requirements and is also sourcing cargoes from the spot market (Platts 2007b).
gas supply infrastructure
India’s natural gas pipeline network is made up of high pressure interstate transmis-sion pipelines, located mostly in the north western part of India, and regional gas distribution grids in western, southern and eastern regions of the country. India currently does not have any major storage facilities for natural gas.
The total length of the gas transmission system is 6300 kilometres, of which more than 5600 kilometres are operated by GAIL. Other gas pipeline operators include Gujarat Gas Company Ltd and Gujarat State Petronet Ltd in Gujarat, Assam Gas Company Ltd and Tripura Natural Gas Company Ltd in Assam and Tripura respec-tively. At the core of India’s transmission system is the Hazira–Vijaipur–Jagdishpur (HVJ) pipeline, which carries natural gas from the western offshore fi elds to end users in Gujarat, Madhya Pradesh, Rajasthan, Uttar Pradesh, Haryana and Delhi. The HVJ pipeline is more than 2800 kilometres long, and has a design capacity of 12.2 billion cubic metres a year (equivalent to 8.9 million tonnes of LNG) (MoPNG 2006a; GAIL 2007).

32
natural gas in india » abare research report 07.23
GAIL also operates more than 1800 kilometres of regional gas pipelines in Ahmedabad, Assam, Baroda, Cauvery basin, Hazira, Krishna–Godavari basin, Mumbai, Rajasthan and Tripura. These pipelines are smaller and vary in length from less than 1 kilometre up to 55 kilometres. In addition, there are a number of city gas distribution grids, which supply gas to households, commercial and indus-trial users, and the transport sector.
While GAIL is the largest gas transmission and distribution company in India, it also provides access to third parties for the transmission of natural gas. Currently, transmission tariffs on the interstate gas pipelines — HVJ and Dahej–Vijaipur — are regulated, while transmission tariffs on the regional gas pipelines and LPG pipe-lines are not regulated.
The total capacity of the transmission network is 51.1 billion cubic metres a year (equivalent to 37.3 million tonnes of LNG). The amount of gas transmitted via GAIL’s pipeline network has increased by almost 30 per cent in recent years, from 22.5 billion cubic metres in 2001-02 to 28.8 billion cubic metres in 2005-06 (GAIL 2006).
GAIL has drawn up major plans for the expansion of the interstate gas transmission grid, which would allow expansion of India’s gas supply infrastructure and provide connections between various gas sources and geographically dispersed markets (map 2; GAIL 2006). The proposed grid would add a further 8400 kilometres of natural gas transmission pipelines in line with the emergence of gas sources on the west and east coasts of the country, and require investment of approximately US$5 billion. Several private companies also have plans to construct interstate pipelines, including in Andhra Pradesh, Maharashtra, Gujarat, Goa, Madhya Pradesh, Orissa, West Bengal and Tamil Nadu (MoPNG 2006a).
The integrated gas pipeline network would also enable the development of city gas distribution projects in the country by catering to a large number of cities and towns falling in the catchment area of the existing and future pipeline networks. Recent developments in downstream petroleum and natural gas regulation, such as the enactment of the Petroleum and Natural Gas Regulatory Board Act in 2006 and the formulation of the Gas Pipeline Policy, are expected to provide further impetus for the expansion of gas supply infrastructure in the country. The regulatory framework in the natural gas sector is discussed further in the following chapter.

33
natural gas in india » abare research report 07.23
gas pricingUntil recently, all natural gas produced in India was subject to an administered pricing mechanism, based on subsidised consumer prices. After an attempt to bring gas prices to parity with import prices of alternative fuels in the late 1990s proved unsuccessful, the Indian Government has set gas prices on an ad hoc basis (see box 4 on the evolution of gas pricing in India). At present, India has a mix of administered and market gas prices that vary across consumer segments and depend on their eligibility for administered gas pricing.
Jaipur
Amritsar
New Delhi
Chandigarh
natural gas infrastructure Indiamap 2
Dahej
Hazira
Kochi
Kolkata
Chennai
existing pipelines
proposed pipelines
existing LNG import terminals
under construction/planned LNG import terminals
BangaloreMangalore
Dabhol
Pune
Hyderabad Kakinada
BANGLADESH
BHUTANNEPAL
Kota
Ahmadabad
Jamnagar
Vijaipur
Mumbai
Jagdishpur
Bhatinda
Srinagar
Bhopal
Patna

34
natural gas in india » abare research report 07.23
box 4 evolution of gas pricing in India
Historically, natural gas prices in India have been regulated using a variety of mecha-nisms. Until the 1970s, gas prices were based on recommendations made by expert committees. During the 1970s and most of the 1980s, prices were determined by the monopoly gas producers — ONGC and OIL — on a negotiated basis. Since 1987, the government has set uniform gas prices across the country, with an exception of the north east region, which receives gas at concessional prices.
In 1997, natural gas prices were pegged to the import parity price of a basket of internationally traded fuel oils. Prices were set to increase progressively as a proportion of the fuel oil basket price, from 55 per cent in 1997-98 to 85 per cent in 2000-01. To curb any major fl uctuations in gas prices, the government set a price band, with a fl oor price of 2150 Indian rupees per thousand cubic metres and a ceiling price of 2850 Indian rupees per thousand cubic metres. However, in 1999-2000 gas prices reached the ceiling price, as international fuel oil prices continued to increase. The process of raising gas prices to achieve full import parity was stalled and gas prices remained at this ceiling until 2005-06.
In July 2005, the gas price for priority sectors — electricity generation and fertiliser sectors and other users specifi ed on occasion by the government or court — was revised upwards to 3200 Indian rupees per thousand cubic metres. The price of gas in the north east region was pegged at 60 per cent of the revised price. However, the price of gas for consumers in all other sectors more than doubled to 6893 Indian rupees per thousand cubic metres (table 9).
Administered gas prices were revised further in 2006, with prices for nonpriority sectors such as steel raised by around 23 per cent, and by 20 per cent for city gas distribution companies and customers consuming less than 18.25 million cubic metres a year. The priority sectors continue to pay 3200 Indian rupees per thousand cubic metres. Further rises in gas prices are anticipated once the Tariff Commission under the Ministry of Commerce and Industry makes recommendations on prices for gas sold under the administered pricing mechanism.
There have been recent disputes over privately produced gas not subject to admin-istered pricing, including the pricing formula for gas sourced from RIL fi elds in the KG basin. RIL proposed a landed price of US$4.33 per million British thermal units to the government for approval in mid-May 2007 and stated that there would be

35
natural gas in india » abare research report 07.23
However, the Government has recognised the need to move to market based prices to enable potential customers to secure imports and to encourage domestic gas exploration and production. In 2005, the government started a gradual phasing out of the administered pricing mechanism, with an increasing number of natural gas producers and consumers moving toward market prices. The ultimate goal of domestic gas pricing reform is market pricing that is aligned with global trends and makes natural gas competitive against alternative fuels (fi gure 18; PLL 2007b).
Currently, administered prices apply only to natural gas produced by ONGC and OIL from nominated domestic gas fi elds and supplied to priority sectors, namely electricity generation and fertiliser production. The current output of natural gas from the nominated fi elds accounts for approximately 60 per cent of total gas production in the country (MoPNG 2007).
box 4 evolution of gas pricing in India continued
delays in the commencement of production should prices remain unresolved. The price for gas proposed by RIL is substantially higher than the prices paid by customers who currently have access to subsidised gas. The government subse-quently made changes to the pricing formula proposed by RIL where the landed price of KG basin gas would be US$4.20 per million British thermal units. However, as of late September 2007, the issue remained unresolved (Platts 2007c).
gas pricing reform direction Indiafig 18
past present future
• 100 per cent government controlled
• single price for all users and sources
• cost plus basis
• government controlled in priority sectors – electricity – fertiliser – CNG/small consumers
• market prices – private/joint ventures – regasified LNG
• free market pricing
• competitive with alternative fuels
• alignment with global trends

36
natural gas in india » abare research report 07.23
Gas prices in the transport sector and for small customers (consuming less than 18.3 million cubic metres a year) are expected to be progressively increased over three to fi ve years to refl ect market prices. City gas distribution companies are already required to pay market rates to GAIL for gas sold to industrial and commercial customers, which was previously charged at subsidised rates.
The total price of gas to the consumer is a combination of the government regu-lated wholesale price, royalty charges, pipeline transmission tariffs and applicable taxes and duties. As at August 2006 the total price of gas sold to priority sectors was estimated at around US$3.07 per million British thermal units, compared with a market driven price of US$6.22 per million British thermal units (table 9; ICRA 2006; MoPNG 2007; ABARE research).
To provide incentives for private players to invest in gas exploration and produc-tion, the government has permitted natural gas produced under the New Explora-tion Licensing Policy (NELP) conditions to be sold in the open market at competi-tive prices. These prices are based on the production sharing contracts between the government and successful NELP bidders, and gas sales agreements. Gas pricing for pre-NELP blocks, including Panna/Mukta and Tapti and Ravva fi elds in the country’s western and eastern offshores, is partly covered by the adminis-tered pricing mechanism and partly market determined. Natural gas produced by
table 9 changes in natural gas prices, by sector – India
cost to the price pre price post price post consumers as at July 2005 July 2005 June 2006 August 2006 b Indian rupees Indian rupees Indian rupees US$ per million per ‘000 m3 per ‘000 m3 per ‘000 m3 British thermal units
priority consumers 2 850 3 200 3 200 3.07CNG, small consumers 2 850 3 200 3 840 3.52nonpriority consumers 2 850 6 893 8 482 a 6.22priority consumers (north east) 1 700 1 920 1 920 1.50nonpriority consumers (north east) 1 700 3 515 5 089 a 3.38regasifi ed LNG (Dahej) 6 893 6 893 4.88Panna/Mukta and Tapti joint venture 6 893 8 482 a
a From April 2006. b For consumers located outside Gujarat and along the HVJ pipeline. Note: Priority consumers include electricity, fertilisers and specifi c end users as per court orders. Nonpriority consumers include other industries such as steel, sponge iron and ceramics. There is considerable variation in prices reported by different sources therefore prices should be interpreted as indicative only.Sources: ICRA (2006); MoPNG (2007); ABARE research.

37
natural gas in india » abare research report 07.23
ONGC and OIL from the new fi elds that are not subject to administered pricing is also expected to be sold at market determined prices.
Regasifi ed LNG prices are based on the gas sale and purchase agreements. The price of LNG for the Dahej project is fi xed for the fi rst fi ve years, up to December 2008. Thereafter, the pricing structure will be gradually aligned with JCC (Japa-nese crude cocktail) prices. As at September 2007, the selling price of LNG was US$4.87 per million British thermal units in Gujarat and US$4.88 per million British thermal units outside Gujarat. At this price, LNG is cheaper than alternative fuels, such as naphtha, fuel oil, low sulfur heavy stock, light diesel oil and LPG (MoPNG 2007).
In the fi rst half of 2007, Indian buyers were paying around US$8 per million British thermal units for spot LNG to be used primarily in electricity generation, to replace naphtha in combined cycle plants and to meet peak load requirements (Platts 2007d). While spot cargo purchases have shown the gas market’s ability to absorb marginal LNG volumes at current high global prices, it is unlikely that this pricing can be sustained in the form of long term contracts for more signifi cant volumes, as fertiliser and power producers continue to rely on low administered prices for supplies from domestic fi elds and resist attempts to move toward market pricing, particularly while the selling prices of their end products are also capped.

38
factors affecting India’s future natural gas demand
While natural gas demand has the potential to grow strongly in India, a range of factors will affect the extent and profi le of future demand. These include the pace of gas market reform and pipeline network development; reforms in energy end use markets, including electricity and fertilisers; and policy responses to energy security concerns and environmental factors.
gas market reformA central issue for gas market reform in many economies has been how to create more competitive and fl exible markets in the presence of natural monopolies in transmission and distribution. Pipelines, the only economic option for transporting gas across land, involve large fi xed costs and low marginal costs of operation such that a given level of demand can usually be met at lower cost by using one pipeline intensively rather than building a second pipeline. Even when a market grows beyond the initial design capacity of a pipeline, capacity can usually be expanded by adding compressors at considerably lower cost than building a new pipeline.
One of the purposes of gas market reform is to separate the market for the gas commodity from the market for gas transport services. In the traditional model for gas supply in many economies, including India, consumers have only been able to purchase delivered gas from a single pipeline owner at a bundled price incor-porating the cost of the gas plus the cost of transporting it. Unbundling and open access to pipelines creates the opportunity for gas consumers and producers to negotiate directly for the sale of gas, and then separately arrange for its transport.
In recent years, the Indian Government has made signifi cant progress in estab-lishing a regulatory framework for pipeline access and pricing, seeking to promote downstream competition and increased public and private investment in natural gas pipeline infrastructure. In early 2006, the Indian Parliament passed the Petroleum and Natural Gas Regulatory Board Act, which envisaged setting up an independent regulator to monitor post production activities.
3

39
natural gas in india » abare research report 07.23
The Petroleum and Natural Gas Regulatory Board, which is currently being established, will regulate laying, building, operating and expanding natural gas pipelines and city or local gas distribution networks, including access, tariffs and technical standards. The objective of the board is to protect consumer interests by fostering fair trade and competition among entities engaged in specifi ed activities relating to natural gas, to ensure uninterrupted and adequate supply of natural gas in all parts of the country and to promote competitive markets in India.
To underpin the Petroleum and Natural Gas Regulatory Board Act, the government has formulated the Gas Pipeline Policy for the development of natural gas pipe-lines and city or local gas distribution networks, which came into effect at the end of 2006. The objective of the policy is to promote public and private investment in natural gas pipelines and city or local gas distribution networks, to facilitate open access for all players to the pipeline network on a nondiscriminatory basis, to encourage competition among entities and to protect consumer interests in terms of gas availability and reasonable gas transport tariffs. A Gas Advisory Board will be set up to promote and develop the gas pipeline network in India.
Currently, open access to the transmission network is allowed on a limited scale. For example, Petronet LNG joint venture partners use Hazira–Vijaipur–Jagdishpur and Dahej–Vijaipur networks to sell regasifi ed LNG. New regulations are expected to permit open access on a larger scale and in a transparent manner, thus enabling private producers and LNG terminal operators to sell gas directly to their customers. State governments are expected to play a key role in facilitating timely completion and operation of pipelines and city or local natural gas distribu-tion networks by ensuring statutory and other clearances are given without delay.
As the natural gas market in India matures, the policy envisages the unbundling of gas transmission and marketing activities to avoid confl icts of interest and to ensure that pipeline ownership does not provide competitive advantage to any gas seller, and all players have open access to the gas grid on a nondiscriminatory basis. Importantly, the policy permits 100 per cent foreign direct investment in laying natural gas pipelines under the automatic approval route, seeking to boost invest-ment in natural gas infrastructure development and to supplement domestic sources of fi nance.
Some of the contentious issues raised by the industry in relation to the new natural gas regulations concern the power of the board to regulate contract carriers, where pipelines are laid exclusively for consumers, and the decision on the pipe-line is made between the network operator and a specifi c consumer. The board

40
natural gas in india » abare research report 07.23
also has the power to determine a period of exclusivity for city or local gas distri-bution networks, a power that is supported by network operators and contested by prospective new entrants (ICRA 2006).
Development of a national gas pipeline network will be a key driver of growth in India’s natural gas market. Passage of the Petroleum and Natural Gas Regulatory Board Act and release of the associated Gas Pipeline Policy is a signifi cant step forward in creating a robust regulatory framework for downstream natural gas activities. The appointment of members of the proposed regulatory board and fi nalisation of further policy directives governing the gas market are expected to trigger much needed investment in the expansion of gas transmission and distribu-tion infrastructure. The Indian Government estimates that investment by public and private entities could reach almost 400 billion Indian rupees (around US$9 billion) over the fi ve years to 2011-12. Gas transmission pipelines account for more than half of the expected investment, followed by LNG terminals and city gas distri-bution networks at nearly one quarter (MoPNG 2006a). However, clarity on unresolved or contentious issues is critical for investment to start fl owing into the gas infrastructure sector and for a competitive gas market to emerge. If investment in coming years is less than optimal, it will have a dampening effect on gas demand.
end use market reformsFurther development and reform processes in the electricity generation and fertiliser production sectors will have a direct impact on India’s future gas demand levels and profi le, as they are likely to remain signifi cant customers.
fertiliser policy initiatives
Fertilisers have made a signifi cant contribution to India’s agriculture sector, not only in terms of meeting domestic food grain requirements, but also generating a grain surplus for export. To further boost agricultural production, the Indian government has placed high priority on increased output and effi ciency in the fertiliser sector, the removal of regional imbalances in production and distribution of fertilisers, and securing long term supply arrangements for feedstock and raw materials. To make fertilisers more affordable for farmers, the government subsidises input costs, including natural gas for fertiliser producers.
Prior to the 1980s, production of nitrogenous fertilisers (mainly urea) in India was primarily based on naphtha, fuel oil and low sulfur heavy stock. As natural gas

41
natural gas in india » abare research report 07.23
has become increasingly available as more domestic gas fi elds came online, there has been a steady increase in the number of gas based fertiliser plants. Natural gas is more effi cient than alternative feedstocks in urea production. At present, natural gas based plants account for more than 66 per cent of urea production capacity, naphtha is used for less than 30 per cent of urea produc-tion, and the remaining capacity is based on fuel oil and low sulfur heavy stock (DoF 2007a).
The fertiliser industry is one of the few highly regulated industries in India, with prices, subsidies, distribution, imports and choice of technology and feedstock controlled by the government. While phosphatic and potassic fertilisers were deregulated in the early 1990s, the pricing and distribution of urea remain largely under state control.
The government is reviewing the urea pricing mechanism and considering options to lower the subsidy to urea producers. However, to avoid potential negative impacts on food grain production in the country, it is unlikely that urea will be fully deregulated in the near future. The current pricing scheme provides fi nancial support to urea producers in earning a reasonable return on their investment in the administered price environment and favours conversion to natural gas/LNG. The current stage three of the scheme, which commenced in October 2006, directs all operating urea plants using naphtha and fuel oil/low sulfur heavy stock to convert to natural gas/LNG within three years. After that period, the government will limit subsidy payments to non gas based urea producers.
To meet anticipated growth in urea consumption, the government encourages urea plants to produce above capacity by means of debottlenecking or plant modernisation. Such measures, based on natural gas/LNG only, are expected to result in at least a 10 per cent increase in existing production capacity. Increases in production capacity based on alternative, more expensive feedstock, and feed-stock substitution for enhanced production capacity are not permitted. The new and expanded urea projects can receive full subsidy payments only if they are based on natural gas/LNG and sell urea directly to the agricultural sector. Simi-larly, resumption of production by closed urea plants has been permitted if based on natural gas/LNG.
These recent policy initiatives to convert the majority of urea production in the country to natural gas suggest that the fertiliser industry has signifi cant potential to increase natural gas consumption over the coming years, supported by continued strong demand for fertilisers by India’s growing population. Based on proposals

42
natural gas in india » abare research report 07.23
received, the government has estimated that natural gas consumption in the ferti-liser industry could rise by 86 per cent between 2007-08 and 2011-12.
However, any marked increase in gas consumption in the fertiliser sector depends on the availability and pricing of natural gas/LNG, the development of neces-sary gas infrastructure, and the successful implementation of the policy initiatives described in this section.
electricity reform
Electricity sector reform in many economies has been based on the objective of encouraging effi cient energy supply and use. The basic elements in most reform models include: separation of generation from transmission and distribution; competition between generating companies (privately owned or corporatised); provision of access by transmission and distribution companies (privately owned or corporatised) to all network users on nondiscriminatory terms; establishment of an independent regulatory body; and all or part of the retail market open to competi-tion.
Similar to other economies, privatisation is a key feature of electricity sector reform in India, driven by government budget considerations and a desire to encourage better performance by utilities. The electricity sector in India is mainly publicly owned and operated. The central government, through public companies, owns and operates a third of the electricity generation capacity and interstate transmis-sion. At the state level, the state electricity boards own and operate most of the remaining two-thirds of the generation capacity, as well as single state transmission and distribution systems. The states also defi ne their own tariff structures.
The central government has for a long time given priority to developing access to electricity. This has frequently meant low prices for domestic and agriculture consumers and relatively higher prices for electricity supplied to the industry and commercial sectors. However, the growth in the electricity demand has outstripped the growth of the public money available to bear the cost of the increasing subsi-dies, which has led to the sector facing fi nancial constraints.
Since the early 1990s, the government has focused on attracting private invest-ment in the sector. The government has gradually introduced competition in bidding for generation projects and established a regulatory framework for private sector participation in electricity distribution. Most states in India have reorganised their state electricity boards, which have been typically unbundled into separate

43
natural gas in india » abare research report 07.23
companies for generation, transmission and distribution. Several states have also opted to partially or entirely privatise generation and distribution while keeping transmission as a state monopoly. However, the results of this reform have fallen below expectations. The state electricity boards are increasingly unable to pay for the electricity they purchase from central government owned utilities or from inde-pendent power producers. The level of network losses is estimated to be as much as 30–40 per cent, largely as a result of theft and because the network consists of many long distance low voltage lines.
The electricity sector in India incurs signifi cant fi nancial losses of around US$6 billion a year (KPMG 2007), which leads to underinvestment in new capacity and shortfalls in electricity generation. Inadequate generation capacity and the poor quality of the distribution network have resulted in poor quality of supply, characterised by planned and unplanned interruptions and deviations in voltage and frequency from prescribed parameters. In recent years, availability of fuel for electricity generation has also become a signifi cant constraint. Coal shortages are increasing and gas shortages are leading to a situation where plants are not able to operate to full capacity.
recent policy initiatives
In recognition of the key role of electricity in driving rapid economic growth and poverty alleviation, India has set the target of providing access to electricity to all households by 2009 and increasing availability of electricity to more than 1000 kilowatt hours per person by 2012. The latter target would require an estimated capacity addition of more than 100 000 megawatts by 2012 (ADB 2005). The government has identifi ed further electricity sector reform that includes promoting competition in interstate transmission, setting up an independent government authority to ensure nondiscriminatory grid access for competing generators, launching a program for capacity additions, reducing transmission and distribu-tion losses, and attracting private investment. To meet the above objectives, a new policy and regulatory framework is being put in place.
The Electricity (Amendment) Act 2007 provides an enabling environment for accel-erated and more effi cient development of the power sector, seeking to encourage competition with appropriate regulatory intervention. There is no licensing require-ment for electricity generation and captive generation has been freed from all controls under the Act. The national electricity policy sets out guidelines for the accelerated development of the power sector, providing supply of electricity to all areas and protecting the interests of consumers and other stakeholders, keeping

44
natural gas in india » abare research report 07.23
in view the availability of energy resources, available technologies, economics of electricity generation, and energy security issues. Other key initiatives in the sector include the rural electrifi cation policy, and megapower projects (thermal genera-tion projects of at least 700 megawatt capacity and hydropower plants of at least 350 megawatt capacity that supply electricity to more than one state).
implications for natural gas
The electricity sector policies provide an indication of the role that gas fi red power generation can play in India’s future electricity supply mix. For thermal power, including natural gas, the economics of generation and supply of elec-tricity is expected to be the basis of fuel choice. New gas fi red power generation capacity could be based on domestic gas fi nds and emerge as a major source of power generation subject to reasonable prices. A national gas grid covering various parts of the country is expected to facilitate the development of gas fi red generation capacity. Imported LNG based power plants are also a potential source of electricity but the pace of their development will depend on their commercial viability.
The government target of an additional 100 000 megawatt capacity by 2012 is a strong incentive to consider natural gas as a fuel source. Gas fi red power plants have signifi cant advantages over coal, including a shorter construction period, high thermal effi ciency, ability to meet peak load requirements, and lower levels of greenhouse gas and other pollutant emissions. The government has implemented policies that encourage the existing power plants that use liquid fuels to switch to natural gas/LNG, to reduce the cost of electricity generation and reduce air pollution (IEA 2006b).
A reliable supply of natural gas will be a key driver of further expansion in gas fi red electricity generation capacity in India. Gas pricing will be another critical factor. Sensitivity to gas prices in India differs by region, with locations close to coal mines in the east of the country being more price sensitive than those on the west coast, located close to domestic gas supplies and existing and proposed LNG terminals. In addition, gas fi red power plants that supply electricity to industry can afford substantially higher gas prices than those plants dedicated to supplying the public power sector. Estimates about an affordable delivered price of gas based on comparisons with alternative fuels range from US$3.63–4.00 per million British thermal units for additional capacity to US$4.60 per million British thermal units for existing but underutilised capacity. Some sources put an afford-able price of natural gas/LNG for a power plant at US$9–10 per million British thermal units (IEA 2006b; ICRA 2006).

45
natural gas in india » abare research report 07.23
Coal is the major competitor fuel for gas, and future coal policies, and in particular the path and extent of coal industry deregulation, are also important determinants of potential natural gas demand in the electricity sector in India. Thermal plants adjacent to coal mines that supply electricity to regional load centres are estimated to be the cheapest source of electricity at most locations in the country. Coal that is produced and supplied by state owned companies is available at much lower prices to power plants than coal supplied at international prices. However, over the past few years the growth in coal demand for electricity generation has outstripped domestic supply increases, leading to rising imports of thermal coal. Domestic coal supply constraints stem largely from structural and regulatory issues relating to the pricing regime (domestic coal prices remain below international parity) and the limited scope for private participation (Thapa and Kumar 2006).
While coal is likely to remain the main fuel for meeting future electricity demand in India, given limitations in the use of coal for electricity generation resulting from environmental considerations, quality and supply constraints, natural gas can still be expected to play an important role in India’s electricity sector.
security of energy supplyBecause of the strong link between economic growth and energy consumption, India has sought to strengthen its energy security through a variety of means. These include diversifi cation of the fuel mix, broadening of energy supply sources, and the implementation of energy conservation measures. Concerns over growing energy import dependence, together with global and domestic supply risks, have further added to the challenge of energy security.
A key measure of India’s energy security policy has been the expansion of domestic oil and natural gas production. As part of this, the government launched the New Exploration Licensing Policy (NELP) to boost the level of exploration activity in the country, and to encourage an increase in oil and gas production. The policy aims to provide a level playing fi eld for public and private companies competing for exploration areas. The government offers exploration blocks, both onshore and offshore, on a regular basis and awards them through an open inter-national competitive bidding system.
The NELP provides signifi cant benefi ts to prospective investors, including the provi-sion for 100 per cent foreign direct investment, a seven year tax holiday, freedom to sell natural gas in the domestic market at market determined prices, and no

46
natural gas in india » abare research report 07.23
minimum expenditure commitment during the exploration period. This has already resulted in committed investment of around US$5 billion in oil and gas exploration after the fi rst fi ve bidding rounds (MoPNG 2006a).
India is also looking to exploit its coal bed methane and natural gas hydrate potential as alternative sources of domestic energy. Exploration activities have resulted in signifi cant coal bed methane discoveries in the eastern and central parts of India. Small scale production of coal bed methane commenced in 2007 (DGH 2007).
Proposals to import gas via pipelines are also being driven by the need to diversify the fuel mix in the economy and the source of energy imports. The Indian Govern-ment also encourages domestic companies to participate in the LNG supply chain, including investment in LNG exporting countries, to ensure security of supply. The government permits 100 per cent foreign direct investment in LNG projects and the import and export of natural gas, including LNG, is unrestricted. Investors are free to choose the locations for proposed LNG terminals, subject to regulatory authori-sation and environmental clearances.
The government also promotes equity participation of domestic companies in the exploration and production of overseas resources of oil and gas as an additional source of supply to enhance energy security. For example, Indian companies currently have investments in Myanmar, Viet Nam, the Russian Federation, Iran, Australia and a number of other countries. It is estimated that natural gas produc-tion from overseas assets could reach more than 2 billion cubic metres by 2011-12 (MoPNG 2006a). Another policy option under consideration is to create natural gas strategic storage facilities as a means of providing security against supply disruptions and shortfalls.
environmental issuesIndia’s economic development, underpinned by strong industrial growth and urbanisation as well as its vast population, has resulted in environmental problems, including deforestation, soil erosion, air and water pollution, and land degrada-tion. More than 35 cities or urban areas in India have populations greater than one million, and some of them, including New Delhi, Mumbai, Chennai and Kolkata, are among the world’s most polluted (OECD 2006).

47
natural gas in india » abare research report 07.23
The broad vision that underpins India’s energy policy is for energy to be supplied in a sustainable manner and at competitive prices. India’s energy needs are to be met in a technically effi cient, economically viable and environmentally sustainable manner (Government of India 2006).
To reduce current levels of air pollution, the Supreme Court of India has mandated the use of cleaner automotive fuels, such as compressed natural gas (CNG), in a number of cities across the country. Following the Supreme Court directives, the government adopted a fuel policy to control the levels of vehicular pollution. The policy provides a roadmap for emission norms over a period of time and corre-sponding fuel quality requirements. While it does not recommend any particular fuel or technology to achieve the desired emission norms, it does encourage the use of CNG in the transport sector. These initiatives have resulted in CNG emerging as a small but rapidly growing source of demand for natural gas, with public and private companies announcing CNG projects in a growing number of Indian cities.
There are no specifi c environmental policies promoting the use of gas in electricity generation in India. However, environmental legislation aimed at the coal sector can have the indirect impact of making gas fi red generation potentially more attrac-tive. For example, the government has directed power plants to use coal with ash content below 34 per cent if they are located beyond 1000 kilometres from the pithead or in critically polluted areas, urban areas and ecologically sensitive areas. Since Indian coal has an average ash content of 35–40 per cent, this directive provides another argument in favour of gas as a fuel source (IEA 2006b; TERI 2006a).
Energy effi ciency policies could also have a positive effect on the uptake of gas in the electricity generation sector, given the relatively high effi ciency and low emission levels of gas fi red power plants. One of the recommendations made by the Planning Commission in the eleventh fi ve year plan (2007–12) is to design and implement policies to increase energy effi ciency in the power sector by 20 percentage points to limit the harmful effect of carbon combustion on the environ-ment (Planning Commission 2006).

48
4projecting natural gas demand in India
In this chapter, a reference case (business as usual) scenario and a high growth scenario for energy and natural gas demand in India are developed for the period to 2025 using ABARE’s global trade and environment model (GTEM). GTEM is a multiregion, multisector, dynamic general equilibrium model of the world economy. The GTEM reference case represents the likely outlook for energy and natural gas demand in India in the absence of any signifi cant policy changes or other external shocks. The reference case projections are compared with other demand forecasts for natural gas in India, including from the International Energy Agency, the US Department of Energy, and various agencies of the Indian Government.
analytical frameworkGTEM is an appropriate framework for analysing energy markets because it takes into account the interaction between different sectors of the economy and between economies through trade linkages. The model includes a high level of commodity disaggregation, including a detailed treatment of energy and energy related sectors, and a sophisticated representation of technological change and interfuel substitution possibilities in the energy sector. This enhances the capacity of GTEM to analyse the impacts of changes in energy policies and other external factors that could infl uence the operation of energy markets.
At its most disaggregated level, GTEM consists of equations and data that describe the production, consumption, trade and investment behaviour of representative producers and consumers in 87 regions across 67 sectors. The database used to analyse the potential demand for energy and natural gas in India in this report has been aggregated to the 18 regions and 28 sectors presented in table 10.
The sectoral aggregation was chosen to include the three fossil fuels — coal, oil and natural gas — and electricity, and the major energy intensive industries that are likely to infl uence total energy consumption. The regional aggregation identifi es major energy producing and trading regions, in particular existing and potential gas suppliers to India.

49
Further information on GTEM is provided in Matysek et al. (2006) and on ABARE’s website (abareconomics.com).
key assumptions In projecting energy and natural gas demand in India using GTEM, a number of key assump-tions have been made. These include economic and popula-tion growth and the fuel mix in electricity generation.
economic and population growth
The principal driver of energy consumption is economic growth. In this study, it is assumed that economic growth in India will average 6.5 per cent a year over the period from 2005 to 2025 (table 11). This is supported by expectations of ongoing produc-tivity improvements and expan-sion in India’s labour supply. In the high growth scenario, economic growth is assumed to average 9.0 per cent a year, with the higher growth rate achieved through further economic reforms and productivity gains. These rates are comparable with the Indian Planning Commission’s (2006) possible target average annual growth rates — 7.0 per cent, 8.0 per cent and 9.0 per cent — in the eleventh fi ve year plan, for the period 2007–12.
natural gas in india » abare research report 07.23
table 10 regions and sectors in GTEM in this study
regions sectors1 Australia 1 brown thermal coal2 United States 2 black thermal coal3 Canada 3 coking coal4 European Union 4 oil5 Russian Federation 5 natural gas6 rest of CIS a 6 petroleum products7 Japan 7 biofuels8 China 8 electricity9 Republic of Korea 9 uranium ore10 Chinese Taipei 10 other ores11 India 11 iron and steel12 Indonesia 12 alumina13 rest of ASEAN b 13 primary aluminium14 Brazil 14 other nonferrous metals15 Mexico 15 chemicals, rubber and 16 Middle East plastics17 South Africa 16 bauxite18 rest of world 17 other minerals 18 nonmetallic mineral products 19 other manufacturing 20 water transport 21 air transport 22 other transport 23 livestock 24 crops 25 forestry and fi shing 26 food 27 wood and paper products 28 servicesa The rest of the Commonwealth of Independent States (CIS), comprises Azerbaijan, Armenia, Belarus, Georgia, Kazakhstan, Kyrgyzstan, Moldova, Tajikistan, Turkmenistan, Uzbekistan and Ukraine. b The rest of the Association of South East Asian Nations (ASEAN) comprises Brunei, Cambodia, Lao People’s Democratic Republic, Myanmar, Malaysia, the Philippines, Singapore, Thailand and Viet Nam.Source: ABARE.

50
natural gas in india » abare research report 07.23
table 11 GDP and population assumptions – India average annual growth, 2005–25
GDP population % %ABARE reference case 6.5 1.2ABARE high growth scenario 9.0 1.2
International Energy Agency a 5.4 –
US Energy Information Administration b – reference case 5.8 –– high growth 6.2 –
Indian Planning Commission 7.0–9.0 –
United Nations– high – 2.0– median – 1.6– low – 1.2a Interpolated from data in IEA (2006a). b Interpolated from data in EIA (2007a).Sources: IEA (2006a); United Nations (2007); EIA (2007a); Planning Commission (2006).
5050100 million years100
90–9980–8970–7960–6950–5940–4930–3920–2910–190–9
male2000 age
female
5050100 million 100
male2025
female
trends in population growth Indiafig 19
In this study, India’s popula-tion is assumed to grow at an average annual rate of 1.2 per cent between 2005 and 2025, reaching 1.4 billion people in 2025. This will be accompanied by a signifi cant expansion of the population in the working age range. For example, the United Nations projects that the propor-tion of people in the 20–69 age bracket will grow to 62 per cent in 2025, up from 52 per cent in 2000 (fi gure 19; United Nations 2007). The increase in labour supply, or demographic dividend, is an important factor in raising economic output and income per person in India, similar to other rapidly growing Asian econo-mies, including China.
Also important for economic growth will be ongoing structural economic reforms, especially in the high growth scenario. Recognising that the infrastructure defi cit is a major barrier to India’s long term growth potential, the government is working

51
natural gas in india » abare research report 07.23
to address regulatory and investment climate issues to attract foreign investment in key sectors. The acceleration of economic growth and increased urbanisation of the expanding population can be expected to place additional pressure on India’s already strained infrastructure, including energy supply infrastructure. Another key challenge is to improve education and labour policies to take advantage of India’s imminent demographic dividend.
fuel mix in electricity generation
A further key assumption that will underpin projected natural gas demand in India is the fuel mix used for electricity generation. The fuel mix adopted in India will be infl uenced by a range of factors, including the availability of resources and the rela-tive prices of competing fuels. Government policy favouring particular fuels will also play a role. The shares of electricity produced from different fuels (coal, oil, natural gas, nuclear, hydro and other renewables) in India over the period to 2025 are determined exogenously in GTEM on the basis of data from the IEA (2006a). The assumptions refl ect only a moderate change in the current fuel mix used for elec-tricity generation over the period to 2025 (fi gure 20).
Coal is expected to continue to be the main source of electricity generation in India over the outlook period, accounting for almost 70 per cent of output in 2025. The continued reliance on coal refl ects the availability and competitiveness of domestic coal in India relative to other fuels. The share of nuclear power is projected to increase to 7 per cent of electricity generation by 2025, from around 3 per cent in 2005. The expansion in nuclear power is underpinned by govern-ment policy responses to a growing reliance on energy imports. The share of hydropower is expected to decline to 11 per cent of electricity generation by 2025, while oil is expected to fall to 3 per cent.
Natural gas is projected to account for 7 per cent of electricity genera-tion in 2025, around 2 percentage points lower than in 2005. An expansion in nuclear and coal fi red electricity output — because of government policy and the
%
60
40
10
50
20
30
renewableshydro
nucleargas
oilcoal
200520152025
assumed fuel mix in electricity generation, reference case India
fig 20

52
natural gas in india » abare research report 07.23
competitiveness of these options — is the main reason behind the fall in the share of natural gas. Further, gas fi red electricity generation is currently affected by natural gas availability and uncertainties about its future availability and price, which may constrain its contribution to the fuel mix in the projection period. If a higher share of gas fi red electricity generation eventuated, then projected gas consumption would be higher than presented in this study.
There is considerable uncertainty surrounding the projected fuel mix in electricity generation in India over the period to 2025. This is refl ected in the range of alternative projections of Indian electricity, energy and gas demand, as well as signifi cant downward revisions to the expected share of gas fi red electricity in India in recent years (box 5).
oil price outlook
Future international oil prices will have some bearing on natural gas demand through various price transmission mechanisms. Oil prices are transmitted to some extent to international gas prices through price linkages in long term natural gas contracts. There are also indirect linkages to coal prices through substitution possi-bilities between fuels in the electricity generation sector.
In the reference and high growth scenarios, oil prices are assumed to remain high in the short term, owing to limited potential to expand production. Over the medium and longer term, oil prices are assumed to decline in response to higher global oil production and an increase in oil stocks. Refl ecting these projected movements in oil prices, international gas prices in real terms are projected to decline gradually over the period to 2025.
outlook for energy consumption, by fuelThe reference case and high growth scenario projections in this study represent a possible outlook for energy demand, and in particular natural gas demand, in India over the period to 2025 in the absence of any major policy changes or external shocks. The results, however, are not forecasts of what will actually happen in the economy. They are projections based on the set of assumptions outlined earlier that are considered plausible at the present time. If these assump-tions are realised, the projections could provide a reasonable estimate of energy developments in India.

53
natural gas in india » abare research report 07.23
box 5 alternative projections for India’s energy outlook to 2025
Long term projections of energy supply and demand outlook are based on assumptions of economic growth, population, fuel and technology mix, and energy effi ciency. The differences in assumptions used in various energy projection models is refl ected in a wide range of projections from Indian and international sources.
electricity generation
A recent Indian Government report on India’s energy policy options presents eleven possible long term energy scenarios, each emphasising a different fuel mix or a degree of specifi c technology adoption in the electricity sector (Government of India 2006). The uncertainty surrounding the fuel mix in electricity generation is also refl ected in projections made by the IEA in recent years. IEA (2006a) differs from IEA (2004) in that the emphasis changes from natural gas and hydroelectricity toward coal, nuclear and renew-able energy based electricity generation (fi gure 21). The share of gas in the 2006 projections is 7 per cent in 2025 (used by ABARE in this study), compared with 15 per cent in the 2004 projec-tions. In the latest IEA projections released in November 2007, the share of gas increases to 10 per cent in 2025 (IEA 2007c). The fuel shares reported in the reference case in IEA (2006a) also differ from those in the reference case in EIA (2007a) and many scenarios reported in Government of India (2006) that refl ect a higher share of gas. For example, scenario 5 in Government of India (2006) emphasises the role of natural gas and is based on an assumption that policy measures lead to an electricity generation share of 16 per cent from natural gas by 2025.
energy consumption
Figure 22 compares ABARE projections of India’s energy consumption growth using GTEM with a range of other projections. ABARE energy consumption projections are higher growth than those in IEA (2006a) and EIA (2007a), consistent with a higher assumed economic growth rate over the projection period. Projections
%
60
40
10
50
20
30
hydro+ other
renewables
IEA2004
EIA2007aIEA2006a
nucleargasoilcoal
fuel mix in electricity generation, 2025 India
fig 21
continued...

54
natural gas in india » abare research report 07.23
box 5 alternative projections for India’s energy outlook to 2025 continued
of energy consumption made in Government of India (2006) assuming GDP growth of 8 and 9 per cent are higher than in ABARE and other international projections. (IEA 2006a; EIA 2007a). This is also true for the business as usual (BAU) scenario reported in TERI (2006b).
natural gas consumption
As is the case for energy consump-tion, the projected growth in India’s natural gas consumption by different energy projection models
varies. Figure 23 compares the projected level of natural gas consumption using GTEM with a range of other projections. ABARE’s natural gas demand projections in the reference case are higher than those in IEA (2006a), but lower than projec-tions made in the reference case scenario in EIA (2007a). The latter is largely attrib-utable to the higher share of natural gas assumed in electricity generation in EIA (2007a). Projections made in Government of India (2006) for scenario 5 (forced increase in uptake of natural gas) and the business as usual scenario reported in TERI (2006b) are also higher than ABARE’s projections, refl ecting their higher share of gas in electricity generation.
TERI 2006b
GOI 2006 9%
GOI 2006 8%
EIA 2007a
IEA 2006a
ABARE high
ABARE reference
% 1 2 3 4 5 6
comparison of energy consumption growth projections, 2005–25
fig 22
average annual growth, India
bm3 25 50 75 100 125 150
GOI 2006 8%(scenario 5)
TERI 2006b
EIA 2007a
IEA 2006a
ABARE high
ABARE reference
comparison of natural gas demand projections, 2025 India
fig 23

55
natural gas in india » abare research report 07.23
Underpinned by a signifi cant expansion in economic output, total primary energy consumption in India in the reference case is projected to grow at an average rate of 4.0 per cent a year, to reach 837 million tonnes of oil equivalent in 2025 (table 12 and fi gure 24; IEA 2007a). This slower rate of annual growth than GDP implies a continuing decline in India’s energy intensity over the outlook period, refl ecting effi ciency gains in energy use in many sectors and continued restructuring of the economy toward less energy intensive sectors. In the high economic growth scenario, average annual growth in energy consumption is projected to be 5.3 per cent a year, reaching 1057 million tonnes of oil equivalent in 2025.
Natural gas consumption in the reference case is projected to grow by 4.8 per cent a year between 2005 and 2025, from 29 to 74 million tonnes of oil equiva-lent (fi gure 25). The increase in overall consumption of natural gas is moderated by improvements in the effi ciency of gas use in industry and electricity generation. The share of gas in total primary energy consumption is expected to increase by 1 percentage point to around 9 per cent. Under the high growth scenario, natural gas consumption is projected to increase by 5.8 per cent a year to reach 89 million tonnes of oil equivalent in 2025. The share of natural gas in the total primary energy mix is expected to fall marginally, refl ecting higher growth rates for oil, nuclear and renewables (fi gure 26; IEA 2007a). Greater than expected investment in gas supply infrastructure and gas supplies could lead to higher demand growth than that projected in this study.
table 12 growth in India’s GDP and primary energy consumption
total primary energy real GDP a consumption b
billion US$b Indian rupees Mtoereference case 2005 781 34 432 3792025 2 726 120 236 837average annual growth % % %2005–25 6.5 6.5 4.0
high growth scenario 2005 781 34 432 3792025 4 368 192 619 1 057average annual growth % % %2005–25 9.0 9.0 5.3a 2005 prices and exchange rates. b Excluding combustible renewables and waste.

56
natural gas in india » abare research report 07.23
800
400
200
600
Mtoe
India
2005 2010 2015 2020 2025
reference caseother renewableshydronucleargasoilcoal
2005 2010 2015 2020 2025
high growth case
total primary energy consumption, by fuelfig 24
%
12
8
2
10
4
6
otherrenewables
hydronuclear
gasoil
coal
high growth scenarioreference case
projected average annual growth in energy consumption, 2005–25 Indiafig 25
Coal consumption in India is projected to grow more slowly than in previous years, at an average annual rate of 3.1 per cent in the reference case, to reach 382 million tonnes of oil equivalent in 2025. Underpinning much of the growth in coal consumption will be growth in electricity generation. As a result, coal will remain a major energy source over the outlook period, although its contribution to the primary energy mix is projected to fall to 45 per cent in 2025, from 55 per cent in 2005. In the high growth scenario, growth in coal consumption is projected to increase by 4.2 per cent a year to reach 476 million tonnes of oil equivalent in 2025.
Consumption of oil is projected to grow by 4.8 per cent a year over the period to 2025 in the reference case to reach 331 million tonnes of oil equivalent. Oil’s contribution to total primary energy consumption is projected to rise to around 40 per cent in 2025, up from 34 per cent in 2005. A signifi cant proportion of the growth in oil consumption is accounted for by the transport sector, which, in turn, refl ects the impacts of high GDP growth and rising personal incomes on the
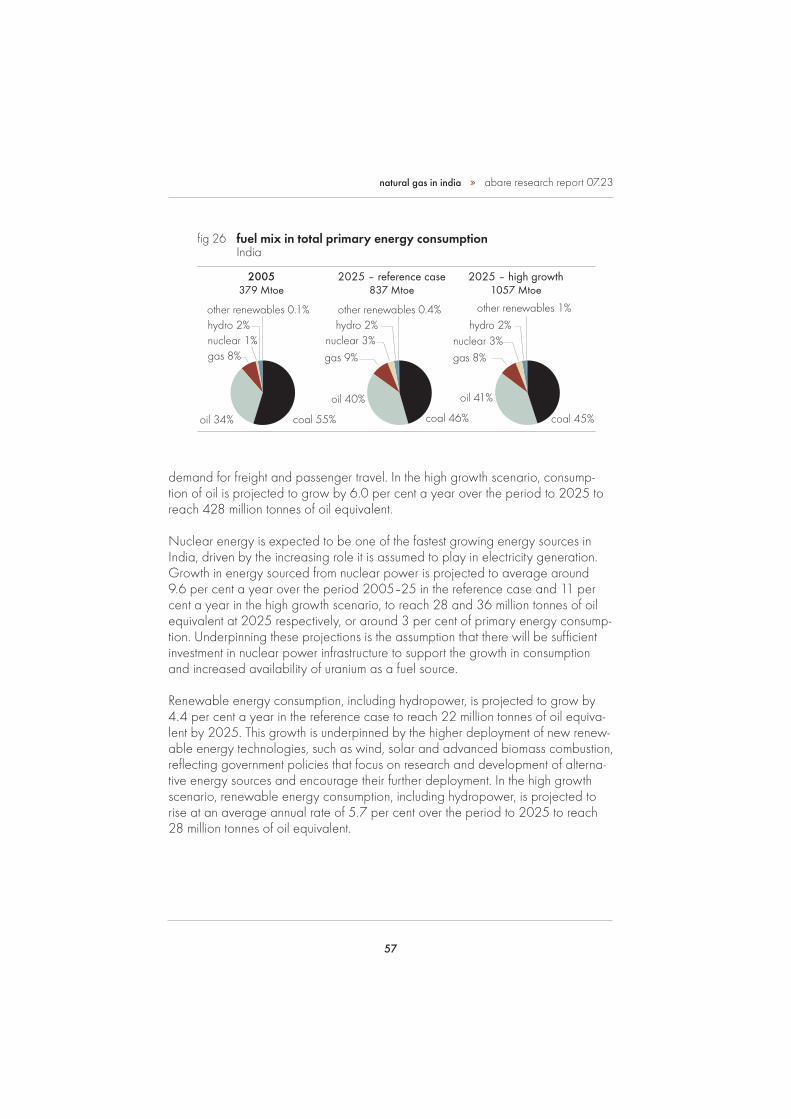
57
natural gas in india » abare research report 07.23
demand for freight and passenger travel. In the high growth scenario, consump-tion of oil is projected to grow by 6.0 per cent a year over the period to 2025 to reach 428 million tonnes of oil equivalent.
Nuclear energy is expected to be one of the fastest growing energy sources in India, driven by the increasing role it is assumed to play in electricity generation. Growth in energy sourced from nuclear power is projected to average around 9.6 per cent a year over the period 2005–25 in the reference case and 11 per cent a year in the high growth scenario, to reach 28 and 36 million tonnes of oil equivalent at 2025 respectively, or around 3 per cent of primary energy consump-tion. Underpinning these projections is the assumption that there will be suffi cient investment in nuclear power infrastructure to support the growth in consumption and increased availability of uranium as a fuel source.
Renewable energy consumption, including hydropower, is projected to grow by 4.4 per cent a year in the reference case to reach 22 million tonnes of oil equiva-lent by 2025. This growth is underpinned by the higher deployment of new renew-able energy technologies, such as wind, solar and advanced biomass combustion, refl ecting government policies that focus on research and development of alterna-tive energy sources and encourage their further deployment. In the high growth scenario, renewable energy consumption, including hydropower, is projected to rise at an average annual rate of 5.7 per cent over the period to 2025 to reach 28 million tonnes of oil equivalent.
2005379 Mtoe
2025 – high growth1057 Mtoe
2025 – reference case837 Mtoe
oil 34% coal 55%
other renewables 0.1%hydro 2%nuclear 1% gas 8%
oil 40%
coal 46%
other renewables 0.4%hydro 2%
nuclear 3% gas 9%
oil 41%
coal 45%
other renewables 1%hydro 2%
nuclear 3% gas 8%
fuel mix in total primary energy consumptionIndia
fig 26

58
natural gas in india » abare research report 07.23
2000
1000
500
1500
TWh
India
2005 2010 2015 2020 2025
reference caseother renewableshydronucleargasoilcoal
2005 2010 2015 2020 2025
high growth case projected electricity generation, by fuelfig 27
outlook for natural gas demand, by sector Total natural gas consumption in the reference case is projected to reach 82 billion cubic metres in 2025, and 99 billion cubic metres in the high economic growth scenario. The electricity sector is projected to remain a key driver of gas demand in India in the future. Electricity generation is expected to grow by 4.5 per cent a year over the period to 2025 to reach 1700 terawatt hours in the reference case, compared with 702 terawatt hours in 2005. In the high growth scenario, electricity consumption rises more rapidly, at 6.1 per cent a year to 2287 terawatt hours in 2025 (fi gure 27).
Gas fi red electricity generation is projected to grow at an average rate of 3.4 per cent a year in the reference case, to reach 127 terawatt hours in 2025. Natural gas consumption in the electricity sector is projected to be 23.4 billion cubic metres in that year, an increase of 64 per cent on the 2005 level. Despite this growth, the electricity sector’s share of total natural gas consumption is projected to decline to around a third in 2025 owing to higher projected growth in gas consumption in other sectors (fi gure 28). In the high growth scenario, gas fi red electricity generation is projected to increase by 5.6 per cent a year, to reach 192 terawatt hours in 2025. As a result, consumption of natural gas in the sector is projected to increase to 33.6 billion cubic metres in 2025.

59
natural gas in india » abare research report 07.23
The latest IEA projections (IEA 2007c) assume a higher share for gas in electricity generation in 2025 — 10 per cent — compared with 7 per cent in this study and in IEA (2006a). It is estimated that increasing the share of gas in electricity genera-tion to 10 per cent in this study could add around 10 billion cubic metres to gas consumption in 2025 in the reference case.
The competitiveness of natural gas against alternative petroleum based feedstock in the current high oil price environment, and continuing conversion of fertiliser plants to natural gas are expected to support strong growth in gas demand in the fertiliser sector. As a result, natural gas consumption in the sector is projected to grow at 5 per cent a year in the reference case, to reach 21.9 billion cubic metres in 2025. In the high growth scenario, gas use in the sector is projected to increase by 6 per cent a year to 25.9 billion cubic metres in 2025.
Natural gas consumption in other industries, such as the manufacturing, transport and agriculture sectors, is projected to increase at nearly 7 per cent a year in the reference case, to reach 32.1 billion cubic metres in 2025. The high rate of growth will be supported by increased gas availability and infrastructure and the ability of the sector to absorb higher cost sources of gas.
Gas demand is projected to grow fastest in the residential sector, at 10 per cent a year over the outlook period in the reference case, although the level of gas consumption in the sector will remain relatively low, at 5 billion cubic metres in
20
10
30
bm3
India
reference case
2005
2025
high growth case
residentialother industry
fertiliserelectricity residentialother industry
fertiliserelectricity
2015
natural gas consumption, by sectorfig 28

60
natural gas in india » abare research report 07.23
60
40
20
80
%
1995 202520152005
rural population
urban population
distribution of population between urban and rural areas Indiafig 29 2025. In the high growth scenario,
natural gas consumption in the sector reaches 6.5 billion cubic metres in 2025. Underpinning this increase in demand is the continued switch from coal and biomass to more convenient and clean fuels such as natural gas and electricity, driven by rising urbanisation in India. The United Nations projects that under its median scenario the percentage of India’s population living in urban areas will rise to 37 per cent by 2025, compared with 29 per cent in 2005 (fi gure 29; United Nations 2007).

61
natural gas supply considerations
Meeting the signifi cant potential for growth in natural gas demand in India will require a substantial increase in gas supplies. This could be achieved through a number of avenues, including an increase in domestic gas production, the construction of natural gas pipelines from international sources of supply, and the expansion of LNG imports. Each of these options has different cost profi les, energy security implications and other characteristics that will affect its contribution to India’s growing natural gas requirements over the medium to longer term.
domestic natural gas production As discussed in chapter 2, a number of domestic gas fi elds currently supply India’s gas requirements. Offshore fi elds, mainly the Mumbai High fi eld, produced around 22.6 billion cubic metres of gas (equivalent to 16.5 million tonnes of LNG) in 2005-06, around 70 per cent of India’s total gas production (MoPNG 2006b). Onshore fi elds, particularly in Gujarat, Assam and Andhra Pradesh, produced 9.6 billion cubic metres of gas (equivalent to 7.0 million tonnes of LNG) in 2005-06. While there has been some growth in natural gas production from onshore fi elds over the past decade, production from offshore fi elds peaked in 2003-04 and has since declined as resources in the Mumbai High gas fi eld are depleted.
A number of offshore natural gas discoveries in India over the past several years have increased the country’s gas reserves. The most notable recent fi nds have occurred in the Krishna Godavari (KG) basin located in the Bay of Bengal off India’s east coast. India’s total proved gas reserves are 1.1 trillion cubic metres and at current production rates will last for 34 years (BP 2007). This does not include many of the recent KG basin fi nds, which are yet to be proven.
The fi rst gas from the KG basin is due to be delivered onshore by the end of 2008, initially producing around 14.6 billion cubic metres of gas a year (equivalent to 10.7 million tonnes of LNG). In early 2007, a gas transport and gas sale and purchase agreement was signed between Reliance Industries Limited (RIL) and
5
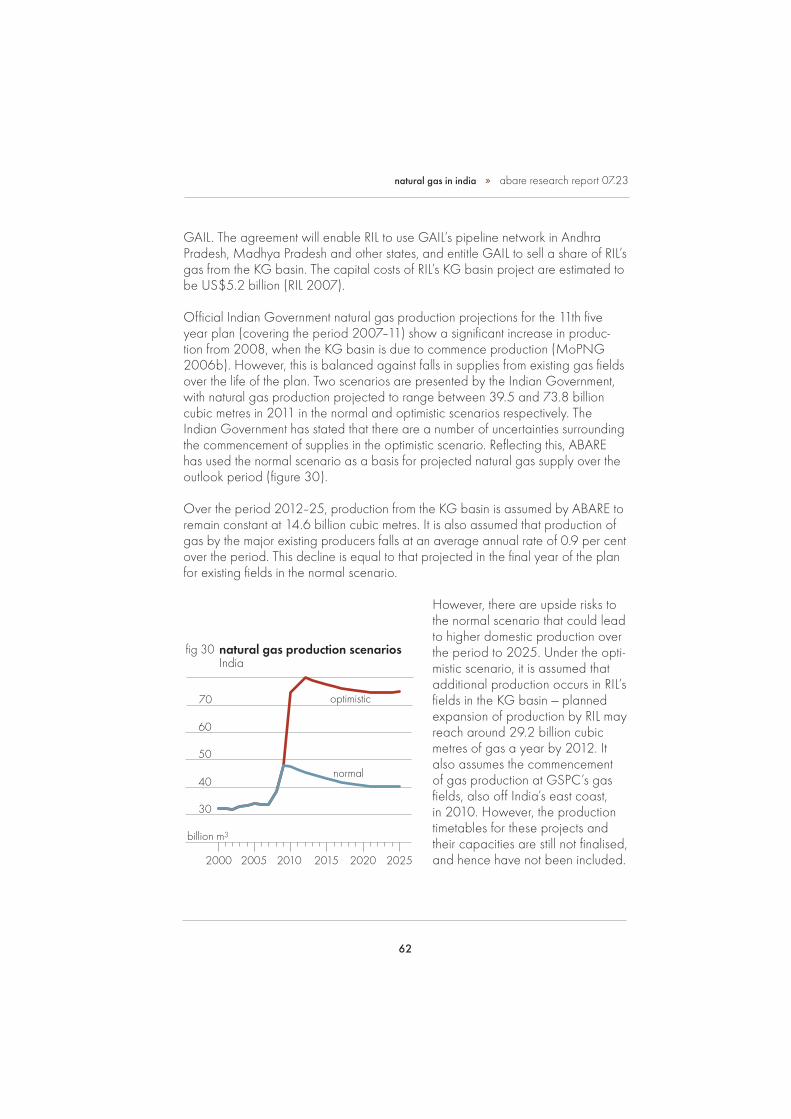
62
natural gas in india » abare research report 07.23
60
50
40
30
70
202520202000 2005 2010 2015
billion m3
optimistic
normal
natural gas production scenarios India fig 30
GAIL. The agreement will enable RIL to use GAIL’s pipeline network in Andhra Pradesh, Madhya Pradesh and other states, and entitle GAIL to sell a share of RIL’s gas from the KG basin. The capital costs of RIL’s KG basin project are estimated to be US$5.2 billion (RIL 2007).
Offi cial Indian Government natural gas production projections for the 11th fi ve year plan (covering the period 2007–11) show a signifi cant increase in produc-tion from 2008, when the KG basin is due to commence production (MoPNG 2006b). However, this is balanced against falls in supplies from existing gas fi elds over the life of the plan. Two scenarios are presented by the Indian Government, with natural gas production projected to range between 39.5 and 73.8 billion cubic metres in 2011 in the normal and optimistic scenarios respectively. The Indian Government has stated that there are a number of uncertainties surrounding the commencement of supplies in the optimistic scenario. Refl ecting this, ABARE has used the normal scenario as a basis for projected natural gas supply over the outlook period (fi gure 30).
Over the period 2012–25, production from the KG basin is assumed by ABARE to remain constant at 14.6 billion cubic metres. It is also assumed that production of gas by the major existing producers falls at an average annual rate of 0.9 per cent over the period. This decline is equal to that projected in the fi nal year of the plan for existing fi elds in the normal scenario.
However, there are upside risks to the normal scenario that could lead to higher domestic production over the period to 2025. Under the opti-mistic scenario, it is assumed that additional production occurs in RIL’s fi elds in the KG basin — planned expansion of production by RIL may reach around 29.2 billion cubic metres of gas a year by 2012. It also assumes the commencement of gas production at GSPC’s gas fi elds, also off India’s east coast, in 2010. However, the production timetables for these projects and their capacities are still not fi nalised, and hence have not been included.

63
natural gas in india » abare research report 07.23
As mentioned earlier, recent exploration has yielded signifi cant new gas reserves in the KG and other basins. There is also potential for other sources of domestic gas, such as coal seam methane (box 6). However, the existence of reserves alone will not necessarily translate into a substantial increase in gas production. Many of the new fi elds are in private hands. These investors will need certainty about pricing, infrastructure and the regulatory framework governing the gas market before development can occur.
cross border pipelinesIndia is located in a region with signifi cant reserves of natural gas. Several interna-tional pipelines have been under discussion in India for many years, including from Iran, Turkmenistan and Myanmar. There is considerable support in India among government and industry for the development of international natural gas pipelines for economic and strategic reasons, including its likely cost competitiveness and energy security concerns related to the sources of India’s energy supplies and the
box 6 coal seam methane potential in India
In addition to conventional natural gas reserves, coal seam methane (CSM) has emerged as an important alternative source of gas production in many countries. CSM can be extracted by drilling into coal seams to release the methane that is absorbed within them.
Given India’s substantial coal reserves, there is signifi cant potential to exploit the CSM located within these deposits. Recognising this, the Indian Government has awarded a number of exploration blocks for CSM over the past several years. Because of the infancy of the sector, there is little information on whether these areas will hold economically viable reserves of CSM.
India’s fi rst CSM project commenced production in Jharkhand in late 2007 (Argus Media Limited 2007). However, a number of uncertainties surround the startup of production at other CSM projects in India (Barrow Jonker 2007).
Future gas production from these sources has not been included in this study because of uncertainties surrounding the overall size of the reserves and the timing of production of those projects that have been proposed. However, given its poten-tial in India, CSM could provide a signifi cant additional source of domestic natural gas supply over the medium to longer term.

64
natural gas in india » abare research report 07.23
diversity of its fuel mix. Only the Iran–Pakistan–India pipeline project is considered to have potential as a source of supply to India over the period to 2025.
Iran–Pakistan–India pipeline
The Iran–Pakistan–India (IPI) pipeline was proposed more than a decade ago to transport gas from the Persian Gulf through southern Iran and Pakistan to link with existing pipeline infrastructure in north western India (map 3; EIA 2007b). Gas would be sourced from the South Pars/North Dome gas fi eld, which straddles the territory of Iran and Qatar in the Persian Gulf. The current proposed pipeline route is around 2800 kilometres in length.
The Iranian share of the gas fi eld is estimated to contain around 13 trillion cubic metres of gas (Omidvar 2007). The volume of gas supplied by the IPI pipeline could reach 55 billion cubic metres a year. India has sought around 37 billion cubic metres (equivalent to 27 million tonnes of LNG), roughly equal to its current supply from domestic sources, while Pakistan would take around 18 billion cubic metres (Platts 2007e).
The Indian Government is optimistic that the IPI pipeline could begin delivering gas to India by around 2015 (MoPNG 2006a). However, since the inception of the project, a number of factors have caused substantial delays in its commencement. These include disagreements related to gas pricing between India and Iran, as well as capital cost increases to around US$7 billion (Platts 2007e). In addition, geopolitical tensions in India–Pakistan relations, international concerns over trade with Iran, as well as domestic opposition in Iran to gas exports, have also hindered progress (box 7). The signifi cant hurdles associated with the project, the potential for further delays, the lengthy construction period and high capital costs heighten the uncertainty surrounding a potential startup date. In this study, it is assumed that the project will not be operational until sometime after 2020.
other proposed pipelines
Other potential sources of pipeline natural gas to India considered by the govern-ment and industry have included the Turkmenistan–Afghanistan–Pakistan–India (TAPI) pipeline and the Myanmar–Bangladesh–India (MBI) pipeline (table 13). The TAPI pipeline proposal would source gas from the Dauletabad fi eld in south east Turkmenistan and follow a route through Afghanistan and Pakistan to India. While Turkmenistan has indicated that it supports the pipeline (Platts 2007f), ques-tions remain as to the project’s viability and security owing to the confl ict in Afghan-istan. There is also some uncertainty about the extent of the fi eld’s gas reserves.
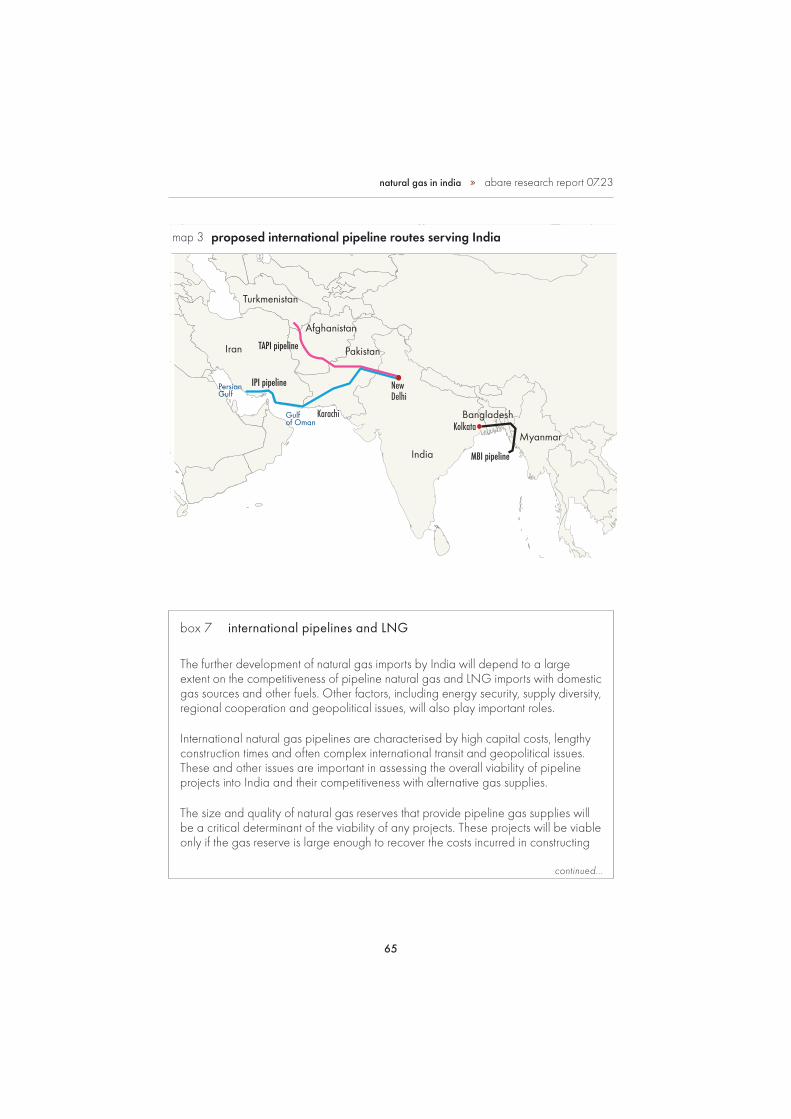
65
natural gas in india » abare research report 07.23
Iran
Afghanistan
Pakistan
Myanmar
Bangladesh
Turkmenistan
India
Persian Gulf
Gulfof Oman
proposed international pipeline routes serving Indiamap 3
box 7 international pipelines and LNG
The further development of natural gas imports by India will depend to a large extent on the competitiveness of pipeline natural gas and LNG imports with domestic gas sources and other fuels. Other factors, including energy security, supply diversity, regional cooperation and geopolitical issues, will also play important roles.
International natural gas pipelines are characterised by high capital costs, lengthy construction times and often complex international transit and geopolitical issues. These and other issues are important in assessing the overall viability of pipeline projects into India and their competitiveness with alternative gas supplies.
The size and quality of natural gas reserves that provide pipeline gas supplies will be a critical determinant of the viability of any projects. These projects will be viable only if the gas reserve is large enough to recover the costs incurred in constructing
continued...

66
natural gas in india » abare research report 07.23
box 7 international pipelines and LNG continued
the pipeline and in bringing the gas to end markets. If clusters of reserves are located near the original development, this may increase the lifespan and viability of the project. The gas base must also be dependable, as continuity of supply is an essential issue not only for producers but also for fi nanciers and other parties involved in the project. While Iran, for instance, has large gas reserves, signifi cant volumes of gas designated for export could be diverted for injection into maturing oilfi elds to stabilise production and to fuel its own domestic energy needs.
Because of the high capital costs of fi nancing pipeline projects, access to fi nance could be an important determinant of their viability. This could involve domestic as well as foreign capital. Well defi ned legal, taxation, and foreign exchange systems will be important in terms of encouraging the appropriate fl ow of foreign funds. For example, access to global fi nance for an international pipeline originating in Iran and transiting Pakistan may be diffi cult owing to ongoing tensions between India and Pakistan as well as international sanctions against Iran and concerns about its nuclear program.
Transit fees, either fi nancial or in kind through physical deliveries of gas, can add substantially to gas pipeline transit costs, particularly if the pipeline must traverse more than one country. In the case of the Iran–Pakistan–India pipeline, the transit issue is compounded by the geopolitical situation surrounding the relationship with Pakistan, which could add to risks for the security of gas supplies. Negotiations over transit fees have been delaying the project, and these are still ongoing.
Distance and volume are the key variables that affect the unit cost of transporting LNG and pipeline gas. For both forms of transport, unit costs increase with distance and decrease with the volume of gas being transported. Over shorter distances, pipelines tend to be the more cost effective form of gas transport. The point at which transporting LNG via tanker is cheaper than transporting natural gas via pipelines occurs at a distance of around 2000 kilometres for offshore pipelines and 3800 kilometres for onshore pipelines (EIA 2003). On this basis, the IPI and other regional pipelines are likely to be competitive with LNG imports.
However, there are other reasons why LNG might be preferred over pipeline supply options. These include the fact that LNG supply can be more fl exible — smaller amounts of gas usually can be delivered more cost effectively by LNG than by pipeline. This means that LNG projects can build delivery capacity in line with an expanding market whereas pipelines will be underutilised and potentially uneconomic until maximum capacity is reached. In addition, delivery lead times tend to be shorter for LNG projects than for pipeline projects. For countries where energy security concerns are important, such as in India, LNG offers the opportunity to have a diverse portfolio of suppliers, as well as minimising risks of potential gas supply disruptions.

67
natural gas in india » abare research report 07.23
In the case of the MBI pipeline, while offi cials from all countries have agreed in principle to support the export of natural gas to India, the emergence of China as a foundation customer for Myanmar pipeline gas exports is likely to divert gas away from India. This pipeline to India is not expected to proceed.
existing LNG import contractsAs discussed in chapter 2, India currently has one long term LNG supply contract — between Petronet and Qatar’s Ras Laffan LNG company for the phased supply of 7.5 million tonnes a year, with 5.0 million tonnes contracted from 2004 to 2009 and the full volume from 2009 to 2029. While other long term agreements have also been signed, including with Iran, these agreements have not been fi nalised and have not been included in the study.
natural gas supply and demand balance In the next few years, India will continue to require additional LNG imports above contracted levels, most likely in the form of spot cargoes or short term contracts. The expected commencement of production from the KG basin in late 2008 will substantially increase domestic gas availability and, assuming no delays, is likely to reduce requirements for signifi cant additional LNG imports until early next decade. In the reference case, the requirement for additional gas is projected to reach around 4.0 billion cubic metres a year (2.9 million tonnes) in 2015. This is projected to expand to 18.6 billion cubic metres a year (13.6 million tonnes) in 2020 and 31.6 billion cubic metres (23.1 million tonnes) in 2025 (fi gure 31; table 14).
table 13 potential international gas pipeline projects, India
project length cost volume volume km US$b bcm/yr Mt of LNG equiv./yr
Iran–Pakistan–India (IPI) pipeline 2 775 7 55 40.1Turkemenistan–Afghanistan– Pakistan–India (TAPI) pipeline 1 900 4–5 31 22.6Myanmar–Bangladesh–India (MBI) pipeline 950 2 5–10 3.7–7.3Sources: Platts (2007e,f).

68
natural gas in india » abare research report 07.23
table 14 potential gas demand and supply balance – India
2015 2020 2025 2015 2020 2025 billion m3 billion m3 billion m3 Mt Mt Mt
assumed natural gas supplycontracted LNG supply 10.4 10.4 10.4 7.5 7.5 7.5domestic gas supply 43.1 40.6 40.5 31.5 29.6 29.6pipeline gas from Iran 0 0 37.0 0 0 27.0total 53.4 51.0 87.8 39.0 37.2 64.1
projected natural gas consumption – reference case 57.4 69.5 82.4 41.9 50.8 60.2– high growth scenario 60.4 78.1 99.0 44.1 57.0 72.3
gas supply shortfall/possible additional LNG – including pipeline gas from Iran– reference case 4.0 18.6 – 2.9 13.6 –– high growth scenario 6.9 27.1 11.2 5.1 19.8 8.2
gas supply shortfall/possible additional LNG – excluding pipeline gas from Iran– reference case 4.0 18.6 31.6 2.9 13.6 23.1– high growth scenario 6.9 27.1 48.2 5.1 19.8 35.2
total LNG imports – excluding pipeline gas from Iran– reference case 14.4 28.9 41.9 10.5 21.1 30.6 – high growth scenario 17.3 37.4 58.5 12.6 27.3 42.7
60
40
20
80
60
40
20
80
bm3 bm3
India
reference case high growth case
2025Iran
pipeline
2025no Iran pipeline
202020152005 2025Iran
pipeline
2025no Iran pipeline
202020152005
pipeline gas from Irangas supply shortfall/additional LNG
actual gas consumption domestic gas supply contracted LNG supply
potential gas demand and supply fig 31

69
natural gas in india » abare research report 07.23
This would need to be met by increased gas production or, more likely, increased gas imports. Assuming that this additional gas will all be sourced from LNG, India’s total LNG imports are projected to reach 10.5 million tonnes in 2015 and 21.1 million tonnes in 2020. The introduction of imported pipeline gas from Iran by 2025 could meet the gas import requirements in that year. However, if the pipeline does not proceed by then, India’s total LNG imports could reach 30.6 million tonnes in 2025 (fi gure 32).
In the high growth scenario, the requirement for additional gas is projected to reach 6.9 billion cubic metres (5.1 million tonnes) in 2015, growing to 27.1 billion cubic metres (19.8 million tonnes) in 2020. Assuming this is all sourced from LNG, India’s total LNG imports would be 12.6 million tonnes in 2015, rising to around 27.3 million tonnes in 2020. If the pipeline from Iran does not proceed by 2025, total LNG imports could reach 42.7 million tonnes in that year.
The signifi cant uncertainties over the Indian gas market — such as domestic gas production potential and timing, the timing and likelihood of pipeline gas imports, the pace of India’s gas market reform, gas pricing, as well as more general economic growth and energy mix uncertainties — make projecting LNG imports diffi cult. For example, downside risks for LNG imports include higher than projected domestic production, lower than anticipated growth in India’s gas
30
40
20
Mt
India
reference case
10
high growth case
2025no Iranpipeline
202020152006 2025no Iranpipeline
202020152006
potential LNG importsfig 32

70
natural gas in india » abare research report 07.23
consumption and the early delivery of gas from international pipelines. Upside risks that could increase the requirement for additional LNG imports include higher than anticipated growth in India’s gas consumption, lower than expected domestic production or delays in the startup of newly discovered gas fi elds and delays in developing the regulatory and physical infrastructure to support the delivery of gas to consumers throughout India. The timing of the construction of the IPI pipeline would also decrease/increase the requirements for LNG imports substantially.
Any expansion in natural gas supply, either domestic gas or pipeline gas imports, in India beyond that assumed in this study may translate into higher consumption, rather than reduced LNG imports, as more customers gain access to natural gas supplies.
LNG import infrastructureA number of expansions to existing LNG terminals and construction of additional terminals are planned in India. LNG import capacity is currently around 8.9 million tonnes and is expected to expand to 13.9 million tonnes once the Dabhol terminal is completed in 2009. A planned expansion of the Dahej terminal in 2010 could raise India’s total LNG import capacity to 17.4 million tonnes and an expansion at
the Hazira terminal in Gujarat is also possible given the infrastructure that is present at the site (table 15).
In addition to expansions to existing terminals, the construc-tion of a number of new LNG terminals is under consid-eration. Of these, proposed terminals at Kochi (2.5 million tonnes) and Mangalore (2.5 million tonnes) appear to be the most advanced. The Kochi terminal is planned to come on line around 2010 and the Mangalore terminal around 2011. Other LNG terminal projects have also been
table 15 LNG terminals in India
year of terminal status completion capacity Mt
Dahej operational 2004 6.5 aHazira operational 2005 2.4 bDabhol under construction 2009 5.0Dahej expansion planned 2010 3.5Kochi planned 2010 2.5Mangalore planned 2011 2.5
total 22.4 ca Includes debottlenecking that increased capacity in early 2007. b Current throughput capacity at Hazira is 2.4 million tonnes but an expansion to 5.0 million tonnes would be possible using existing infra-structure and an increase to 10.0 million tonnes would be possible with the construction of additional LNG storage tanks. c Does not include any possible expansion at Hazira.

71
natural gas in india » abare research report 07.23
proposed over the past decade, but appear to have been put on hold for the time being, including Kakinada and Ennore.
This existing and planned LNG terminal capacity should be adequate to meet India’s gas requirements to 2025. However, proposed LNG import capacity will not automatically translate into additional LNG imports. Most of the planned capacity is not likely to materialise until long term contracts with LNG suppliers, and also buyers, are in place. The potential volume of additional gas required — LNG or other sources — will provide a challenge for India in the coming years. It suggests that new LNG contracts, for medium or long term duration, will be required.
Buyers in India appear to be delaying entering into new long term LNG contracts until the regulatory framework for gas supply and pricing is clearer. As discussed in chapter 2, under current arrangements India’s power and fertiliser sectors are guaranteed prices at well below world market levels. Buyers in India will need to be willing to pay higher prices, like some independent power producers and industrial users currently are, otherwise India’s LNG supply options may be limited. Some of the delays may also be because buyers are waiting to see if international gas prices remain at their current highs.
international LNG outlookIndia’s geographic location in south Asia and its proximity to both the Asia Pacifi c and the Middle East makes suppliers in that region a logical choice for Indian
world LNG tradefig 33
25
Mt
50
75
100
125
150
25
50
75
100
125
150
Mt
imports
Atlantic
China
India
Chinese Taipei
Korea
Japan
exports
2002 2004 20062002 2004 2006
AtlanticAlaskaotherUAEBruneiOmanAustraliaQatarMalaysiaIndonesia

72
natural gas in india » abare research report 07.23
LNG customers. In 2006, India took cargoes of LNG from suppliers in Qatar, Oman, Australia, Malaysia and Abu Dhabi, accounting for 6 per cent of the Asia Pacifi c LNG market. India also purchased spot LNG cargoes from suppliers outside the region, including Algeria, Egypt and Trinidad and Tobago.
World LNG trade was 154 million tonnes in 2006 (fi gure 33; BP 2007; FGE 2007). While Asia Pacifi c and Middle East supplies dominate world LNG trade, there has been substantial growth in supplies from the Atlantic basin.
A trend over the past decade has been the growing impor-tance of the Middle East as a source of LNG exports. In particular, LNG export capacity in Qatar, the world’s largest LNG producer, has risen to 26 million tonnes a year (14 per cent of world exports).
There are currently fourteen LNG plants in the eight countries that supply the Asia Pacifi c market on a regular contractual basis (table 16). Qatar has the largest LNG operating capacity, followed by Indonesia, Malaysia and Australia. Collectively, the total capacity of all existing plants as at June 2007 was about 123 million tonnes a year. The Asia Pacifi c is also supplied from Algeria, Nigeria, Trinidad and Tobago, Egypt and other counties on a short term or spot basis, with these countries becoming increas-ingly regular suppliers to the region.
table 16 existing LNG plants – Asia Pacifi c market
number of operatingcountry project trains capacity Mt /yrAsia Pacifi c Australia North West Shelf 4 11.9 Darwin 1 3.7Brunei Darussalam Lumut 5 7.2Indonesia Arun 6 6.8 Bontang 8 22.5Malaysia Bintulu MLNG I 3 8.1 Bintulu MLNG II 3 7.8 Bintulu MLNG III 2 6.8Oman Oman LNG 2 6.6 Qalhat LNG 1 3.7Qatar Qatargas 3 10.0 Rasgas 5 20.7United Arab Emirates Das Island 3 5.8United States Alaska 1 1.3
total 44 122.9
other suppliers to the region a Algeria Arzew 3 1.7 Bethioua 12 16.1 Skikda 3 3.0Egypt Damietta 1 5.0 Ikdu 2 7.2Trinidad and Tobago Point Fortin 4 15.0
total 25 48.0a Do not have long term contracts in the region.

73
natural gas in india » abare research report 07.23
Demand for LNG in the international market has been strong and this is expected to continue over the outlook period, driven by economic growth and electricity demand in traditional consuming markets, such as Japan, Korea and Chinese Taipei. In addition, the emergence of India and China as LNG importers is expected to underpin demand growth in the global market. The potential for new consumers to enter the Asia Pacifi c market for LNG, such as the west coast of the United States, New Zealand, Thailand and Singapore, also has the potential to provide support for demand growth over the medium to longer term.
Refl ecting the robust outlook for gas demand in the region, there are a number of new gas supply projects under construction. Liquefaction plants under construction in the Asia Pacifc region include Australia’s North West Shelf Train 5, and others in Indonesia, Qatar, the Russian Federation and Yemen (table 17). Together these projects could deliver an additional 81.4 million tonnes a year, with start dates from late 2007 to 2010. Much of this LNG is already contracted to Europe, Japan and Korea. The projects may be able to meet Indian demand for spot cargoes but long term contract opportunities for India may be limited.
Other LNG liquefaction projects are at various stages of planning and approval. These include several in Australia and others in Brunei Darussalam, Indonesia, Papua New Guinea and Iran (table 17). Realisation of these plans would result in an increase in LNG production and export capacity of around 85 million tonnes by 2015. Despite the outlook for strong LNG demand over the medium to longer term, a number of producers face high raw material prices, long lead times for equipment and a shortage of skilled labour. These factors may act as constraints in the short to medium term on the commencement of a number of projects. In addition, new LNG plants are unlikely to begin construction without the existence of long term contracts with buyers and many have already had their start dates extended several times.
Supply has been tight in the Asia Pacifi c region in recent years because of a number of constraints in the LNG chain. These issues include long lead times for gas projects, input cost pressures — including labour and materials — as well as concerns about the availability of natural gas feedstock for certain LNG plants. In addition, declining gas feedstock from mature fi elds — particularly in Indonesia — has partially offset LNG production increases in Qatar and Australia. These shortages have resulted in suppliers from outside the Asian region, including from Egypt, Algeria, Nigeria and Trinidad and Tobago, entering the market to sell LNG on a spot or short term basis. Along with strong demand, tight supply has also resulted in high prices for spot cargoes — Japan received three cargoes from Egypt

74
natural gas in india » abare research report 07.23
in October 2007 for US$11.24 per million British thermal units, compared with Japan’s average LNG import price for 2007 (January to October) of US$7.40 per million British thermal units (FGE 2007b).
Given the tight supply–demand balance for LNG over the medium term, India will face competition from established and new buyers for limited cargoes.
table 17 LNG plants under construction and planned – Asia Pacifi c market
number of startup operating country project trains date a capacity Mt/yrprojects under construction Australia North West Shelf Train 5 1 2008 4.4 Pluto 1 2010 4.8Indonesia Tangguh 2 2009 7.6Malaysia MLNG II debottleneck na 2007 1.4Russian Federation Sakhalin II 2 2008 9.6Qatar Qatargas II Trains 4 and 5 2 2008 15.6 Qatargas III Train 6 1 2009 7.8 Qatargas IV Train 7 1 2010 7.8 RasGas III Train 6 and 7 2 2009 15.6Yemen Yemen LNG 2 2009 6.8
total 14 81.4
projects planned or proposed Australia Browse 2 2013+ up to 15.0 Gorgon 2 2012 10.0 Ichthys 1 2013+ 6.0 Pilbara 1 2013+ 5.0 Darwin LNG expansion 2 2015+ 5.0 Santos Gladstone LNG 1 2014 up to 4.0 Arrow Energy / LNG International 1 2010 1.0Brunei Darussalam Lumut Train 6 1 2010 5.0Indonesia Sulawesi LNG 1 2009 2.5Iran Pars LNG 2 2011+ 10.0 Persian LNG 2 2011+ 16.0Papua New Guinea Liquid Nuigini Gas 2 2012 up to 5.0
total 18 84.5a As published by project proponents and industry publications.

75
natural gas in india » abare research report 07.23
A range of factors will infl uence the competitiveness of alternative potential LNG suppliers into the Indian market. Transport costs will be one factor and these are affected to a large extent by distance. With India’s geographic proximity to LNG suppliers in the Middle East, suppliers in that area are likely to have transport cost advantages over other LNG suppliers. Refl ecting this, India has been seeking to secure LNG from new suppliers in the Middle East such as Iran and Yemen. Other factors — such as availability of future LNG supplies, reliability, fl exibility and diver-sity, as well as the opportunity to secure equity in gas fi elds — will also play a role in determining the overall attractiveness of suppliers.
prospects for Australian LNG To date, Australia has had a limited role in supplying LNG to India, with trade restricted to several spot cargoes. India’s growing gas requirements and desire for diversity in gas supply sources, and Australia’s potential to expand its LNG exports may lead to an expansion in Australian and Indian gas links over the outlook period.
natural gas reserves
Australia has abundant supplies of natural gas, with reserves located in all Australian states and the Northern Territory. Identifi ed gas reserves have increased fourfold over the past two decades owing to extensive exploration and discoveries. As at 1 January 2006, Australia’s economically demonstrated conventional gas resources were 2429 billion cubic metres (equivalent to 1773 million tonnes of LNG). At current production rates, there are suffi cient economi-cally demonstrated resources of gas to sustain production at current levels for around 58 years (Geoscience Australia 2007).
Most major natural gas reserves are located offshore and far from major domestic markets. The gas basins with the largest recoverable reserves are the Carnarvon and Browse basins in Western Australia and the Bonaparte basin which straddles Western Australia and the Northern Territory (map 4). Together these three basins account for more than 90 per cent of Australia’s conventional gas reserves.
In addition to its substantial conventional natural gas reserves, coal seam methane (CSM) has emerged as an important new source of gas production in Australia. Stored within coal seams, CSM is found in the Bowen and Surat basins in Queens-land and a number of areas in New South Wales, including the Sydney basin. As

76
natural gas in india » abare research report 07.23
Gippsland Basin
Basin
n
Amadeus Basin
BassBasin
Carnarvon
Oil and gas basins
Perth Basin
Carnarvon Basin
Browse Basin
Otway Basin
Bowen/Surat
Bonaparte Basin
Cooper/EromangaBasin
Adavale Basin
Joint Petroleum Development Area
Gas processing
Existing natural gas pipelines
Natural gas pipelines under construction
LNG export terminals – existing/under construction
WOLLONGONGSYDNEY
MELBOURNE
HOBART
scale in kilometres4002000 800600
PERTH
PORT KEMBLA
BRISBANE
DARWIN
ADELAIDE
Australia’s natural gas reserves and infrastructuremap 4
at 31 December 2006, Australia’s CSM reserves were around 218 billion cubic metres (Energy Quest 2007).
gas production and exports
Natural gas production in Australia has grown steadily over the past two decades to reach 43.2 billion cubic metres in 2006 (equivalent to 31.5 million tonnes of LNG). This represents average annual growth of around 5.5 per cent since 1986. The domestic market absorbs around 55 per cent of Australia’s gas production (fi gure 34).
Australia also exports LNG. It currently has two gas liquifaction plants — the North West Shelf, located at Karratha in Western Australia, and Darwin LNG in the

77
natural gas in india » abare research report 07.23
Northern Territory. The North West Shelf commenced operations in 1989 and has four trains, with 11.9 million tonnes in capacity. The Darwin LNG 3.7 million tonne fi rst train came online in early 2006. Australia’s total LNG export capacity is 15.6 million tonnes.
In 2006, Australia’s LNG exports were 13.8 million tonnes, with the strong growth in that year refl ecting the startup of new capacity. In 2006, Australia was the world’s fi fth largest LNG exporter and accounted for 9 per cent of world LNG trade. Around 87 per cent of Australia’s LNG exports in 2006 were to Japan, refl ecting long term supply contracts. In 2006, Australia also exported LNG to the Republic of Korea, Chinese Taipei, India and China. Spot LNG trade with India accounted for less than 1 per cent of the total (fi gure 35; BP 2007).
outlook for Australian LNG supply
Australia’s LNG exports are expected to grow strongly over the period to 2025 on the basis of new liquefaction capacity under
40
30
20
10
200619971970 1979 1988
billion m3
gas production
LNG exports
Australian gas production and LNG exportsfig 34
12
6
4
2
10
8
Mt
2002 2003 200620052004
other IndiaChinaKorea Japan
Australian LNG exports, by destination
fig 35
20
10
40
30
Mtplannedunder
constructionexisting
outlook for LNG capacity in Australia
fig 36

78
natural gas in india » abare research report 07.23
construction and proposed (fi gure 36). Australia has two LNG projects under construction. The North West Shelf 4.4 million tonne fi fth train is expected to come online in late 2008. In addition, the fi nal investment decision for Woodside Energy’s Pluto LNG project has been announced and the single train of up to 4.8 million tonnes is due for completion in 2010. This will increase Australia’s LNG export capacity to around 24.8 million tonnes. Most of this capacity is under-pinned by long term contracts with Japan, but some volumes are likely to be avail-able for spot trade or further long term contracts.
Projects at various stages of planning include Browse, Gorgon, Ichthys, Pilbara and the Darwin LNG expansion, all located off the north west coast of Australia. In addition, two projects based in Gladstone in Queensland are proposed based on CSM as gas feedstock for LNG production. Together these projects account for 46.0 million tonnes, around three times Australia’s current capacity.
There is potential for Australian projects to supply LNG to India on a spot or long term basis as Australia is likely to be an attractive supplier of LNG to India. Together with abundant reserves of natural gas, Australia has a reputation for reliable delivery, is politically stable and support for exports of natural gas. In addi-tion, current projects have demonstrated an ability to offer fl exible supply condi-tions. However, given the large capital costs of new LNG projects, the develop-ment of increased capacity is likely to require signing of some long term contracts with customers, such as those in India.
There is also potential for further cooperation between Australia and India, espe-cially related to research and development and technology sharing. For example, Australia is successfully using its CSM resources as an alternative source of gas supply. As there is strong potential for the development of CSM resources in India, opportunities exist between the two countries to collaborate on technology and expertise on future projects. There may also be opportunities to invest in both upstream and downstream gas sectors in both countries.

79
conclusions
Ongoing growth in India’s economy and population has led to a signifi cant expan-sion in energy consumption in India. Energy consumption is expected to continue to grow strongly over the period to 2025. Meeting this growth will pose signifi cant challenges for India, particularly as there is already signifi cant pressure on elec-tricity supply systems and fuel availability in many parts of the country.
While coal and oil will continue to dominate India’s energy mix, natural gas, including imports of LNG, will play an important role. Given assumptions about economic and population growth and the fuel mix in electricity generation, natural gas consumption is projected to reach 82 billion cubic metres in 2025 and 99 billion cubic metres under a high economic growth scenario, compared with 32 billion cubic metres in 2005. This growth will be underpinned by increased use of gas in industry, the electricity sector, and to a lesser extent, in households. If the share of gas in electricity generation is higher than assumed in this study, then future gas consumption is likely to be even higher.
Realising the potential growth in gas consumption will depend on the availability and competitiveness of natural gas supplies compared with other fuel sources and the rate of development of infrastructure for gas supply and transmission. Consump-tion of gas in India to date has been limited by the availability of gas supplies. While there is potential for gas production in India to increase substantially, there are a number of risks that may continue to hinder the availability of gas.
Although gas market reforms are occurring in India, major natural gas consumers, principally the electricity and fertiliser sectors, continue to pay gas prices that are considerably below world prices. The ability of consumers that rely on subsidised gas prices to adjust to market determined prices may affect the penetration of gas in the Indian market over the period to 2025. In addition to further regulatory reforms in the gas market, signifi cant investment in gas transmission and distribution infrastructure will also be necessary to bring increased gas supplies to market.
Later this decade, India’s domestic gas production is projected to increase as supplies from the Krishna–Godavari basin come online, delaying the need for signifi cant additional LNG imports. However, in the absence of substantial addi-tions to India’s domestic gas production over the medium to longer term, India will
6

80
need to source additional gas supplies as imported LNG or from international pipeline gas sources to meet its projected consumption growth.
In ABARE’s reference case, the requirement for additional gas imports is projected to reach around 4.0 billion cubic metres a year (equivalent to 2.9 million tonnes of LNG) in 2015. This is projected to expand to 18.6 billion cubic metres a year (13.6 million tonnes) in 2020 and 31.6 billion cubic metres (23.1 million tonnes) in 2025. Assuming this is all met by LNG, total LNG imports could reach 10.5 million tonnes in 2015 and 21.1 million tonnes in 2020. After 2020, the requirement for additional LNG imports could be affected by the potential commencement of the Iran–Pakistan–India pipeline, which faces signifi cant hurdles to overcome before it is built. Any delays in the development of domestic gas or other import sources will provide opportunities to further expand LNG imports.
While the planned increase in regional LNG capacity is signifi cant, India is likely to face competition in the short and medium term from major LNG consuming countries that seek LNG cargoes and are willing to pay high prices. For India to procure the additional LNG it is likely to require, it will need to be willing to pay international prices.
While Australia currently has only supplied a small number of spot LNG cargoes to India, there are a number of opportunities for future cooperation between India and Australia in relation to gas. Australia has plans for a signifi cant expansion in LNG export capacity that could potentially supply India on a long term competi-tive basis. An increase in bilateral investment in both upstream and downstream gas infrastructure, as well as in gas exploration in both Australia and India, could also be facilitated by a deeper understanding of the potential opportunities that exist in each country. Australia also has expertise in the area of coal seam methane development, which is a potential additional source of gas supply in India over the longer term.

81
natural gas in india » abare research report 07.23
references
ADB (Asian Development Bank) 2005, ADB Signs $400 Million Loan to Upgrade India’s Power Transmission Grid, Manila (www.adb.org/Documents/News/INRM/inrm200511.asp).
—— 2006, Key Indicators 2006: Measuring Policy Effectiveness in Health and Education, Manila.
Argus Media Limited 2007, ‘India makes coal-bed gas debut’, Argus Asia Gas and Power Monthly, vol. VII, issue 8, August, p. 6.
Barlow Jonker 2007, ‘Title issues stretch Jharkhand timetable’, International Coal Seam Gas, issue 85, July, p. 5.
BP 2007, Statistical Review of World Energy, London, June.
CEA (Central Electricity Authority) 2006, All India Electricity Statistics: General Review 2006, Ministry of Power, Government of India, New Delhi.
De, A.K. 2004, ‘Development of CNG infrastructure in India with special refer-ence to National Capital Territory of Delhi’, Indraprastha Gas Limited, Speech at the Second Asia Gas Buyers’ Summit, Mumbai, 3 February.
DoF (Department of Fertilisers) 2007a, Annual Report 2006-2007, Government of India, New Delhi.
—— 2007b, Report of the Working Group on Fertiliser Industry for the XI Plan, Government of India, New Delhi.
DGH (Directorate General of Hydrocarbons) 2007, Coalbed Methane Explora-tion in India, Government of India, New Delhi (www.dghIndia.org).
EIA (Energy Information Administration) 2003, The Global Liquefi ed Natural Gas Market: Status and Outlook, Washington DC, July.
—— 2007a, International Energy Outlook 2007, Offi ce of Integrated Analysis and Forecasting, US Department of Energy, Washington DC, June.
—— 2007b, Country Analysis Briefs, Iran, US Department of Energy, Washington DC, October (www.eia.doe.gov/emeu/cabs/Iran/Full.html).
Energy Quest 2007, Energy Quarterly May 2007 Report, Adelaide, May.
FGE (Facts Global Energy) 2007a, Gas Databook I: Asia Pacifi c Natural Gas and LNG, Honolulu.

82
natural gas in india » abare research report 07.23
—— 2007b, Asia Pacifi c LNG Monthly, December
GAIL (India) Limited 2006, Winning Momentum: Annual Report 2005-06, New Delhi.
—— 2007, various web pages, New Delhi (www.gailonline.net).
Geoscience Australia 2007, Oil and Gas Resources of Australia, 2005, Canberra.
GGCL (Gujarat Gas Company Limited) 2007, various web pages, Ahmedabad (www.gujaratgas.com).
Government of India 2006, Integrated Energy Policy — Report of the Expert Committee, Report prepared for the Planning Commission, New Delhi, August.
ICRA Limited 2006, Indian Natural Gas Sector: Developments and Outlook, ICRA Rating Feature, New Delhi, August.
IEA (International Energy Agency) 2004, World Energy Outlook 2004, OECD, Paris.
—— 2006a, World Energy Outlook 2006, OECD, Paris.
—— 2006b, Gas Fired Power Generation in India: Challenges and Opportunities, OECD, Paris.
—— 2007a, Energy Balances of non-OECD countries, 2007 edn, OECD, Paris.
—— 2007b, Energy Balances of OECD countries, 2007 edn, OECD, Paris.
—— 2007c, World Energy Outlook 2007, OECD, Paris
—— 2007d, Natural Gas Information 2007, 2007 edn, OECD, Paris.
IGL (Indraprastha Gas Limited) 2007, various web pages, New Delhi (www.iglonline.net).
IMF (International Monetary Fund) 2007a, World Economic Outlook Database, Washington DC.
—— 2007b, International Financial Statistics, Washington DC (ifs.apdi.net/imf).
KPMG 2007, India Energy Outlook — 2007, KPMG in India, Mumbai (www.in.kpmg.com).
McKinsey and Co 2007, The ‘Bird of Gold’: the Rise of India’s Consumer Market, McKinsey Global Institute, San Francisco, May (www.mckinsey.com).
MGL (Mahanagar Gas Limited) 2007, various web pages, Mumbai (www.mahanagargas.com).

83
natural gas in india » abare research report 07.23
Matysek, A., Ford, M., Jakeman, G., Gurney, A. and Fisher, B.S. 2006, Tech-nology: Its Role in Economic Development and Climate Change, ABARE Research Report 06.6 Prepared for Australian Government Department of Industry, Tourism and Resources, Canberra, July.
MoC (Ministry of Coal) 2006, Annual Report 2005-2006, Government of India, New Delhi.
Ministry of Commerce and Industry 2007, India FDI Fact Sheet, March 2007 and October 2005 editions, Department of Industrial Policy and Promotion, New Delhi, May (dipp.nic.in/fdi_statistics/India_fdi_index.htm).
MoPNG (Ministry of Petroleum and Natural Gas) 2006a, Report of the Working Group on Petroleum and Natural Gas Sector for the XI Plan (2007–2012), Government of India, New Delhi.
—— 2006b, Basic Statistics on Indian Petroleum and Natural Gas 2005-06, Government of India, New Delhi.
—— 2007, various web pages, New Delhi (www.petroleum.nic.in).
OECD (Organisation for Economic Cooperation and Development) 2006, Envi-ronmental Compliance and Enforcement in India: Rapid Assessment, Paris.
Omidvar, H. 2007, ‘Iran details LNG liquefaction plans’, Oil and Gas Journal, vol. 105, issue 21, 4 June.
PLL (Petronet LNG Limited) 2007a, various web pages, New Delhi (www.petro-netLNG.com).
—— 2007b, Situation of the gas industry in India, Presentation by Managing Director and CEO, P. Dasgupta, New Delhi, 9 March.
PETROTECH Society and PwC 2007, Unfolding Horizons: Hydrocarbon Vision of India, New Delhi.
Planning Commission 2006, Towards Faster and More Inclusive Growth — An Approach to the 11th Five Year Plan, Government of India, New Delhi, December.
Platts 2007a, ‘India restarts Dabhol with new line’, International Gas Report, issue 581, 10 September, p. 23.
—— 2007b, ‘Asian, German banks lend to India’, International Gas Report, issue 581, 10 September, p.13.
—— 2007c, ‘Indian gas supplies hit new controversy’, Power in Asia, issue 487, 27 September, p. 5.

84
natural gas in india » abare research report 07.23
—— 2007d, ‘India pays $8/MMBtu for spot LNG’, International Gas Report, issue 572, 23 April, p. 28.
—— 2007e, ‘Iran exports to India on a JCC basis’, International Gas Report, issue 579, 30 July, p. 12.
—— 2007f, ‘Turkmenistan aims to triple gas output’, International Gas Report, issue 574, 21 May, p. 5.
Reserve Bank of India 2007, Economic outlook: some thoughts on Asia and India, Address by Dr Y.V. Reddy, Governor, Reserve Bank of India, Cernobbio, 30 March (www.rbi.org.in).
RIL (Reliance Industries Limited) 2007, Investor presentation — September 2007, Presentation at CLSA Investors’ Forum 2007, Hong Kong, 20 September (www.ril.com/rportal1/DownloadLibUploads/1190267229175_PRCLSA_Conf20092007.pdf).
Shell 2007, various web pages, London (www.shell.com).
TERI (The Energy and Resources Institute) 2006a, TERI Energy Data Directory and Yearbook 2004/05, TERI Press, New Delhi.
—— 2006b, National Energy Map for India — Technology Vision 2030, Offi ce of the Principal Scientifi c Adviser to the Government of India, New Delhi.
Thapa, B. and Kumar, S. 2006, The Indian Coal Sector: A Tale of Promises and Problems, World Coal, Palladian Publications Limited, Surrey, September.
United Nations 2007, World Population Prospects: The 2006 Revision, United Nations Department of Economic and Social Affairs, New York.
World Bank 2007, World Development Indicators Database, Washington DC.

85
07.07
Asia Pacifi c Economic Cooperation Secretariat
Association of Southeast Asian Nations Secretariat
AusAid
Australian Centre for Excellence in Risk Analysis
Australian Centre for International Agricultural Research
Australian Fisheries Management Authority
Australian Greenhouse Offi ce
Australian Government Department of the Environment and Water Resources
Australian Government Department of Resources, Energy and Tourism
Australian Government Department of Prime Minister and Cabinet
Australian Government Department of Transport and Regional Services
CRC – Plant Biosecurity
CSIRO (Commonwealth Scientifi c and Industrial Research Organisation)
Dairy Australia
Department of Business, Economic and RegionalDevelopment, Northern Territory
Department of Primary Industries, Victoria
Fisheries Research and Development Corporation
Fisheries Resources Research Fund
Forest and Wood Products Research and Development Corporation
Grains Research and Development Corporation
Grape and Wine Research and Development Corporation
Independent Pricing and Regulatory Tribunal
International Food Policy Research Institute
Meat and Livestock Australia
Murray Darling Basin Commission
National Australia Bank
NSW Sugar
Rural Industries Research and Development Corporation
University of Queensland
Wheat Export Authority
RESEARCH FUNDING ABARE relies on fi nancial support from external organ isations to complete its research program. As at the date of this publication, the following organisations had provided fi nancial support for ABARE’s research program in 2006-07 and 2007-08. We gratefully acknowledge this assistance.