prospector mountain - geology/gis...
TRANSCRIPT
Prospector Mountain
EVALUATING PORPHYRY COPPER POTENTIAL USING INTEGRATED DATASETS – PRELIMINARY
UPDATE

Located in Tintina Gold Belt, West Central YT; 88 km WNW Carmacks
Location
Historically explored principally for Epithermal Polymetallic Veins (Au-Ag-Pb-Zn-
Cu)
Porphyry potential never fully evaluated or explored for
Consists of 239 contiguous claims – NTS 115I/05; 100% owned by Alianza Minerals
Ltd. (formally Tarsis Resources Ltd.)
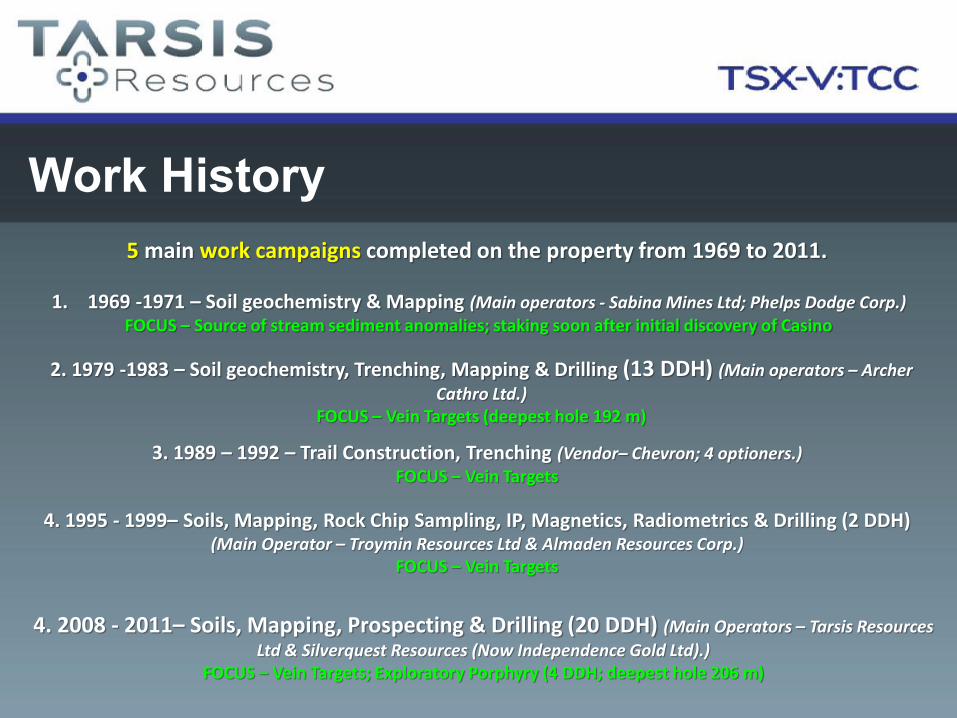
Work History 5 main work campaigns completed on the property from 1969 to 2011.
1. 1969 -1971 – Soil geochemistry & Mapping (Main operators - Sabina Mines Ltd; Phelps Dodge Corp.) FOCUS – Source of stream sediment anomalies; staking soon after initial discovery of Casino
2. 1979 -1983 – Soil geochemistry, Trenching, Mapping & Drilling (13 DDH) (Main operators – Archer
Cathro Ltd.) FOCUS – Vein Targets (deepest hole 192 m)
3. 1989 – 1992 – Trail Construction, Trenching (Vendor– Chevron; 4 optioners.)
FOCUS – Vein Targets
4. 1995 - 1999– Soils, Mapping, Rock Chip Sampling, IP, Magnetics, Radiometrics & Drilling (2 DDH) (Main Operator – Troymin Resources Ltd & Almaden Resources Corp.)
FOCUS – Vein Targets
4. 2008 - 2011– Soils, Mapping, Prospecting & Drilling (20 DDH) (Main Operators – Tarsis Resources
Ltd & Silverquest Resources (Now Independence Gold Ltd).) FOCUS – Vein Targets; Exploratory Porphyry (4 DDH; deepest hole 206 m)

Regional Geological Setting - 1 Prospector Mountain property forms part of
the regionally extensive, NW-SE trending polymetallic Dawson Range Mineral Belt that
is associated with several magmatic suites that have intruded through metamorphic rocks of the Yukon‐Tanana Terrane (YTT).
YTT – represents an accreted terrane separated from the Selwyn Basin and
associated carbonate platforms strata of the ancestral North American margin by the
NW‐SE trending Tintina Fault

Regional Geological Setting - 2 Precious and base metal mineralization associated
predominantly with three main ages of magmatism:
• Jurassic (Minto Mine) • Early-Mid Cretaceous (Mt
Nansen past producer) • Late Cretaceous (Casino deposit)
Prospector Mountain mineralization time equivalent
to Casino Cu-Mo-Ag-Au porphyry Deposit
Prospector Mountain – Late Cretaceous Mineralizing System
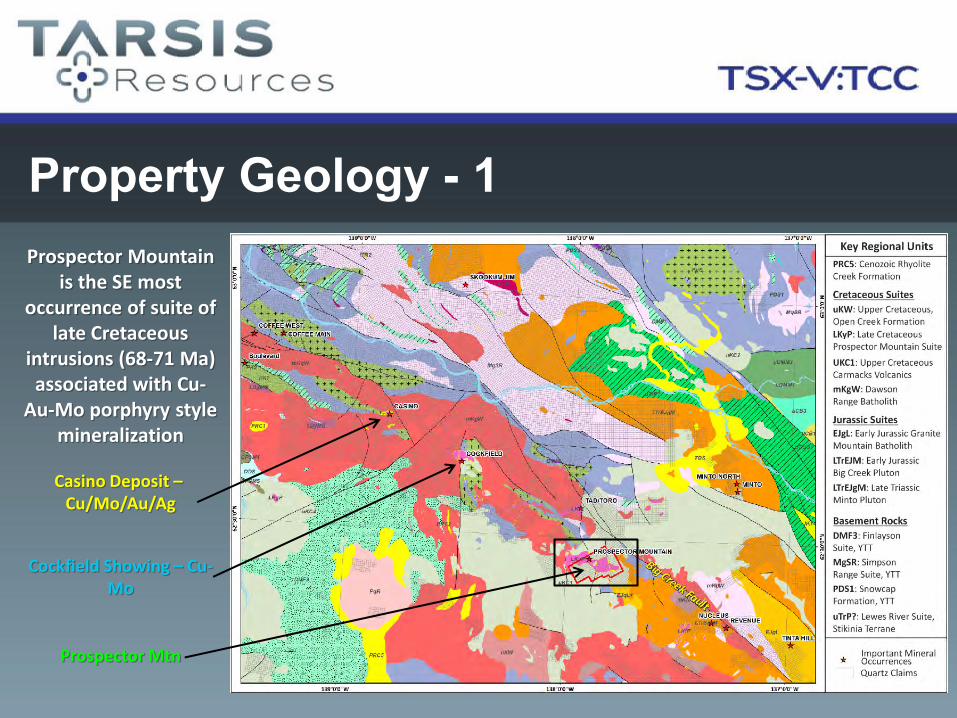
Property Geology - 1 Prospector Mountain
is the SE most occurrence of suite of
late Cretaceous intrusions (68-71 Ma) associated with Cu-
Au-Mo porphyry style mineralization
Cockfield Showing – Cu-Mo
Casino Deposit – Cu/Mo/Au/Ag
Prospector Mtn

Property Geology - 2 TWO broad lithological units
underlie the property:
(i) quartz monzonite porphyry & (ii) andesitic volcanic rocks (flows,
tuffs, agglomerates and other pyroclastic members).
Polymetallic vein occurrences occur on the western and
eastern sides of the property
Western Cu-Au-Ag-Pb veins - focus of much historical work
Eastern veins (Bonanza Zone) received most attention in most
recent exploration activity
Western Veins Bonanza Zone

Western Vein targets Au-As+/-Cu+/-Pb+/- Zn Veins received the bulk of exploration attention in 4 of the 5 work
programs completed on Prospector Mountain Property
As in Soil
Trenching
Intrusion contact
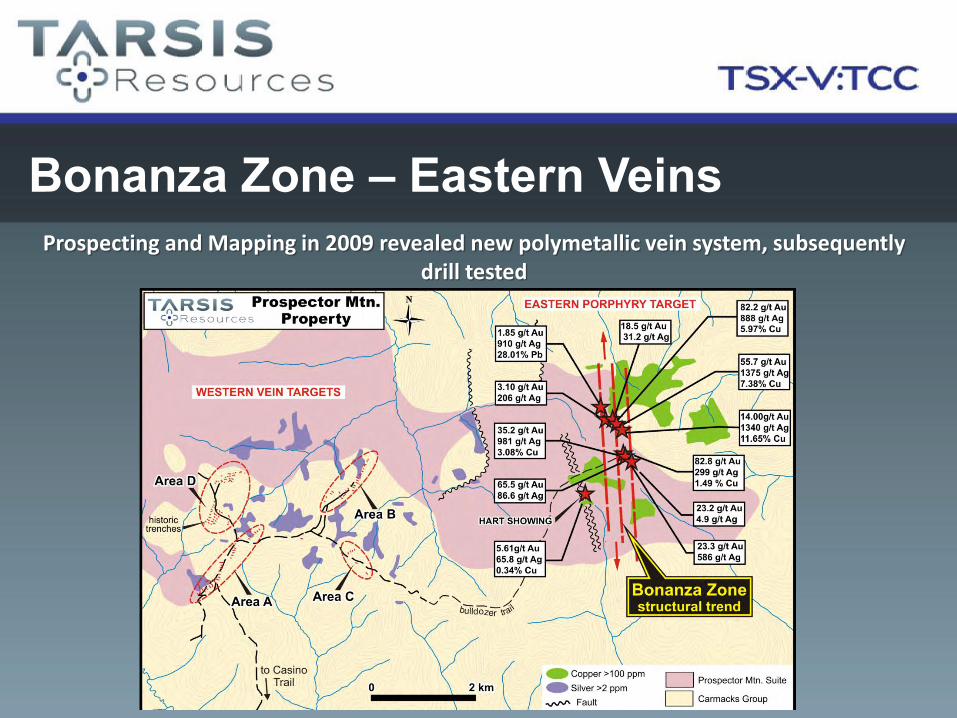
Bonanza Zone – Eastern Veins Prospecting and Mapping in 2009 revealed new polymetallic vein system, subsequently
drill tested

Porphyry Deposit Style Evaluation - Objectives
1. Review all available data and conduct site visit to collect samples and assess the Porphyry potential of the Prospector Mountain property.
2. Conduct analysis of available landsat Imagery to assess alteration
styles/intensity.
3. Access, re-log and sample historical drill core store at Yukon Geological survey core library
4. Conduct select analytical work to test porphyry deposit model

Porphyry Deposit Model – Work Plan
1. Coeval volcanism-magmatism: U-Pb Geochronology – completed; Report Delivered
2. Confirmation of assay results from precious and base metal epithermal vein
systems (interpreted as distal to porphyry ore body): Assays received, data not compiled or synthesized (to complete)
3. Document the distribution and type of hydrothermal alteration and assess
validity to porphyry Cu deposit model: LANDSAT 8 Analysis, PIMA data, Petrographic samples, SEM samples (all part of the same suite).
PIMA data completed (SRK), not synthesized spatially; Petrography to complete and synthesize spatially; SEM work complete; report to complete on alteration sequence.
Porphyry Deposit Model – Work Plan
4. Depth-related variation in alteration and sulphides
(as viewed in historical drill core; Samples collected, partially analyzed; petrography and final data synthesis to complete)
5. Select samples analyzed for S isotopes to assess distal vs. proximal, i.e. where
are we in potential porphyry system
(Analyses completed – final synthesis to complete)

Historical Soils Review
Historical 5 (Au-As-Cu-Pb-Ag) and 3 (Cu-Mo-Zn) element soil geochemical grid data are available for the western and eastern sides of the property,
respectively.
Data were analyzed in 1981 and 1971 (respectively).
Strongest correlations occur between Au and As.
Cu shows poor correlation to precious and base metals.
Cu anomalies are spatially disparate to Au-As anomalies suggesting different mineralizing events

Historical Soils Review – As in Soils
As in soils was used to target polymetallic vein occurrences on western side of property
As anomalies show poor spatial
correlation to Cu values > 100 ppm
Trenches

Historical Soils Review – Cu in Soils vs TMI (west)
Cu > 100 ppm broadly overlaps with zone of high total magnetic
intensity
Trenches

Historical Soils Review – Cu vs As, Pb and Zn
1. Clusters of high value Pb & Zn coincide with
High As (Veins)
2. Lower intensity Zn and Pb anomalies
coincide with broader Cu
anomalies. Non-coincident with As
(porphyry signature?). Drill Collars
Veins
Broader Cu-Pb anomaly
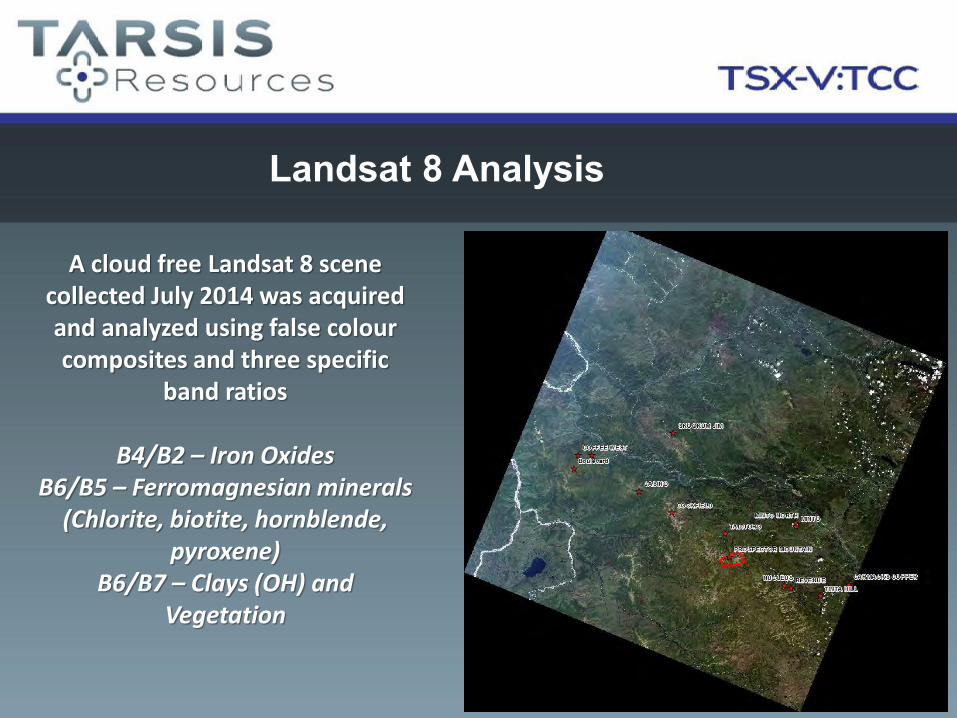
Landsat 8 Analysis
A cloud free Landsat 8 scene collected July 2014 was acquired and analyzed using false colour composites and three specific
band ratios
B4/B2 – Iron Oxides B6/B5 – Ferromagnesian minerals
(Chlorite, biotite, hornblende, pyroxene)
B6/B7 – Clays (OH) and Vegetation
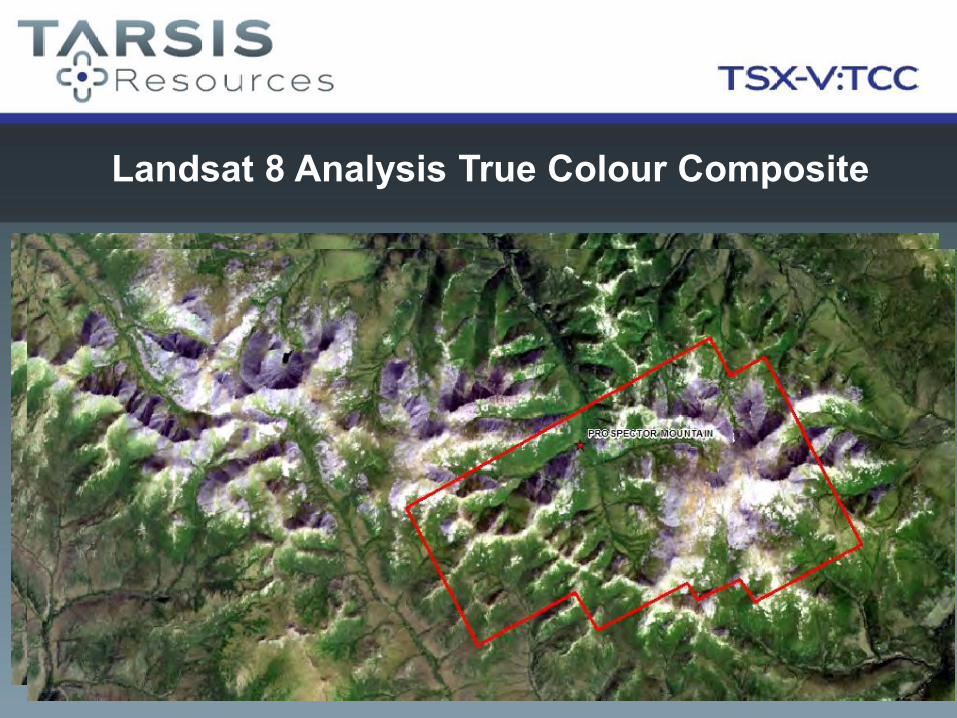
Landsat 8 Analysis True Colour Composite

Landsat 8 Analysis False Colour Composite
R – B4/B2 (Fe oxide) G – B6/B7 (Clay) B – B10/B11 (Silica)
Clay + FeOx

Landsat 8 Analysis False Colour Composite
R – B4/B2 (Fe oxide) G – B6/B7 (Clay) B – B6/B5 (Ferromagnesian)
Clay + FeOx
Ferromagnesian Minerals
Vegetation

Landsat 8 Analysis False Colour Composite
R – B4/B2 (Fe oxide) G – B6/B7 (Clay) B – B6/B5 (Ferromagnesian)
Clay + FeOx
Ferromagnesian Minerals
Vegetation

Landsat 8 Analysis - Regional Perspective
Three Late Cretaceous Intrusions (68 – 71 Ma)
Associated with porphyry Style mineralization

Landsat 8 Analysis - Regional Perspective
Cu RGS values – strongest Anomalies around Casino
Decreasing intensity around
Mt Cockfield Occurrence.
Lowest Cu Anomalies around PM

Landsat 8 Analysis - Regional Perspective
Casino Porphyry Deposit
Lowest amount of Ferromagnesian minerals
Color zonation pink to
purple to blue

Landsat 8 Analysis - Regional Perspective
Mt Cockfield Cu-Mo Porphyry Occurrence
Minor pink
Color zonation pink to
purple to blue
Increasing Ferromagnesian content

Landsat 8 Analysis - Regional Perspective
Prospector Mountain
Very minor pink
Distinct orange (FeOx+clay)
Significant
Ferromagnesian content

U-Pb Geochronology
New U‐Pb age data
were determined for 3 andesitic volcanic
rocks and one feldspar
porphyry dyke that occur on the
Prospector Mountain Property
Previous workers
suggested the volcanic units were
mid Cretaceous in age

U-Pb Geochronology
Three variably altered andesite volcanic samples
(2 volcanic flows and 1 welded tuff) yield
crystallization ages of 71.47 ± 0.26 Ma, 71.11 ± 0.53
Ma and 70.9 ± 1.2Ma, respectively
(Overlap with age of Casino Intrusion)
The fourth sample, which is a pervasively quartz‐sericite‐pyrite altered feldspar porphyry dyke which cross cuts ca. 69‐68Ma porphyritic monzonite
intrusions of the Late Cretaceous Prospector Mountain Suite, yields an age of 67.08 ± 0.44 Ma

U-Pb Geochronology - Summary

U-Pb Geochronology - Summary
These new age data provide an important temporal link between the Prospector Mountain Suite Intrusive Suite and the overlying volcanic cover sequence
indicating the two magmatic suites are products of the same magmatic cycle.

Precious/Base Metal Vein Assays
Western epithermal vein
sampling locations
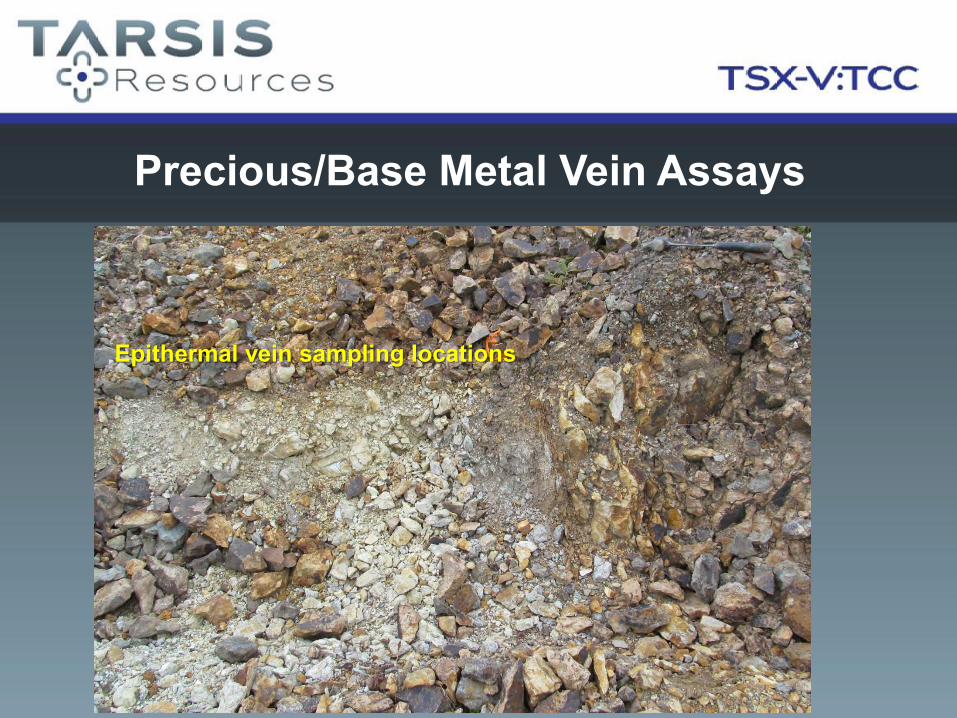
Precious/Base Metal Vein Assays
Epithermal vein sampling locations

Au-60ppm; Ag-115 ppm; Cu-1235 ppm; Pb-1.9%; Zn – 770ppm As-4490ppm; Sb-557ppm; Bi-60ppm
Precious/Base Metal Vein Assays

Au-21ppm; Ag-140 ppm; Cu-1645 ppm; Pb-5.32%; Zn – 1180ppm As-195ppm; Sb-31ppm
Precious/Base Metal Vein Assays

Hydrothermal Alteration PIMA data, Petrographic samples, SEM samples (all part of the same suite).
SEM
Petrography

Historical Drilling
1980’s Drilling was reviewed at
YGS during winter 2013

Holes Reviewed and
photographed 82-LP-01 82-LP-02 82-LP-03
82-LP-04A 82-LP-05 82-LP-06 DDH-13
Samples were
taken for petrography, SEM, PIMA, S isotope and
geochemistry
Historical Drilling

Historical Drilling
Most Noteworthy Preliminary Observations:
1. Holes were drilled primarily in volcanic cover. Greatest depth was 193 m
2. Propylitic alteration is progressively overprinted by potassic alteration with increasing depth
3. Overprinting Kfs+Magnetite + Qtz sulphide veinlets increase downhole
that were not logged or sampled
4. Chalcopyrite appears to visually increase with depth

Propylitic alteration is progressively overprinted
by potassic alteration with increasing depth

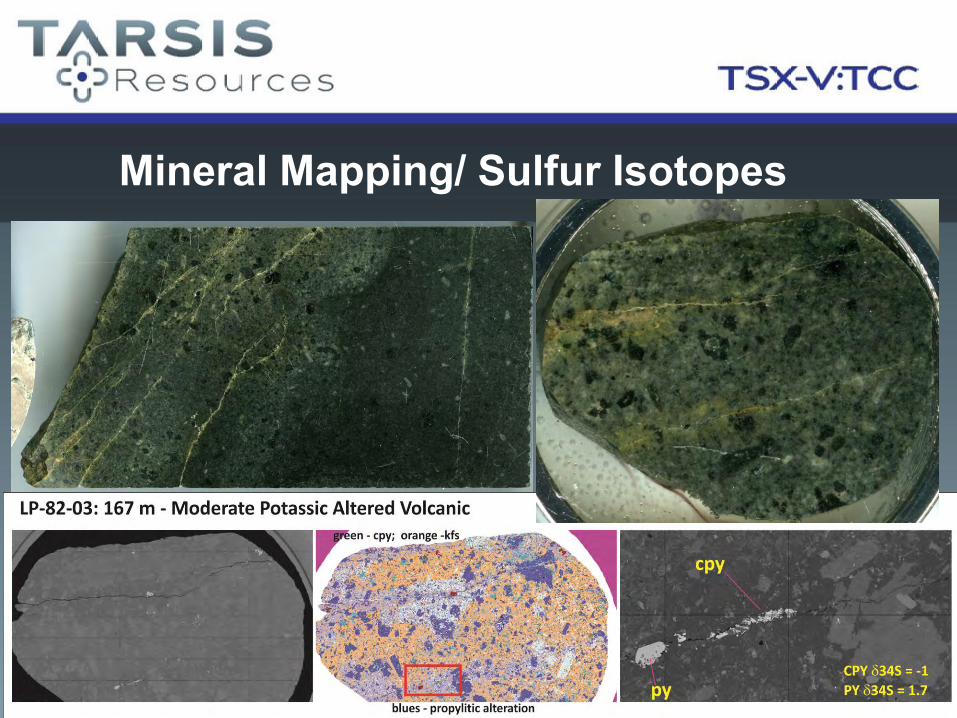
Mineral Mapping/ Sulfur Isotopes
(reproduced from
Wilson, Cooke,
Harper, and
Deyell, 2007)
A suite of samples from Prospector Mountain were selected for automated SEM mineral mapping and
subsequent S isotopes.
Mineral Mapping was used to identify sulphide phases for analysis and to determine areal abundances of
chalcopyrite
Pyrite and Chalcopyrites were analysed from both surface samples.
Sulfur isotope values become more negative closer to main ore zone of porphyry copper deposits
Success of method dependent on identifying coeval pyrite and chalcopyrite phases (i.e. good vein timing
relationships

cpy

Mineral Mapping/ Sulfur Isotopes
Surface Grab
PM-11-11; 52 m
LP-82-03; 167 m
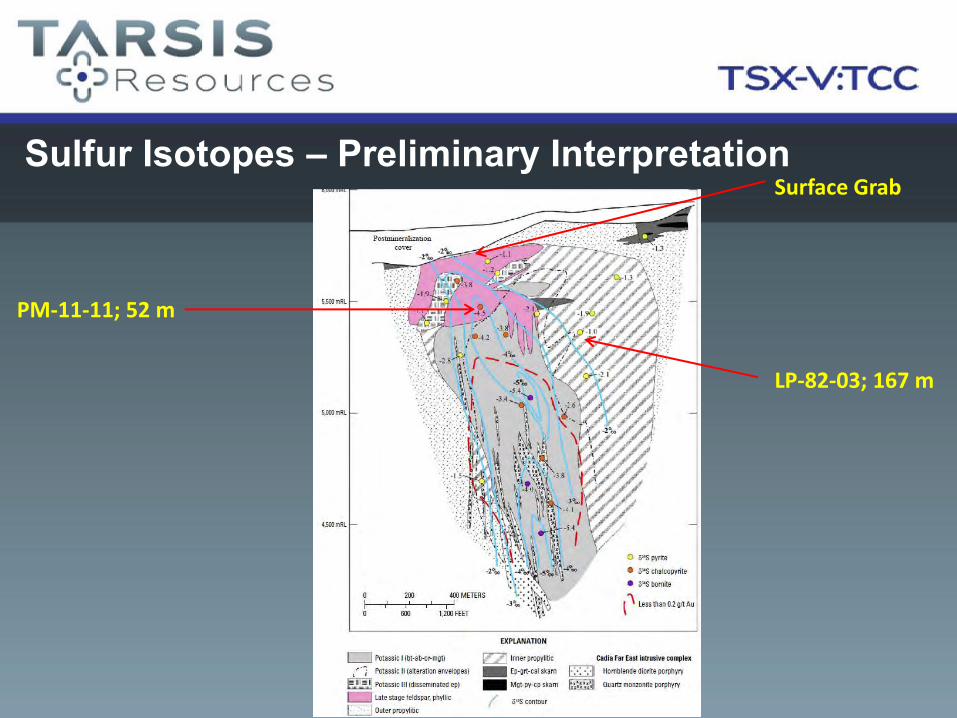
Sulfur Isotopes – Preliminary Interpretation

Initial System Level Interpretation Western Zone polymetallic
surface veins
Limit of sampling
and drill testing for
porphyry
Bonanza Zone