prospective indonesian plywood in the global market indonesian plywood in the global market...
TRANSCRIPT
Prospective Indonesian Plywood in the Global
Market
Makkarennu Ehime University/The United Graduate School of Agricultural Sciences, Ehime, Japan
Akira Nakayasu Ehime University/Faculty of Agriculture, Ehime, Japan
Abstract—Since the mid-1980s, Indonesia has emerged as
one of the biggest plywood suppliers in the world.
Indonesian plywood has dominated many major markets
around the world. However, due to economic crisis in
1997/1998 and other factors, the industry experienced a
decline in overseas markets which in which influenced the
production and trade sectors. In the last few years,
Indonesian plywood industry has done many efforts of
recovery, find new market and continue enhancement of
products image in international market. To determine the
potential future market for Indonesian plywood, current of
Indonesian plywood and trend of plywood exported were
investigated. For the purpose of the study, data export
plywood to sixteen countries for five years (2008-2012) were
collected. The obtained data was analyzed by using single
exponential smoothing method. Mean Absolute Percentage
Error (MAPE) and Mean Squared Error (MSE) are also
used to calculating demand sales forecast accuracy. The
average of total production plywood from Indonesia will
significantly increase from 3.3 million m3 in 2012 to 3.5
million m3 in 2014. The most prospective market of
Indonesian plywood is Japan and followed by China, Saudi
Arabia, the United Kingdom and the United Arab Emirates.
Index Terms—indonesian plywood, demand market, single
exponential smoothing method
I. INTRODUCTION
Indonesian plywood industry was set up in the later
part of the 1960s and began to develop rapidly in 1980s,
when the government issued a policy requiring every
forest concessionaire to establish a wood-processing plant.
This policy was followed by on the banning of logs
export in 1985 [1]. Over this period, Indonesia increased
the value of its timber exports by applying heavy export
taxes to discourage log exports and develop wood
product exports especially plywood [2]. Immediately,
after the log export banning policy was effectively
applied in 1985, some industries which imported logs
from Indonesia faced difficulty in continuing their
production [3]. The banned log exports giving subsidies
for plywood export to new markets especially to Japan
Manuscript received June 6, 2013; revised August 25, 2013.
and Korea. Indonesian industry policy made it as the
largest plywood exporter in globally [4] with about 30
million m3 shipped out annually [5]. The government
policy encouraged the growth of domestic wood
industries, mainly the plywood industry, were only three
companies, and it increased to 101 companies in 1980. It
further increased in 1987 to 118 companies, and in 1992
the number of companies reached 120 [6].
During the period 1980-2007, Indonesian forest
product industry mainly plywood industry has
experienced rapid growth and structural change and
played important part in Indonesia economy through a
significant role as a gross domestic product, foreign
exchange, government revenue, and employment
contributors [7]. In rural areas, forestry and forest
industries are even more important contributors to the
regional economy [8]. The industrial country has
absorbed the plywood from development country such as
Indonesia. This trend has exploited the tropical rainforest
and required attention for conservation field. The industry
was developed to add value to raw material, to help
industrialization, and to provide employment [9].
However, the rainforest products are not linear
relationship between the demand and the supply
capacities for the plywood. It needs more time to wait
until the rainforest products can be utilized.
The direct impact due to the deficit of raw materials is
the decrease of wood industrial capacity, especially
plywood industry from 99% in 2007 to 42% in 2005[10].
Furthermore, the production has declined to 3.1 million
m³ in year 2008, a drop of 27% compared to 2007 [11]. In
fact, growth in the plywood industry came at a cost.
Domestic log production is tampered off as well as the
trend of domestic log prices fell during 1980s and 1990s
[12].
As increased the trend of economy in Asia, Japan ones
of the country with positive economy, had put Indonesia
as one of the largest rainforest products exporter with
vary of products such as plywood, pulp, and sawn wood.
Indonesian has export almost 40% plywood to Japan as
potential market favorite. The next five largest importers
of plywood at that time were, China at 14%, Europe at
10%, Korea at 9%, USA at 8% and Saudi Arabia at 4% of
2013 Engineering and Technology Publishing
Journal of Life Sciences and Technologies Vol. 1, No. 3, September 2013
190doi: 10.12720/jolst.1.3.190-195
European importers, the most significant were Belgium,
the UK, Norway, Germany and Netherlands [13].
Exports of Indonesia plywood, veneered panels and
similar laminated wood (2004-2008) had increased by an
average of 0.40% annually. Export in 2004 valued at
US$ 1,576.9 million. It declined in 2005 to US$ 1,374.7
million, but increased in the following year to
US$ 1,527.3 million respectively [6]. In 2006, total
exports amounted to 2.91 million m3 with value of
US$ 1.30 billion. The main destinations for plywood
exports are Japan, the United States and the United
Kingdom [14]. During the first half of 2010, Indonesian
export of plywood totaled 73,000 m3. The major markets
for Indonesian plywood were Middle East and China
18% of total export volume was exported to Japan [15].
In 2010 it shipped 908,191 m3 of plywood to Japan, and
in 2011 export rose by about 1 %. Annual plywood
exports to Japan are worth about $ 2 billion [16].
In order to fulfill the potential market for Indonesian
plywood, estimates demand market for plywood product
were investigated. By knowing the future/potential
market of the plywood product, the number of the
plywood can be predicted to anticipate the sustainability
of production. Due to this, Indonesian plywood industry
will again be the biggest suppliers in the world.
II. METHODOLOGY
A. Data
The source of data for the study was from the monthly
report on export of plywood as prepared by Badan
Revitalisasi Industri Kehutanan (BRIK). BRIK is known
as industry revitalization authority who has joint decree
between the Minister of Industry and Trade and the
Minister of Forestry. As stated in the decrees, the
establishment of BRIK is a mutual understanding and
joint actions between private forestry industry and the
related government institutions in order to implement
sustainable forest, sustainable raw material supply,
creating job as well as business opportunities. To be
acknowledged as exporter of wood products, forest
industry must have legal permits based on Indonesian law
and regulation. After completing requirements stipulated
in the Ministry of Trade decree, the industry will be
eligible to have an Eksportir Terdaftar Produk Industri
Kehutanan (ETPIK) as the part of ministry of trade who
has authority in Issue exporting license. Export of
plywood product (HS 4412) is verified by independent
surveyor assigned by the Minister of Trade with the
objective to ensure wood product export fulfills all the
government regulations and provides more value-added
[17]. The Ministry of Trade has also issued a new
regulation no. 64/M-DAG/PER/10/2012 concerning the
Provision of Forestry Industry Products. The monthly
report on the export of plywood then recapitulated into
annual reports. The quantity (m3) and the value (USD) of
plywood export to sixteen countries from 2008 – 2012
were used in this study.
B. Data Analysis
In order to find out the potential market of the
Indonesian plywood, data analysis is done periodically
(time series data) by using single exponential smoothing
method (SES). The SES still a widespread method in
different computer systems and forecasting programs [18]
and should be used when the time series data has no trend
and no seasonality [19]. The method of SES takes the
forecast the previous period and adjusts it using the
forecast error [20]. This method proposed that the
historical data of value of plywood indicated the model
can be used for forecasting. Mean Absolute Percentage
Error (MAPE) and Mean Squared Error (MSE) are also
used to calculating demand sales forecast accuracy. A
SES, which produces an i-period-ahead forecast at time t
(St) [21], can be calculated recursively, as follows:
St= αXt+(1─α)St-1, = St -1+αe t, Ẋt (m) = St, 0˂α˂1, i≥1 (1)
where: St = SES forecast of time t; Xt = Observed value
of the time series in period t, Ẋt(m) = Forecast for m
periods ahead from origin t, α = smoothing coefficient.
When α is close to one, the new forecast would be
equal to the previous forecast and a substantial proportion
of the most recent forecast error; however, whenever Alfa
value is close to zero, the new forecast would be equal to
the previous forecast with little influence from the most
recent forecast error [22]. In order to measure the
effectiveness of future market, it is necessary to measure
the forecast accuracy. Accurate forecasts are crucial to
good revenue management [23]. The forecast accuracy,
MAPE and MSE are measured by the formula [24]:
𝑀𝐴𝑃𝐸 = ∣ 𝑃𝐸𝑡 ∣
𝑛
𝑛
𝑡=1
(2)
𝑀𝑆𝐸 = 1
𝑛 (𝑦𝑡 𝑛
𝑡=1− ý𝑡)
2
(3)
where: PE = Percentage Error, n = Number of units, yt =
Actual value index, ýt = Forecast value index, t = Period
at time t.
Table I and Table II shows the linear coefficient Alfa
(using values 0.1, α 0.3, α 0.5, α 0.7 and α 0.9) of MSE
and MAPE for sixteen countries. Almost all countries
except Australia have the smallest estimated for α 0.9 of
the MSE and MAPE. The lowest number of coefficient α
of MSE for Australia is value α 0.3 while the coefficient
α 0.9 of MAPE is close to zero. It follows that all the
coefficient α to forecast the potential demand markets of
the Indonesian plywood are using Alfa 0.9.
2013 Engineering and Technology Publishing
Journal of Life Sciences and Technologies Vol. 1, No. 3, September 2013
191

TABLE I. SMOOTHING COEFFICIENT ALFA OF MSE
Countries
α 0.1
α 0.3
α 0.5
α 0.7
α 0.9
Australia
11,517,785.9
5,113.7
26,663.3
56,369.9
10,345.9
Canada
1,743,153.1
1,262,333.8
484,655.2
78,104.9
1,059.3
France
1,695,532.1
5,256,718.2
3,539,559.5
1,460,935.0
153,184.6
China
117,052,587,392.0
41,139,986,245.4
11,990,879,904.4
2,423,519,122.4
146,991,059.8
Germany
82,718,979.8
26,555,107.0
8,117,768.9
1,956,675.0
144,543.8
Japan
106,662,892.5
371,381,993.4
512,201,038.1
358,921,063.1
63,467,962.9
Korea
434,634,011.6
228,610,941.7
115,758,074.3
46,544,445.7
6,295,371.7
Malaysia
221,621,440.4
165,383,649.0
107,602,764.8
51,116,361.9
7,725,653.2
Netherlands
43,654,382.4
12,691,406.7
3,572,977.4
912,027.9
94,030.4
New Zealand
10,972.9
15,210.5
9,428.7
2,855.5
184.0
Singapore
3,292,971.9
13,187,521.2
17,704,444.9
11,647,926.1
1,890,174.8
Saudi Arabia
682,646,095.4
74,492,960.5
651,605.0
1,935,311.8
631,441.2
Taiwan
504,581,664.0
375,544,418.4
218,645,619.2
82,112,831.3
8,502,854.1
UAE
4,728,850,517.1
1,096,037,171.0
211,228,875.5
32,251,362.8
1,984,758.8
UK
3,320,758.6
222,753.1
571,220.0
53,213.8
16,180.2
US
3,748,928,267.0
100,965,250.6
45,097,928.2
11,869,346.0
681,412.4
TABLE II. SMOOTHING COEFFICIENT ALFA OF MAPE
Countries α 0.1 α 0.3 α 0.5 α 0.7 α 0.9
Australia -27.1 -2.9 -1.9 -0.0 -0.0
Canada -211.2 -145.5 -92.0 -48.7 -14.2
France -712.5 -1,3022 -1,077.6 -695.1 -225.6
China 63.7 43.7 27.7 14.8 4.4
Germany -16.6 -10.2 -5.9 -3.0 -0.9
Japan 1.6 1.0 0.4 0.1 -0.0
Korea -9.7 -6.5 -4.2 -2.4 -0.8
Malaysia -60.1 -51.9 -41.3 -27.7 -10.3
Netherlands -37.0 -22.1 - 12.3 -6.0 -1.7
New Zealand 5.9 -3.2 -5.7 -4.4 -1.5
Singapore 3.0 1.3 0.1 -0.5 -0.3
Saudi Arabia 17.8 10.5 5.6 2.6 0.7
Taiwan -1.9 -1.9 -1.6 -1.1 -0.4
UAE -126.3 -71.5 -37.4 -16.8 -4.4
UK -220.2 -153.4 -98.4 -53.2 -16.0
US -326.9 -3.9 - 2.9 -1.8 -0.6
III. RESULT AND DISCUSSION
A. Trends of Plywood Production and Consumption
Figure 1. Major importers of Indonesian plywood over the period 2008-2012
The percentage of export capacity in quantity (m3) of
Indonesian plywood export for five years (2008-2012) is
shown in Fig. 1. The major importer countries were Japan,
China, Saudi Arabia, Taiwan and South Korea, which
together accounted for 80% of Indonesia’s plywood. On
the other hand, other countries (Australia, Canada, France,
Germany, Malaysia, Netherlands, New Zealand,
Singapore, The United Arab Emirates (UAE), The United
State (US) and The United Kingdom/UK) contribute only
20% or 3.08 million m3
of total Indonesian plywood
export.
The number of plywood exported to sixteen countries
between the years 2008 and 2012 is shown in Fig. 2. The
value (US$) of world’s plywood consumption for
Indonesian plywood totalled about US$7.07 billion.
During this period, world’s plywood consumption
significantly increased from 2.6 million m3 in year 2008
to 3.3 million m3 in year 2012, a 21.25 increase.
Figure 2. World’s plywood consumption over the period 2008-2012
Japan was the biggest market with a value of US$3.1
billion accounted for 43.8% of total Indonesian plywood
export. On the other hand, New Zealand contributes only
0.04 % (US$ 2.8 million) from the total of Indonesia
plywood exports. Over the period 2008-2012, the 10
main markets for Indonesia in plywood were:
1. Japan (US$3.1 billion, 43.8%)
2. China (US$686.9 million, 9.7%)
3. Saudi Arabia (US$655.7 million, 9.3%)
4. The United Stated (US$ 478.7 million, 6.8%)
5. Taiwan (US$464.3 million, 6.6%)
6. South Korea (US$390 million, 5.5%)
7. The United Arab Emirates (US$328.7 million,
4.6%)
8. Germany (US$286 million, 4.0%)
9. Singapore (US$146 million, 2.1%)
10. Australia (US$ 139.8 million, 2.0%)).
2013 Engineering and Technology Publishing
Journal of Life Sciences and Technologies Vol. 1, No. 3, September 2013
192
Indonesia becomes Japan’s largest plywood suppliers
after Malaysia. In 2008 it shipped 1.04 million m3 of
plywood to Japan, and in 2011 exports rose by about
14.8%. Annual plywood exports to Japan are worth about
US$620 million. In 2008, Japan was the first market for
Indonesian plywood, importing a value of US$563.3
million or 1.04 million m3. Mean awhile, the UAE was
the second largest with a value of US$134.6 million.
In Japan market, Indonesian was the second market
supplier of plywood in 2007. The first largest supplier to
the country was Malaysia. Other main suppliers were
China, New Zealand, the Philippines, Taiwan, Canada,
Finland, Russia and Thailand. In addition, the number of
plywood export to Japan for five years (2008-2012)
totalled 5.3 million m3 worth at US$ 3.1 billion m
3. Over
this period, the number of plywood export to Japan
significantly increased from 1.04 million m3 in 2008 to
1.22 million m3 in 2011. During this period, Japan is in
urgent need of pre-fabricated house and manufactured
wood products especially plywood in the aftermath of the
tsunami.
In 2012, Japan is still dominant of consuming
Indonesian plywood, importing a value of US$659.2
million, while China was the second market with a value
of US$260.6 million. However, in term of value,
plywood export to Japan decreased from US$823.8
million in year 2011 to US$659.2 million in year 2012, a
20% decrease. Furthermore, other important consumers,
Taiwan and The United State were also dropped 12.1 %
from 2011 to US$91.2 million in 2012 and 6.35% from
2011 to US$95.3 million in 2012, respectively. This was
caused by a relatively low level of plywood production.
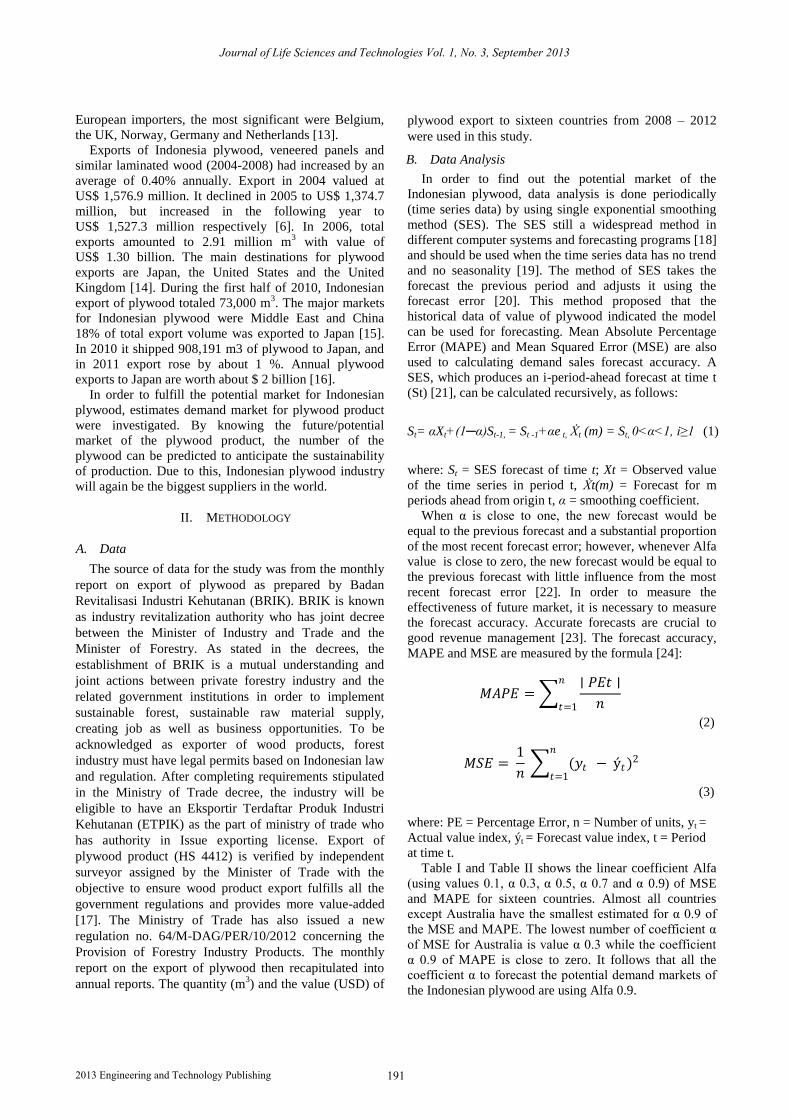
MOF [25], [26] reported that Indonesian plywood
production has continued to remain at a relatively low
level of 3.3 million m3 in 2011, less than half of the
production’s level in 2003 (Fig. 3). Indonesia’s
production has been affected by reduced log availability
due to overexploitation of forests in previous years, crack
downs on illegal log flows that have restricted log
availability for plywood production, declining availability
of logs of peeler quality and improvements in forest law
enforcement. Furthermore, the low level of Indonesian
plywood production has also been affected by lower
demand in Indonesia’s major export markets and
declining price competitiveness in the global market
Figure 3. Indonesian plywood production (2003-2011)
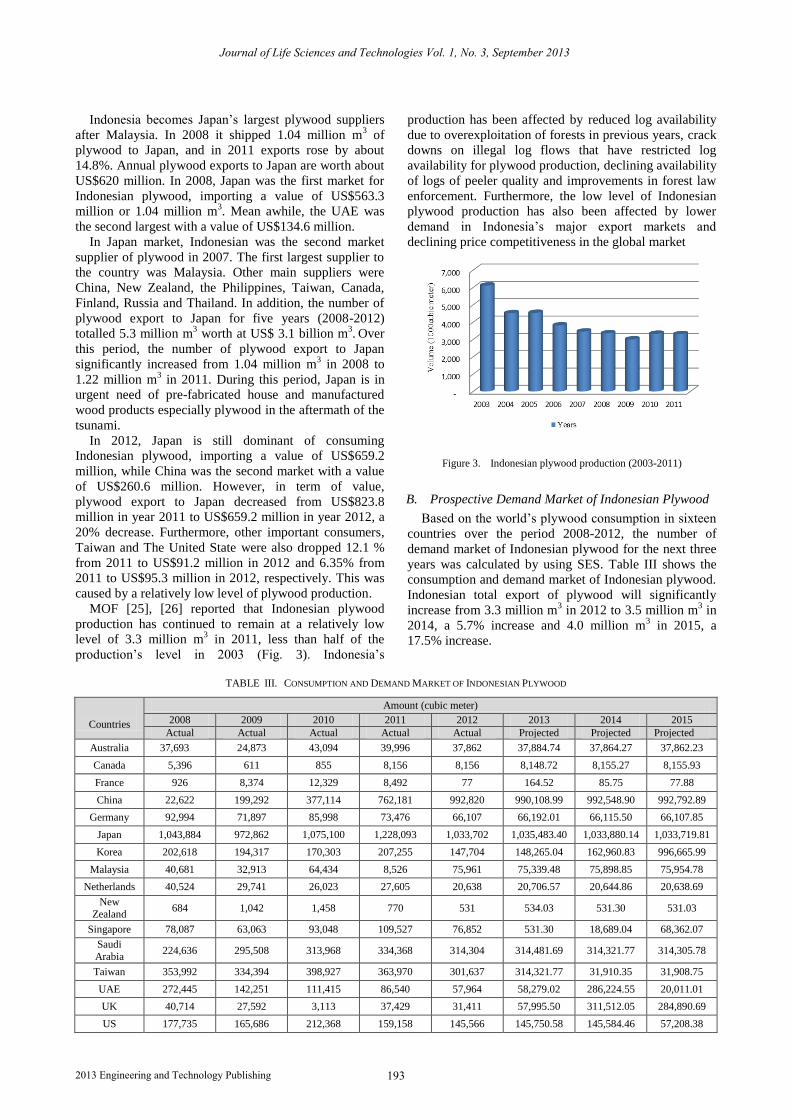
B. Prospective Demand Market of Indonesian Plywood
Based on the world’s plywood consumption in sixteen
countries over the period 2008-2012, the number of
demand market of Indonesian plywood for the next three
years was calculated by using SES. Table III shows the
consumption and demand market of Indonesian plywood.
Indonesian total export of plywood will significantly
increase from 3.3 million m3 in 2012 to 3.5 million m
3 in
2014, a 5.7% increase and 4.0 million m3 in 2015, a
17.5% increase.
TABLE III. CONSUMPTION AND DEMAND MARKET OF INDONESIAN PLYWOOD
Countries
Amount (cubic meter)
2008 2009 2010 2011 2012 2013 2014 2015
Actual Actual Actual Actual Actual Projected Projected Projected
Australia 37,693 24,873 43,094 39,996 37,862 37,884.74 37,864.27 37,862.23
Canada 5,396 611 855 8,156 8,156 8,148.72 8,155.27 8,155.93
France 926 8,374 12,329 8,492 77 164.52 85.75 77.88
China 22,622 199,292 377,114 762,181 992,820 990,108.99 992,548.90 992,792.89
Germany 92,994 71,897 85,998 73,476 66,107 66,192.01 66,115.50 66,107.85
Japan 1,043,884 972,862 1,075,100 1,228,093 1,033,702 1,035,483.40 1,033,880.14 1,033,719.81
Korea 202,618 194,317 170,303 207,255 147,704 148,265.04 162,960.83 996,665.99
Malaysia 40,681 32,913 64,434 8,526 75,961 75,339.48 75,898.85 75,954.78
Netherlands 40,524 29,741 26,023 27,605 20,638 20,706.57 20,644.86 20,638.69
New
Zealand 684 1,042 1,458 770 531 534.03 531.30 531.03
Singapore 78,087 63,063 93,048 109,527 76,852 531.30 18,689.04 68,362.07
Saudi
Arabia 224,636 295,508 313,968 334,368 314,304 314,481.69 314,321.77 314,305.78
Taiwan 353,992 334,394 398,927 363,970 301,637 314,321.77 31,910.35 31,908.75
UAE 272,445 142,251 111,415 86,540 57,964 58,279.02 286,224.55 20,011.01
UK 40,714 27,592 3,113 37,429 31,411 57,995.50 311,512.05 284,890.69
US 177,735 165,686 212,368 159,158 145,566 145,750.58 145,584.46 57,208.38
2013 Engineering and Technology Publishing
Journal of Life Sciences and Technologies Vol. 1, No. 3, September 2013
193
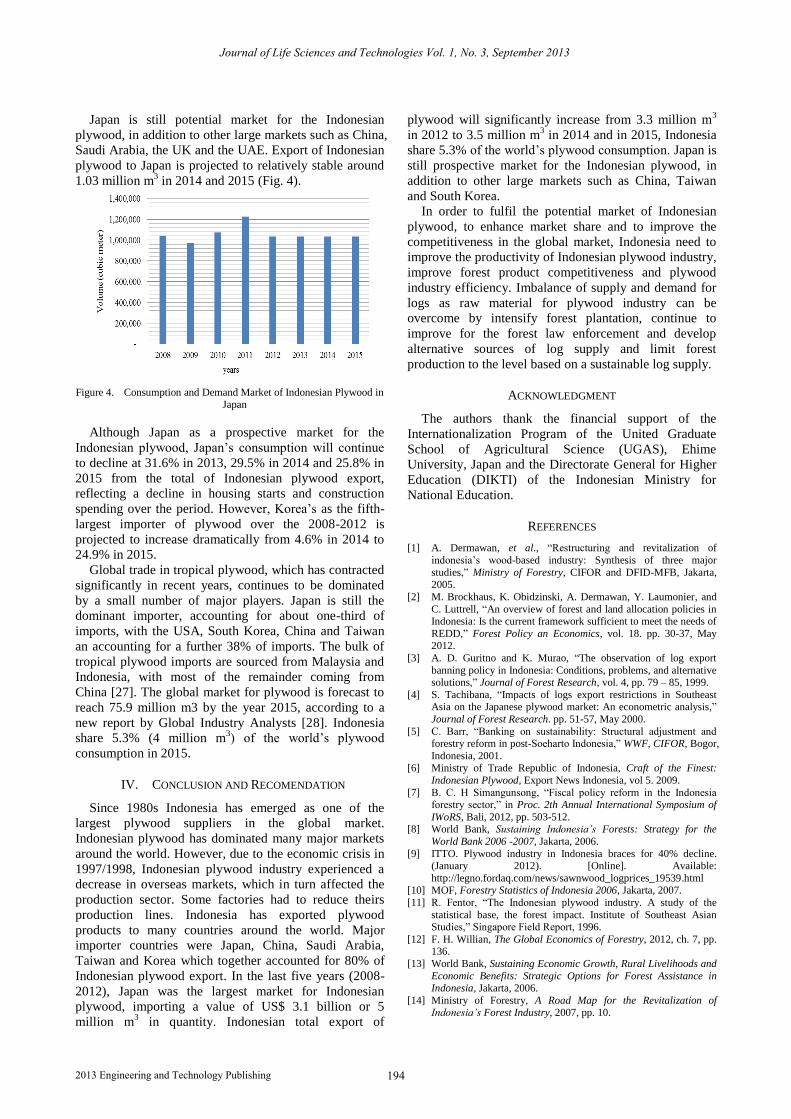
Japan is still potential market for the Indonesian
plywood, in addition to other large markets such as China,
Saudi Arabia, the UK and the UAE. Export of Indonesian
plywood to Japan is projected to relatively stable around
1.03 million m3 in 2014 and 2015 (Fig. 4).
Figure 4. Consumption and Demand Market of Indonesian Plywood in Japan
Although Japan as a prospective market for the
Indonesian plywood, Japan’s consumption will continue
to decline at 31.6% in 2013, 29.5% in 2014 and 25.8% in
2015 from the total of Indonesian plywood export,
reflecting a decline in housing starts and construction
spending over the period. However, Korea’s as the fifth-
largest importer of plywood over the 2008-2012 is
projected to increase dramatically from 4.6% in 2014 to
24.9% in 2015.
Global trade in tropical plywood, which has contracted
significantly in recent years, continues to be dominated
by a small number of major players. Japan is still the
dominant importer, accounting for about one-third of
imports, with the USA, South Korea, China and Taiwan
an accounting for a further 38% of imports. The bulk of
tropical plywood imports are sourced from Malaysia and
Indonesia, with most of the remainder coming from
China [27]. The global market for plywood is forecast to
reach 75.9 million m3 by the year 2015, according to a
new report by Global Industry Analysts [28]. Indonesia
share 5.3% (4 million m3) of the world’s plywood
consumption in 2015.
IV. CONCLUSION AND RECOMENDATION
Since 1980s Indonesia has emerged as one of the
largest plywood suppliers in the global market.
Indonesian plywood has dominated many major markets
around the world. However, due to the economic crisis in
1997/1998, Indonesian plywood industry experienced a
decrease in overseas markets, which in turn affected the
production sector. Some factories had to reduce theirs
production lines. Indonesia has exported plywood
products to many countries around the world. Major
importer countries were Japan, China, Saudi Arabia,
Taiwan and Korea which together accounted for 80% of
Indonesian plywood export. In the last five years (2008-
2012), Japan was the largest market for Indonesian
plywood, importing a value of US$ 3.1 billion or 5
million m3 in quantity. Indonesian total export of
plywood will significantly increase from 3.3 million m3
in 2012 to 3.5 million m3 in 2014 and in 2015, Indonesia
share 5.3% of the world’s plywood consumption. Japan is
still prospective market for the Indonesian plywood, in
addition to other large markets such as China, Taiwan
and South Korea.
In order to fulfil the potential market of Indonesian
plywood, to enhance market share and to improve the
competitiveness in the global market, Indonesia need to
improve the productivity of Indonesian plywood industry,
improve forest product competitiveness and plywood
industry efficiency. Imbalance of supply and demand for
logs as raw material for plywood industry can be
overcome by intensify forest plantation, continue to
improve for the forest law enforcement and develop
alternative sources of log supply and limit forest
production to the level based on a sustainable log supply.
ACKNOWLEDGMENT
The authors thank the financial support of the
Internationalization Program of the United Graduate
School of Agricultural Science (UGAS), Ehime
University, Japan and the Directorate General for Higher
Education (DIKTI) of the Indonesian Ministry for
National Education.
REFERENCES
[1] A. Dermawan, et al., “Restructuring and revitalization of
indonesia’s wood-based industry: Synthesis of three major
studies,” Ministry of Forestry, CIFOR and DFID-MFB, Jakarta, 2005.
[2] M. Brockhaus, K. Obidzinski, A. Dermawan, Y. Laumonier, and
C. Luttrell, “An overview of forest and land allocation policies in Indonesia: Is the current framework sufficient to meet the needs of
REDD,” Forest Policy an Economics, vol. 18. pp. 30-37, May 2012.
[3] A. D. Guritno and K. Murao, “The observation of log export
banning policy in Indonesia: Conditions, problems, and alternative solutions,” Journal of Forest Research, vol. 4, pp. 79 – 85, 1999.
[4] S. Tachibana, “Impacts of logs export restrictions in Southeast Asia on the Japanese plywood market: An econometric analysis,”
Journal of Forest Research. pp. 51-57, May 2000.
[5] C. Barr, “Banking on sustainability: Structural adjustment and forestry reform in post-Soeharto Indonesia,” WWF, CIFOR, Bogor,
Indonesia, 2001.
[6] Ministry of Trade Republic of Indonesia, Craft of the Finest:
Indonesian Plywood, Export News Indonesia, vol 5. 2009.
[7] B. C. H Simangunsong, “Fiscal policy reform in the Indonesia forestry sector,” in Proc. 2th Annual International Symposium of
IWoRS, Bali, 2012, pp. 503-512. [8] World Bank, Sustaining Indonesia’s Forests: Strategy for the
World Bank 2006 -2007, Jakarta, 2006.
[9] ITTO. Plywood industry in Indonesia braces for 40% decline. (January 2012). [Online]. Available:
http://legno.fordaq.com/news/sawnwood_logprices_19539.html [10] MOF, Forestry Statistics of Indonesia 2006, Jakarta, 2007.
[11] R. Fentor, “The Indonesian plywood industry. A study of the
statistical base, the forest impact. Institute of Southeast Asian Studies,” Singapore Field Report, 1996.
[12] F. H. Willian, The Global Economics of Forestry, 2012, ch. 7, pp. 136.
[13] World Bank, Sustaining Economic Growth, Rural Livelihoods and
Economic Benefits: Strategic Options for Forest Assistance in Indonesia, Jakarta, 2006.
[14] Ministry of Forestry, A Road Map for the Revitalization of Indonesia’s Forest Industry, 2007, pp. 10.
2013 Engineering and Technology Publishing
Journal of Life Sciences and Technologies Vol. 1, No. 3, September 2013
194

[15] J. Mulholland. Japan leans on Indonesian plywood for reconstruction. Report Linker. (2001). [Online]. Available:
http://www.reportlinker.com/news/2011/05/Japan-Leans-on-
Indonesian-Plywood-for-Reconstruction-131 [16] A. Mustaidah. Indonesia wants Japan to drop plywood tax, Jakarta
Globe. (2012). [Online]. Available: http://www.thejakartaglobe.com/archive/indonesia-wants-japan-
to-drop-plywood-tax/
[17] H. Daryanto and J. Purwonegoro. Forest product industries in Indonesia: Securing timber from legal sources. [Online]. Available:
http://www.goho-wood.jp/event/event1/Indonesia_BE.pdf [18] P. Wallstrom and A. Segerstedt, “Evaluation of forecasting error
measurements and techniques for intermittent demand,”
International Journal Production Economics, vol. 128. pp. 625-636, December 2010.
[19] T. B. Fomby. (June 2008). Exponential Smoothing Model. Mannual SAS/ETS Software: Time Series Forecasting System.
Version 6, First Edition, Cary, NS. SAS Institute Inc., [Online]. pp.
225-235. Available: http://faculty.smu.edu/tfomby/eco5375/data/Notes/SMOOTHING
%20MODELS_V6.pdf [20] E. Cadenas, O. A. Jaramillo. W. Revera, “Analysis and forecasting
of wind velocity in chetumal, Quintana roo, using the single
exponential smoothing method,” Renewable Energy. vol. 35. pp. 925-930, November 2009.
[21] E. S. Gardner, “Exponential smoothing: the state of the art-part III,” International Journal of Forecasting,” vol. 22. pp. 637–666,
December 2006.
[22] C. Lim and M. McAleer, “Forecasting tourist arrivals,” Annals of Tourism Research, vol. 28, no. 4, pp. 965-977, 2001.
[23] L. R. Weatherford and S. E. Kimes, “A comparison of forecasting methods for hotel revenue management,” International Journal of
Forecasting, vol. 19. pp. 401–415, September 2003.
[24] R. Fildes, P. Goodwin, M. Lawrence, and K. Nikolopoulos, “Effective forecasting and adjustments: An empirical evaluation
and strategies for improvement in supply-chain planning,” International Journal of Forecasting, vol. 25. pp. 3–23, March
2009.
[25] MOF, Forestry statistics of Indonesia 2009, Jakarta, 2010 [26] MOF, Forestry statistics of Indonesia 2011, Jakarta, 2012
[27] ITTO, Annual review and assessment of the world timber situation, Yokohama, Japan, 2011
[28] Global Industry Analysts, Plywood: A global Strategies Business
Report, California, 2010.
Makkarennu was born in Soppeng, South Sulawesi, Indonesia, in 1970. She received the
B.E. degree (1994) in Forestry, Faculty of
Agriculture and M.Si (2006) in Agribusiness from Hasanuddin University, Indonesia. She is a
Doctoral student of Agricultural Economic and Agribusiness, Ehime University, Ehime, Japan.
In 1996, she joined the Faculty of Agriculture
and Forestry, University of Hasanuddin, as an assistant lecture. Since 2008, she is a lecture in Faculty of Forestry,
Hasanuddin University, South Sulawesi, Indonesia. Her research interests in marketing of forest products and industry management.
Akira Nakayasu was born in Himeji, Japan, in 1954. He received his B.E.and M.A. degrees in
Agricultural Economics in 1978 and 1980, respectively, and a Doctorate degree of
Agriculture was granted from Kyoto University in
1994. Since 1981, he has been in Faculty of Agriculture at Ehime University, Japan, where he
is currently as a Professor. Since 1982, he published articles related an economic study and
marketing of agriculture in Academic Journal and in Bulletin of
Universities and Institutes. His research interests include economics and agricultural marketing.
2013 Engineering and Technology Publishing
Journal of Life Sciences and Technologies Vol. 1, No. 3, September 2013
195