prospective for breeding short season …€¦ · web view2 national gene bank and genetic...
TRANSCRIPT

Egypt. J. Plant Breed. 16 (1):19 – 40(2012)
RELATION OF HETEROSIS TO GENETIC DIVERSITY BASED ON SSR ANALYSIS IN COMMON WHEAT
UNDER DROUGHT STRESS
EL-Hosary A.A. 1, M.EL.M.EL-Badawy1, A.K .Mustafa2 and M.H. EL-Shal2
1 Agronomy Department, Faculty of Agriculture, Moshtohor, Benha University, Egypt.2 National Gene Bank and Genetic resources, Agricultural Research Center,Giza,Egypt.
ABSTRACTA half diallel cross among eight parents of wheat (Triticumaestivum L.) was
evaluated under recommended irrigation and drought stress in RCBD with three replications. The mean performances showed that the parental line P4 had the highest number of spikes per plant and grain yield/plant at drought irrigation treatment. The cross P3 x P6 possessed the highest value at number of spikes per plant, also the cross P2 x P5 had the highest mean value for 1000-kernel weight and grain yield at stress irrigation treatment. As for number of kernels per spike and1000-kernel weight; the parental variety Yacora (P8) gave the greatest value at stress irrigation treatment. For number of kernels per spike, the four crosses P1 x P2, P2 x P5, P4 x (Gemm.9) P6 and (Sahel 1) P7 x (Yacora) P8 gave the most desirable heterotic effects relative to mid-parent and better parent in both irrigation treatments. For 1000- kernel weight, the four crosses P1 x P2, P1 x (Gemm.9) P6, P2 x (Sahel 1) P7 and P3 x (Sahel 1) P7 gave the most desirable heterotic effects for the mid-parent in both irrigation treatments. For grain yield/plant, the three crosses P2 x P5, P3 x (Gemm.9) P6 and (Gemm.9) P6 x (Sahel 1) P7 gave the most desirable heterotic effects relative to mid-parent and better parent in both irrigation treatments. A total of 31 amplicons (amplified fragments) ranging from 96 bp to 401 bp were obtained by ten SSR primers. SSR primers BARC004 and BARC010 exhibited the highest number of fragments (6 and 5 amplicons, respectively). While primers BARC012, BARC072, BARC078 andBARC003revealed the lowest number of fragments (2 amplicons for each). The total number of polymorphic bands was 18; which represents a level of polymorphism around 58%. The SSR primersBARC004 and BARC010 which gave the highest number of polymorphic bands generated unique profiles for most of the wheat genotypes studied. Whereby SSR primer BARC066 was able to identify five genotypes out of the eight, namely L4, L5, Yacora, Sahel1 and Gemmeiza 9.Whereas, SSR primer BARC004 generated 6 profiles for the eight genotypes with six unique profiles for L2, L3, L5, Sahel 1, Yacora and Gemmeiza 9. The lowest genetic similarity was observed (0.67) between Sahel1 and each of L1 and L2. While, the highest genetic similarity was observed (0.96) between L1 and L2. According to correlation analyze between the genetic distances (GD) and each of mean performance and heterosis under control and drought treatment it was noticed that there was a low correlation between most examined pairs of parameters, except the correlation between genetic distance and mid parent heterosis for number of spikes per plant. The results indicated that SSR can be used as a tool for determining fingerprint for each line and extent of genetic diversity among wheat genotypes into different groups but when used a large number of primers.
Key words: Triticumaectivum, Genetic diversity, SSR, Heterosis, Drought, Wheat.

INTRODUCTION
Wheat (TriticumaestivumL.) is one of the most important major cereal crops all over the world. Increasing wheat production as a national goal could be achieved through increasing the production per unit area. A landrace is a local variety of a domesticated plant species which has been developed largely by natural processes, i.e. by adaptation to the natural and cultural environment in which it lives. It differs from a formal breed which has been bred deliberately to conform to a particular standard type. Landraces are usually more genetically and physically diverse than formal breeds. Heterosis or hybrid vigor is defined as the advantage of F1 hybrid performance over its parents in terms of viability, growth, and productivity, and has been widely used in agriculture. However, up to date, the mechanism of heterosis is still an area to be elucidated. Genetic diversity can be predicted using pedigree and heterosis data, from morphological traits or using molecular marker which detect variation at the DNA sequence level. Molecular techniques are valuable tool for advances in genome research generating considerable interest in predicting hybrid performance. Molecular markers are of great value in genetic research and partial breeding programs, since they reflect the genetic variation among individuals. Various PCR-based marker techniques have recently been successfully introduced in the fingerprinting of plant genomes (Kesseliet al. 1994) and in genetic diversity studies (Tinker et al. 1993). Microsatellites, known also as simple sequence repeats (SSRs) or short tandem repeats (STRs) are DNA stretches composed of simple motifs, 2 to 6 base pairs in length, tandemly repeated. Nuclear DNA of all eukaryotes contains microsatellites, scattered throughout the genome. Primers, flanking the simple sequence repeat can amplify a specific microsatellite. The objectives of the present study were (1) To establish the potentiality of heterosis expression for number of spikes /plant, number of kernels /spike, 1000-kernel weight and grain yield/plant, (2) To detect DNA polymorphism, identify genotypes and estimate genetic diversity among wheat genotypes and (3) To determine the relationship among genetic distance and each of mean performance and heterosis parameters for grain yield and its components.
MATERIALS AND METHODSFive promising landraces of wheat have been selected out of
hundred and eight genotypes the National Gene Bank and Genetic Resources according to IPGRI (the International Plant Genetic Resources Institute) and UPOV (International union for the protection of new varieties of plant) descriptors of morphological characterization. These landraces are
20

acclimated with Egyptian environment conditions. In addition, to these five landraces, three cultivars of wheat (YecoraKojo, Gemmeiza 9 and Sahel 1) have been used in half diallel crossing design. YecoraKojo is one of the old varieties used as tolerant for drought, Gemmeiza 9 is a new high yield Egyptian variety but sensitive to drought and Sahel 1 is an Egyptian high yielding variety.
In 2008/2009 growing season, in Sids Agricultural Research Station, grain from each of the eight parental genotypes were sown at various planting dates in order to overcome the differences in time of heading during this season. All possible cross combinations (without reciprocals) were made among the eight genotypes, giving seeds of F1 28 crosses.
Second season 2009/2010; two experiments were conducted at Al-Gemmeiza Agricultural Research Station, Gharbia Governorate, Egypt. Each experiment included the eight parents and their 28 possible crosses in a randomized complete block design (RCBD) with three replications. The planting date was on 24th of November 2009. The first experiment was irrigated only two irrigations (sowing irrigation and next one after 25 days) after which irrigation was stopped till the end of the season. The second experiment was normally irrigated by giving the recommended number (5) of irrigations. Each plot consisted of one row, of 1.5 meters long and 30cm wide. Grains were individually sown in hills at 20cm space between plants within row. The other cultural practices of growing wheat were properly practiced. Data for all morphological and yield component traits were recorded on ten guarded plants chosen at random from each plot as follows: number of spikes /plant, number of kernels /spike, 1000- kernel weight (gm) and grain yield/plant (gm). Normal performance plants were obtained in all hybrids except those of the two crosses (P3 x P4 and P4 x P8) where all plants were subjected to partial necrosis phenomenon. The decrease of yield was detected in both crosses. The obtained data were statistically analyzed for analysis of variance by using computer statistical program MSTAT.c. The combined analysis of two experiments was carried out whenever homogeneity of error variance was detected (Gomez and Gomez, 1984). Heterosis was calculated for individual crosses as the percentage deviation of F1 mean performance from its mid-parent and better-parent average values. Appropriate L.S.D. values were computed according to the following formula to test the significance of these heterotic effects;
Mid-parent heterosis =
F̄1−M . P .M . P. x100
Better parent heterosis =
F̄1−B . P .B . P . x100
21

Where: F̄1 is the mean of F1. M.P. is the mid-parent mean. B.P. is the better parent mean.
L.S.D. for mid-parent heterosis = t 0.05-0.01 .√3 MSe
2r
L.S.D. for better-parent heterosis = t 0.05- 0.01 .√ 2 MSe
r
DNA extractionLeaf tissue from each genotype was existed from 5-7 days old
seedlings. The tissue was grind well to fine powder with liquid nitrogen; transfer the powder to the extraction buffer, Left at room temperature until the end of all samples with well agitation to mix the tissue with the buffer and incubated at 65 ºC for 20 min, two times add 400 µl Chloroform: Isopropanol (24: 1) and mixed well. After adding Chloroform: Isoamyl alcohol (24:1), 1.2 volumes, in the second time. The tubes were incubated at -20 oC for 2 hours or overnight and gently inverted. After time there will appear a fine strengths and it will be cloudy. Centrifuge the tubes were centrifuged at 14.000 rpm for 10 min at 4 ºC, a fine pellet will appear after this step. The supernatant was discarded, the pellet was washed twice with 1.0 ml 75% Ethanol. Centrifuge after adding the Ethanol was centrifuged to fix the pellet at the bottom of the eppendorph tube at 7.000 rpm for 1 min. The pellet was drained and dissolved with warmed TE (warmed to 65 ºC), with the appropriate volume of TE equivalent to the pellet (standard 50 µl TE).
Ten microsatellite markers and motifs which were developed and provided by Dr. P. Cregan, USDA-ARS, Maryland, USA (table 1) were found positive create the molecular marker data. The SSR primer information and chromosome location can be found on the U.S. Wheat and Barley Scab Initiative web site http://www.scabusa.org/pdfs/BARC SSRs 011101.xls . PCR amplification
The apparatus used is PCR thermal cycler, Amplification reaction volume was 25 μl. Reaction mixtures were exposed to the following conditions: 950C for 5 min (one cycle), followed by 940C for 45 sec. (one cycle). The annealing temperature differed according to primers; 35 cycles at 72 0C for 2 min and one cycle at 15 0C for all. Gel electrophoresis apparatus was used, the running (electrode) buffer (1X TBE) was added. The apparatus was connected to the power supply (90 volts); the gel was moved to gel documentation apparatus to get the final image.
22

Table 1. Description of microsatellite markers and motifs.Ser.No Primer Pair ID MOTIF1 BARC004 (TTA)152 BARC012 (TAA)283 BARC048 (TATC)115 BARC066 (TC)8(TAGA)56 BARC072 (CT)4(TCTA)8(TC)88 BARC078 (TC)27(TATC)439 BARC079 (TAGA)10 + (TC)910 BARC003 (CCT)1712 BARC010 (GAA)1313 BARC011 (TAA)9+(TTA)12
Native acrylamide gel conditionsThe apparatus was connected to the power supply (90 volts), then
the gel was moved to solution (dd-H2O with Ethediumpromide) for 20 minutes and moved again to gel documentation apparatus to get the final image. All the data were analyzed by gel analysis program. The obtained data of SSR analysis was entered in a computer file as binary matrices where 0 stands for absence of a band and 1 stands for the presence of a band in each individual sample. Similarity coefficients between pairs of lines or varieties were calculated according to Nei and Li (1979). A dendogram tree was constructed by the UPGMA clustering algorithm from the SAHN. option of NTSYS-PC version 2.1 (Rolf, 2000).
RESULTS AND DISCUSSIONMean performances
The mean performances of the eight common wheat genotypes and their 28 F1 hybrids under control and drought treatments are presented in Table (2).
The parental line P5 recorded the lowest number of spikes per plant and the parental line P4 was the highest one at normal irrigation and the combined analysis. Meanwhile, the parental variety Gemmeiza 9 (P6) gave the second highest value followed by the parental variety Sahel 1 (P7). Also, the cross P3 x P4 possessed the lowest and P3 x P6 possessed the highest number of spikes per plant at normal, stress irrigation treatments as well as the combined analysis.
The parental line P2 recorded the lowest number of kernels per spike and parental line P5 and the parental variety Gemmeiza 9 (P6) gave the highest value at normal irrigation treatment; also, the parental variety
23

Gemmeiza 9 gave the lowest value and the parental variety Yacora (P8) gave the greatest one at stress irrigation treatment. Table 2.The mean performances of the eight common wheat genotypes
and their 28 F1 hybrids for yield and its components under control and drought treatments as well as for the combined over them.
GenotypesNo. of spikes /plant No. of kernels/ spike
Control drought
Combined
Control
drought
Combined
Line 1 (P1) 19.13 14.60 16.87 68.00 63.33 65.66Line 2 (P2) 20.53 16.47 18.50 53.24 52.56 52.90Line 3 (P3) 18.53 14.73 16.63 62.22 51.33 56.78Line 4 (P4) 22.42 17.93 20.18 63.78 52.45 58.11Line 5 (P5) 16.67 13.73 15.20 72.11 61.67 66.89
Gemmeiza9(P6) 21.30 16.80 19.05 72.11 46.11 59.11Sahel 1 (P7) 19.33 16.87 18.10 71.56 60.67 66.11Yacora (P8) 17.60 14.13 15.87 71.44 69.34 70.39
1x2 18.10 13.53 15.82 71.55 68.11 69.831x3 18.67 14.07 16.37 65.78 61.22 63.501x4 17.23 14.87 16.05 53.78 49.56 51.671x5 19.33 14.23 16.78 68.11 62.33 65.221x6 20.00 14.07 17.03 71.00 63.22 67.111x7 18.00 13.87 15.93 74.33 57.22 65.781x8 19.00 14.07 16.53 68.22 61.78 65.002x3 21.00 16.07 18.53 63.44 59.34 61.392x4 20.00 16.73 18.37 68.22 52.67 60.442x5 20.33 15.67 18.00 84.55 78.33 81.442x6 18.67 13.80 16.23 62.33 60.11 61.222x7 21.71 15.87 18.79 71.33 53.11 62.222x8 18.10 13.03 15.57 62.67 60.89 61.783x4 14.43 11.07 12.75 35.22 31.22 33.223x5 20.90 14.87 17.88 61.89 45.56 53.723x6 21.30 17.40 19.35 69.67 64.33 67.003x7 18.52 12.93 15.73 71.00 61.00 66.003x8 18.75 15.67 17.21 60.44 44.78 52.614x5 16.98 14.20 15.59 61.89 49.33 55.614x6 19.18 13.33 16.26 76.00 68.78 72.394x7 18.37 12.20 15.28 67.78 59.00 63.394x8 17.00 14.13 15.57 50.11 45.89 48.005x6 17.86 12.47 15.16 69.00 66.55 67.785x7 16.47 12.07 14.27 72.44 61.55 67.005x8 18.28 13.83 16.06 63.78 55.00 59.396x7 16.87 14.13 15.5 71.56 66.33 68.9456x8 19 13.73 16.365 78.78 62.33 70.5557x8 19 14.13 16.565 78.78 69.34 74.06
Mean of parents 19.13 15.97 17.55 66.81 57.18 61.99Mean of crosses 18.79 14.23 16.51 66.40 58.62 62.51
24

Mean of Genotypes 18.87 14.61 16.74 66.49 58.30 62.40
L.S.D 5% 1.92 1.55 1.71 3.40 2.41 2.89L.S.D 1% 2.56 2.07 2.25 4.52 3.21 3.79
Table 2.Cont.
Genotypes1000-kernel weight (g) Grain yield/ plant (g)
Control
drought
Combined
Control
drought
Combined
Line 1 (P1) 47.60 41.44 44.52 41.62 34.07 37.85Line 2 (P2) 35.59 29.33 32.46 43.79 28.69 36.24Line 3 (P3) 43.66 41.44 42.55 32.53 25.91 29.22Line 4 (P4) 50.62 43.39 47.01 42.26 38.41 40.34Line 5 (P5) 45.63 42.74 44.19 35.72 28.68 32.20
Gemmeiza9(P6) 43.01 40.19 41.60 28.08 23.23 25.66Sahel 1 (P7) 43.82 36.56 40.19 35.14 27.97 31.56Yacora (P8) 50.19 45.78 47.98 45.00 32.43 38.72
1x2 50.52 38.89 44.71 49.94 44.43 47.191x3 44.02 37.67 40.84 56.99 45.49 51.241x4 38.78 34.34 36.56 19.14 14.71 16.921x5 33.43 30.10 31.77 53.94 45.21 49.581x6 53.50 44.52 49.01 43.84 34.84 39.341x7 42.11 39.38 40.74 55.22 46.35 50.791x8 39.88 34.38 37.13 37.57 22.98 30.282x3 40.52 34.22 37.37 56.70 45.71 51.212x4 46.99 38.44 42.72 54.97 50.52 52.742x5 47.67 34.44 41.06 64.13 52.92 58.532x6 42.66 36.00 39.33 55.92 38.59 47.252x7 41.97 38.78 40.37 59.56 47.31 53.442x8 42.97 39.97 41.47 50.33 42.60 46.463x4 29.04 24.21 26.63 13.37 8.93 11.153x5 49.89 44.89 47.39 41.10 32.00 36.553x6 47.44 42.56 45.00 56.23 43.68 49.953x7 49.29 42.59 45.94 51.00 38.27 44.643x8 44.83 37.78 41.31 41.63 35.53 38.584x5 46.39 40.63 43.51 30.21 26.14 28.184x6 48.10 36.11 42.11 49.22 25.34 37.284x7 44.72 35.67 40.19 39.04 24.01 31.524x8 46.89 34.44 40.67 20.47 13.55 17.015x6 47.31 39.23 43.27 44.95 36.64 40.805x7 45.89 41.86 43.87 55.25 44.98 50.115x8 48.12 42.33 45.23 49.37 38.55 43.966x7 43.82 41.56 42.69 35.14 46.34 40.746x8 42.78 41.82 42.3 47.47 33.13 40.37x8 42.78 45.78 44.28 47.47 32.43 39.95
Mean of parents 45.02 40.11 42.56 38.02 29.92 33.97Mean of crosses 44.57 38.01 41.29 46.73 36.42 41.58
Mean of Genotypes 44.67 38.48 41.57 44.79 34.98 39.89
25

L.S.D 5% 1.74 1.49 1.59 2.23 2.21 2.18L.S.D 1% 2.31 1.98 2.08 2.97 2.94 2.86
The cross P3 x P4 showed the lowest number, while P2 x P5 gave the highest number of kernels/spike at normal, stress irrigation treatments as well as the combined analysis.
For1000-kernel weight, the parental line P2 had the lowest mean value at normal, stress irrigation and for the combined analysis followed by the parental line P4 which had the higher mean value at normal irrigation. Mean while, the parental variety Yacora (P8) exhibited the greatest value at stress irrigation treatment and for combined analysis. The cross P3 x P4 had the lowest mean kernel weight and the cross P1 x P6 had the highest one at normal, stress irrigation and for the combined analysis.
For grain yield/plant, the parental variety Gemmeiza 9 (P6) had the lowest mean yield at normal, stress irrigation and for the combined analysis, while the parental variety Yacora showed the greatest yield at normal irrigation treatment. The cross P3 x P4 had the lowest mean grain yield, while the cross P2 x P5 had the highest mean yield at normal, stress irrigation and for the combined analysis of this trait.
HeterosisHeterosis percentage relative to mid (MP) and better (BP) parent
values for the studied traits under normal and stress irrigation as well as for the combined analysis is presented in Table (3). For number of spikes per plant, four, one and two hybrids exhibited significant positive heterotic effects relative to mid-parent values at normal, stress irrigation and for the combined analysis, respectively.
Also, one cross expressed significant positive heterotic effects relative to better parent in normal irrigation treatment. The cross P3 x P5 under control treatment and for combined analysis had the highest significant positive heterotic effects relative to mid-parent. While, the same cross gave significant positive heterotic effects relative to better parent under control.
For number of kernels per spike, ten, fourteen and thirteen F1 hybrids exhibited significant positive heterotic effects relative to mid-parent values at normal, stress irrigation and for the combined analysis, respectively. Also, five, nine and six crosses expressed significant positive heterotic effects relative to better parent for this trait in the same order. The four crosses P1 x P2, P2 x P5, P4 x (Gemm.9) P6 and (Sahel 1) P7 x (Yacora) P8 gave the most desirable heterotic effects for the mid-parent and better parent for no. of kernels/spike in both irrigation treatments and for the combined analysis.
For 1000- kernel weight, ten, ten and eleven hybrids F1 exhibited significant positive heterotic effects relative to mid-parent values at normal,
26

stress irrigation and for the combined analysis, respectively. Also, six, three and four F1 crosses expressed significant positive heterotic effects relative to Table 3.Heterosis percentage relative to mid and better parent (BP) values
for the studied characters under control and drought stress as well as for the combined across them in wheat crosses studied.
crosses
No. of spikes/plant
Better parent heterosis % Mid parent heterosis %
Control Drought Comb. Control Drought Comb.P1xP2 -11.851* -17.814** -14.505** -8.739* -12.876** -10.556*P1xP3 -2.439 -4.525 -2.964 -0.885 -4.091 -2.289P1xP4 -23.123** -17.100** -20.446** -17.048** -8.607* -13.341**P1xP5 1.045 -2.511 -0.494 8.007 0.471 4.678P1xP6 -6.103 -16.270** -10.586* -1.072 -10.403* -5.151P1xP7 -5.923 -28.276** -11.971* 0.001 -18.271** -8.866*P1xP8 -0.697 -3.653 -1.976 3.448 -2.088 1.018
P2 x P3 2.273 -2.429 0.180 7.509 2.991 5.503P2 xP4 -10.781* -6.691 -8.963* -6.868 -2.713 -5.020P2 xP5 -0.974 -4.858 -2.703 9.319* 3.753 6.825P2 xP6 -12.363** -17.857** -14.786** -10.757** -17.034** -13.538**P2 xP7 5.747 -17.931** -6.568 16.114** -11.359** 2.678P2 xP8 -11.851* -20.850** -15.856** -5.070 -14.815** -9.408*P3 x P4 -35.643** -38.290** -36.819** -29.540** -32.245** -30.740**P3 x P5 12.770* 0.905 7.515 18.750** 4.450 2.356**P3 x P6 0.001 3.571 1.575 6.946 10.359** 8.454*P3 x P7 -0.054 -33.103** -16.103** 4.652 -24.070** -9.434*P3 x P8 1.169 6.335 3.457 3.782 8.545 5.897P4x P5 -24.238** -20.818** -22.718** -13.092** -10.316* -11.849**P4 x P6 -14.424** -25.651** -19.413** -12.238** -23.225** -17.102**P4 x P7 -18.067** -36.897** -24.246** -6.491 -34.526** -20.139**P4 x P8 -24.164** -21.190** -22.842** -15.035** -11.850** -13.618**P5 x P6 -16.166** -25.794** -20.411** -5.935 -18.341** -11.465**P5 x P7 -2.372 -37.586** -21.179** -1.789 -27.016** -14.314**P5 x P8 3.883 -2.123 1.208 6.712 -0.718 3.380P6 x P7 -20.814** -26.897** -16.855** 1.921 -21.771** -9.601*P6 x P8 -10.798* -18.254** -13.598* 0.600 -11.207* -4.630P7 x P8 7.955 -26.897** -9.210* 10.251* -1.992 4.220* and * * indicated significance at 0.05 and 0.01 levels of probability, respectively.
Table 3.Cont.
27

Crosses
No. of kernels/ spike
Better parent heterosis % Mid parent heterosis %
Control Drought Comb. Control Drought Comb.P1xP2 5.23** 7.55** 6.35** 18.03** 17.55** 17.80**P1xP3 -3.27 -3.33 -3.30 1.02 6.78** 3.72P1xP4 -20.92** -21.75** -21.32** -18.38** -14.39** -16.52**P1xP5 -5.55* -1.57 -2.49 -2.78 -0.26 -1.59P1xP6 -1.54 -0.17 -0.54 1.35 15.53** 7.57**P1xP7 3.88 -9.64** -3.20 6.53** -7.70** -0.17P1xP8 -4.51 -10.90** -7.66** -2.15 -6.87** -4.45**
P2 x P3 1.96 12.90** 8.12** 9.89** 14.23** 11.94**P2 xP4 6.96* 0.21 4.01 16.59** 0.31 8.89**P2 xP5 17.26** 27.03** 21.76** 34.90** 37.16** 35.98**P2 xP6 -13.56** 14.37** 3.57 -0.55 21.84** 9.32**P2 xP7 -0.31 -12.46** -5.88** 14.32** -6.19** 4.56*P2 xP8 -12.28** -12.19** -12.24** 0.52 -0.10 0.21P3 x P4 -44.77** -40.47** -42.83** -44.09** -39.83** -42.17**P3 x P5 -14.17** -26.12** -19.68** -7.86** -19.37** -13.12**P3 x P6 -3.39 25.32** 13.35** 3.72* 32.04** 15.63**P3 x P7 -0.78 0.55 -0.17 6.14** 8.93** 7.41**P3 x P8 -15.40** -35.42** -25.26** -9.56** -25.78** -17.26**P4x P5 -14.17** -20.00** -16.86** -8.91** -13.54** -11.02**P4 x P6 5.39* 31.14** 18.46** 11.85** 39.57** 23.50**P4 x P7 -5.28* -2.75 -4.12 0.17 4.32* 2.06P4 x P8 -29.86** -33.82** -31.81** -25.88** -24.64** -25.29**P5 x P6 -4.31 7.92** 1.33 -4.31** 23.50** 7.58**P5 x P7 0.46 -0.18 0.16 0.85 0.63 0.75P5 x P8 -11.56** -20.68** -15.63** -11.15** -16.03** -13.48**P6 x P7 -0.77 9.34** 2.02 -4.56** 24.25** 7.72**P6 x P8 9.25** -10.10** -7.82** -6.04** 7.99** 0.21P7 x P8 10.09** 0.001 6.94** 10.18** 10.42** 10.29*** and * * indicated significance at 0.05 and 0.01 levels of probability, respectively.
Table 3.Cont.
Crosses1000-kernel weight (g)
Better parent heterosis % Mid parent heterosis %
28

Control Drought Comb. Control Drought Comb.P1xP2 6.139** -6.167** 0.412 21.464** 9.890** 16.143**P1xP3 -7.516** -9.116** -8.260** -3.520* -9.115** -6.183**
P1xP4 -23.398** -20.846** -22.220** -21.041**
-19.031** -20.110**
P1xP5 -29.762** -29.569** -28.650** -28.280**
-28.487** -28.379**
P1xP6 12.395** 7.427** 10.083** 18.087** 9.073** 13.815**P1xP7 -11.534** -4.987** -8.486** -7.878** 0.961 -3.808*
P1xP8 -20.544** -24.905** -22.624** -18.440**
-21.173** -19.729**
P2 x P3 -7.177** -17.424** -12.167** 2.273 -3.294 -0.353P2 xP4 -7.178** -11.395** -9.124** 9.008** 5.730** 7.508**P2 xP5 4.456* -19.403** -7.083** 17.373** -4.414* 7.130**P2 xP6 -0.826 -10.430** -5.466** 8.539** 3.560 6.202**P2 xP7 -4.232* 6.060** 0.450 5.697** 17.693** 11.137**P2 xP8 -14.390** -12.697** -13.582** 0.181 6.418** 3.093
P3 x P4 -42.625** -44.200** -43.352** -38.386**
-42.921** -40.534**
P3 x P5 9.326** 5.035** 7.251** 11.746** 6.648** 9.272**P3 x P6 8.677** 2.683 5.758** 9.486** 4.257** 6.950**P3 x P7 12.478** 2.760 7.964** 12.690** 9.194** 11.042**
P3 x P8 -10.670** -17.477** -13.918** -4.453** -13.377** -8.752**
P4x P5 -8.363** -6.361** -7.439** -3.613* -5.652** -4.576**
P4 x P6 -4.983** -16.774** -10.425** 2.741 -13.592** -4.962**
P4 x P7 -11.655** -17.798** -14.490** -5.294** -10.778** -7.808**
P4 x P8 -7.375** -24.760** -15.249** -6.976** -22.743** -14.377**
P5 x P6 3.676 -8.211** -2.072 6.743** -5.396** 0.876P5 x P7 0.560 -2.062 -0.708 2.596 5.565** 3.991*P5 x P8 -4.118* -7.527** -5.744** 0.440 -4.348** -1.859P6 x P7 0.001 3.392 2.961 1.600 8.285** 4.737**P6 x P8 -14.766** -8.645** -6.405** 3.004** -2.710 0.262P7 x P8 -14.766** 0.001 -16.396** -8.994** -9.023** -9.007*** and * * indicated significance at 0.05 and 0.01 levels of probability, respectively.
29

Table 3.Cont.
Crosses
Grain yield/plant (g)
Better parent heterosis % Mid parent heterosis %
Control drought Comb. control drought Comb.P1xP2 14.061** 30.411** 22.680** 16.950** 41.591** 27.386**P1xP3 36.910** 33.542** 35.394** 53.693** 51.712** 52.807**
P1xP4 -54.720** -61.699** -58.043** -54.375**
-59.406**
-56.707**
P1xP5 29.599** 32.701** 30.995** 39.497** 44.085** 41.552**P1xP6 5.334 2.260 3.950 25.800** 21.594** 23.902**P1xP7 32.674** 36.067** 34.201** 43.886** 49.430** 46.364**
P1xP8 -16.510** -32.534** -24.795** -13.252**
-30.874**
-21.905**
P2 x P3 29.491** 59.354** 44.312** 48.585** 67.469** 56.460**P2 xP4 25.533** 31.531** 30.759** 27.755** 50.586** 37.758**P2 xP5 46.468** 84.464** 61.508** 61.335** 84.475** 71.034**P2 xP6 27.702** 34.522** 30.402** 55.612** 48.652** 52.693**P2 xP7 36.016** 64.931** 47.461** 50.923** 67.008** 57.645**P2 xP8 11.829** 31.350** 20.004** 13.361** 39.395** 23.975**
P3 x P4 -68.373** -76.740** -72.357** -64.259**
-72.219**
-67.939**
P3 x P5 15.072** 11.575** 13.514** 20.440** 17.250** 19.022**P3 x P6 72.828** 68.605** 70.956** 85.526** 77.778** 82.057**P3 x P7 45.148** 36.809** 41.451** 50.731** 42.056** 46.886**P3 x P8 -7.496** 9.559** -0.753 7.381** 21.810** 13.576**
P4x P5 -28.512** -31.930** -30.139** -22.510**
-22.065**
-22.304**
P4 x P6 16.452** -34.031** -7.582** 39.933** -17.791** 12.974**
P4 x P7 -7.635** -37.493** -21.850** 0.870 -27.669**
-12.306**
P4 x P8 -54.507** -64.711** -57.820** -53.079**
-61.734** -56.956
P5 x P6 25.852** 27.751** 26.698** 40.916** 41.162** 41.027**P5 x P7 54.690** 56.804** 55.631** 55.956** 58.769** 57.206**P5 x P8 9.696** 18.861** 13.534** 22.316** 26.148** 23.967**P6 x P7 0.001 65.670** 61.116** 75.070** 81.005** 77.726**P6 x P8 5.488* 2.158 14.537** 52.046** 19.037** 37.774**P7 x P8 5.488* 0.001 14.438** 18.476** 36.218* 26.101**
30

* and * * indicated significance at 0.05 and 0.01 levels of probability, respectively.
better parent for kernel weight in the same order. The four crosses P1 x P2, P1 x (Gemm.9) P6, P2 x (Sahel 1) P7 and P3 x (Sahel 1) P7 gave the most desirable heterotic effects for the mid-parent for both irrigation treatments and for the combined analysis. Meanwhile, the two crosses P1 x (Gemm.9) P6 and P3 x P5 gave the most desirable heterotic effects for the better parent under both irrigation treatments and for the combined analysis.
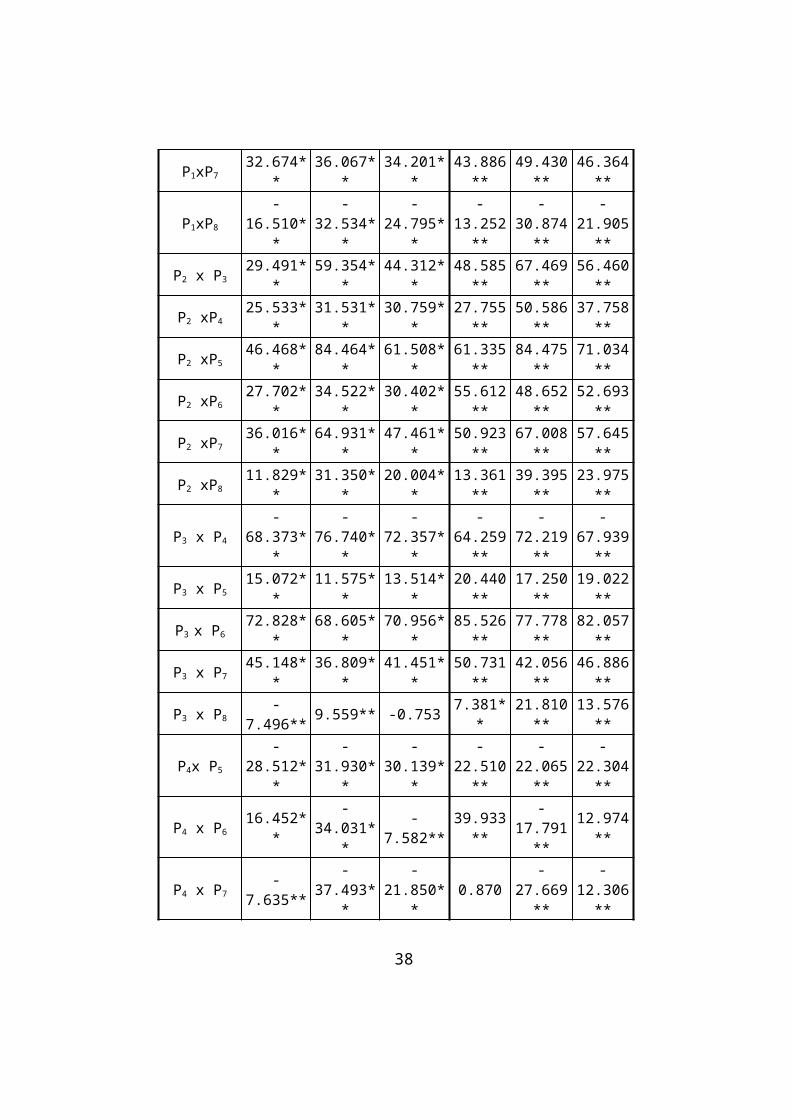
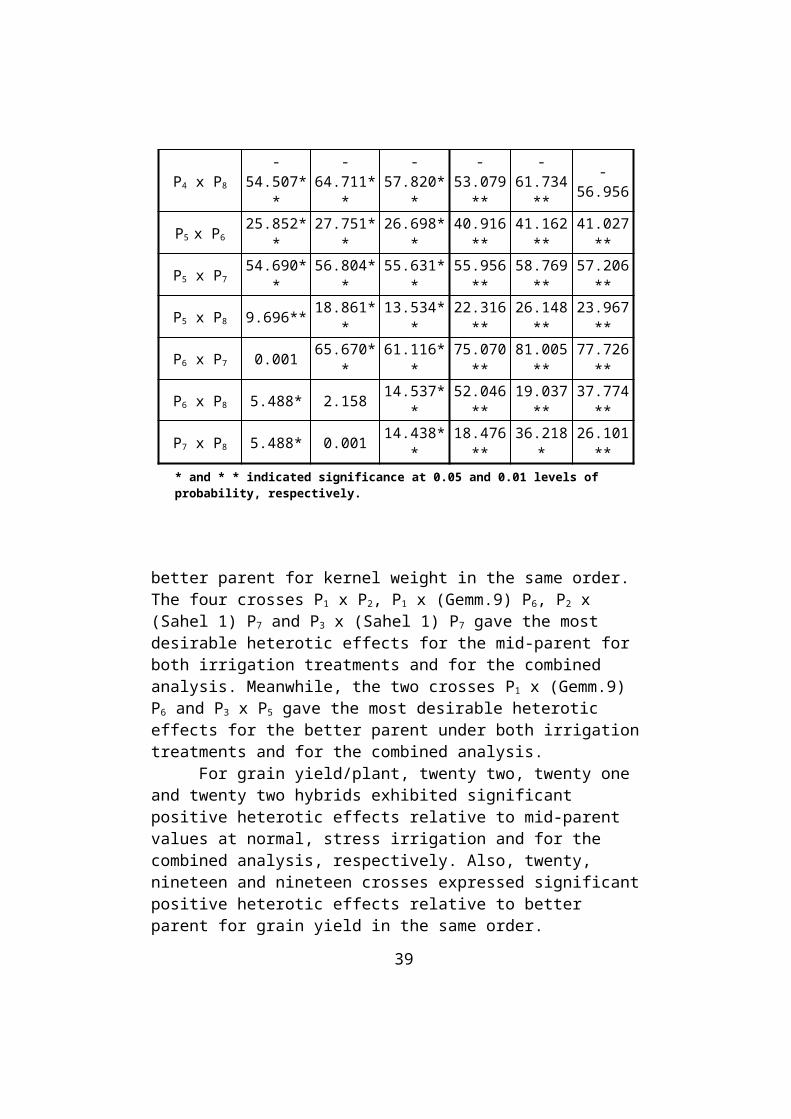
For grain yield/plant, twenty two, twenty one and twenty two hybrids exhibited significant positive heterotic effects relative to mid-parent values at normal, stress irrigation and for the combined analysis, respectively. Also, twenty, nineteen and nineteen crosses expressed significant positive heterotic effects relative to better parent for grain yield in the same order.
The three crosses P2 x P5, P3 x (Gemm.9) P6 and (Gemm.9) P6 x (Sahel 1) P7 gave the most desirable heterotic effects for the mid-parent and better parent in both irrigation treatments and for the combined analysis.
SSR fingerprinting of the three wheat cultivars and five landracesThe SSR analysis was performed using fifteen SSR primers on the
eight DNA samples representing the eight wheat genotypes, but only ten out of fifteen primers gave good results. Table (4) and Fig (1) illustrates the SSR profile of the eight wheat genotypes using ten primers. A total of 31 amplicons of molecular weight ranging from 96 bp to 401 bp were obtained by the tested primers. SSR primers (1.BARC004 and 12.BARC010) exhibited the highest number of fragments (6 and 5 amplicons, respectively), followed by primers (3.BARC048, 5.BARC066, 9.BARC079 and 13.BARC011) 3 amplicons for each. While primers (2.BARC012, 6.BARC072, 8.BARC078 and 10.BARC003) revealed the lowest number of fragments 2 amplicons for each. The total number of polymorphic bands was 18; which represents a level of polymorphism around 58 % (Table 5). The number of amplified polymorphic markers varied among the different primers. Primer 1.BARC004 generated 6 polymorphic bands (alleles) with 100 % polymorphism; both of primers 2.BARC012 and primers 8.BARC078 showed one polymorphic allele with 50% polymorphisms. The primers 9.BARC079, 12.BARC010 and 13.BARC010 had three, five and two polymorphic bands, with 100% polymorphisms for primer 9.BARC079 and 12.BARC010 and 66.7% polymorphism for primer 13.BARC011, respectively. While primers 3.BARC048, 5.BARC066, 6.BARC072and 10.BARC003 showed no polymorphism (0%). These results are in harmony
31

with these reported by Prasad et al (2000), Quarrieet al (2003), Ribeiroet al (2004) and Tahir (2010).
Although four SSR primers (3.BARC048, 5.BARC066, 6.BARC072 and 10.BARC003) were non polymorphic and couldn't discriminate between the eight genotypes, the other six SSR primers (1.BARC004, 2.BARC012, 8.BARC078, 9.BARC079, 12.BARC010 and 13.BARC011.) together generated unique profiles for the eight genotypes. The SSR primers 1.BARC004 and 12.BARC010 which gave the highest number of polymorphic bands (6 and 5, respectively) generated unique profiles for most of the wheat genotypes studied. The SSR primer 5.BARC066 was able to identify five genotypes out of the eight, namely L4, L5, Yacora, Sahel1 and Gemmeiza 9. The SSR primer 1.BARC004 generated 6 profiles for the eight genotypes with six unique profiles for L2, L3, L5, Sahel1, Yacora and Gemmeiza 9 While, L1 and L4 had the same profile. These results agree with previous studies by El-Maghraby et al (2005), Guo-yue and Hui (2007) and Iqbal et al (2009).
SSR specific markersThree out of the total amplified 31 SSR bands were found to be
useful as cultivar and landrace specific markers (Table 4 and Fig 1), one band (AF01)was present in Gemmeiza 9 only and two bands (AF18 and AF27) were absent in Sahel 1 and L5,respectively. There unique markers were generated by primer 1.BARC004 (positive marker), primer 6.BARC072 (negative marker) and primer 12.BARC010 (negative marker).
On the other hand, primers 2.BARC012, 3.BARC048, 5.BARC066, 6.BARC072, 10.BARC003 and 13.BARC011 showed no genotype with unique specific markers.Thus, three wheat genotypes among the eight studied germplasm could be identified by genotypes specific SSR unique markers.
Estimates of genetic relationships among the cultivars and landraces based on SSR analysis
The genetic similarity percentage based on SSR data ranged from 96% to 67% (Table 6). The similarity indices showed that the most distantly related cultivars and landraces were (Line 1, Sahel 1) and (Line 2, Sahel 1) with low similarity index (0.67) for both of them. The most closely related line were (Line 1 and line 2); with a high similarity index 0.96.
UPGMA cluster analysis of genomic SSR genetic similarity (gs) matrix resulted in the dendogram in Figure (2).
The consensus tree showed that the wheat genotypes were divided into two main clusters; the first included the wheat variety Sahel 1. The second main cluster was divided into two sub-clusters. The first sub-cluster included variety Gemmeiza 9 and the second divided to line 4 and line 5.
32

The second sub-cluster included variety Yacora in one branch and the others in divided to two branches line 1, 2 in one and line 3 in other branch.
Table 4. The SSR amplified fragments (AF) obtained from the DNAs of three wheat cultivars and five landraces.
SSR primers Size (bp) L 1 L 2 L 3 L 4 L 5 Yacor
a Sahel 1 Gemmeiza9
1. BARC004AF01 186 0 0 0 0 0 0 0 1AF02 176 0 0 1 0 0 1 1 1AF03 171 1 0 0 1 1 0 0 0AF04 166 0 0 1 0 1 1 1 0AF05 161 1 1 1 1 0 0 0 0AF06 153 0 1 1 0 0 0 0 0
2. BARC012AF07 125 1 1 1 1 1 1 1 1AF08 118 1 1 1 1 1 0 0 1
3. BARC048AF09 401 1 1 1 1 1 1 1 1AF10 382 1 1 1 1 1 1 1 1AF11 362 1 1 1 1 1 1 1 1
5. BARC066AF12 125 1 1 1 1 1 1 1 1AF13 117 1 1 1 1 1 1 1 1AF14 96 1 1 1 1 1 1 1 1
6. BARC072AF15 216 1 1 1 1 1 1 1 1AF16 173 1 1 1 1 1 1 1 1
8. BARC078AF17 155 1 1 1 1 1 1 1 1AF18 149 1 1 1 1 1 1 0 1
9. BARC079AF19 177 1 1 1 0 0 1 0 0AF20 164 1 1 1 0 0 1 0 0AF21 155 0 0 0 1 1 0 1 1
10. BARC003AF22 267 1 1 1 1 1 1 1 1AF23 194 1 1 1 1 1 1 1 1
12. BARC010AF24 318 1 1 1 0 0 0 0 1AF25 311 0 0 0 1 1 0 1 0AF26 300 1 1 1 1 1 1 0 0AF27 286 1 1 1 1 0 1 1 1
33

AF28 277 0 0 0 0 1 0 1 013. BARC011
AF29 302 1 1 0 1 1 1 0 1AF30 295 0 0 1 0 0 0 1 0AF31 258 1 1 1 1 1 1 1 1Total 31 23 23 25 22 22 21 20 21
BARC004 BARC072
BARC011.
34

BARC079Fig (1). Acrylamide gel 8% in 10%TBE buffer stained with ethidium
bromide showing SSR-PCR polymorphism of DNA for eight wheat samples ( five landraces i.e. L1, L2, L3, L4 and L5 and three varieties i.e. Yacora, Sahel1 and Gemm.9) using SSR primers. M refer to 50bp DNA Ladder.
Table 5.The total number of SSR amplicons, the number of polymorphic fragments and the percentage of polymorphism for the eight wheat genotypes using the SSR primers.
AF SSR primers
Amplified fragments
Total amplified fragments
Polymorphic fragments
Percentage of polymorphism
(%)1. BA
RC004
6 6 100
2. BARC012
2 1 50
3. BARC048
3 0 0
5. BARC066 3 0 06. BARC072 2 0 0
8. BARC078
2 1 50
9. BARC079
3 3 100
10. BARC003
2 0 0
12. BARC010 5 5 10013. BA
RC011
3 2 66.7
Total 31 18 58%
35

Table 6.Similarity matrix among three wheat cultivars and five landraces based on SSR-PCR analysis.
Parent L 1 L 2 L 3 L 4 L 5 Yacora Sahel 1L 2 0.96L 3 0.88 0.92 L 4 0.89 0.85 0.78L 5 0.81 0.77 0.73 0.91
Yacora 0.87 0.87 0.88 0.8 0.8Sahel 1 0.67 0.67 0.77 0.77 0.82 0.79
Gemmeiza 9 0.83 0.83 0.79 0.84 0.8 0.82 0.79
Fig (2) Dendrogram of parents based on SSR diversity data.
The dendogram presented in Figure (2) demonstrates the ability of microsatellites to detect large amount of genetic diversity in genotypes with expected narrow genetic pool. A wide range of genetic diversity among all genotypes was observed. The results have shown that it is possible to identify the genetic diversity of studied genotypes and select lines or cultivars of the highest genetic diversity using SSRs, as indicated by cluster analysis.
The correlation among genetic distance and both of heterosis and mean performance for yield and its components
The correlation coefficient among genetic distance (GD) and mid- and better parent heterosis and mean performance for yield and its
36

components computed for 28 F1-hybrid combinations studied under control and drought treatments is presented in Table (7), respectively.
Under the control and stress treatments the estimate value of correlation coefficient between GD and mid parent heterosis was low and positive (r = 0.14 and 0.030 for grain yield/plant and number of kernels/spike, respectively) under normal treatment and (r = 0.09 and 0.05 for grain yield/plant and 1000-kernel weight, respectively) at stress treatment. The correlation between GD and mid parent heterosis for number of spikes/plant in normal treatment showed positive and significant (r =0.38*).
Table 7.The correlation among genetic distance (GD) and both of heterosis and mean performance for the studied traits under normal, stress treatments.
SSR Genetic distance
Yield and its components
Mid parent heterosis
Better parent heterosis
Mean performance
Control Drought Control Drought Control Drought
Grain yield/plant 0.14 0.09 0.12 0.11 0.14 0.08
No. of spike/plant 0.38* -0.20 0.26 -0.23 0.12 -0.10
No. of Kernels/spike 0.030 -0.19 0.06 -0.19 0.17 -0.12
1000-kernel weight -0.123 0.05 -0.06 0.12 -0.13 0.03
* and * * indicate significance 0.05 and 0.01 levels of probability, respectively.
On contrary, there was a negative correlation between GD and mean of 1000-kernel weight (r= -.012) in normal treatment, number of spikes/plant and number of kernels/spike (r= -0.20 and -0.19, respectively) at stress treatment. Correlation coefficient between genetic distance (GD) and heterosis relative to better parent for yield components under control and stress treatments showed no significance for all traits.
Correlation coefficient values between GD, and mean performance for yield and its components under the control and drought treatments were low and positive (r = 0.14, 0.12 and 0.17 for grain yield/plant, number of spikes/plant and number of kernels/spike, respectively) in normal irrigation treatment and (r = 0.08 and 0.03 for grain yield/ plant and 1000-kernel weight, respectively) under stress irrigation treatment.While, there was a negative correlation between GD and mean of 1000-kernel weight (r = -0.13) in normal irrigation treatment and among GD and mean number of
37
spikes/plant and number of kernels/spike (r = -0.10 and -0.12, respectively) under stress irrigation treatment.
The results indicated that SSR can be used as a tool for determining fingerprint for each line and classified genetic diversity among wheat genotypes into different groups. According to correlation analysis between the genetic distances and each of mean performance and heterosis under control and drought treatment it was noticed that there was low correlation between such parameters for most examined traits, except the correlation between genetic distance and mid parent heterosis for number of spikes per plant under control treatment. Charcossetet al. (1991) and Bernardo (1992) suggested that genetic distance can not accurately predict hybrid performance unless the DNA markers used in the analysis were linked to the genes affecting the trait. Zeidet al. (2004) pointed out that the lack of association between heterosis and genetic dissimilarities for inter group hybrids might be explained by absence of crosses between related parents i.e. by the absence of variation for parental relatedness. Zhao et al. (1999) investigated the relationship between molecular marker diversity and heterosis in both intra- and inter- sub- specific hybrids of rice in a diallel set including 55 crosses and detected very little correlation in intersubspecific crosses. They concluded that relationships between marker heterozygosity and hybrid performance were complex and need more number of markers for the sake of accuracy.
REFERENCES
Bernardo, R. (1992). Relationship between single-cross performance and molecular marker heterozygosity.Theor. Appl. Genet. 83: 628-634.
Charcosset, A.M., M. Lefort- Buson and A.Gallais (1991). Relationship between heterosis and heterozygosity at marker loci: a theoretical computation.Theor. Appl. Genet. 81: 571-575.
El-Maghraby, M.A, M.E. Moussa, N.S. Hana and H.A. Agrama (2005).Combining ability under drought stress relative to SSR diversity in common wheat.Euphytica 141: 301–308.
Gomez, K. N. and A.A. Gomez (1984).Statisical procedures for agricultural research. John. Wiley and Sons. Inc., New York. 2nd ed.
Guo-yue , C. and L. L. huiHui (2007) Detection of genetic diversity in synthetic hexaploidwheats using microsatellite markers. Agricultural sciences in China, 6(12): 1403-1410.
Iqbal, N., A. Tabasum, H. Sayed and A. Hameed (2009).Evaluation of genetic diversity among bread wheat varieties and landraces of Pakistan by SSR markers. Cereal Research Communications 37(4), pp. 489–498.
38
Kesseli, R., O. Ochoaand and R. Michelmore (1994).Variation of RFLP loci in Lactuca spp. and origin of cultivated lettuce (L. sativa). Genome 34: 430-436.
Nei, N. and W.H. Li (1979).Mathematical model for studying genetic variation in terms of restriction endonucleases. Proc. Natl. Acad.Sci.USA 76:5269-5273.
Prasad, M. , R.K. Varshney, J.K. Roy , H.S. Balyan and P.K. Gupta (2000).The use of microsatellites for detecting DNA polymorphism, genotype identification and genetic diversity in wheat Theor. Appl. Genet. 100:584–592.
Quarrie, S. A. , D. Dodig, S. Pekiç, J. Kirby and B. Kobiljski (2003).Prospects for marker-assisted selection of improved drought responses in wheat. Bulg. J. Plant Physiol. (special issue): 83–95.
Ribeiro, C. C., H. G.Pinto, G. Igrejas, P. Stephenson,T. Schwarzacher and J .S. H.Harrison (2004).High levels of genetic diversity throughout the range of the Portuguese wheat landrace ‘barbela. Annals of Botany 94: 699–705.
Rolhf, F.J.(2000). NTSYS-PC: Numerical taxonomy and multivariate analysis system. Version 2.1 Exeter software, Setauket, N.Y.
Tahir, A.R. (2010).Germination characteristics and molecular characterizations of some wheat varieties in Sulaimanyah by SSR marker.Turk. J Biol.34 (2010) 109-117.
Tinker, N.A. Fortin and D.E. Mather (1993). Random amplified polymorphic DNA and pedigree relationship in spring barley. Theor. Appl. Genet. 85: 976-984.
Zeid , M.M., C.C. Schon and N. K. W., Li (2004). Hybrid performance and AFLP based genetic similarity in faba bean. Euphytica 139: 207-221.
Zhao, M.F., X.H. Li, J. B. Yang, C.G. Xu, R.Y. Hu, D.J. Liu and Q. Zhang (1999).Relationship between molecular marker heterozygosity and hybrid performance in intra-and inter-subspecific crosses of rice. Plant Breeding 118:139-144.
بواسطة الوراثي بالتباعد وعالقتها الهجين في SSRقوةالخبز قمح
الجفاف ظروف تحت
الحصري المقصود عبد البدوي- 1علي الزعبالوي أحمد- 1محمودأحمد مصطفي الشال- 2كمال حلمي 2محمد
1 - - بنها جامعة بمشتهر الزراعة كلية المحاصيل قسمالوراثية 2 والموارد للجينات القومي البنك
تهدف الدراس//ة إلي عم//ل بص//مة وراثي//ة للس//الالت االبوي//ة وتق//دير ق//وة ( ومتوس//طSSR-PCRالهجين والربط بين التباعد الوراثي المقدر عن طريق )
39

( باالض//افة لثماني//ةF1أداء الهجن وق//وة الهجين. تم تق//ييم الهجن التبادلي//ة ) سالالت وأصناف من قمح الخبزفي تجربتين االولي تحت ظروف الري الع//ادي والثاني//ة تحت ظ//روف االجه//اد الم//ائي في ثالث مك//ررات. أظه//رت الس//اللة
أعلي قيمة لصفة عدد السنابل/نب//ات ومحص//ول النب//ات. كم//ا أظه//رP4األبوية أقل قيمةP2 x P5 أعلي قيمة لعدد السنابل للنبات والهجين P3 x P6الهجين
حبة ومحصول الحبوب للنب//ات. أعطي الص//نف ي//اكورا أعلي1000لصفة وزن حبة تحت نظامي ال//ري. أظه//ر1000قيمة لصفة عدد الحبوب للسنبلة ووزن
أعلي قوة هجين بالنسبة لمتوسط االبويين تحت الري العاديP3 x P5الهجين P1لصفة عدد السنابل /نبات. وبالنسبة لصفة عدد الحبوب للسنبلة أربعة هجن
x P2( , P2 x P5, P4 x P6 و P7 x P8الري تحت موجبة هجين أعطوا قوة ) العادي واالجهاد بالنسبة لمتوسط األبويين واالب االفضل. بالنسبة لصفة وزن
أعليP3 x P7 و )P1 x P2, P1 x P6, P2 x P7 حبة أظهرت أربعة هجن ) 1000 ق//وة هجين موجب//ة تحت ال//ري الع//ادي واالجه//اد بالنس//بة لمتوس//ط األب//وين.
ثالثة هجن و P2 x P5 /,)P3 x P6أظهرت P6 x P7أعلي قوة هجين موجبة ) تحت الري العادي واالجهاد بالنسبة لمتوسط األبوين واألب األفضل. أس//تخدم
بعش//رة بادئ//ات في تحدي//د البص//مة الوراثي//ة والتباع//د ال//وراثيSSRتكني//ك شظية من االباء ذات وزن جزيئي ي//تراوح )من31أظهرت هذه البادئات وجود
(BARC004( زوج من القواع//د. وأعطي ك//ل من الب//ادىء األول )401 إلي 96 علي الت///والي(5-6( أعلي ع///دد من الش///ظايا )BARC010والث///اني عش///ر)
,BARC012وأظهرت البادئ//ات ) BARC072, BARC078 ,BARC003أق//ل ) أليل لكل ب//ادىء( وك//ان الع//دد الكلي للبادئ//ات المختلف//ة2عدد من الشظايا )
% وك//ان أعلي نس//بة للب//ولي58 ألي//ل بنس//بة 18)الب//ولي مورف//يزم( هي ( . أظه///رBARC010( والث///اني عش///ر )BARC004مورفيزمللب///ادىء األول )
,4( تم//يزا لخمس أب//اء من الثماني//ة وهمالس//اللة BARC066البادىء الخامس ) ) وبالنس////بة للب////ادىء األول 9 وجم////يزة1 , ي////اكورا, س////احل5الس////اللة BARC004)( أعطي س//تة ب//ولي مورف//يزم مم//يزة لس//تة أب//اء وهم:الس//الالت
و الس//اللة1 بينما أعطي لك//ل من الس//اللة 9, ياكوا و جميزة 1(, ساحل2,3,5)2 و الس//اللة 1تشابه وراثي. كانت أعلي درج//ة تش//ابه بين الس//اللة 4 0.96)
)2 و الس//اللة 1 مع كل من الساللة 1بينما كانت أقل درجة تشابه بين ساحل (. أظه//ر االرتب//اط بين التباع//د ال//وراثي وكال من المتوس//طات وق//وة0.67
الهجين تحت ظروف الري الع/ادي واالجه/اد إرتب/اط ض/عيف لمعظم الص/فات فيما عدا صفة عدد السنابل للنبات بالنس//بة لق//وة الهجين تحت ظ//روف ال//ري
تكني//ك عم//ل بص//مة وراثي//ة وتحدي//دSSRالط//بيعي وبالت//الي يمكن من خالل التباعد الوراثي بين األباء.
النبات لتربية المصريه )2012 (40- 19) : 1(16المجله
40