prospect of nanoscale interphase evaluation to predict composite properties
TRANSCRIPT

This article was downloaded by [University of Connecticut]On 08 October 2014 At 0114Publisher Taylor amp FrancisInforma Ltd Registered in England and Wales Registered Number 1072954Registered office Mortimer House 37-41 Mortimer Street London W1T3JH UK
Journal of Adhesion Scienceand TechnologyPublication details including instructions forauthors and subscription informationhttpwwwtandfonlinecomloitast20
Prospect of nanoscaleinterphase evaluation topredict composite propertiesEdith Maumlder a amp Shanglin Gao ba Institute of Polymer Research Dresden HoheStrasse 6 01069 Dresden Germanyb Institute of Polymer Research Dresden HoheStrasse 6 01069 Dresden GermanyPublished online 02 Apr 2012
To cite this article Edith Maumlder amp Shanglin Gao (2001) Prospect of nanoscaleinterphase evaluation to predict composite properties Journal of Adhesion Scienceand Technology 159 1015-1037 DOI 101163156856101317035468
To link to this article httpdxdoiorg101163156856101317035468
PLEASE SCROLL DOWN FOR ARTICLE
Taylor amp Francis makes every effort to ensure the accuracy of allthe information (the ldquoContentrdquo) contained in the publications on ourplatform However Taylor amp Francis our agents and our licensorsmake no representations or warranties whatsoever as to the accuracycompleteness or suitability for any purpose of the Content Any opinionsand views expressed in this publication are the opinions and views ofthe authors and are not the views of or endorsed by Taylor amp FrancisThe accuracy of the Content should not be relied upon and should beindependently verified with primary sources of information Taylor andFrancis shall not be liable for any losses actions claims proceedings
demands costs expenses damages and other liabilities whatsoeveror howsoever caused arising directly or indirectly in connection with inrelation to or arising out of the use of the Content
This article may be used for research teaching and private studypurposes Any substantial or systematic reproduction redistributionreselling loan sub-licensing systematic supply or distribution in any formto anyone is expressly forbidden Terms amp Conditions of access and use canbe found at httpwwwtandfonlinecompageterms-and-conditions
Dow
nloa
ded
by [
Uni
vers
ity o
f C
onne
ctic
ut]
at 0
114
08
Oct
ober
201
4
J Adhesion Sci Technol Vol 15 No 9 pp 1015ndash1037 (2001)Oacute VSP 2001
Prospect of nanoscale interphase evaluation to predictcomposite properties
EDITH MAumlDER curren and SHANGLIN GAO
Institute of Polymer Research Dresden Hohe Strasse 6 01069 Dresden Germany
Received in nal form 14 March 2001
AbstractmdashFor meeting the requirements of lightweight and improved mechanical properties com-posites could be tailor-made for speci c applications if the adhesion strength which plays a key rolefor improved properties can be predicted The relationship between wettability and adhesion strengthhas been discussed The microstructure of interphases and adhesion strength can be signi cantly al-tered by different surface modi cations of the reinforcing bers since the speci c properties of theinterphase result from nucleation thermal andor intrinsic stresses sizing used interdiffusion androughness The experimental results could not con rm a simple and direct correlation between wetta-bility and adhesion strength for different model systems
The main objective of the work was to identify the interphases for different berpolymer matrixsystems By using phase imaging and nanoindentation tests based on atomic force microscopy(AFM) a comparative study of the local mechanical property variation in the interphase of glass ber reinforced epoxy resin (EP) and glass ber reinforced polypropylene matrix (PP) compositeswas conducted As model sizings for PP composites deg -aminopropyltriethoxysilane (APS) andeither polyurethane (PU) or polypropylene (PP) lm former on glass bers were investigated TheEPndashmatrix was combined with either unsized glass bers or glass bers treated with APSPU sizingIt was found that phase imaging AFM was a highly useful tool for probing the interphase with muchdetailed information Nanoindentation with suf ciently small indentation force was found to besuf cient for measuring actual interphasepropertieswithin a 100-nm region close to the ber surfaceSubsequently it also indicated a different gradient in the modulus across the interphase region dueto different sizings The possibilities of controlling bond strength between ber surface and polymermatrix are discussed in terms of elastic moduli of the interphases compared with surface stiffness ofsized glass bers micromechanical results and the mechanical properties of real composites
Keywords Atomic force microscopy phase imaging nanoindentation interphase elastic modulus bre-reinforced polymer composite
currenTo whom correspondence should be addressed Phone + 49-351-4658305 Fax + 49-351-4658284 E-mail emaederipfddde
Dow
nloa
ded
by [
Uni
vers
ity o
f C
onne
ctic
ut]
at 0
114
08
Oct
ober
201
4
1016 E Maumlder and S Gao
1 INTRODUCTION
Adhesion has been studied for many years and it is still one of the determiningfactors for the properties of all systems consisting of different phases includingpolymer composites An unsolved and sometimes a critical research issue is therelationship between lsquofundamentalrsquo adhesion as a physical phenomenon originatingfrom molecular attraction and lsquopracticalrsquo adhesion or adhesion strength whichcharacterizes the failure in berndashmatrix systems in terms of interface bond stressesor energy release rates [1ndash3] The relationship between these two adhesionmeasures was con rmed to some extent by the works of Mittal [1 4] Jacobaschet al [5 6] Schultz et al [7 8] and others although an exact quantitativeequation for the prediction of one from the other is still missing In our previouswork [5 6 9] existing approaches for the determination of the work of adhesionWA and adhesion strength iquest in polymerndash ber systems were analysed and thecorrelations between these quantities were established The surface free energiesof the bers were varied using different coupling agents The concept of localbond strength was used to characterize strength of an interface The attempt wasmade to analyse the contributions of the various interfacial interactions (van derWaals acidndashbase covalent bonding) to both the lsquofundamentalrsquo and lsquopracticalrsquoadhesion [9] A comparison of methods for the estimation of adhesion fromwetting inverse gas chromatography (IGC) and micromechanical destructive testdata enabled us to estimate the values of the contributions of different mechanismsto adhesional interaction The techniques of measuring the work of polymer-to- beradhesion based on wetting often give substantially underestimated values which isattributed to the low sensitivity of wetting to acidndashbase interactions at the interfaceIGC seemed to be a more correct technique To characterize the strength of anadhesional contact it is more advantageous to use the ultimate adhesion strengthcalculated for the onset of contact failure instead of the mean value The values ofthe work of adhesion based on ultimate adhesion strength calculated after Nardinand Schultz [7] are more consistent with those from the IGC data Adhesionof non-polar polymers occurs through van der Waals interaction only thereforedifferent ber sizings do not affect the adhesion strength For polar polymerssuch as acrylnitrile butadiene styrene and polystyrene adhesion is sensitive to bertreatments When the main contribution to the WA is made by covalent bonds theestimation of WA from micromechanical tests seems to be more reliable than fromusing IGC or wetting In these cases adhesion strength does not correlate with andis not predictable from the thermodynamic WA
Many researchers have also reported a lsquoweak correlationrsquo [10ndash12] or lsquono correla-tionrsquo [13 14] between the mechanical properties and the thermodynamic WA Thiscontradiction is a hint that some other mechanisms are acting besides dispersiveacidndashbase and covalent bonds After a comparative review Sharpe [15] concludedfor systems consisting of polyethylene and epoxy resin that there was no corre-lation between wettability and adhesion strength It was postulated that differenttreatments of polyethylene (thermal treatment cross-linking oxidation uorina-
Dow
nloa
ded
by [
Uni
vers
ity o
f C
onne
ctic
ut]
at 0
114
08
Oct
ober
201
4
Nanoscale interphase evaluation of composites 1017
tion transcrystallization) resulted in lsquosurface layers or interphases the (ultimate)mechanical properties of which are superior to those existing in the untreated poly-ethylenersquo However this postulate lsquocould not be proven because the resultinginterphases are very thin and therefore too fragile to handle and measurersquo
Recently we discussed the competition between adhesional interaction anddiffusion mechanisms [16] Adhesion in boundary layers is determined by bothmolecular interaction of the coupling agent with the ber and the matrix and theproperties of the formed interphase in particular its thickness and strength Thedesign of interphases in composites requires a separate investigation of differentadhesion mechanisms
Since it is well known that strong interfacial interaction is a necessary but notsuf cient condition for good stress transfer between the matrix and the brous re-inforcement Thus good adhesion between the ber and the interphase can resultin the failure through the interphase matrix boundary [17] On the other handa deposition of chemically-inactive interlayers which prevent acidndashbase interac-tions sometimes improves mechanical properties of composites although the WA
decreases [18 19] For instance a ductile material is often introduced between the ber and the matrix which facilitates energy absorption under loading [20] Thelatter is determined to a great extent by the thickness of the deposited interlayerand the degree of matrix penetration into it (interdiffusion) At a suf cient diffusionlevel an interpenetrating network (IPN) is formed which is an important conditionfor good bonding between the interphase and the matrix As a rule there is an op-timum interphase thickness if the interphase is too thick it itself becomes a lsquoweakpointrsquo and the failure occurs within it [20 21] The existence of such a variety offactors (chemistry topography morphology) which affect the performance of inter-phases makes it necessary to investigate each particular mechanism and to take allof them into account when designing composite interphases
These interphases comprise a signi cant part of the matrix phase even in re-inforced composites having medium ber content [22] so speci c properties ofthe boundary layers should be taken into account for modeling and designing ad-vanced materials Recently new non-destructive methods have been developedto characterize physical properties of the interphases It was demonstrated bymeans of atomic force microscopy (AFM) [23 24] dynamic mechanical analysis(DMA) [20 25] scanning electron microscopy (SEM) [26 27] and IGC [28 29]that the properties of the polymer in the vicinity of the ber altered signi cantlyThe reasons for this may be restricted segmental mobility transcrystallinity selec-tive adsorption of a component of polymeric composition different curing condi-tions and speci c interaction between the ber surface and the matrix polymerThese processes lead to the creation of an interphase resulting in a gradient in thematrix properties which affect the stress transfer through the interface On the otherhand interphases can be designed between the ber and matrix to control compositeproperties
Dow
nloa
ded
by [
Uni
vers
ity o
f C
onne
ctic
ut]
at 0
114
08
Oct
ober
201
4
1018 E Maumlder and S Gao
The theoretical consideration has shown that the stress distribution at the berndashmatrix interface can be considerably altered depending on interphase elastic mod-ulus and thickness [20 30] This means that the design of the interface should bebased on the foregoing analysis of interactions for a given polymerndash ber pair Itis important to mention that either a strong or a weak interphase may be desirablefor different classes of composites Indeed for many thermoplastic polymers espe-cially when they are non-polar the main issue is an increase in interfacial adhesionOn the contrary most thermosetting polymers possess very good adhesion to carbonand glass ber surfaces which results in brittle fracture and low impact resistanceIn this case interphases should be created for example by introducing a ductile or exible material between the ber and the matrix [20]
The design of an interface can be performed when a composite is being formedor partly before composite formation (matrix modi cation ber surface treatment)However the effectiveness of these can be shown only after the composite forma-tion Two research directions are of great importance at this stage rst directmeasurements of the interphase properties and second micromechanical experi-ments aimed at examining the ability of the boundary layer for stress transfer Suchinformation is a necessary basis for future target-oriented interfacial design
In this work special AFM techniques (phase imaging and nanoindentation) wereused to investigate the structure extent and properties of the interphases betweenglass bers and polymer matrices of different natures
2 EXPERIMENTAL
21 Materials and sample preparation
211 Fibers The bers utilized in this research were E-glass bers withaverage diameters of 13 and 31 sup1m made at the Institute of Polymer Research(IPF) Dresden During the continuous spinning process the bers were sizedby the silane coupling agent 03 wt deg -aminopropyltriethoxysilane (APS Huumlls-Degussa AG Germany product name AMEO) in conjunction with 3 wt PP(Sybron Chemicals Inc USA product name Protolube 3974) or 3 wt PU lmformers (DSM Italia srl product name Neoxil 9851 PU) in an aqueous spinningbath at ambient temperature and a nal pH-value of 10sect05 For ber surfacecharacterization specimens were prepared by glueing individual unsized PP- andPU-sized ber laments on a steel plate parallelly by using a thin layer of pre-coatedepoxy
212 Composites The composites consisting of unidirectional glass bers andepoxy resin (Ruumltapox L20 Ruumltadur SL in a weight ratio of 100 34 manufacturedby Bakelite AG) were made by prepregging in the rst step and hot pressing of tenprepreg layers in a vacuum assisted cycle for 6 h at 80plusmnC The unidirectional glass ber-reinforced PP matrix composites were processed as sheets with a thickness
Dow
nloa
ded
by [
Uni
vers
ity o
f C
onne
ctic
ut]
at 0
114
08
Oct
ober
201
4
Nanoscale interphase evaluation of composites 1019
of 025ndash03 mm by lm stacking and lament winding which enabled a goodorientation a high homogeneity of impregnation and a void content below 1The plates were consolidated at a pressure of 27 MPa a temperature of 215plusmnC anda holding time of 5 min A maleic anhydride-modi ed polypropylene (PPm melt ow index MFI D 36 g10 min) used as matrix was produced from isotactichomopolymer with an average molecular weight Mw D 16 pound 104 by blendingwith maleic anhydride grafted PP (Polybond 3150 with Mw D 9 pound 104 ) Forinterphase tests the specimens were polished perpendicularly to the ber axiswith a SiO2 Al2O3 suspension down to an average grain size of 006 sup1m Aftercleaning in water and drying in an N2 environment the polished sample wasanalyzed using phase imaging and then indentation mode AFM To avoid erroneousresults due to roughness the surface was analyzed for atness with a maximumpermissible topographical variation of 10 nm In addition a smearing of softmaterial over lsquohardrsquo material is possible so a careful analysis should be carriedout For mechanical testing the short ber-reinforced PP composites also wereproduced by feeding the glass ber rovings into the PP-melt using a twin-screwextruder (Werner amp P eiderer Stuttgart Germany) The ber contents were keptconstant at 30 by weight
22 AFM image analysis
221 Topography and roughness An AFM (a Digital Instruments D3100) wasused as both a surface imaging tool and an indentation device to evaluate thenanoscale response of polymer samples The topography of samples was studied inTapping Mode Images consisted of 512 pound 512 pixels and the scanning frequencywas 1 Hz A silicon cantilever with normal spring constant of 15ndash63 Nmand a tip radius of 5ndash10 nm was used A piezo-electric scanner excites thecantilever substrate vertically causing the tip to bounce up and down at its resonancefrequency of 656 kHz with a drive amplitude of 200 mV As the cantilever bouncesvertically the re ected laser beam reveals information about the vertical heightof the sample surface For all samples several images were recorded at differentlocations to verify the reproducibility of the observed features
The statistics used for the roughness analysis was derived from ASME B461(lsquoSurface Texture Surface Roughness Waviness and Layrsquo ) available from theAmerican Society of Mechanical Engineers and is described in detail elsewhere [31]
222 Phase imaging During scanning in the tapping mode AFM phase shiftsie changes in the phase angle of vibration with respect to the phase angle ofthe freely-oscillating cantilever recorded simultaneously with height changes arepresent as a phase image The phase image reveals differences in surface propertiesof material which are currently only qualitative in nature and for that reasonscanning conditions must be very similar for meaningful comparisons to be drawnbetween images Thus phase images were produced using the following settings asetpoint voltage equal to 50ndash55 of the free vibrational amplitude which ranged
Dow
nloa
ded
by [
Uni
vers
ity o
f C
onne
ctic
ut]
at 0
114
08
Oct
ober
201
4
1020 E Maumlder and S Gao
from 20 to 25 V a scan rate of 1 Hz and integral and proportional gains of 02and 20 respectively The difference between the setpoint and the free amplitude isdirectly related to the amount of force applied to the surface during imaging Harderless viscoelastic phases will be brighter than softer more viscoelastic phases
23 AFM nanoindentation and data reduction
The AFM nanoindentation has a displacement resolution of 016 nm and a loadresolution of less than 03 sup1N allowing precise measurements of depth h andload F and thus the mechanical properties of a thin layer on the material surfacecan be determined The indentation cantilever has a spring constant of 136 Nmand a resonance frequency of 50 kHz The three-sided pyramid diamond tipmounted at the end of the cantilever has a tip radius that is less than 20 nmto assure good imaging resolution and nanometer-scale indents For reliableindentation measurements involving sub-micrometer scale contacts an accuratecharacterization of the indenter tip shape is required In current research we areutilizing an AFM tapping mode to measure the tip and precise cross-sectionalarea A vs contact depth hc is determined following the equation A D 158h2
c C106hc [31] The normal indent load was determined by mutiplying the cantileverspring constant by the cantilever de ection sensitivity (the ratio of the change inphotodiode voltage to nanometers of tip de ection) The cantilever de ection iscalibrated using an lsquoin nitely stiffrsquo sapphire for which vertical piezo motion isdirectly translated into vertical tip de ection Nanoindentation measurements on the ber surface and the polished cross-section of the composite specimens were madein the normal load range from 017 to 12 sup1N The indents on the cross-section ofcomposites were made radially outward from the ber along a path of approximately1 sup1m in the ber and 2 sup1m in the matrix For indentation load F D 026 sup1N eachsuccessive indent was displaced by 40 nm in order to avoid overlapping of plasticdeformation zones onto neighbouring indents
Basically the method for measuring hardness and modulus using nanoindentationmethods involves making a small indentation in the specimen with an indenterwhile continuously recording the indentation force F and penetration depth h Itis known that the mechanical behaviour of a visco-plastic material such as a polymergenerally shows time-dependent phenomena which would make measurements lessaccurate The Youngrsquos moduli determined from the AFM nanoindentation testson polycarbonate surfaces were found to be reasonably insensitive to a range ofindentation rates for one complete cycle of loading and unloading [32] and for thatreason an indentation rate of 1 Hz which is within the range was applied for allthe tests in this study A typical set of indentation force-penetration depth curves ispresented in Fig 1 which also serves to de ne some of the experimental quantitiesinvolved in the analysis As the indenter is driven into the specimen surfaceboth elastic and plastic deformations occur The plastic deformation results in theformation of a permanent indentation that conforms to the shape of the indenterto some contact depth hc The analysis assumes that during the initial unloading
Dow
nloa
ded
by [
Uni
vers
ity o
f C
onne
ctic
ut]
at 0
114
08
Oct
ober
201
4
Nanoscale interphase evaluation of composites 1021
Figure 1 Typical indentation forcendashpenetration depth curves corresponding to the indentationlocation for the PU sized breepoxy composites The maximum depth achieved during theindentation is shown as hmax with the corresponding indentation force shown as Fmax The stiffnessof contact at the start of unloading is shown as the slope of the unloading curve
only elastic recovery of the indent occurs and the area of the indent remains inperfect contact with the indenter [33] The slope dF=dh is then calculated froma linear t to the rst portion of the retracting curve and extrapolated to the depthat zero load Beyond the initial part the retracting curve becomes curved as thematerial laterally surrounding the indent recovers viscoelastically An analysis ofthe elastic unloading curve can be used to relate the aforementioned experimentally-measured parameters to the projected contact area A and an effective reducedelastic modulus Er which includes contributions from both the specimen and theindenter [34] The reduced modulus is given by
Er Dp
frac14 cent dFdh
2macr centp
A (1)
where macr is 1034 for a triangular indenter [35] and A is the projected contact area(cf [31]) which is a function of the contact depth of the indent hc The modulusEs of the specimen can be deduced from the equation below
1Er
D1 iexcl ordm2
i
EiC
1 iexcl ordm2s
Es (2)
where ordm is Poissonrsquo s ratio the subscripts i and s refer to the properties of theindenter materials and the specimens respectively The properties of the diamond
Dow
nloa
ded
by [
Uni
vers
ity o
f C
onne
ctic
ut]
at 0
114
08
Oct
ober
201
4
1022 E Maumlder and S Gao
indenter used were as follows Poissonrsquo s ratio ordmi D 007 and Youngrsquos modulusEi D 1140 GPa [36] The values of the Poissonrsquo s ratio ordms used were 024 for theE-glass and 042 for epoxy PPm and PU The Poisson ratio of the interphase wasassumed to be constant and equal to the matrix value The tensile moduli of epoxyand PPm are 27 and 14 GPa respectively [23]
3 RESULTS AND DISCUSSION
31 Interphase characterization by phase imaging
Figure 2 is a pair of topography phase images from identical areas captured onthe APSPU sized glass berPPm matrix composites Notice there are strikingdifferences between the topographic (Fig 2a) and phase (Fig 2b) images witha few corresponding features This fairly smooth surface of the cross-sectionunderwent a ne surface polishing The topographic image shows no apparentheight differences and a featureless surface preventing the identi cation of differentmaterials However the phase images show sharp contrast between the berinterphase and matrix regions revealing a difference in the material propertiesof these three regions The cross-sectional analysis of the phase image can easilypinpoint the location of the ber interphase matrix boundary It must be mentionedthat a concave bre surface as shown here is frequently observed due to theirregularity of the bre surface at a very small scale such as 200 nm The transitionlayer adhering to ber surface (shown clearly in Fig 2b) corresponds to a regionrich in APSPU sizing while the bottom area corresponds to a PPm matrix regionThe sizing distribution was observed to be nonuniform in all three dimensionsshown in the later part of this paper which results in thin and thick interphases from10 to 150 nm It is interesting to note that the blurred boundary between APSPUsizing and PPm matrix can be attributed to the partial miscibility interdiffusion andentanglement of polymer chains to some extent
The major morphology of the interphase was quite uniform with a reduced phaseangle (dark contrast) in comparison to the phase angle of matrix indicating thatthe interphase possessed low stiffness and consisted of a homogeneous regionwithout microvoids due to the dominating amorphous nature of the PU polymerConsequently the crystallization behaviour of PPm which is separated from the ber surface by the interphase should not be affected by the presence of glass beras supported by our previous results obtained by DSC [37]
A clear interphase was also observed for the APSPP sized glass berPPmsystem as shown in Fig 3 but it was somewhat different from the aforementionedcase A strong in uence of APSPP sizing on the crystallization behaviour of PPmmatrix could be detected in Fig 3a where the PPm matrix near the ber surfaceis an aggregation of radially-oriented lamellae It is believed that the nucleationdensity of spherulites from the APSPP sizingndash PPm interface is increased [38] Thespherulites emerging from the sizing surface and the bulk matrix impinged on each
Dow
nloa
ded
by [
Uni
vers
ity o
f C
onne
ctic
ut]
at 0
114
08
Oct
ober
201
4
Nanoscale interphase evaluation of composites 1023
Fig
ure
2A
FM
3D(a
)to
pogr
aphi
can
d(b
)ph
ase
imag
esof
inte
rpha
sein
AP
SP
Usi
zed
glas
s
bre
PP
mat
rix
com
posi
tes
Dow
nloa
ded
by [
Uni
vers
ity o
f C
onne
ctic
ut]
at 0
114
08
Oct
ober
201
4
1024 E Maumlder and S Gao
Fig
ure
3A
FM
phas
eim
ages
ofin
terp
hase
inA
PS
PP
size
dgl
ass
br
eP
Pm
atri
xco
mpo
site
sT
heim
age
(a)
re
ects
the
mos
tly
dete
cted
tran
scry
stal
line
zone
ofab
out3
00nm
thic
knes
sw
here
as(b
)sh
ows
ase
ldom
foun
din
terp
hase
ofab
out2
sup1m
thic
knes
sT
here
gion
in(c
)il
lust
rate
sa
mag
ni
edvi
ewof
the
regi
onbe
twee
nth
ein
terp
hase
and
PP
mndash
mat
rix
in(b
)
Dow
nloa
ded
by [
Uni
vers
ity o
f C
onne
ctic
ut]
at 0
114
08
Oct
ober
201
4
Nanoscale interphase evaluation of composites 1025
other resulting in a higher order of alignment and compact packing structure iea kind of sizing-induced transcrystallinity Although most phase images revealedthat an interphase with a thickness of approximately 100 raquo 200 nm was formed(Fig 3a) a few interphase layers consistent with excessive PP sizing as thickas 2 sup1m were also observed (Fig 3b) The rough interphase layer displayedwell-distributed small particles of raquo200 nm in diameter apparently resulting fromspherulitic crystallization of the low-molecular-weight PP sizing or due to the highsurface free energy of unsized regions of the glass ber The appearance of aboundary (dark contrast in Fig 3c) implied a weak bond between these spherulitiesdue to the absence of intercrystalline links Therefore the failure could occurwithin the thick interphase This observation lead to the assumption that the changein interphase thickness will affect the mechanism of interfacial failure It washypothesized that an optimum interphase thickness for this semicrystalline sizingshould not be larger than the diameter of the spherulites since the failure wouldbe primarily interlamellar slip and deformation providing great resistance to crackpropagation in comparison to crack going along the weak spherulite boundaryfor the thick interphase case This mechanism correlates well with our previousmicromechanical characteristics of the alteration of interfacial bond strength as afunction of the interphase thickness [39]
The detailed phase image of the boundary between the interphase and matrixpresented in Fig 3c suggests that the two distinct crystallites of APSPP sizing andPPm matrix tend to penetrate into each other resulting in a nanoscale rough regionIn general the ber itself and the matrix type and its thermal history have allbeen reported to affect transcrystallization in these composites to some extent [40]Speci cally a signi cant implication of Fig 3c is that the much rougher surfaceof the sizing layer may absorb and interlock the PPm molecular chains becauseof the different crystallization behaviour during processing which could apparentlyincrease the surface-seeding nucleation density
In sharp contrast to the phase image of the APSPU sized glass ber PPm systemthe brighter contrast of the interphase region implied high overall stiffness in theAPSPP sized glass berPPm composites (Fig 3c) A region corresponding to thePPm matrix appeared dimmer implying relatively low overall stiffness It is worthmentioning that the imaging without a low amount of force (lsquohardrsquo tapping) appliedto the surface allows visualization of sub-surface structures and differentiation ofaforementioned regions In other words this nding indicated that the structureobserved was a feature of the interphase microstructure and was not caused by eitherthe topmost surface adsorbing material or by polishing induced surface aws whichwill be further con rmed by the following nanoindentation test An enhancement ofthe stress transfer through this compact and highly stiff interphase will be expected
32 Quantitative characterization of interphase by nanoindentation
It is well known that both the stress transfer from matrix to ber and bond strengthdepend on the local microstructures of interphases consequently the design of new
Dow
nloa
ded
by [
Uni
vers
ity o
f C
onne
ctic
ut]
at 0
114
08
Oct
ober
201
4
1026 E Maumlder and S Gao
and optimized ber-reinforced polymers necessitates an improved knowledge of theproperty pro les for interphases This part of the work is concerned with an attemptto investigate local interphase moduli quantitatively using an AFM nanoindenterwith high spatial resolution
A typical variety of indentation force-penetration depth responses were measuredas shown in Fig 1 The extending curve is a result of the diamond tip beingcompressively loaded and penetrated into the specimen and the retracting curveresults from the tip being unloaded and pulled out from the sample surface Theoverlap of extendingndashretracting curves for glass ber suggests that the tipndashsampleinteraction is dominated by much larger amounts of elastic recovery and lessinelastic deformation than the bulk polymer matrix From a practical view asmearing layer on the surface always exists which is due either to polishing processor surface investigation under ambient air conditions The extending curves at the rst 1ndash2 nm of the penetration depth have a lower stiffness than the rest presumedto be associated with the smearing effect Since the thickness of the smearinglayer should not vary with penetration depth a further study of the moduli as afunction of indentation forces showed that the layer had a negligible in uence onthe measurements within the range of indentation forces used in this study Theinterphase region produced responses different from either the glass ber or the bulkmaterial re ecting local variation in mechanical behaviour andor microstructure ofthe interphase as discussed further in the following
Figures 4 and 5 show the pro les of Youngrsquos modulus across the ber interphase matrix region of the APSPU sized and APSPP sized glass ber PPm matrix andof unsized or APSPU sized ber epoxy composites which are calculated basedon equations (1) and (2) It can be infered from the data in Fig 6 that the averageYoungrsquos moduli with standard deviation (SD) measured from the nanoindentationare 19 (SD 04) 37 (SD 09) and 611 (SD 115) GPa for the PP epoxy matrixand E-glass ber respectively which are reasonably comparable to the valuesreported from macroscopic tensile tests on these materials [23] The wide scatterin the results for the cross-sectional surface of the glass ber is probably due tosmall indentation depths which are less than 10 nm therefore the in uences ofthe polishing induced surface roughness and surface microcracks should not beignored These effects are further evidenced by the smaller standard deviationin modulus resulting from the indentation on the unpolished ber surface asshown in Fig 7 Nevertheless the amount of this variation is relatively smallin comparison to the difference between the moduli of interphase and matrixin the aforementioned three types of systems Speci cally the average moduliof the interphase are more than half as and three times bigger than the matrixvalues for APSPU-PPm and APSPP-PPm systems respectively Therefore thedistinctive interphase characteristics are quite evident within the limit of accuracyMost importantly the modulus pro les reveal that the interphases of APSPU andAPSPP sized glass ber-reinforced PPm matrix systems show different behavioursie the interphase with APSPU sizing is much softer than the matrix while the
Dow
nloa
ded
by [
Uni
vers
ity o
f C
onne
ctic
ut]
at 0
114
08
Oct
ober
201
4
Nanoscale interphase evaluation of composites 1027
(a)
(b)
Figure 4 The pro les of moduli across the matrix interphase bre region in (a) APSPU sized and(b) APS PP sized brePP composites
interphase with the APSPP sizing is apparently harder than the matrix in whichthe modulus was constant and independent of distance away from the ber surfaceThe increased stiffness of the interphase can be attributed to the APSPP sizingsubjected to speci c conditions of crystallization This is in fair agreement with
Dow
nloa
ded
by [
Uni
vers
ity o
f C
onne
ctic
ut]
at 0
114
08
Oct
ober
201
4
1028 E Maumlder and S Gao
(a)
(b)
Figure 5 The pro les of moduli across the matrix interphase bre region in (a) unsized (b) and(c) two different sections of APS PU sized breepoxy composites
the phase imaging observations as discussed above However this observationmay not support the assumption that the transcrystallinity permits an increasingstiffness since the thickness of the transcrystalline layer is apparently larger thanthat of the interphase measured here The interphase thickness measured from both
Dow
nloa
ded
by [
Uni
vers
ity o
f C
onne
ctic
ut]
at 0
114
08
Oct
ober
201
4
Nanoscale interphase evaluation of composites 1029
(c)
Figure 5 (Continued)
nanoindentation and the above phase imaging tests varied between less than 100 toapproximately 300 nm depending on the type of sizing and matrix materials It isworth mentioning that the measured interphase thickness is signi cantly larger thanthe calculated average thickness of sizing layer (raquo47 nm) from the sizing processwhich is probably due to the formation of cluster agglomerates and diffusion effects
As expected it can be seen from Fig 5a that the unsized ber epoxy sampledoes not show any evidence of interphase with different modulus from the matrixwithin the scatter range in the data In other words this shows that the surroundingpure epoxy matrix cannot form an interphase at unsized glass bers In sharpcontrast the interphase with a property gradient was found in the APSPU sizedglass ber epoxy matrix system (Fig 5b and c) It is worthwhile noting that sucheffect of the inhomogeneities on Youngrsquos modulus was repeatable which couldalso be tted and expressed as a single-exponential pro le [31] Based on the ttedcurve if the interphase is de ned as a region with modulus higher than at least 10of the matrix values the thickness of the interphase would be about 300 nm Theinterphase with a property gradient re ects that the amine curing agent may tend tomigrate toward and diffuse into the APSPU sizing creating an amine-rich regionadjacent to the glass ber surface which perhaps plays a key role in the chemicalinteraction and development of interphase microstructure during processing at atemperature of 80plusmnC for 6 h A detailed phase image observation on the depletionzone will be conducted using cantilever tips with different spring constants in ourfuture work
Dow
nloa
ded
by [
Uni
vers
ity o
f C
onne
ctic
ut]
at 0
114
08
Oct
ober
201
4
1030 E Maumlder and S Gao
(a)
(b)
Figure 6 Variation of modulus (F) and maximum penetration depth ( n ) as a function of indentationforce for (a) pure epoxy and (b) E-glass bre determined at polished cross-sections
In the current study Poissonrsquo s ratio of the interphase was assumed equal to thematrix value in the calculation of Youngrsquos modulus If Poissonrsquo s ratio was assumedto be 03 or 05 instead of 042 the extracted Young modulus increased by 10or decreased by 89 respectively Therefore the amount of this variation is alsorelatively small in comparison to the difference between the moduli of the interphaseand matrix
Figure 6 shows the effect of variation in indentation force on the calculatedmodulus associated with penetration depth for pure epoxy (Fig 6a) and pureglass ber (Fig 6b) Within the standard deviation it can be seen that moduliof both epoxy and glass ber appear to be constant in the range of penetrationdepth from about 5 to 80 nm and 2 to 9 nm respectively The results with highrepeatability in the range of indentation force from as small as 024 up to 12 sup1Nwarrant further investigation using the current nanoindentation technique which isbased on accuratly-established shape function of the topmost tip of the indenter In
Dow
nloa
ded
by [
Uni
vers
ity o
f C
onne
ctic
ut]
at 0
114
08
Oct
ober
201
4
Nanoscale interphase evaluation of composites 1031
(a)
(b)
Figure 7 (a) Modulus as a function of indentation force for unsized (E) APS PP sized (u ) andAPSPU sized (e) glass bre surfaces (b) Schematic illustration showing the variation of mixturestiffness with volume fraction of two components vs indentation force or penetration depth
addition the hypothesis that the property of a polished material surface may notrepresent the bulk property due to various surface damages is examined here usingdifferent indentation forces and such an effect is not dramatic for the range of usedindentation depth
As regards the interphase detection the property gradients were in generalrepeatably observed for the APSPU sized glass ber reinforced epoxy matrixsystem (Fig 8) However the respective mechanical data in the closest part ofthe ber edge should be interpreted with great care particularly when a higherindentation force was applied The data presented in Fig 9 display a strongdependence of the modulus pro le on applied force for the unsized ber epoxysystem in which an unexpected and extremely high lsquointerphase modulusrsquo can beinduced when high indentation forces are applied
The signi cant increase in the apparent modulus is attributed to the lsquoboundaryeffectrsquo Speci cally two different microscopic mechanisms are identi ed to
Dow
nloa
ded
by [
Uni
vers
ity o
f C
onne
ctic
ut]
at 0
114
08
Oct
ober
201
4
1032 E Maumlder and S Gao
Figure 8 The pro les of moduli across the APSPU sized glass bre interphase epoxy matrixsystem at indentation forces (a) 024 sup1N (b) 26 sup1N (c) 52 sup1N and (d) 123 sup1N
accommodate the applied loading (i) the strong in uences of mechanical contactbetween a part of the apex of the tip and the ber edge as well as polymermaterials and (ii) plastic deformation restricted by the presence of ber Forthe former type of boundary effect the increase in the contact stiffness andthe reduction in both the contact area and indentation depth are responsible forthe apparent high lsquointerphase modulusrsquo Interestingly a detailed examinationof indentation forcendashpenetration depth curves in Fig 1 shows marked changesin the slope in the extending curves However a similar stiffness is presentedduring the initial stage of unloading for indentation at location of B in comparsionwith that of indentations of the ber This observation proves that the indentersequentially contacts the polymer material and ber edge As the rst approachassuming a perfectly at berndash interphasendash matrix transition the width of this typeof boundary effect zone depends on the geometrical conditions of the tip andindentation depth (force) associated with the experimentally-measured modulus forvarious indentation forces The data within this zone always present much higher
Dow
nloa
ded
by [
Uni
vers
ity o
f C
onne
ctic
ut]
at 0
114
08
Oct
ober
201
4
Nanoscale interphase evaluation of composites 1033
Figure 9 The pro les of moduli across the unsized glass bre interphase epoxy matrix system atvarious indentation forces (a) 024 sup1N (b) 26 sup1N (c) 52 sup1N and (d) 123 sup1N
values than those in the others The observation of the lower indentation forceresulting in a smaller zone of boundary effect provides the motivation for interphasecharacterization under an extremely low force
For the second case the mechanical response of indentation is also in uencedas the stress distribution near the indenter will be affected by such a heterogeneoussurface due to the presence of ber resulting in an increased resistance to the de-velopment of the plastic zone around the indenter The width of the in uence zoneas de ned by mechanical restrictions will be of the order of the contact radius [41]which is therefore a function of indentation area as a result of penetration depthand indentation force In addition the uncertainty in the calculated modulus in thisregion would be complicated by the fact that the restriction effect may be affectedby the quality of interfacial adhesion whereby the material structure and adhesionproperty of interphase could be varied independently of each other This means thatthe doubtful data points within the above two types of zones near the ber edgeshould all be omitted for the interphase evaluation
Dow
nloa
ded
by [
Uni
vers
ity o
f C
onne
ctic
ut]
at 0
114
08
Oct
ober
201
4
1034 E Maumlder and S Gao
For revealing interphase properties the present results strongly suggest that theindentation under an extremely low indentation force guaranteed the measurementsnot to be in uenced by boundary effects in the zone which is very near the beredge On the other hand requisite conditions and experimental procedure using asmall indentation force are well-polished sample surface well identi ed geometryof indenter and high repeatability It is also emphasized that similar absolutemodulus values obtained in a range of indentation forces should ensure eliminationof effects on the mechanical response from various surface forces such as van derWaals electrostatic and capillary forces
33 Fiber surface characterization by nanoindentation
From the above discussion it should be clear that those involved in the designof an interphase have a need to characterize a ber surface in situ and assistwith the optimization of the sizings before processing of composites indirectmicromechanical testing and other time-consuming testing of composites
Direct apparent modulus measurements on ber surfaces were performed by alsoemploying various indentation forces In these tests nanoindentations were madeperpendicular to the ber surface and each point represents an average of twentyindividual measurements As can be seen in Fig 7 both APSPU sized andAPSPP sized ber surfaces exhibit a decrease in moduli with reduction of theindentation force and penetration depth compared to the unsized ber surfaceNote that the average thickness of APSPU and APSPP sizings is only about47 nm The penetration depth decreased to about 5 nm by employing an indentationforce of 0012 sup1N However the measured penetration depth is more than 30 nmat an indentation force of 12 sup1N whereas it would be much larger than 30 nmif there were no substrate in uences (cf Fig 6) It seems appropriate that themechanical response might be modelled as two springs in series revealing in uencesfrom the sizing layer and ber respectively Therefore it is not surprising athigh indentation force that the apparent modulus re ects the dominant contributionfrom the substrate as evidenced by comparable values of unsized and sized berspecimens In this study we extrapolate the data for a very small indentation forcethat is to say when the penetration depth decreases to less than 10 nm which ismuch smaller than the thickness of sizing The in uence of substrate ber couldbe reduced and the apparent modulus would be closer to the lsquotruersquo value of sizingThe rst reliable measurements were recorded at F D 024 sup1N and an average oftwenty tests on PP sizing gives E D 65 sect 18 GPa which is slightly higher but stillin fairly good agreement with the interphase modulus value (Ei D 58 sect 06 GPaFig 4b) Clearly variations in the sizing structure or inhomogeneous distributionon the ber surface may lead to a reasonable variation in the apparent modulusvalues Therefore a detailed understanding of the surface topographic nature isrequired and is presented in the following section Most importantly the PP sized ber surface (cf Fig 7) in general shows a higher apparent modulus than thePU sized ber surface which provides strong evidence for the measured different
Dow
nloa
ded
by [
Uni
vers
ity o
f C
onne
ctic
ut]
at 0
114
08
Oct
ober
201
4
Nanoscale interphase evaluation of composites 1035
Table 1Comparison of interphase moduli adhesion strength and macromechanical properties
Sizing Interphase modulus Adhesion Tensile Charpy unnotched(GPa) strength strength impact toughness
iquestapp (MPa) (kJm2
(MPa)
APS PU-PPm 08 sect 05 109 sect 59 374a 133a
APS PP-PPm 58 sect 07 217 sect 44 736a 350a
Unsized ber-EP 37 sect 08 46 sect 5 273b
APS PU-EP 37 C 30 expiexclr=70c 656 sect 6 492b
a Short ber reinforced specimens 134 vol glass bersb Unidirectional ber reinforced epoxy composites 50 vol glass bers transverse tensile testingc Equation for determinationof interphasemodulus pro le in dependence on the distance from ber
edge r in nm
interphase moduli in their thermoplastic matrix systems where the sizing resin doesnot penetrate extensively within the matrix
The changes in ber surface topography following surface sizing [31] revealedvery low roughness for unsized bers The APSPU sized ber surface revealed aless distinct morphology with both thin and thick layers ranging from 30 to severalhundred nm From the image mean roughness and maximum height roughnessare 83 and 341 nm respectively which are only slightly higher than those ofunsized samples (Ra D 54 nm Rmax D 318 nm) implying that the dispersedPU particles result in a fairly good coalescence and nanoheterogeneous structureon the ber surface On the contrary the APSPP sizing structure on the bersurface differs considerably from those described above which had a crystallinemorphology with a diameter of raquo200 nm resulting in the highest surface roughnessvalues (Ra D 15 nm Rmax D 71 nm) among all the systems studied and amuch higher asymmetry Furthermore the sizings seem to be very sensitive tomoisture absorption and show a high degree of swelling which will be reportedelsewhere [42] It is important to note that the surface features and crystallinemorphology presented here clearly correlate with the phase imaging observationsof the interphase (cf Figs 2 and 3) thereby indicating the intrinsic non-chemicalreaction nature of the thermoplastic systems as well as further demonstrating thereliable interphase characterization techniques developed in this study
Table 1 shows a summary of the ber surface moduli interphase moduli andadhesion strength as well as real composite properties (tensile strength and impacttoughness for short ber reinforced PP cf [43] and transverse tensile strengthfor unidirectional epoxy resin composites) In comparing the two systems themechanical properties of the bulk composite demonstrate the same trends with themoduli of interphases and adhesion strength A detailed discussion of interphaseinteraction mechanisms in conjunction with mechanical performance is givenelsewhere [31] Future efforts are directed towards simulating the variation of the
Dow
nloa
ded
by [
Uni
vers
ity o
f C
onne
ctic
ut]
at 0
114
08
Oct
ober
201
4
1036 E Maumlder and S Gao
stress eld and modeling the fracture behavior according to the nanoscale interphaseproperty variation
4 CONCLUSIONS
The AFM mdash phase imaging and nanoindentation techniques mdash can be used tocharacterize the local interphasial properties on a nanometer scale In additionto qualitative detection of the interphase extent and structure by phase imagingthe nanoindentation technique allows a quantitative determination of local samplesurface modulus and its pro le depending on the position from ber to bulk matrixThe nanoindentation measurements at a considerably small indentation force gavereliable data for the local Youngrsquos moduli The prerequisites for correct modulusdetermination are a sample roughness of the polished cross sections around 10nm and the exactly identi ed geometry of the initial cantilever tip Besidesthe two boundary effects mdash (i) the tip contacts ber and interphase and (ii) thedeformation of the small matrix amount is in uenced by the plastic deformationresistance caused by the cantilever and the neighbouring ber mdash were identi edand experimental data affected by these boundary effects were excluded
Thus the modulus pro les in dependence on the position from the ber surfacecould be revealed for differently sized glass bers either in polypropylene or epoxyresin matrix Depending on the lm-former a greater modulus of the interphasewas consistent with improved mechanical performance of polypropylene matrixcomposites whereas a lower modulus deteriorated both the strength and toughnessFor unsized ber samples in epoxy resin an interphase of different modulus couldnot be detected
Future effort is directed towards designing nanoscale interphase property variationand establishing a simulation model related to stress elds
Acknowledgements
The research work was carried out in the frame of the Thematic Network lsquoInter-phasersquo project no BETN 96 0507 Contract no BRRT-CT97-5004 The authorsgratefully acknowledge the nancial support from the European Community
REFERENCES
1 K L Mittal in Adhesion Measurement of Films and Coatings K L Mittal (Ed) pp 1ndash13VSP Utrecht The Netherlands (1995)
2 D E Packham Int J Adhesion Adhesives 16 121ndash128 (1996)3 K Kendall Composite Interfaces 4 299ndash312 (1997)4 K L Mittal in Adhesion Science and Technology L-H Lee (Ed) Part A pp 129ndash168
Plenum Press New York (1975)5 H-J Jacobasch K Grundke P Uhlmann F Simon and E Maumlder Composite Interfaces 3
293ndash320 (1996)
Dow
nloa
ded
by [
Uni
vers
ity o
f C
onne
ctic
ut]
at 0
114
08
Oct
ober
201
4
Nanoscale interphase evaluation of composites 1037
6 E Maumlder K Grundke H-J Jacobasch and G Wachinger Composites 25 739ndash744 (1994)7 M Nardin and J Schultz Composite Interfaces 1 177ndash192 (1993)8 M Nardin E M Asloun and J Schultz in Controlled Interphases in Composite Materials
H Ishida (Ed) pp 285ndash293 Elsevier Amsterdam (1990)9 E Pisanova and E Maumlder J Adhesion Sci Technol 14 415ndash436 (2000)
10 M Nardin E M Asloun and J Schultz Polym Adv Technol 2 115ndash122 (1991)11 P H Harding and J C Berg J Adhesion Sci Technol 11 471ndash493 (1997)12 I Ulkem and H P Schreiber Composite Interfaces 2 253ndash263 (1994)13 H-J Jacobasch K Grundke E Maumlder K-H Freitag and U Panzer J Adhesion Sci Technol
6 1381ndash1396 (1992)14 H-J Jacobasch Macromol Chem Macromol Symp 75 99ndash113 (1993)15 L H Sharpe Proc 5th European Adhesion Conf 2000 Lyon pp 349ndash35716 E Pisanova S Zhandarov and E Maumlder in Proc of the 12th Internat Conf on Composite
Materials (ICCM-12) Paris France T Massard and A Vautrin (Eds) CD-ROM Publication(1999)
17 A S Crasto S H Own and R V Subramanian Polym Composites 9 78ndash92 (1988)18 J M Felix P Gatenholm and H P Schreiber Polym Composites 14 449ndash457 (1993)19 I Ulkem and H P Schreiber Composite Interfaces 2 253ndash263 (1994)20 M Labronici and H Ishida Composite Interfaces 2 199ndash234 (1994)21 F M Zhao N Takeda K Inagaki and N Ikuta Adv Composites Lett 5 113ndash116 (1996)22 G R Palmese O A Andersen and V M Karbhari Composites A30 11ndash18 (1999)23 K Mai E Maumlder and M Muumlhle Composites A29 1111ndash1119 (1998)24 M R VanLandingham R R Dagastine R F Eduljee R L McCullough J W Gillespie Jr
Composites A30 75ndash83 (1999)25 J L Thomason Composites Sci Technol 44 87ndash92 (1992)26 P F M Meurs P J G Schreurs T Peijs and H E H Meijer Composites A27 781ndash 786 (1996)27 R L Clark Jr R G Kander and B B Sauer Composites A30 27ndash36 (1999)28 Yu S Lipatov Physical Chemistry of Filled Polymers English translation by R J Mosely
InternationalPolymer Science and Technology Monograph No 2 Moscow (1977)29 V I Irzak and L I Kuzub Composite Interfaces 4 45ndash53 (1996)30 L E Asp L A Berglund and R Talreja Composites Sci Technol 56 657ndash 665 (1996)31 S Gao and E Maumlder Composites Part A (submitted)32 H A Mizes K G Loh R J D Miller S K Ahuja and E F Grabowski Appl Phys Lett 59
2901ndash2903 (1991)33 M F Doerner and W D Nix J Mater Res 1 601 (1986)34 I N Sneddon Int J Eng Sci 3 47 (1965)35 B Bhushan in Handbook of Micronanotribology Ch 9 CRC Press Boca Baton FL (1995)36 G Simmons and H Wang Single Crystal Elastic Constants and Calculated Aggregate Proper-
ties A Handbook 2nd edn MIT Press Cambridge MA (1971)37 G Pompe and E Maumlder in Proc of the 12th Internat Conf on Composite Materials (ICCM-
12) Paris France T Massard and A Vautrin (Eds) CD-ROM Publication (1999)38 G Pompe and E Maumlder Composites Sci Technol 60 2159ndash2167 (2000)39 E Maumlder and E Pisanova Polym Composites 21 361ndash 368 (2000)40 J Karger-Kocsis Adv Composites Lett 9 225ndash227 (2000)41 U Landman W D Luedtke N A Burnham and R J Colton Science 248 454ndash461 (1990)42 E Maumlder V Dutschk and V Rudoy J Adhesion Sci Technol to be submitted43 E Maumlder E Moos and J Karger-Kocsis Composites Part A 32 631ndash639 (2001)
Dow
nloa
ded
by [
Uni
vers
ity o
f C
onne
ctic
ut]
at 0
114
08
Oct
ober
201
4
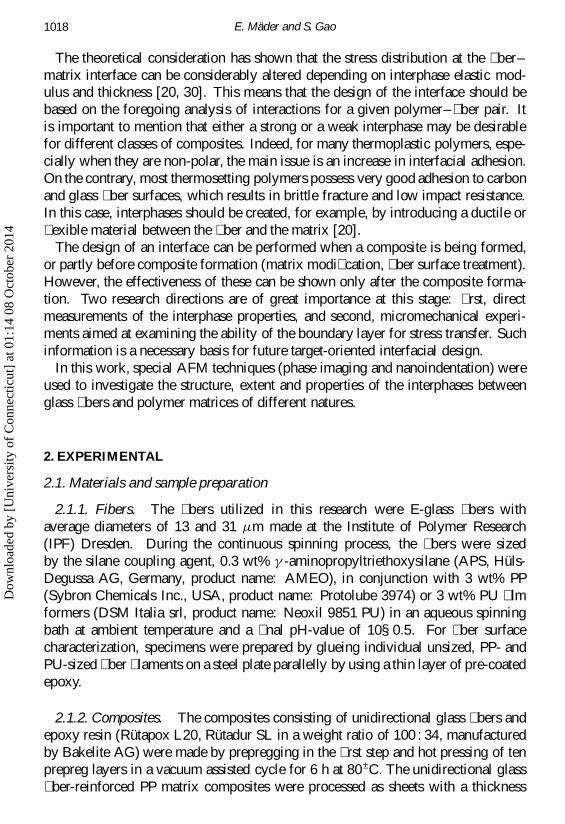
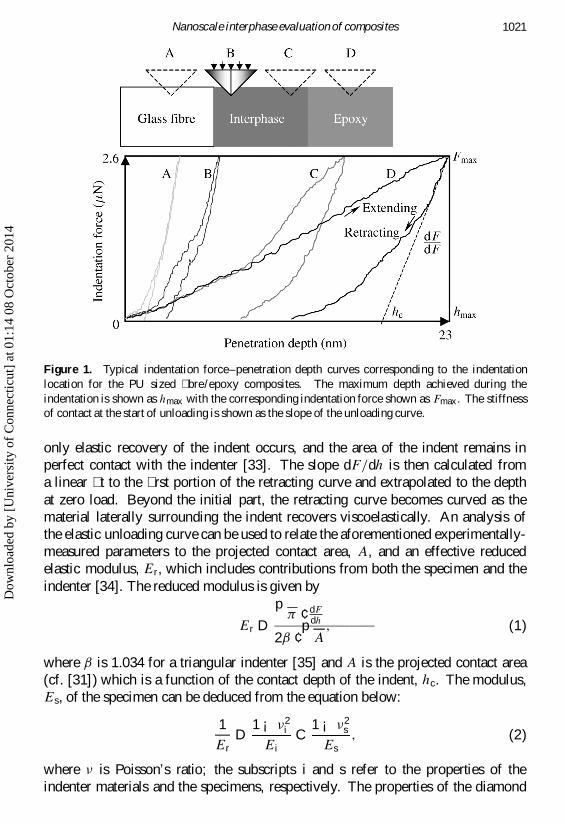
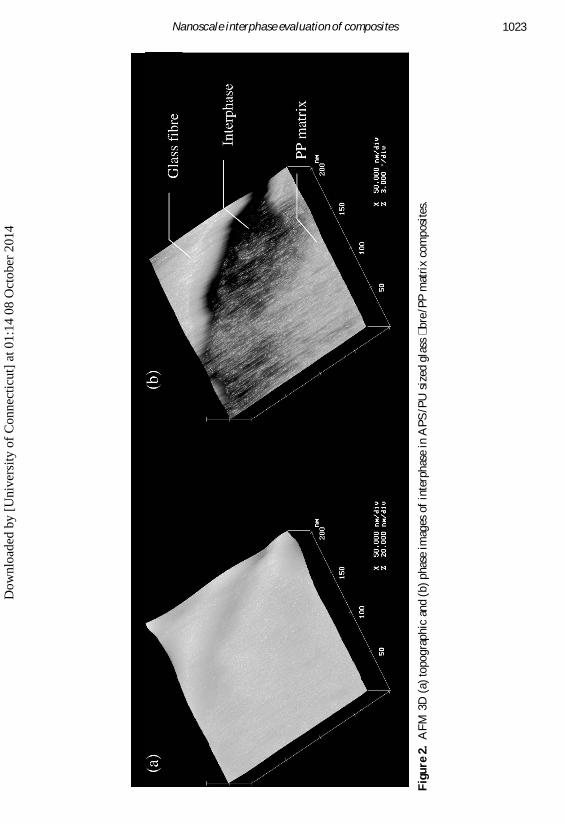
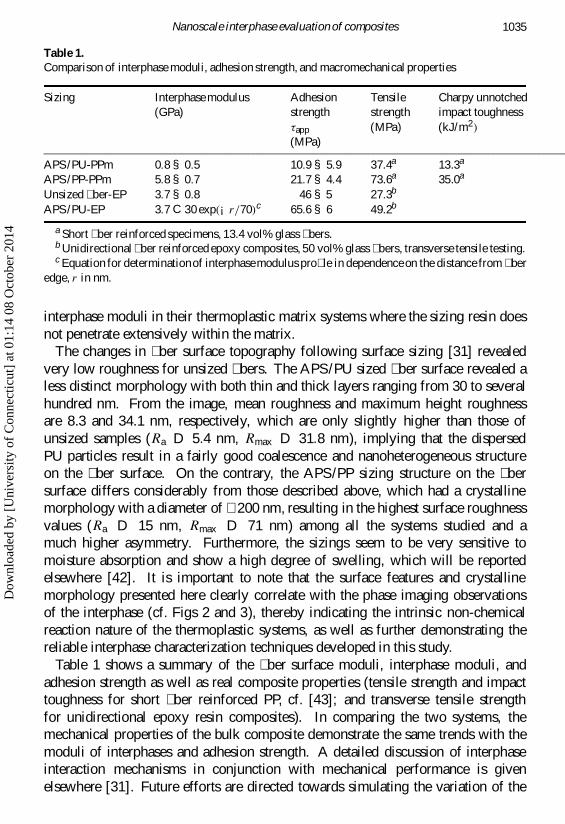