proprietary data sale 1983 - zonge … · proprietary data sale - 1983 ... for petroleum...
TRANSCRIPT

PROPRIETARY DATA SALE - 1983
Case Histories of an Electromagnetic Method
for Petroleum Exploration
Zonge Engineering & Research Organization, Inc.

Note of Confidentiality
All data, interpretations, and conclusions in this volume which pertain to the case histories or data processing techniques are proprietary in nature and are covered by the non-disclosure agreement between Zonge Engineering and Research Organization, Inc., and the purchaser. No portion of this information may be disclosed to a third party until the expiration date of this agreement, which is January 1, 1988. The purchaser may copy portions of this volume for his own use within the normal course of business and under the provisions of the non-disclosure agreement, providing that proper credits are given to Zonge Engineering and Research Organization, Inc. Copy No. of copies distributed to: Issued to Dr. Kenneth L. Zonge
Zonge Engineering & Research Organization, Inc. 3322 E. Fort Lowell Rd., Tucson, Arizona 85716 USA
Phone: (602) 327-5501 Telex: 165532 (CEERHO TUC) I

Preface
"Case Histories of an Electromagnetic Method for Petroleum Exploration" is the culmination of five years of field measurements, theoretical studies, and research into the utility of multifrequency electrical measurements in hydrocarbon detection. This volume discusses in detail the current level of understanding by Zonge Engineering of how these types of data are interpreted, why anomalies are observed over hydrocarbon accumulations, which mechanisms cause the anomalies, and the importance of this information in drilling for oil and gas.
The work is divided into four parts for the convenience of the reader. Part One presents two summaries, the Executive Summary, which provides a general overview of the project, and the Summary and Conclusions, which offers a more detailed synopsis of the individual case histories and the results of other work over the past five years.
Part Two covers most of the topics needed to understand the case histories which follow. This includes a review of how the data are acquired, processed, and analyzed for trends indicative of alteration over hydrocarbon traps. A brief discussion of anomaly mechanisms is offered, as well as an analysis of spurious effects due to metal pipelines, well casings, topography, and subsurface geology.
Part Three presents the case histories, which are accompanied by geologic information and detailed data interpretations. The case histories involve 81 line-miles (130 line-km) of electrical data obtained over oil and gas fields in the Rocky Mountain and midwest regions of the United States.
Part Four includes supplementary information which would be of interest to those readers who require additional information on electrical methods. The material includes both a physical and a theoretical description of how electrical current flows through the earth and how we can make sense of all the data we obtain in the field work. The final chapter provides a historical review of electrical measurements as applied to petroleum exploration, as well as some possibilities for future research.
The general approach in this volume is to bring together many ideas and observations which may be valid in electrical exploration, to clear up several misconceptions, and to present electrical data in a way which (hopefully) will help direct further effort in productive directions. However, the real advances of the science lie beyond the presentation of more electrical data. Only through dedicated research of anomaly mechanisms and through a sustained program of geophysical discoveries can the true potential of electrical techniques be fully realized as a valuable supplement to ongoing seismic and geologic exploration programs. Larry Hughes March, 1983
v

Acknowledgments
Putting this volume together has been a fascinating exercise in trying to enlarge the science of electrical exploration, and the satisfaction of having found some preliminary answers is the chief reward of this effort. However, no scientific endeavor is without its human aspects, and it is really humanity which helps give some perspective to scientific inquiry. Many thanks are owed, first and foremost, to the employees of Zonge Engineering for their hard work and cooperation in this and in related efforts. I wish to specifically thank several persons who have been instrumental in publishing this volume: Ken Zonge, for his efforts in reprocessing all the data and for the many helpful suggestions made along the way; Norman Carlson, for much of the processing, modeling, and interpretation, as well as a fortuitously timed Chateau Margaux '78; and my wife, Laura, for her great patience.
I also wish to thank Anne Urizar, for a tremendous drafting effort; Sheryl Recker, Tammy Zonge, Julie Gabriel, and Anne Olson, for typing and finalizing a hastily scribbled manuscript without significant outbreaks of violence; Marjorie Cole, for helping with the programming and modeling; Anita Pape for modeling and editing; and the field crews, for their conscientious efforts to obtain the best possible data. A number of other people helped greatly with the research and editing: Van Reed, Angus Scott-Fleming, Victoria Foscz, Bill Clapper, Don ("Elmo") Chislow, Debbie Newkirk, and Ross Rosenwald. I wish to express my special appreciation to Richard Clark, for putting a banana in my desk. It's still there, Richard. L.J.H. Tucson, Arizona
vii

Table of Contents Note of Confidentiality i Preface v Acknowledgments vii Table of Contents ix PART ONE: SUMMARIES
Executive Summary 1 Summary and Conclusions 5
PART TWO: DATA INTERPRETATION
1. lntroduction to the Data 25 1.1 lntroduction 1.2 Definitions and Plotting Conventions 1.3 Electrical Noise 1.4 lnstrumentation 1.5 Resistivity/Phase Data Acquisition and Field Logistics 1.6 Harmonic Complex Resistivity Data Acquisition and Field Logistics 1.7 Controlled Source AMT Data Acquisition and Field Logistics 1.8 Data Processing Techniques, Resistivity/Phase and Complex Resistivity Data 1.9 Parameters Used in Resistivity/Phase and Complex Resistivity Interpretation References
2. Interpreting Hydrocarbon Anomalies 55
2.1 lntroduction 2.2 Statistical Analysis of Zonge Engineering Hydrocarbon Surveys, 1977 - 1982 2.3 The Direct Detection of Hydrocarbons 2.4 The Origin of Electrical Anomalies over Hydrocarbons 2.5 Well-Casing Effects 2.6 Surface Culture Effects 2.7 Topographic Effects 2.8 Subsurface Geologic Effects 2.9 Anomalies Due to Hydrocarbon Alteration - What to Look For References
PART THREE: CASE HISTORIES
3. Ryckman Creek and Whitney Canyon Fields, Uinta County, Wyoming 101 3.1 lntroduction 3.2 Geologic Background 3.3 Detailed Discussion of the Data 3.4 Summary and Conclusions References
4. Desert Springs, Playa-Lewis, and Desert Springs West Fields, Sweetwater County,
Wyoming 141 4.1 Introduction 4.2 Geologic Background 4.3 Detailed Discussion of the Data 4.4 Summary and Conclusions References
ix

5. Little Buck Creek Field, Niobrara County, Wyoming 169 5.1 lntroduction 5.2 Geologic Background 5.3 Detailed Discussion of the Data 5.4 Summary and Conclusions References
6. Lisbon Field, San Juan County, Utah
6.1 lntroduction 6.2 Geologic Background 6.3 Detailed Discussion of the Data 6.4 Summary and Conclusions References
7. Trap Spring Field, Nye County, Nevada
7.1 lntroduction 7.2 Geologic Background 7.3 Detailed Discussion of the Data 7.4 Summary and Conclusions References
PART FOUR: ADDITIONAL INFORMATION
8. Mechanisms of Current Flow in the Earth 283 8.1 lntroduction 8.2 Physical Mechanisms of Galvanic Current Flow 8.3 The Origin of Inductive Coupling References
9. Principles of Electromagnetic Theory as Applied to Petroleum Exploration 293
9.1 lntroduction 9.2 Maxwell's Equations 9.3 Development of the Vector Wave Equation 9.4 Boundary Conditions 9.5 DC Solutions to the Vector Wave Equation 9.6 AC Solutions to the Vector Wave Equation 9.7 Complex Impedance of the Electric Field References
10. A Short History of Electrical Techniques in Petroleum Exploration 315
10.1 Introduction 10.2 The Early Years: 1900 - 1940 10.3 Continued Development: 1940 - 1960 10.4 Recent Electrical Work 10.5 Into the Future References
x

PART ONE _____________________________
SUMMARIES
xiii


1
Executive Summary
The results of a five-year feasibility study of the utility of electrical measurements in petroleum exploration are very encouraging. Electrical anomalies were measured over 66% of the 29 oil and gas fields involved in the study. The fact that these fields represent both stratigraphic and structural traps at a wide range of depths, with varying production characteristics, and in diverse geologic environments, provides a particularly favorable indication that this technique can be used as a reliable exploration tool, complementing existing seismic and subsurface geology programs.
Case histories of five field projects are presented in this volume in order to illustrate both the advantages and limitations of the method in the context of known geology. The field projects involve a variety of field characteristics, as illustrated in Table 1. The results delineate the following general observations: 1) repeatable anomalies can be measured over oil and gas fields; 2) two types of anomalies are measured-an electrically conductive "deep anomaly," and a polarizable "shallow anomaly;" 3) the anomalies correlate relatively well in plan view with the limits of hydrocarbon production; 4) the anomalies are partly dependent on specific geologic characteristics of the stratigraphic sequence.
TABLE 1 GEOLOGIC CHARACTERISTICS OF FIELDS IN CASE HISTORIES
'Not included specifically as a case history, but described in the text.
Original Reserves Production
Field and Location Type of Trap Oil
(MMBO) Gas
(BCF) Depths (feet)
Ryckman Creek (W. Wyoming Overthrust)
Structural 50 150 7,800 - 9,800
Whitney Canyon (W. Wyoming Overthrust)
Structural 66 3,100 9,200 - 14,200
Desert Springs (Green River Basin)
Stratigraphic 3 410 5,100 - 6,000
Playa-Lewis (Green River Basin)
Stratigraphic -- 9 3,400 - 3,500
Desert Springs West (Green River Basin)
Stratigraphic 1 15 3,800 - 3,850
Little Buck Creek (Powder River Basin)
Structural 12 - - 3,750 - 5,950
Lisbon (Paradox Basin)
Structural 44 250 7,500 - 8,500
Trap Spring (Basin & Range)
Structural & Stratigraphic
5 - - 3,000 - 5,000
Garza (Eastern Shelf, Texas)1
Stratigraphic ? - - 2,900 - 3,300
RESULTS OF THE STUDY
2 CASE HISTORIES OF AN ELECTROMAGNETIC METHOD FOR PETROLEUM EXPLORATION
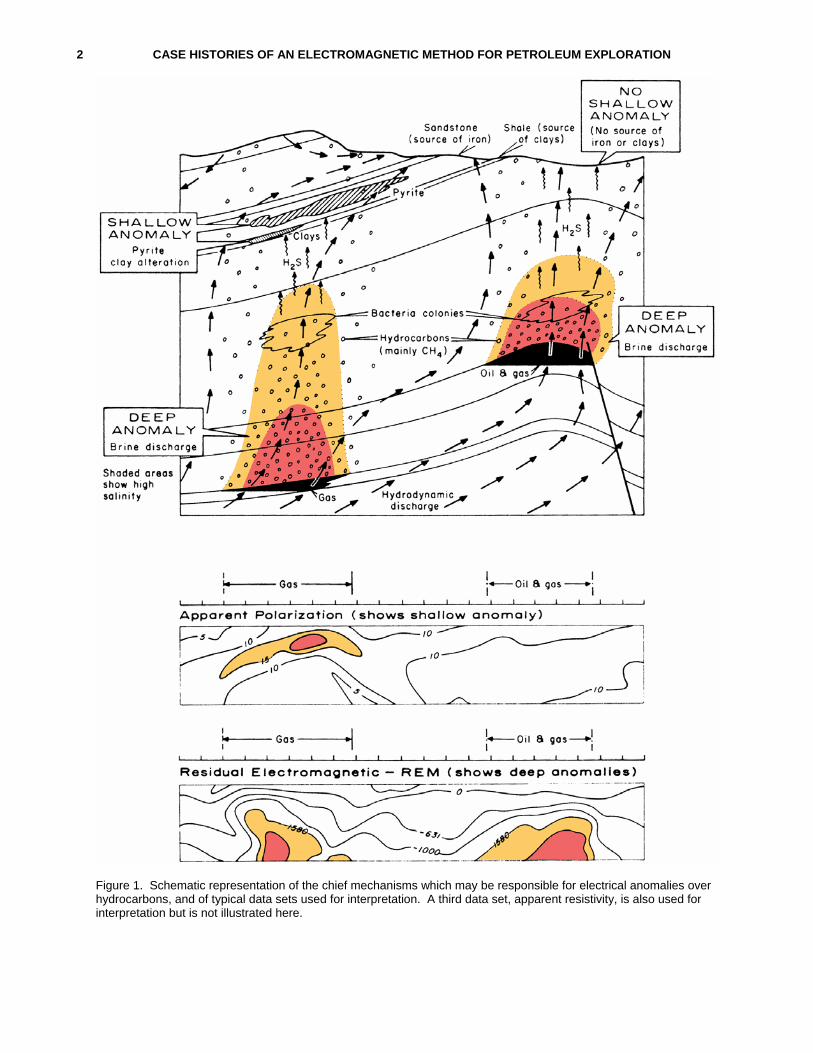
Figure 1. Schematic representation of the chief mechanisms which may be responsible for electrical anomalies over hydrocarbons, and of typical data sets used for interpretation. A third data set, apparent resistivity, is also used for interpretation but is not illustrated here.
EXECUTIVE SUMMARY 3
As is the case in seismic interpretations, data processing techniques are crucially important in extracting the maximum of information from electrical data. Proprietary data processing techniques have been developed for this purpose. Great care must be taken during interpretation to evaluate effects of pipelines, well casings, topography, and subsurface geology, since many of these effects may result in spurious anomalies unrelated to alteration due to hydrocarbons. The case histories demonstrate the necessity for this type of evaluation.
Strong theoretical and empirical evidence is offered to demonstrate that hydrocarbons are not being detected directly. Instead, evidence shows that the technique is most sensitive to alteration of sediments overlying the oilfield. The alteration may be due to upward migration of saline wavers and separate-phase light hydrocarbons from the trap at depth. The driving mechanism for the upward migration is probably related to vertical hydraulic gradients in porous traps. These ideas are in keeping with many recent hydrologic, geologic, geochemical and theoretical investigations, and are specifically compatible with modern theories of hydrodynamic control of petroleum accumulation.
Figure 1 illustrates the essential aspects of the theory of anomaly generation. The "deep anomaly" appears to be related to slow brine discharge from the traps. The "shallow anomaly" is attributed to one or both of two effects: 1) alteration of the cation-exchange characteristics of layered silicates (primarily clays); 2) the genesis of micron-sized, disseminated pyrite by the chemical combination of iron oxides in sandstones with biogenic hydrogen sulfide. The pseudosections in the lower portion of Figure 1 represent typical data from two parameters normally used for interpretation of the "deep" and "shallow" anomalies.
The unique sets of information offered by seismic and electrical programs suggest using both in an integrated exploration strategy. Seismic data would be essential to providing structural detail of the subsurface, since the lateral and horizontal resolution of seismics is distinctly superior to that of electrical techniques. On the other hand, electrical techniques would be used as indirect, economical methods of evaluating the presence of hydrocarbons by detection of altered sediments above the traps. They would also offer information in areas of difficulty in seismic exploration, such as exploration for subtle stratigraphic traps, and in areas involving severely weathered overburdens, surface volcanics, fractured evaporites, etc. Thus, the combined efforts of geologic, seismic, and electrical programs should prove to be an effective strategic approach to evaluating hydrocarbon potential in geologically attractive target areas.
ORIGIN OF THE
ANOMALIES
EXPLORATION STRATEGY

4 CASE HISTORIES OF AN ELECTROMAGNETIC METHOD FOR PETROLEUM EXPLORATION

5
Summary and Conclusions Extensive field research and theoretical studies conducted over the past five
years have demonstrated that valid electrical anomalies have been measured consistently over oil and gas fields of diverse geologic characteristics, and that these anomalies are probably related in a causal way to the presence of hydrocarbons at depth. This volume presents multifrequency electrical data over nine oil and gas fields as examples of typical anomalies measured in the field. These data strongly suggest that the sediments overlying the hydrocarbons are altered by upward migrating light hydrocarbons and saline waters. Several case histories are presented to illustrate "classical" type anomalies, while other case histories serve to refine current theory as to the specific mechanisms which produce the anomalies. A significant effort is made to identify electrical anomalies which are unrelated to alteration caused by hydrocarbons, such as those due to "culture" (well casings, pipelines, powerlines, fences, etc.), topography, and subsurface geology. As is the case with seismic exploration, the use of advanced data processing techniques is essential to the proper interpretation of these data.
The present study involves multifrequency resistivity/phase and complex
resistivity data, in which both magnitude and phase angle are measured and corrected for array geometry. Data in the frequency range of 0.125 - 1 Hz were obtained with the dipole-dipole array, using currents of up to 18 amperes and dipoles as large as 2,000 feet (610 m). The equipment consisted of two-channel, fully programmable, 12-bit receivers (Figure 1). The data were originally obtained in 1979 and 1980. They have been reprocessed by proprietary techniques and have been reinterpreted with the aid of computer modeling.
Three unique parameters are derived from appropriate data processing techniques: apparent resistivity, apparent polarization, and residual electromagnetic (REM). Apparent resistivity measures the bulk resistance of the ground to the flow of current. Apparent polarization measures the capacitance, or energy storage characteristics of the ground. The REM parameter is an inductive parameter which senses relatively deep lateral resistivity interfaces in the ground. These three parameters are utilized most effectively when they are used together in an integrated interpretation. Figure 2 illustrates typical pseudosection plots of these parameters.
The concepts presented in this volume were developed during five years of
research into the utility of electrical techniques in petroleum exploration. Some 879 line-miles (1,414 line-km) of multifrequency data have been obtained over 29 oil and gas fields and 49 prospects in the United States and Canada (Figure 3). A number of projects have been conducted during this work in order to define the conditions under which the technique works best and to establish a statistically significant data base from which conclusions can be drawn.
The results of this work indicate that two types of anomalies are normally measured in the field. The most common type of anomaly is the so-called "deep anomaly," which consists of a conductive, plume-shaped structure extending vertically from the hydrocarbon trap into the overlying sediments. It is detected by the apparent resistivity and REM parameters. The "shallow anomaly" is much less common; it consists of a polarizable, occasionally conductive feature in the near-surface sediments. The "shallow anomaly" is normally detected by the apparent polarization parameter. The two types of anomalies appear to result from alteration of the
INTRODUCTION
TYPES OF DATA OBTAINED
RESULTS OVER KNOWN FlELDS

6 CASE HISTORIES OF AN ELECTROMAGNETIC METHOD FOR PETROLEUM EXPLORATION
sediments above the hydrocarbon trap by upward-migrating hydrocarbons and saline waters. The alteration mechanisms involve brine replacement of more resistive meteoric waters, clay alteration, and sulfide mineralization (primarily pyrite).
In an effort to establish the frequency with which these anomalies are measured, a statistical analysis was performed of all projects in the Zonge Engineering data base. Apparent resistivity, apparent polarization and REM anomalies were interpreted for spurious effects due to well casings, surface culture, topography, and subsurface structure, and were then analyzed for correlation with the lateral extent of the hydrocarbons at depth. The results of this investigation show that at least one of the three parameters normally used for interpretation shows a recognizable anomaly over 66 percent of the fields. Conductive apparent resistivity and REM anomalies were seen over about two-thirds of the fields, and polarizable anomalies were observed over about one-fourth of the fields. While it is likely that some of the data are still influenced by cultural and structural effects (which are exceedingly difficult to model in some cases), it is clear that a success ratio even as low as 50 percent would be an encouragement to utilize electrical techniques in prospect evaluation. Preliminary statistics on the drilling of electrical prospects suggest that the success ratio is probably much higher than 50 percent, probably because data over prospects are often less contaminated by cultural effects than are data over heavily developed fields.
Figure 1. Equipment calibration and check prior to data acquisition at Lisbon Field. The field work involved a crew of eight, operating three backpack-mounted receivers simultaneously. Present-day surveys require smaller crews.

SUMMARY AND CONCLUSIONS 7
The work done over the 29 fields is represented fairly well both statistically and geologically by the nine case histories presented in this volume. The case histories show a similar "success rate" in apparent resistivity and REM parameters as compared to the larger group, and a somewhat higher "success rate" in apparent polarization. In addition, the case histories show a higher percentage of "uninterpretable" resistivity and REM data due to cultural or subsurface faulting problems. This reflects the fact that the case histories represent a somewhat more difficult group of projects than the larger group of 29 projects.
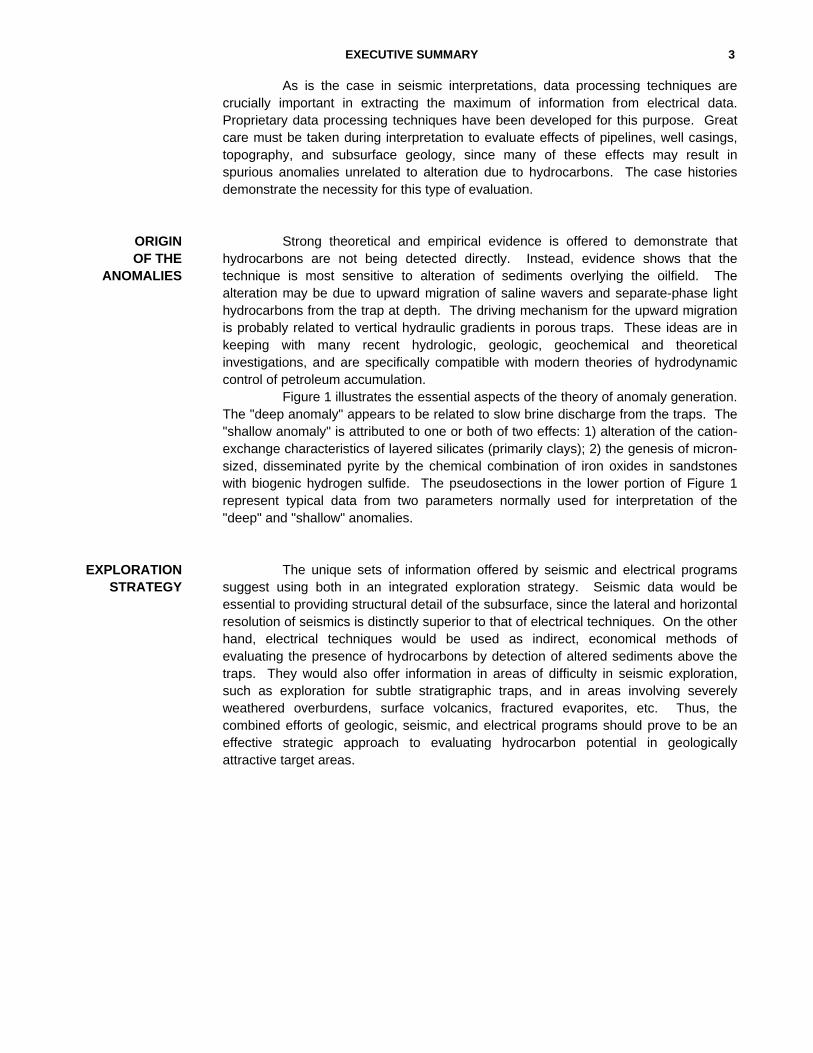
As shown in Tables 1 and 2, the case histories vary considerably in geologic Characteristics - so much so that, collected together in one volume, they present an excellent opportunity to examine some important aspects of the possible driving mechanisms for the "deep" and "shallow" anomalies. The locations of the fields are shown in Figure 4. Ryckman Creek and Whitney Canyon present classic examples of well-defined anomalies. The line in the Desert Springs area shows how the anomalies change over depressurized stratigraphic reservoirs, while the data obtained over Little Buck Creek demonstrate a similarly depressurized and even more highly depleted reservoir in a structural trap. Data over Lisbon Field provide a fascinating but enigmatic view of how the anomalies are affected by a low-permeability evaporite layer which ov-
Figure 2. Typical data from a hydrocarbon survey are presented in pseudosection form, plotted here for the Ryckman Creekand Whitney Canyon survey. Shaded areas indicate electrically conductive zones (apparent resistivity and REM data) or electrically polarizable zones (apparent polarization data).
SUMMARY OF THE CASE
HISTORIES

8 CASE HISTORIES OF AN ELECTROMAGNETIC METHOD FOR PETROLEUM EXPLORATION
Figure 3. Locations of Zonge Engineering hydrocarbon surveys, 1977 - 1982.

SUMMARY AND CONCLUSIONS 9
erlies the reservoir rocks. Finally, the data over Trap Spring show the effects observed over a tight volcanic-tuff reservoir in which the oils contain no dissolved methane at all. An additional, abbreviated case history over Garza Field shows data over a well-developed but still productive stratigraphic trap before and after development drilling.
TABLE 1: GEOLOGIC CHARACTERISTICS OF FIELDS IN CASE HISTORIES
Original Reserves
Field & Location Discovery
Date Type of Trap Drive Oil
(MMBO) Gas
(BCFG) RYCKMAN CREEK W. Wyoming Overthrust Uinta Co., Wyoming
1976 Structural (thrust-faulted
anticline)
Water 50 150
WHITNEY CANYON W. Wyoming Overthrust Uinta Co., Wyoming
1977 Structural (thrust-faulted
anticline)
Gas expansion 66 3,100
DESERT SPRINGS Green River Basin Sweetwater Co., Wyoming
1958 Stratigraphic (updip facies
pinchout)
Pressure depletion 2.5 410
PLAYA-LEWIS Green River Basin Sweetwater Co., Wyoming
1963 Stratigraphic (isolated sand lens)
Pressure depiction - - > 9
DESERT SPRINGS WEST Green River Basin Sweetwater Co., Wyoming
1959 Stratigraphic Solution gas 1 15
LITTLE BUCK CREEK Powder River Basin Niobrara Co., Wyoming
1944 Structural (anticline) Water 12 - -
LISBON Paradox Basin San Juan Co., Utah
1960 Structural (faulted anticline)
Expanding gas cap & gravity drainage
(Leadville); Solution gas (McCracken)
44 250
TRAP SPRING Basin and Range Nye Co., Nevada
1976 Structural & stratigraphic
Water > 5 - -
GARZA1 Eastern Shelf (Texas) Garza Co., Texas
1935 Stratigraphic ? 0.32 - -
1 Not presented as a case history, but results presented in Chapter 2. 2 In the vicinity of the survey line only; total field reserves are much larger.

10 CASE HISTORIES OF AN ELECTROMAGNETIC METHOD FOR PETROLEUM EXPLORATION
Chapter 3 presents case histories of Ryckman Creek and Whitney Canyon fields, two very important producers in the western Wyoming Overthrust Belt. Ryckman Creek production occurs from an asymmetric, overturned, north-south trending anticline on the hanging wall of the Absaroka Thrust Plate, a major feature in Overthrust geology. Low-sulfur, paraffinic, 47o API gravity oil and sweet gas are found in the Triassic Nugget Sandstone. At present, oil is recovered, and gas is stripped and re-injected back into the structure in order to maintain the reservoir pressure. The system has an active water drive. Natural gas and condensate are also produced from the Triassic Thaynes Limestone. Whitney Canyon is a gas giant, with over 3.1 TCF of gas reserves. Sour gas and condensate are produced from seven pay zones in a thrust-faulted anticlinal trap similar to that at Ryckman Creek. At the time of the electrical survey, most of the wells were shut-in awaiting completion of a gas-sweetening plant, and reservoir pressures and gas reserves were virtually unchanged from the date of discovery. Most of the gas is found in the Mission Canyon Formation of Mississippian age, but other productive zones are found in Triassic to Ordovician units. The system
TABLE 2: RESERVOIR CHARACTERISTICS OF FIELDS IN CASE HISTORIES
Field Exploitation1
Field, Producing Formation & Age
Approx. Production
Depth (feet)
% Decline in Oil
Reserves
% Decline in Gas
Reserves
% Decline in Reservoir
Pressure % Methane
in Trap %
H2S
Connate WaterResistivity
(ohm-meters)RYCKMAN CREEK Nugget Ss. (TR) Thaynes Ls. (TR)
7,800 9,800
minor 3
minor 2
minor2 4
normal 78 79
none 0 0
low 0.2
WHITNEY CANYON Thaynes Ls. (TR) Phosphoria Fm. (P) Weber Ss. (P) Mission Canyon Fm. (M) Lodgepole Ls. (M) Darby Fm. (D) Bighorn Dol. (O)
9,200
11,800 11,200 12,600 13,000 13,500 14,200
minor minor
0 0 0 0 0 0
minor minor
0 0 0 0 0 0
none up 1
0 0 0 0 0 0
normal 80 74 57 67
85
very high 0
6.7 21.3 15.2 15.5 1.0 0.6
moderate 1.05
0.12 DESERT SPRINGS Almond Fm. (K)
5,900
major 90
major 49
major 54
normal 89
low < 0.1
low 0.5
PLAYA-LEWIS Lewis Sh. (K)
3,500
- -
major 68
major 54
normal low 0.18
DESERT SPRINGS WEST Almond Fm. (K)
3,800
major 74
major 98
major normal 91
low 0.03
moderate 1.2
LITTLE BUCK CREEK Fall River Ss. (K) Minnelusa Fm. (P)
3,850 5,500
major major major
- - - - - -
moderate 0.06 0.63
low
0.2 LISBON Leadville Fm. (M) McCracken Ss. (D)
8,000 8,300
major major
- -
minor minor3
minor minor3
normal 50
high 2
very low 0.05 0.05
TRAP SPRING Pritchards Stn. Fm. (T)
> 3,200
moderate moderate
- - - -
low 0
moderate 0.8
moderate 1
GARZA4 San Andres Fm. (P)
3,000
moderate moderate
- - - -
normal very low 0.04
1 Exploitation between discovery date and date of the electrical survey. 2 Pressure maintained by gas injection. 3 Gas stripped and re-injected; minimal pressure depletion. 4 Not presented as a case history, but results presented in Chapter 2.
Ryckman Creek and
Whitney Canyon
SUMMARY AND CONCLUSIONS 11
has a gas-expansion drive. Figure 5 shows the geology and inferred electrical cross-section for the project.
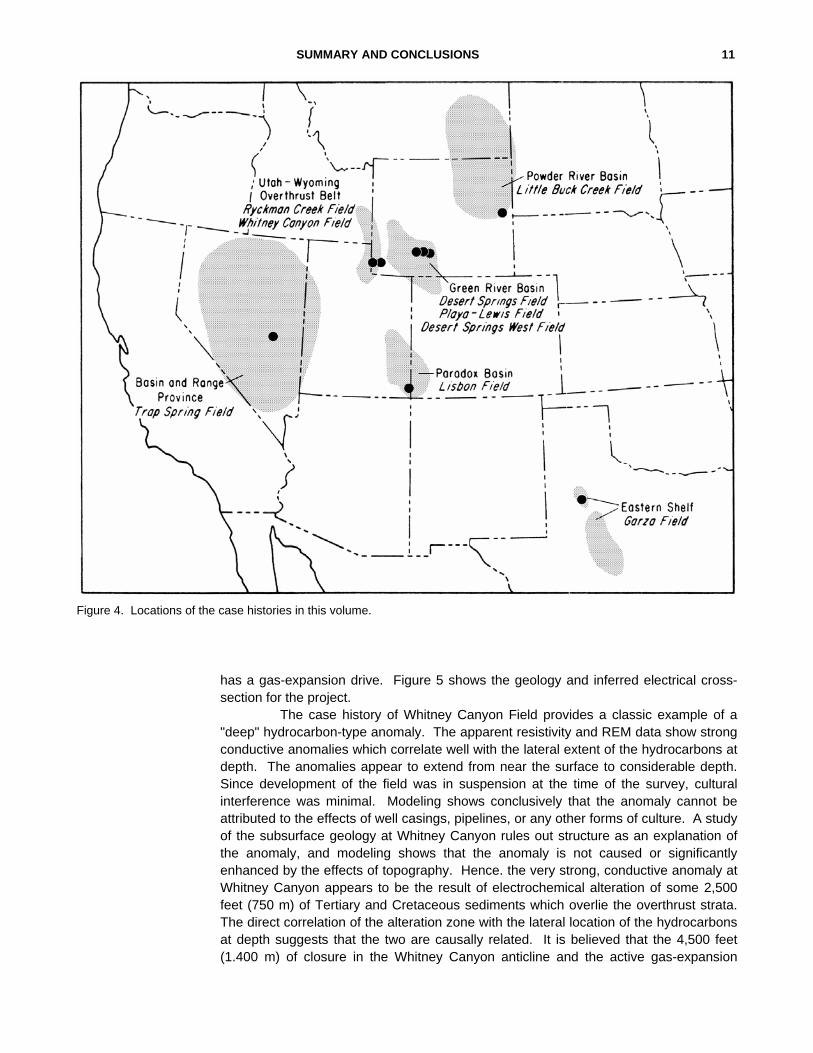
The case history of Whitney Canyon Field provides a classic example of a "deep" hydrocarbon-type anomaly. The apparent resistivity and REM data show strong conductive anomalies which correlate well with the lateral extent of the hydrocarbons at depth. The anomalies appear to extend from near the surface to considerable depth. Since development of the field was in suspension at the time of the survey, cultural interference was minimal. Modeling shows conclusively that the anomaly cannot be attributed to the effects of well casings, pipelines, or any other forms of culture. A study of the subsurface geology at Whitney Canyon rules out structure as an explanation of the anomaly, and modeling shows that the anomaly is not caused or significantly enhanced by the effects of topography. Hence. the very strong, conductive anomaly at Whitney Canyon appears to be the result of electrochemical alteration of some 2,500 feet (750 m) of Tertiary and Cretaceous sediments which overlie the overthrust strata. The direct correlation of the alteration zone with the lateral location of the hydrocarbons at depth suggests that the two are causally related. It is believed that the 4,500 feet (1.400 m) of closure in the Whitney Canyon anticline and the active gas-expansion
Figure 4. Locations of the case histories in this volume.
12 CASE HISTORIES OF AN ELECTROMAGNETIC METHOD FOR PETROLEUM EXPLORATION
drive there provides a strong hydraulic gradient which forces the lighter hydrocarbons and conductive brines vertically out of the trap into the overlying sediments. The brines would lower the bulk resistivities of the sediments either by displacing pore fluids of higher resistivities or by alteration of clays.
Whitney Canyon also shows a weak. polarizable, "shallow" type anomaly which correlates reasonably well with the lateral location of the hydrocarbons. This anomaly cannot be explained by effects due to well casings. surface culture, or subsurface structure. Instead, it is believed to be related to weak mineralization or clay alteration in the near-surface sediments due to upward migration of light hydrocarbons and waters from the trap below.
Figure 5. Combined geological and electrical cross-section of the Ryckman Creek / Whitney Canyon line, with no verticalscale exaggeration. The maximum depth of penetration of the electrical data is about 4.000 to 6,000 feet (1.200-1.800 m); the electrical interpretation below these depths is inferred.

SUMMARY AND CONCLUSIONS 13
Ryckman Creek is located 6 miles (1 0 km) east of Whitney Canyon. The field shows a strong, conductive, "deep anomaly" which is somewhat broader than the extent of the hydrocarbons, partly because of influences from overthrust strata which become shallower east of the field, and partly because of the influence of subsurface thrust faulting on water and hydrocarbon migration from the trap. A well-casing model clearly "overmodels" the data (that is, calculates too strong an effect), but the qualitative results of the model suggest that the anomaly may be explained either by effects of well casings or by hydrocarbon-related alteration. The latter explanation is preferred because of the apparent lack of response of well casings at Whitney Canyon. The 1,500 feet (450 m) of structural closure and the active water drive at Ryckman Creek make it an ideal example of a strong driving mechanism for brine discharge, which is believed to cause the "deep" conductive anomaly.
A fairly polarizable "shallow anomaly" correlates well with Ryckman Creek Field. Modeling indicates that this anomaly is not caused by cultural or structural features, although effects of well casings may enhance the overall response. The anomaly is believed to be related to clay alteration or pyrite mineralization in the shallow sediments, caused by interactions with upward-migrating hydrocarbons and waters from the trap below.
Two other "deep" anomalies which are as yet undrilled are observed on the Ryckman Creek - Whitney Canyon line. A broad, conductive zone at depth just west of Ryckman Creek is a reasonably attractive electrical target. It may possibly be related to a recent Ankareh discovery just 0.5 mile (0.8 km) south of the line. A combined electric-seismic-geologic investigation of this portion of the line would provide an optimum exploration strategy. A second anomaly occurs on the west end of the line. Although insufficient coverage of this feature prevents any conclusive interpretation regarding its origin, it lies on the portion of the line where Mesozoic strata are thrust to the surface by high-angle thrust faulting; hence, the anomaly may be more related to structure than to hydrocarbon-related alteration. This illustrates the necessity of thorough geologic analysis in interpreting electrical anomalies.
Chapter 4 presents data from three fields which differ considerably from Ryckman Creek and Whitney Canyon. Desert Springs, Playa-Lewis, and Desert Springs West production is primarily low-sulfur gas from stratigraphic traps at intermediate depths. Desert Springs gas production in the vicinity of the line is from two sandstone units in the upper Cretaceous Almond Formation. The sands pinch out on their updip sides by a facies change to shales and siltstones; production is limited downdip by the gas-water contact and laterally by facies changes and structure. The drive is pressure depletion. Playa-Lewis gas production is from an isolated sandstone lens in the Lewis Shale of upper Cretaceous age. The field has a pressure-depletion drive. Desert Springs West produces gas along a narrow corridor which crosses the west end of the survey line. The reservoir consists of thin, discontinuous, shoreline sands within the Almond Formation. The field has a solution-gas drive. The important things to note in the reservoir data of Table 2 are the depletion of hydrocarbon reserves in the traps (50 to 90 percent), and the depressurization of the reservoirs (around 50 percent or so). If the present theory as to the anomaly mechanism is correct, the depletion of pressure and hydrocarbon reserves should considerably weaken the driving mechanisms which produce electrical anomalies. Hence, this case history provides an opportunity to test the mechanism over three nearly depleted fields. The interpreted geoelectric cross-section is shown in Figure 6.
Desert Springs, Playa-Lewis,
and Desert Springs West
14 CASE HISTORIES OF AN ELECTROMAGNETIC METHOD FOR PETROLEUM EXPLORATION
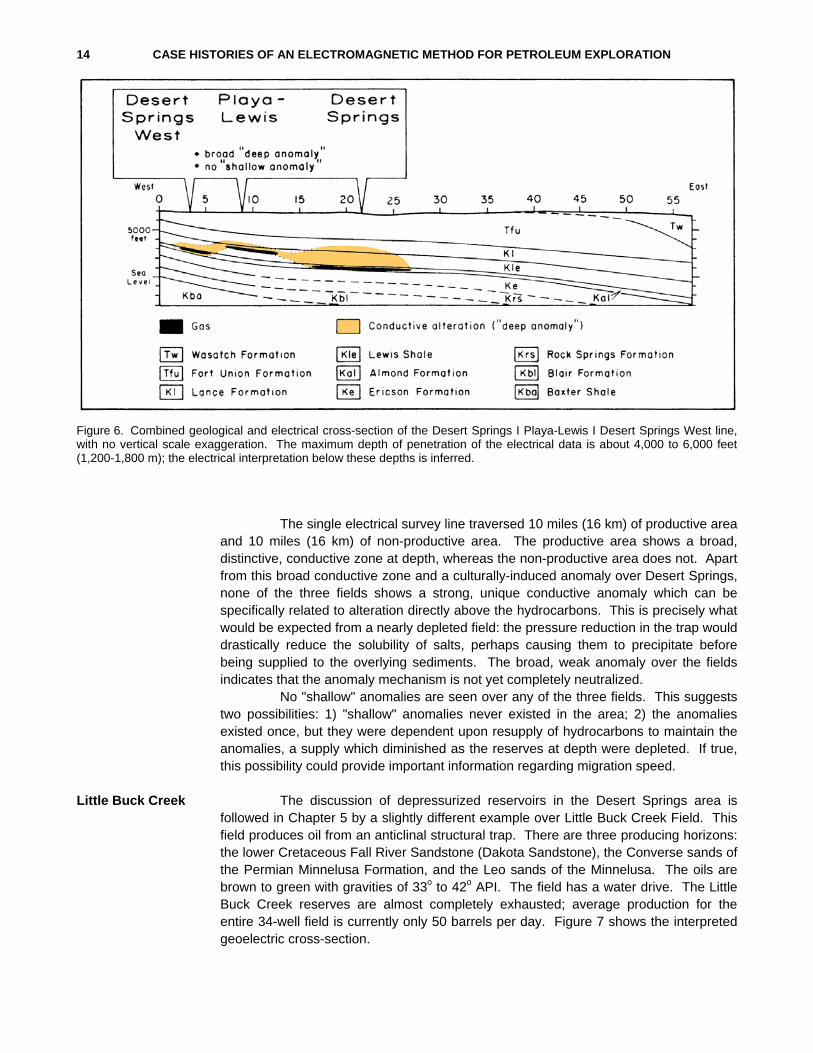
The single electrical survey line traversed 10 miles (16 km) of productive area and 10 miles (16 km) of non-productive area. The productive area shows a broad, distinctive, conductive zone at depth, whereas the non-productive area does not. Apart from this broad conductive zone and a culturally-induced anomaly over Desert Springs, none of the three fields shows a strong, unique conductive anomaly which can be specifically related to alteration directly above the hydrocarbons. This is precisely what would be expected from a nearly depleted field: the pressure reduction in the trap would drastically reduce the solubility of salts, perhaps causing them to precipitate before being supplied to the overlying sediments. The broad, weak anomaly over the fields indicates that the anomaly mechanism is not yet completely neutralized.
No "shallow" anomalies are seen over any of the three fields. This suggests two possibilities: 1) "shallow" anomalies never existed in the area; 2) the anomalies existed once, but they were dependent upon resupply of hydrocarbons to maintain the anomalies, a supply which diminished as the reserves at depth were depleted. If true, this possibility could provide important information regarding migration speed.
Little Buck Creek The discussion of depressurized reservoirs in the Desert Springs area is followed in Chapter 5 by a slightly different example over Little Buck Creek Field. This field produces oil from an anticlinal structural trap. There are three producing horizons: the lower Cretaceous Fall River Sandstone (Dakota Sandstone), the Converse sands of the Permian Minnelusa Formation, and the Leo sands of the Minnelusa. The oils are brown to green with gravities of 33o to 42o API. The field has a water drive. The Little Buck Creek reserves are almost completely exhausted; average production for the entire 34-well field is currently only 50 barrels per day. Figure 7 shows the interpreted geoelectric cross-section.
Figure 6. Combined geological and electrical cross-section of the Desert Springs I Playa-Lewis I Desert Springs West line, with no vertical scale exaggeration. The maximum depth of penetration of the electrical data is about 4,000 to 6,000 feet(1,200-1,800 m); the electrical interpretation below these depths is inferred.

SUMMARY AND CONCLUSIONS 15
Two intersecting lines were run at Little Buck Creek. Line 1 is completely contaminated by strong conductive and polarizable effects from surface pipelines. The data from line 2 show a moderately conductive "deep" anomaly. This anomaly may be enhanced somewhat by well-casing effects, but modeling strongly suggests that a slightly conductive anomaly exists at depth on the eastern edge of the field. This anomaly cannot be explained by influences from surface culture, topography, or subsurface structure. Instead, it is believed that the anomaly results from brine discharge from the trap into the overlying sediments. The weakness of the anomaly suggests that the discharge mechanism is quite weak. The reason for this may be related to the depletion of oil and the probable loss of reservoir pressure in the trap. Pressure reduction would cause increased salt precipitation from brines rising from the trap, resulting in a weaker anomaly with less vertical extent.
A weak, polarizable, "shallow" anomaly is observed in the line 2 data. This anomaly may be the resuIt of clay alteration by vertically-migrating hydrocarbons, or low-grade mineralization.
Figure 7. Combined geological, electrical, and electric-log cross-section of Little Buck Creek, line 2, with no vertical scale exaggeration. The maximum depth of penetration of the electrical data is about 2,000 to 3,000 feet (600-900 m); the electrical interpretation below these depths is inferred.
16 CASE HISTORIES OF AN ELECTROMAGNETIC METHOD FOR PETROLEUM EXPLORATION
A very interesting conductive anomaly is observed on the east end of line 2, in an area which has not yet been drilled. The anomaly is not obvious in the apparent resistivity or apparent polarization data, but it is well defined in the REM data due to the greater penetration depth of REM on this survey. Since the anomaly has the magnitude and shape characteristic of hydrocarbon-related anomalies seen elsewhere in the basin, follow-up work is strongly recommended.
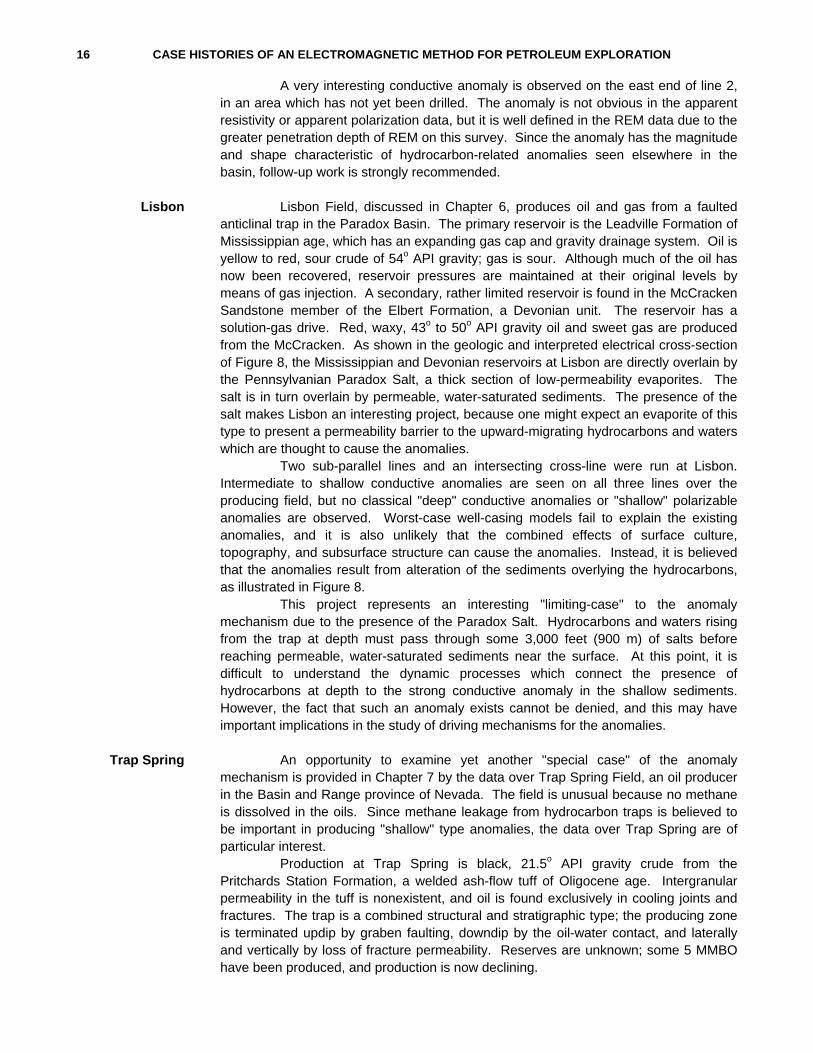
Lisbon Lisbon Field, discussed in Chapter 6, produces oil and gas from a faulted anticlinal trap in the Paradox Basin. The primary reservoir is the Leadville Formation of Mississippian age, which has an expanding gas cap and gravity drainage system. Oil is yellow to red, sour crude of 54o API gravity; gas is sour. Although much of the oil has now been recovered, reservoir pressures are maintained at their original levels by means of gas injection. A secondary, rather limited reservoir is found in the McCracken Sandstone member of the Elbert Formation, a Devonian unit. The reservoir has a solution-gas drive. Red, waxy, 43o to 50o API gravity oil and sweet gas are produced from the McCracken. As shown in the geologic and interpreted electrical cross-section of Figure 8, the Mississippian and Devonian reservoirs at Lisbon are directly overlain by the Pennsylvanian Paradox Salt, a thick section of low-permeability evaporites. The salt is in turn overlain by permeable, water-saturated sediments. The presence of the salt makes Lisbon an interesting project, because one might expect an evaporite of this type to present a permeability barrier to the upward-migrating hydrocarbons and waters which are thought to cause the anomalies.
Two sub-parallel lines and an intersecting cross-line were run at Lisbon. Intermediate to shallow conductive anomalies are seen on all three lines over the producing field, but no classical "deep" conductive anomalies or "shallow" polarizable anomalies are observed. Worst-case well-casing models fail to explain the existing anomalies, and it is also unlikely that the combined effects of surface culture, topography, and subsurface structure can cause the anomalies. Instead, it is believed that the anomalies result from alteration of the sediments overlying the hydrocarbons, as illustrated in Figure 8.
This project represents an interesting "limiting-case" to the anomaly mechanism due to the presence of the Paradox Salt. Hydrocarbons and waters rising from the trap at depth must pass through some 3,000 feet (900 m) of salts before reaching permeable, water-saturated sediments near the surface. At this point, it is difficult to understand the dynamic processes which connect the presence of hydrocarbons at depth to the strong conductive anomaly in the shallow sediments. However, the fact that such an anomaly exists cannot be denied, and this may have important implications in the study of driving mechanisms for the anomalies.
Trap Spring An opportunity to examine yet another "special case" of the anomaly mechanism is provided in Chapter 7 by the data over Trap Spring Field, an oil producer in the Basin and Range province of Nevada. The field is unusual because no methane is dissolved in the oils. Since methane leakage from hydrocarbon traps is believed to be important in producing "shallow" type anomalies, the data over Trap Spring are of particular interest.
Production at Trap Spring is black, 21.5o API gravity crude from the Pritchards Station Formation, a welded ash-flow tuff of Oligocene age. Intergranular permeability in the tuff is nonexistent, and oil is found exclusively in cooling joints and fractures. The trap is a combined structural and stratigraphic type; the producing zone is terminated updip by graben faulting, downdip by the oil-water contact, and laterally and vertically by loss of fracture permeability. Reserves are unknown; some 5 MMBO have been produced, and production is now declining.
SUMMARY AND CONCLUSIONS 17
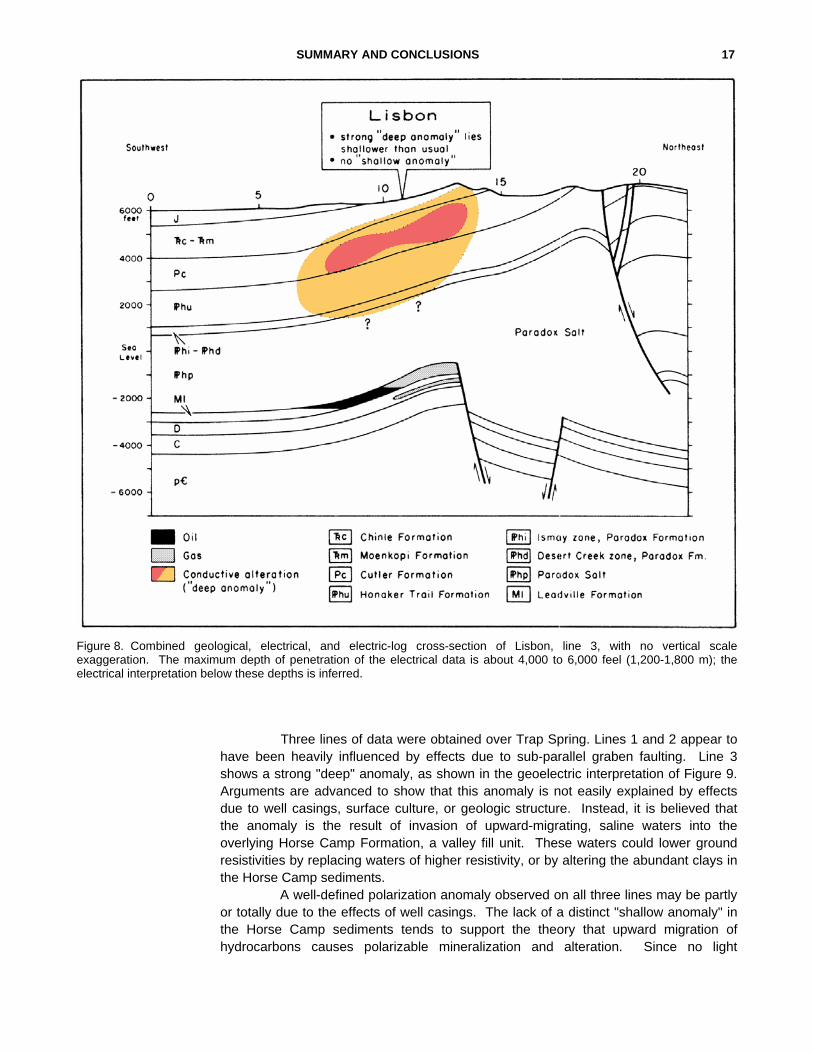
Three lines of data were obtained over Trap Spring. Lines 1 and 2 appear to have been heavily influenced by effects due to sub-parallel graben faulting. Line 3 shows a strong "deep" anomaly, as shown in the geoelectric interpretation of Figure 9. Arguments are advanced to show that this anomaly is not easily explained by effects due to well casings, surface culture, or geologic structure. Instead, it is believed that the anomaly is the result of invasion of upward-migrating, saline waters into the overlying Horse Camp Formation, a valley fill unit. These waters could lower ground resistivities by replacing waters of higher resistivity, or by altering the abundant clays in the Horse Camp sediments.
A well-defined polarization anomaly observed on all three lines may be partly or totally due to the effects of well casings. The lack of a distinct "shallow anomaly" in the Horse Camp sediments tends to support the theory that upward migration of hydrocarbons causes polarizable mineralization and alteration. Since no light
Figure 8. Combined geological, electrical, and electric-log cross-section of Lisbon, line 3, with no vertical scale exaggeration. The maximum depth of penetration of the electrical data is about 4,000 to 6,000 feel (1,200-1,800 m); the electrical interpretation below these depths is inferred.
18 CASE HISTORIES OF AN ELECTROMAGNETIC METHOD FOR PETROLEUM EXPLORATION
hydrocarbons are present in the Trap Spring oils, none are available for migration, and hence no polarization effects are observed in the sediments overlying the trap.
Garza Presented as an illustration of ambiguities of well-casing modeling, the Garza
Field data in Chapter 2 show a strong polarizable anomaly over a stratigraphic trap in north-central Texas. Data obtained before and after the drilling of four step-out wells indicate that the anomaly is influenced by, but probably not caused by, well-casing effects. Instead, the anomaly mechanism is thought to be related to pyrite mineralization in the reducing environment over the oilfield, a frequent occurrence in the Texas-Oklahoma area. Brine discharge is probably responsible for a subtle "deep anomaly".
As suggested by the case histories, the anomalies measured by multi-
frequency electrical techniques appear to be related to hydraulic discharge of saline waters and light hydrocarbons from the trap at depth into the overlying sedimentary section. The upward-migration theory is in substantial agreement with recent geochemical, geothermal, and hydrological studies, and is specifically compatible with modern concepts of hydrodynamic petroleum accumulation. The theory of anomaly generation is presented in schematic form in Figure 10.
The origin of the conductive "deep anomaly" is believed to be related to the flow of saline water through the trap into the overlying sediments. Two possible anomaly mechanisms are envisioned which might lower the bulk resistivity of the sediments overlying the trap: 1 ) replacement of moderate resistivity interstitial pore fluids with the upward-migrating, lower resistivity, saline fluids; 2) alteration of clays by
Figure 9. Combined geological and electrical cross-section of Trap Spring, line 3, with no vertical scale exaggeration. The maximum depth of penetration of the electrical data is about 2,500 to 3,500 feet (750-1,100 m); the electrical interpretation below these depths is inferred.
POSSIBLE SOURCES
OF THE ANOMALIES
SUMMARY AND CONCLUSIONS 19
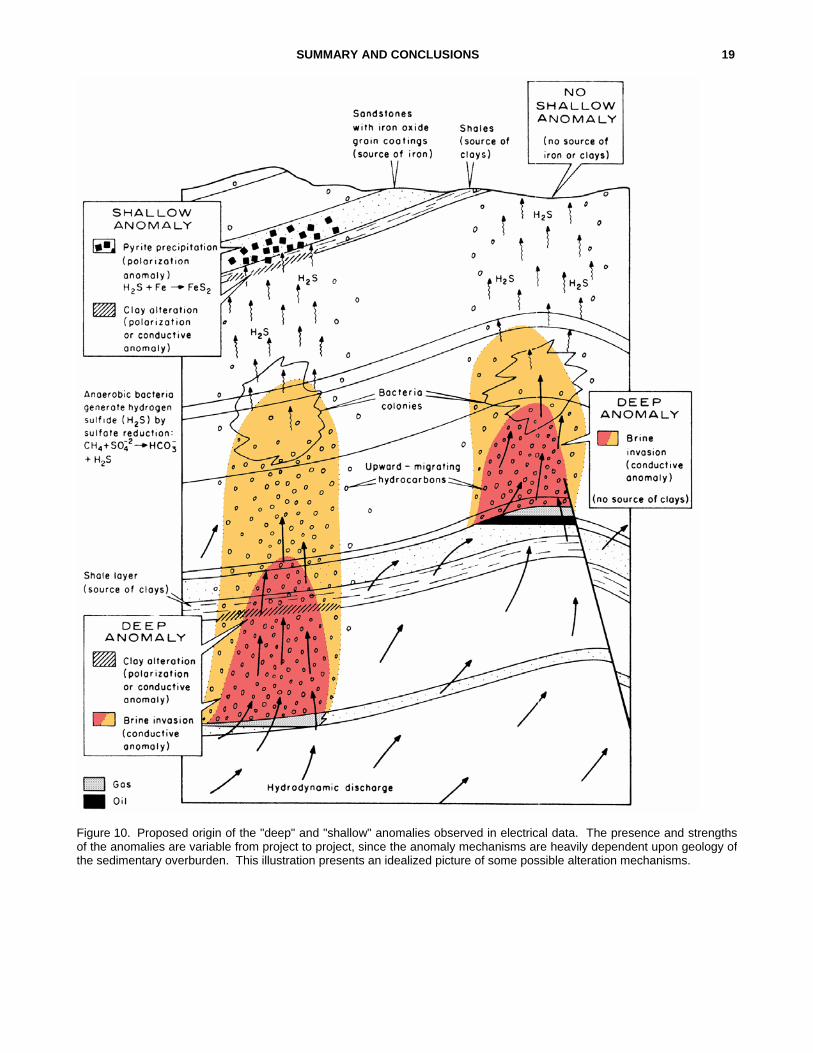
Figure 10. Proposed origin of the "deep" and "shallow" anomalies observed in electrical data. The presence and strengthsof the anomalies are variable from project to project, since the anomaly mechanisms are heavily dependent upon geology ofthe sedimentary overburden. This illustration presents an idealized picture of some possible alteration mechanisms.

20 CASE HISTORIES OF AN ELECTROMAGNETIC METHOD FOR PETROLEUM EXPLORATION
cation exchange with free calcium or sodium ions in brines, changes in pore-space geometry, or clay-hydrocarbon interactions.
The origin of the "shallow anomaly" seems to be related primarily to upward migration of light hydrocarbons. At least two theories can be advanced to explain these anomalies. The most common explanation involves the formation of pyrite in the near-surface sediments. Hydrogen sulfide, originating from the trap or created by the reduction of sulfates by anaerobic bacteria, rises through the sedimentary column and combines with iron cements and grain coatings in sandstones, precipitating pyrite. Pyrite has been found in relative abundance over many oil and gas fields, and it often shows a strong polarization response to electrical surveys of this type. The second explanation for the "shallow anomaly" involves clay alteration processes, either through interactions with the rising hydrocarbons or cation exchange interactions with the reduced waters overlying the hydrocarbons. Clays are often quite polarizable, although their responses vary considerably, depending upon clay type, pore space restrictions, lattice impurities, etc. Obviously, both the pyrite and clay theories are subject to the specific geology of the sedimentary column, and this may explain the extreme variability of the "shallow anomaly". Interpretation of the anomalies is therefore facilitated by a careful and detailed evaluation of subsurface lithology, structure, and hydrology.
CONCLUSIONS The case histories contain a large amount of information which may
ultimately prove to be of great value in understanding how electrical anomalies are influenced by geologic factors. Even today, little is known about the dynamics of hydrocarbon/fluid migration and alteration in the deep, geologically complex environments of sedimentary basins. A multidisciplinary approach involving electrical, hydrological, geochemical, geological, and theoretical studies should be undertaken in order to investigate these matters, so that the vast amount of information available in multifrequency electrical data can be utilized more fully.
However, the current problems in detailed understanding of anomaly mechanisms should not obscure the important evidence that electrical techniques such as the one illustrated in this volume seem to work well in many diverse environments, providing that great care is taken in data processing and interpretation. As an exploration tool, the chief advantage of the multifrequency electrical approach is that it can serve as an indirect indicator of the presence of hydrocarbons. This can complement existing reflection-seismic programs, which have structural mapping capabilities far superior to those of most electrical techniques, but which do not generally indicate hydrocarbon potential. In addition, electrical techniques offer valuable information in areas of difficulty in seismic exploration, such as in exploration for subtle stratigraphic traps, and in areas involving severely weathered overburdens, surface volcanics, and fractured evaporites. Hence, the combined efforts of geologic, seismic, and multifrequency electrical programs should form an effective strategy in evaluating hydrocarbon potential in geologically attractive targets.

SUMMARY AND CONCLUSIONS 21