proposed total maximum daily load (tmdl) fecal coliform in ... p_dep_tbb_fc_14… · for fecal...
TRANSCRIPT
PROPOSED TOTAL MAXIMUM DAILY LOAD (TMDL)
Fecal Coliform
in Trout Creek (WBID 1455)
and Mill Creek (WBID 1542A)
Prepared by:
US EPA Region 4 61 Forsyth Street SW
Atlanta, Georgia 30303
September 30, 2009

TMDL Report: Trout Creek (WBID 1455) and Mill Creek (WBID 1542A), Fecal Coliform
Acknowledgments
EPA would like to acknowledge that the contents of this report and the total maximum daily load (TMDL) contained herein were developed by the Florida Department of Environmental Protection (FDEP). Many of the text and figures may not read as though EPA is the primary author for this reason, but EPA is officially proposing the TMDL for fecal coliform for Trout Creek and Mill Creek and soliciting comment. EPA is proposing this TMDL in order to meet consent decree requirements pursuant to the Consent Decree entered in the case of Florida Wildlife Federation, et al. v. Carol Browner, et al., Case No. 98-356-CIV-Stafford. EPA will accept comments on this proposed TMDL for 60 days in accordance with the public notice issued on September 30, 2009. Should EPA be unable to approve a TMDL established by FDEP for the 303(d) listed impairment addressed by this report, EPA will establish this TMDL in lieu of FDEP, after full review of public comments. This TMDL analysis could not have been accomplished without significant contributions from staff in the Florida Department of Environmental Protection’s Southwest District Office, Hillsborough County, and the Watershed Evaluation and TMDL (WET) Section. Editorial assistance provided by Jan Mandrup-Poulsen and Linda Lord. For additional information on the watershed management approach and impaired waters in the Tampa Bay Tributaries Basin, contact: Terry Hansen Florida Department of Environmental Protection Bureau of Watershed Management Watershed Planning and Coordination Section 2600 Blair Stone Road, Mail Station 3565 Tallahassee, FL 32399-2400 Email: [email protected]: (850) 245–8561 Fax: (850) 245–8434 Access to all data used in the development of this report can be obtained by contacting: Kristina Bridger Florida Department of Environmental Protection Bureau of Watershed Management Watershed Evaluation and TMDL Section 2600 Blair Stone Road, Mail Station 3555 Tallahassee, FL 32399-2400 Email: [email protected]: (850) 245–8023 Fax: (850) 245–8536
ii
TMDL Report: Trout Creek (WBID 1455) and Mill Creek (WBID 1542A), Fecal Coliform
Contents
Chapter 1: INTRODUCTION___________________________________1
1.1 Purpose of Report ________________________________________________1
1.2 Identification of Waterbody _________________________________________1 1.2.1 Trout Creek (WBID 1455) ________________________________________1 1.2.2 Mill Creek (WBID 1542A)_________________________________________2
1.3 Background______________________________________________________5
Chapter 2: DESCRIPTION OF WATER QUALITY PROBLEM ________6
2.1 Statutory Requirements and Rulemaking History ______________________6
2.2 Information on Verified Impairment __________________________________6
Chapter 3. DESCRIPTION OF APPLICABLE WATER QUALITY STANDARDS AND TARGETS _______________________9
3.1 Classification of the Waterbody and Criteria Applicable to the TMDL ______9
3.2 Applicable Water Quality Standards and Numeric Water Quality Target ____9
Chapter 4: ASSESSMENT OF SOURCES_______________________10
4.1 Types of Sources ________________________________________________10
4.2 Potential Sources of Fecal Coliform in the Trout Creek (WBID 1455) and Mill Creek (WBID 1542A) Watersheds ______________________________________10
4.2.1 Point Sources_________________________________________________10 4.2.2 Land Uses and Nonpoint Sources _________________________________12
Chapter 5: DETERMINATION OF ASSIMILATIVE CAPACITY_______23
5.1 Determination of Loading Capacity_________________________________23 5.1.1 Data Used in the Determination of the TMDL ________________________23 5.1.2 TMDL Development Process ____________________________________23 5.1.4 Spatial Patterns _______________________________________________28
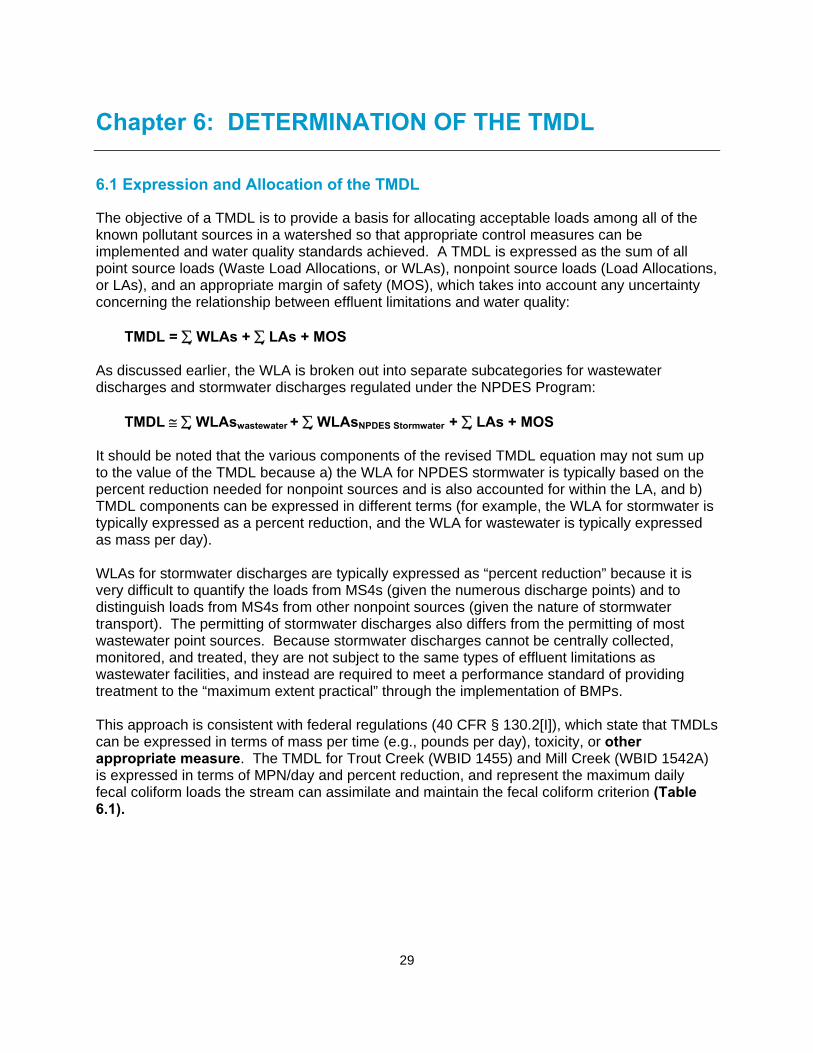
Chapter 6: DETERMINATION OF THE TMDL ____________________29
6.1 Expression and Allocation of the TMDL______________________________29
6.2 Load Allocation__________________________________________________30
6.3 Wasteload Allocation _____________________________________________30 6.3.1 NPDES Wastewater Discharges __________________________________30 6.3.2 NPDES Stormwater Discharges __________________________________30
6.4 Margin of Safety _________________________________________________30
iii

TMDL Report: Trout Creek (WBID 1455) and Mill Creek (WBID 1542A), Fecal Coliform
Chapter 7: NEXT STEPS: IMPLEMENTATION PLAN
DEVELOPMENT AND BEYOND _____________________32
7.1 TMDL Implementation____________________________________________32
References 34
Appendices _______________________________________________36
Appendix A: Background Information on Federal and State Stormwater Programs__________________________________________________________36
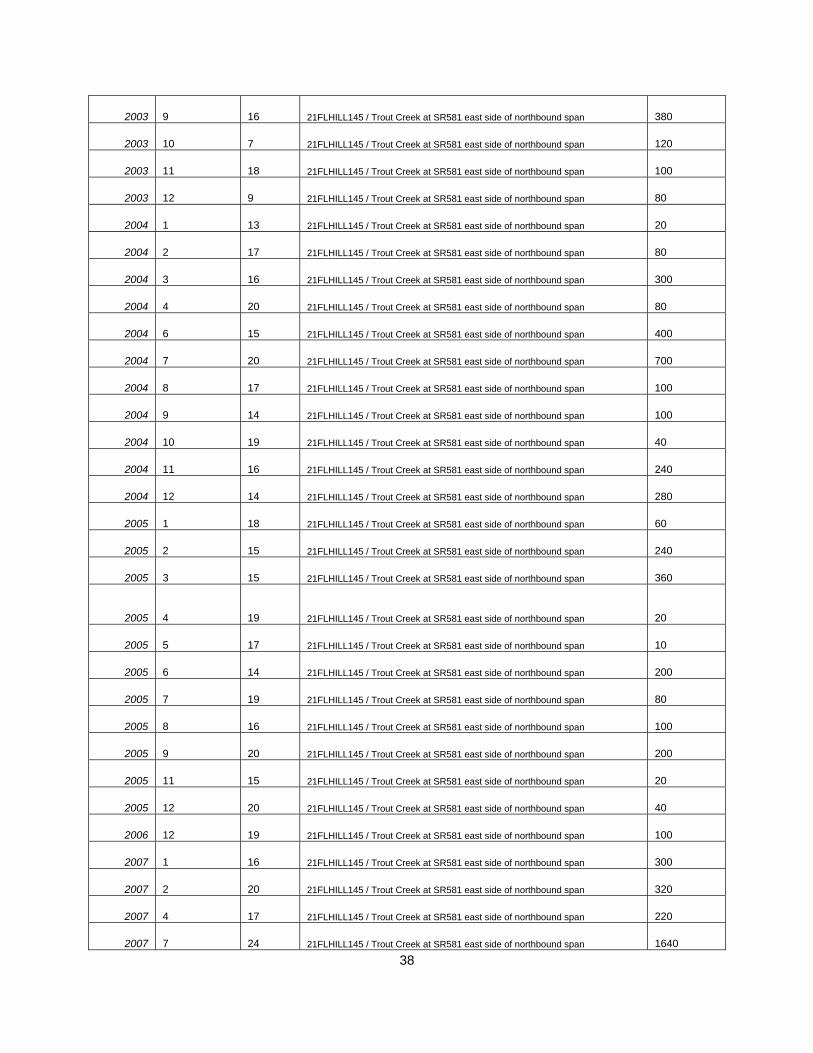
Appendix B: Fecal Coliform Data for Trout Creek (WBID 1455) and Mill Creek (WBID 1542A) during the Verification Period (January 2001 – June 2008)_____37
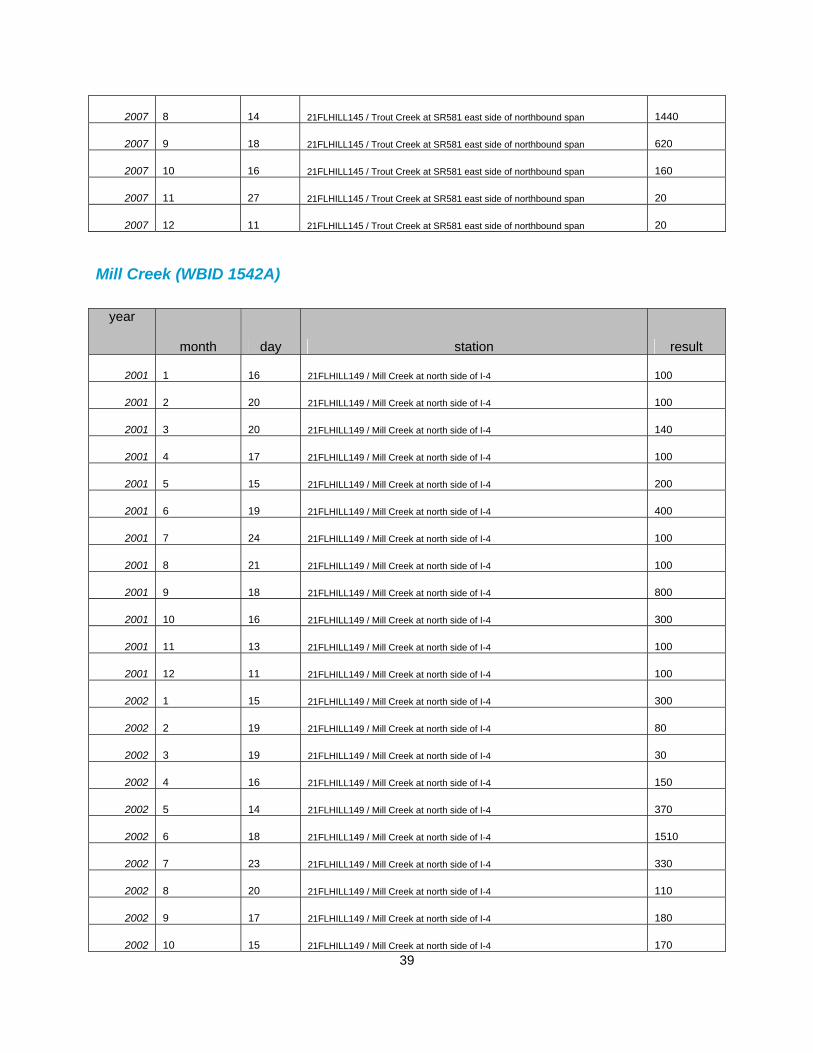
Trout Creek (WBID 1455) ____________________________________________37 Mill Creek (WBID 1542A) ____________________________________________39
Appendix C: Fecal Coliform Percent Reduction for Trout Creek (WBID 1455) and Mill Creek (WBID 1542A) during the Verification Period (January 2001 – June 2008)_________________________________________________________42
Trout Creek (WBID 1455) ____________________________________________42 Mill Creek (WBID 1542A) ____________________________________________42
iv
TMDL Report: Trout Creek (WBID 1455) and Mill Creek (WBID 1542A), Fecal Coliform
List of Tables
Table 2.1 Verified Impairments for Trout Creek (WBID 1455) and Mill Creek (WBID 1542A) __________________________________ 7
Table 2.2 Summary of Fecal Coliform Data Collected During Verification Period (January 2001 – June 2008) for Trout Creek (WBID 1455) and Mill Creek (WBID 1542A) ______________________ 7
Table 4.1 Livestock Distribution for Hillsborough and Pasco Counties ___ 13 Table 4.2 Classification of Land Use Categories in the Trout Creek (WBID
1455) Watershed ____________________________________ 16 Table 4.3 Classification of Land Use Categories in the Mill Creek (WBID
1542A) Watershed ___________________________________ 16 Table 4.4 Concentrations (Geometric Mean Colonies per 100 mL) of
Fecal Coliform from Urban Source Areas (Steuer et al., 1997; Bannerman et al., 1993) ______________________________ 17
Table 4.5 Dog Population Density, Wasteload, and Fecal Coliform Density ____________________________________________ 18
Table 4.6 Estimated Septic Numbers and Septic Failure Rates for Hillsborough County, 2002–07__________________________ 19
Table 4.7 Estimated Septic Numbers and Septic Failure Rates for Pasco County, 2002–07 ____________________________________ 20
Table 5.1 Summary Statistics of Fecal Coliform and Rainfall Data for Trout Creek (WBID 1455) by Month _____________________ 26
Table 5.2 Summary Statistics of Fecal Coliform and Rainfall Data for Mill Creek (WBID 1542A) by Month _________________________ 26
Table 6.1 TMDL Components for Fecal Coliform in the Trout Creek (WBID 1455) and Mill Creek (WBID 1542A) watersheds______ 30
v
TMDL Report: Trout Creek (WBID 1455) and Mill Creek (WBID 1542A), Fecal Coliform
List of Figures
Figure 1.1 Location of Trout Creek (WBID 1455) and Mill Creek (WBID 1542A) Watershed with Major Geopolitical Features in the Tampa Bay Tributaries Basin____________________________ 3
Figure 1.2 Location of Trout Creek (WBID 1455) and Mill Creek (WBID 1542A) Watershed with Major Geopolitical Features in the Hillsborough River Planning Unit _________________________ 4
Figure 2.1 Fecal Coliform Measurements for Trout Creek (Verification Period: January 2001 – June 2008)_______________________ 8
Figure 2.2 Fecal Coliform Measurements for Mill Creek (Verification Period: January 2001 – June 2008)_______________________ 8
Figure 4.1 Principal Land Uses in the Trout Creek (WBID 1455) and Mill Creek Watersheds, 2006 ______________________________ 15
Figure 4.2 Distributions of Water Quality Stations and Onsite Sewage Systems (Septic Tanks) in the Trout Creek (WBID 1455) and Mill Creek (WBID 1542A) Watersheds____________________ 22
Figure 5.1 Water Quality Sampling Stations in Trout Creek and Mill Creek (WBID 1455 & 1542A) ________________________________ 24
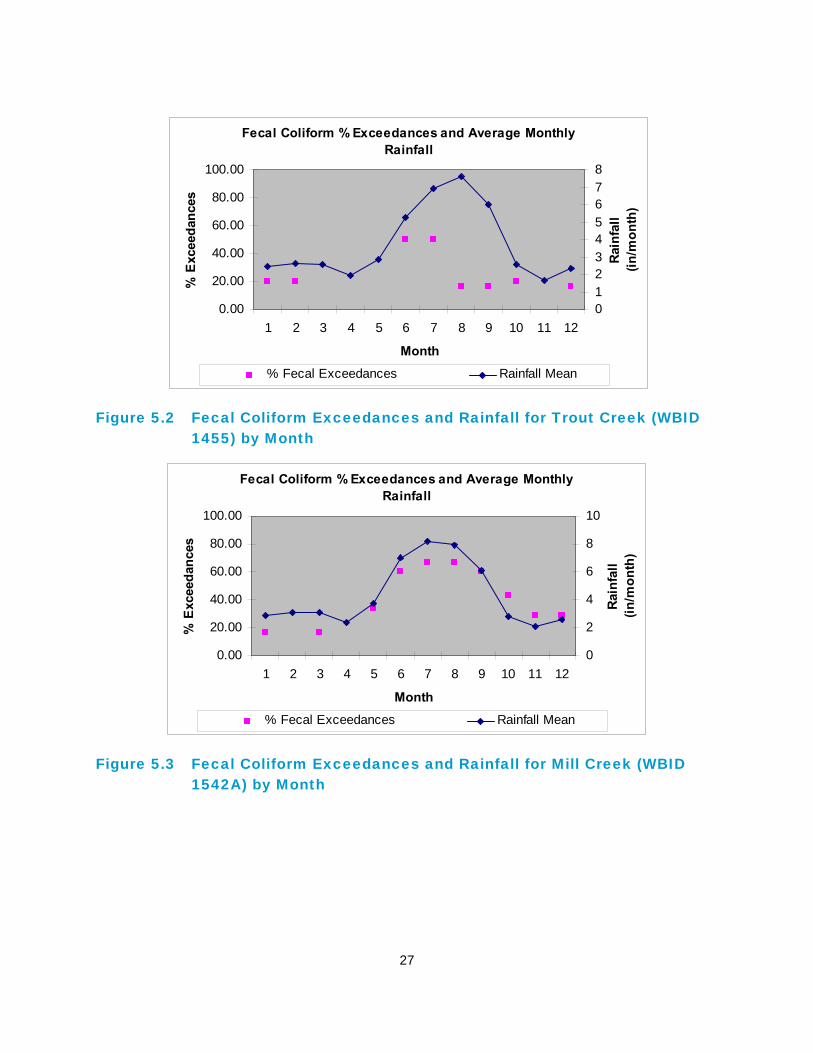
Figure 5.2 Fecal Coliform Exceedances and Rainfall for Trout Creek (WBID 1455) by Month _______________________________ 27
Figure 5.3 Fecal Coliform Exceedances and Rainfall for Mill Creek (WBID 1542A) by Month ____________________________________ 27
vi

TMDL Report: Trout Creek (WBID 1455) and Mill Creek (WBID 1542A), Fecal Coliform
Websites
Florida Department of Environmental Protection, Bureau of Watershed Restoration
TMDL Program http://www.dep.state.fl.us/water/tmdl/index.htmIdentification of Impaired Surface Waters Rule http://www.dep.state.fl.us/water/tmdl/docs/AmendedIWR.pdfSTORET Program http://www.dep.state.fl.us/water/storet/index.htm2008 305(b) Report http://www.dep.state.fl.us/water/docs/2008_Integrated_Report.pdfCriteria for Surface Water Quality Classifications http://www.dep.state.fl.us/water/wqssp/classes.htmBasin Status Report for the Tampa Bay Tributaries Basin http://www.dep.state.fl.us/water/tmdl/stat_rep.htmWater Quality Assessment Report for the Tampa Bay Tributaries Basin http://www.dep.state.fl.us/water/tmdl/stat_rep.htm
U.S. Environmental Protection Agency
Region 4: Total Maximum Daily Loads in Florida http://www.epa.gov/region4/water/tmdl/florida/ National STORET Programhttp://www.epa.gov/storet/
vii


Chapter 1: INTRODUCTION
1.1 Purpose of Report
This report presents the Total Maximum Daily Load (TMDL) for fecal coliform for Trout Creek and Mill Creek (WBID 1455 & 1542A) located in the Tampa Bay Tributaries Basin – Hillsborough River Planning Unit (Figure 1.1). These freshwater streams were verified impaired for fecal coliform, and were included on the Verified List of impaired waters for the Tampa Bay Tributaries Basin that was adopted by Secretarial Order in May 19, 2009. The TMDL establishes the allowable loadings to the Trout Creek (WBID 1455) and Mill Creek (WBID 1542A) watersheds that would restore the waterbody so that it meets its applicable water quality criteria for fecal coliform.
1.2 Identification of Waterbody
To provide a smaller-scale geographic basis for assessing, reporting, and documenting water quality improvement projects, FDEP divides basin groups into smaller areas called planning units. Planning units help organize information and management strategies around prominent sub-basin characteristics and drainage features. To the extent possible, planning units were chosen to reflect sub-basins that had previously been defined by the SWFWMD. Trout Creek and Mill Creek are located within the Hillsborough Planning Unit. For assessment purposes, the Department has divided the Hillsborough River Planning Unit into water assessment polygons with a unique waterbody identification (WBID) number for each watershed. Trout Creek is identified as WBID 1455, and Mill Creek is identified as WBID 1542A (Figure 1.1).
1.2.1 Trout Creek (WBID 1455)
The Trout Creek (WBID 1455) watershed encompasses 14,958 acres. The predominant landuses are approximately 5,230 acres of urban and built-up, 3,853 acres of wetlands, and 1764 acres of rangeland. Trout Creek is located partially in Hillsborough and Pasco County. Refer to Figure 1.2. The climate in Hillsborough and Pasco Counties, specifically areas surrounding the Trout Creek watershed, is sub-tropical with annual rainfall averaging approximately 45 inches, although rainfall amounts can vary greatly from year to year (CLIMOD, 2008). Based on data from a 30-year period (1971 – 2000), the average summer temperature is 89.9oF, and the average winter temperature is 72.8oF (CLIMOD, 2008). The topography of the Trout Creek watershed reflects its location within the Southwestern Florida Flatwoods or Southern Coastal Plains ecoregion. Elevations range in the downstream portion or southern part of the watershed from around 30 – 40 feet above sea level and in the upstream portion or northern part of the watershed around 80 – 90 feet above sea level (FDEP, 2008). The predominant soil type is medium fine sand and silt (FDEP, 2008). No major human population centers exist within the watershed.

1.2.2 Mill Creek (WBID 1542A)
The Mill Creek (WBID 1542A) watershed encompasses 3,456 acres. The predominant landuses are approximately 2,285 acres of urban and built-up and 530 acres of wetlands. Mill Creek is located in Hillsborough County. Refer to Figure 1.2. The climate in Hillsborough County, specifically areas surrounding the Mill Creek watershed, is sub-tropical with annual rainfall averaging approximately 52 inches, although rainfall amounts can vary greatly from year to year (CLIMOD, 2008). Based on data from a 30-year period (1971 – 2000), the average summer temperature is 90.8oF, and the average winter temperature is 74.7oF (CLIMOD, 2008). The topography of the Mill Creek watershed reflects its location within the Southwestern Florida Flatwoods or Southern Coastal Plains ecoregion. Elevations range in the upland portion of the watershed from 125 – 150 feet above sea level (FDEP, 2008). The predominant soil type is clayey sand (FDEP, 2008). Major human population centers exist within the watershed, such as the City of Plant City.
2

Figure 1.1 Location of Trout Creek (WBID 1455) and Mill Creek (WBID 1542A) Watershed with Major Geopolitical Features in the Tampa Bay Tributaries Basin
3

Figure 1.2 Location of Trout Creek (WBID 1455) and Mill Creek (WBID 1542A) Watershed with Major Geopolitical Features in the Hillsborough River Planning Unit
4
1.3 Background
This report was developed as part of the Florida Department of Environmental Protection’s (Department) watershed management approach for restoring and protecting state waters and addressing TMDL Program requirements. The watershed approach, which is implemented using a cyclical management process that rotates through the state’s fifty-two river basins over a five-year cycle, provides a framework for implementing the TMDL Program–related requirements of the 1972 federal Clean Water Act and the 1999 Florida Watershed Restoration Act (FWRA, Chapter 99-223, Laws of Florida). A TMDL represents the maximum amount of a given pollutant that a waterbody can assimilate and still meet water quality standards, including its applicable water quality criteria and its designated uses. TMDLs are developed for waterbodies that are verified as not meeting their water quality standards. TMDLs provide important water quality restoration goals that will guide restoration activities. This TMDL Report may be followed by the development and implementation of a Basin Management Action Plan, or BMAP, to reduce the amount of fecal coliform that caused the verified impairment of Trout Creek (WBID 1455) and Mill Creek (WBID 1542A). These activities will depend heavily on the active participation of the Southwest Florida Water Management District, local governments, businesses, and other stakeholders. The Department will work with these organizations and individuals to undertake or continue reductions in the discharge of pollutants and achieve the established TMDLs for impaired waterbodies.
5

Chapter 2: DESCRIPTION OF WATER QUALITY PROBLEM
2.1 Statutory Requirements and Rulemaking History
Section 303(d) of the federal Clean Water Act requires states to submit to the U.S. Environmental Protection Agency (EPA) lists of surface waters that do not meet applicable water quality standards (impaired waters) and establish a TMDL for each pollutant causing impairment of listed waters on a schedule. The Department has developed such lists, commonly referred to as 303(d) lists, since 1992. The list of impaired waters in each basin, referred to as the Verified List, is also required by the FWRA (Subsection 403.067[4], Florida Statutes [F.S.]); the state’s 303(d) list is amended annually to include basin updates. Florida’s 1998 303(d) list included several waterbodies in the Tampa Bay Tributaries Basin. Trout Creek (WBID 1455) and Mill Creek (WBID 1542A) are 1998 303(d) listed. However, the FWRA (Section 403.067, F.S.) stated that all previous Florida 303(d) lists were for planning purposes only and directed the Department to develop, and adopt by rule, a new science-based methodology to identify impaired waters. After a long rulemaking process, the Environmental Regulation Commission adopted the new methodology as Rule 62-303, Florida Administrative Code (F.A.C.) (Identification of Impaired Surface Waters Rule, or IWR), in April 2001; the rule was modified in 2006 and 2007.
2.2 Information on Verified Impairment
The Department used the IWR to assess water quality impairments in the Trout Creek (WBID 1455) and Mill Creek (WBID 1542A) watersheds and verified the impairments for fecal coliform (Table 2.1). Table 2.2 summarizes the data collected during the verification period (January 2001 – June 2008). As shown in Table 2.1, the projected year for the fecal coliform bacteria TMDLs was 2008, but the Settlement Agreement between EPA and Earthjustice, which drives the TMDL development schedule for waters on the 1998 303(d) list, allows an additional nine months to complete the TMDLs. As such, these TMDLs must be adopted and submitted to EPA by September 30, 2009. This waterbody was verified as impaired based on fecal coliform because, using the IWR methodology, more than 10 percent of the values exceeded the Class III waterbody criterion of 400 counts per 100 milliliters (counts/100mL) for fecal coliform. For Trout Creek (WBID 1455) had 11 exceedances out of 60 samples, and Mill Creek (WBID 1542A) had 25 exceedances out of 73 samples in the verified period exceeded the criterion of 400 counts/100mL. The verified impairments were based on data collected by Hillsborough County. WBID location and STORET stations are shown in Figure 5.1. Figure 2.1 and 2.2 displays the fecal coliform data collected during the verification period (January 2001 – June 2008) for Trout Creek and Mill Creek, respectively.
6

Table 2.1 Verified Impairments for Trout Creek (WBID 1455) and Mill Creek (WBID 1542A)
Waterbody Segment Name
Parameters Included on the 1998 303(d) List
Parameter Causing
Impairment
Projected Year for TMDL
Development* WBID 1455 Trout Creek Fecal Coliform Fecal Coliform 2008
1542A Mill Creek Fecal Coliform Fecal Coliform 2008
*The projected year for the fecal coliform bacteria TMDLs was 2008, but the Settlement Agreement between EPA and Earthjustice, which drives the TMDL development schedule for waters on the 1998 303(d) list, allows an additional nine months to complete the TMDLs. As such, these TMDLs must be adopted and submitted to EPA by September 30, 2009.
Table 2.2 Summary of Fecal Coliform Data Collected During Verification Period (January 2001 – June 2008) for Trout Creek (WBID 1455) and Mill Creek (WBID 1542A)
Total Number
of Samples
IWR-required number of
exceedances for the Verified List
Number of observed
exceedances
Number of observed
nonexceedances
Number of seasons data was collected
Mean Median Min Max Waterbody Segment
Name
Trout Creek 60 10 11 49 4 339.5 180 10 2,000 Mill Creek 73 12 25 48 4 834 200 20 20,000
7

Fecal Coliform Data for Trout Creek (WBID 1542A)
0
500
1000
1500
2000
2500
12/06/9904/19/01
09/01/0201/14/04
05/28/0510/10/06
02/22/0807/06/09
Date
Feca
l Col
iform
(cou
nts/
100m
L)
Fecal Coliform
Figure 2.1 Fecal Coliform Measurements for Trout Creek (Verification Period: January 2001 – June 2008)
Fecal Coliform Data for Mill Creek (WBID 1542A)
0
1000
2000
3000
4000
5000
12/6/19994/19/2001
9/1/20021/14/2004
5/28/200510/10/...
2/22/20087/6/2009
Date
Feca
l Col
iform
(cou
nts/
100m
L) Fecal Coliform
Figure 2.2 Fecal Coliform Measurements for Mill Creek (Verification Period: January 2001 – June 2008)
8
Chapter 3. DESCRIPTION OF APPLICABLE WATER QUALITY STANDARDS AND TARGETS
3.1 Classification of the Waterbody and Criteria Applicable to the TMDL
Florida’s surface waters are protected for five designated use classifications, as follows: Class I Potable water supplies Class II Shellfish propagation or harvesting Class III Recreation, propagation, and maintenance of a healthy, well-
balanced population of fish and wildlife Class IV Agricultural water supplies Class V Navigation, utility, and industrial use (there are no state
waters currently in this class)
Trout Creek and Mill Creek are Class III waterbodies, with a designated use of recreation, propagation, and maintenance of a healthy, well-balanced population of fish and wildlife. The Class III water quality criteria applicable to the impairment addressed by this TMDL are fecal coliform.
3.2 Applicable Water Quality Standards and Numeric Water Quality Target
Numeric criteria for bacterial quality are expressed in terms of fecal coliform bacteria concentrations. The water quality criteria for protection of Class III waters, as established by Chapter 62-302, F.A.C., states the following:
Fecal Coliform Bacteria: The most probable number (MPN) or membrane filter (MF) counts per 100 ml of fecal coliform bacteria shall not exceed a monthly average of 200, nor exceed 400 in 10 percent of the samples, nor exceed 800 on any one day.
The criterion states that monthly averages shall be expressed as geometric means based on a minimum of 10 samples taken over a 30-day period. During the development of this TMDL there were insufficient data (fewer than 10 samples in a given month) available to evaluate the geometric mean criterion for fecal coliform bacteria. Therefore, the criterion selected for the TMDL was not to exceed 400 MPN/100mL in any sampling event for fecal coliform. The 10 percent exceedance allowed by the water quality criterion for fecal coliform bacteria was not used directly in estimating the target load, but was included in the TMDLs margin of safety (as described in subsequent chapters).
9
Chapter 4: ASSESSMENT OF SOURCES
4.1 Types of Sources
An important part of the TMDL analysis is the identification of pollutant source categories, source subcategories, or individual sources of fecal coliforms in the Trout Creek (WBID 1455) and Mill Creek (WBID 1542A) watersheds and the amount of pollutant loading contributed by each of these sources. Sources are broadly classified as either “point sources” or “nonpoint sources.” Historically, the term point sources has meant discharges to surface waters that typically have a continuous flow via a discernable, confined, and discrete conveyance, such as a pipe. Domestic and industrial wastewater treatment facilities (WWTFs) are examples of traditional point sources. In contrast, the term “nonpoint sources” was used to describe intermittent, rainfall driven, diffuse sources of pollution associated with everyday human activities, including runoff from urban land uses, agriculture, silviculture, and mining; discharges from failing septic systems; and atmospheric deposition. However, the 1987 amendments to the Clean Water Act redefined certain nonpoint sources of pollution as point sources subject to regulation under the EPA’s National Pollutant Discharge Elimination Program (NPDES). These nonpoint sources included certain urban stormwater discharges, including those from local government master drainage systems, construction sites over five acres, and a wide variety of industries (see Appendix A for background information on the federal and state stormwater programs). To be consistent with Clean Water Act definitions, the term “point source” will be used to describe traditional point sources (such as domestic and industrial wastewater discharges) and stormwater systems requiring an NPDES stormwater permit when allocating pollutant load reductions required by a TMDL (see Section 6.1). However, the methodologies used to estimate nonpoint source loads do not distinguish between NPDES stormwater discharges and non-NPDES stormwater discharges, and as such, this source assessment section does not make any distinction between the two types of stormwater.
4.2 Potential Sources of Fecal Coliform in the Trout Creek (WBID 1455) and Mill Creek (WBID 1542A) Watersheds
4.2.1 Point Sources
NPDES Wastewater Facilities
Trout Creek In the Trout Creek (WBID 1455) watershed two NPDES permitted surface water discharge wastewater facilities exist within the watershed. Wastewater facility Pebble Creek Village WWTF (FL 0039896) with the Domestic Wastewater Program and wastewater facility Shell Station – Dona Michelle Blvd (FLG 911987) with the Industrial Wastewater Program. FDEP does not expect the Industrial wastewater facility Shell Station – Dona Michelle Blvd to
10

contribute to the fecal coliform load. The Domestic wastewater facility Pebble Creek Village WWTF is a potential fecal contributor. The facility is located on 10210 Regents Park Drive, Tampa, FL. Treatment facilities: An existing 0.4 mgd three months average daily flow (3MADF) Type II RABCO process advanced domestic wastewater treatment facility nitrification/de-nitrification process consisting of the following units: a headworks with a grit removal chamber, a single coarse bar screen with bypass channel, and an odor scrubbing system of 8,000 gallons, one flow equalization basin of 51,800 gallons total volume, two aeration tanks of 345,800 gallons of total volume, one de-nitrification basin of 21,150 gallons, one re-aeration tank of 13,700 gallons, a first stage clarifier of 108,000 gallons and 1,286 square feet, a second de-nitrification basin of 24,000 gallons, a second re-aeration tank of 24,000 gallons, a second stage clarifier of 101,000 and 1,286 square feet, three de-nitrification filters of 270 square feet total surface area, one mudwell of 21,660 gallons, one clearwell of 3,300 gallons, two chlorine contact tanks of 25,300 gallons total volume and one effluent pumping station of 5,000 gallons. For reclaimed water, sodium hypochlorite liquid system is injected to the inlet of each chlorine contact chamber. The effluent is transferred through three 12-lamp ultraviolet light pressure vessels for surface water high level disinfection, thence to the surface water discharge location D001 described below. Residuals are treated by directing waste activated sludge from both clarifiers to an aerated digester basin of 67,800 gallons, from which the residuals are transferred to a sludge holding tank of 9,000 gallons where lime stabilization is accomplished. Stabilized residuals are disposed by means of land application. Filter backwash is returned to the flow equalization basin. Methanol is injected prior to the de-nitrification filters and ferric sulfate is injected into the plant influent line prior to the headworks for odor control and to aid in phosphorus removal when discharging to D-001. Effluent quality is continuously monitored for turbidity as a measure of TSS and chlorine residual, when going to the slow rate land application system, as a measure of disinfection effectiveness. Chemical feed is available on a standby status as a settling aid. Effluent failing to meet Part III public access quality standards is directed by means of an automatic valve system to reject storage basin of 191,400 gallons. Effluent which does meet Part III quality standards is transferred to the Pebble Creek Golf Course for reuse. The storage, discharge, and reject functions are controlled, sequenced and operated during staffed and unstaffed periods according to procedures set forth in the plant Operating Protocol in order to assure maximum reliability and safeguards on the quality of the reclaimed water. Plant alarm systems are remoted by teledial systems to plant operational personnel during non-duty periods. Standby emergency power is provided by a 125 KW autostart generator. Disposal: (Surface water discharge) An existing 0.4 mgd annual average daily (AADF) permitted discharge to Pebble Creek to Trout Creek (Class III fresh waters) at discharge location D-001. The outfall structure is approximately 12 inch diameter PVC pipe through the creek bank with 90 degree elbow and stone riprap with no diffuser, with the pipe outlet approximately three feet above the water level. Intermittently discharging stormwater storage ponds for Part III reclaimed water is stored in stormwater storage lake system, Pebble Creek Golf Course Storage Lake System, which intermittently discharges to Trout Creek.
11
Reuse: (Land application) An existing 0.40 mgd annual average daily (AADF) permitted capacity Part III public access reuse system (R-001) serving Pebble Creek Village Golf Course (55.9 acres, 1.0 inches per week); and Pebble Creek Village driving range (8.0 acres, 1.0 inches per week). Diurnal storage is available at the golf course in an unlined isolated storage pond approximately 800,000 gallons capacity. Effluent quality is continuously monitored at the source wastewater treatment plants for high-level disinfection in accordance with the facility’s approved operating protocol to assure maximum reliability and safeguards on the quality of the reclaimed water. Permitted Limitations: The surface water discharges effluent limitations for flow (D-001) is 0.40 mgd annual average and for fecal coliform is 25/100 mL in a single sample. The reuse and land application systems reclaimed water limitations for flow (R-001) is 0.40 mgd annual average and for fecal coliform is 25/100 mL in a single sample. Other limitations and monitoring and reporting requirements for flow (total plant) is 0.40 mgd annual average.
Mill Creek In the Mill Creek (WBID 1542A) watershed two NPDES permitted surface water discharge wastewater facilities exist within the watershed. Wastewater facility Plant City – City of WRF (FL 0026557) with the Domestic Wastewater Program and wastewater facility Kerry I & F Contracting Company (FL 0037389) with the Industrial Wastewater Program. FDEP does not expect the Industrial wastewater facility Kerry I & F (Hillsborough Crystals International, Inc.) to contribute to the fecal coliform load. The Domestic wastewater facility Plant City – City of WRF is a potential fecal coliform contributor; however, the facility discharges outside the boundaries of the Mill Creek watershed.
Municipal Separate Storm Sewer System Permittees Municipal Separate Storm Sewer Systems (MS4s) may discharge fecal coliform to waterbodies in response to storm events. To address stormwater discharges, the EPA developed the NPDES stormwater permitting program. The stormwater collection systems in the Trout Creek watershed are maintained by Hillsborough County (#FLS 000006), Pasco County (#FLS 000032), and Tampa Bay Palms Community Development District (FLR04E070). The stormwater collection systems in the Mill Creek watershed are owned and operated by Hillsborough County (#FLS 000006) and City of Plant City (Hillsborough Co-permittee).
4.2.2 Land Uses and Nonpoint Sources
Additional fecal coliform loadings to Trout Creek (WBID 1455) and Mill Creek (WBID 1542A) are generated from nonpoint sources in the basin. Potential nonpoint sources of coliforms include loadings from surface runoff, wildlife, livestock, pets, leaking sewer lines, and leaking septic tanks. Nonpoint source pollution, unlike pollution from industrial and sewage treatment plants, comes from many diffuse sources. Nonpoint pollution is caused by rainfall moving over and through the ground. As the runoff moves, it picks up and carries away natural and human-made pollutants, finally depositing them into lakes, rivers, wetlands, coastal waters, and even underground sources of drinking water (EPA, 1994).
12
An exceedance under dry weather conditions could be considered as stemming primarily from baseflow, which carries the pollutant from the surficial aquifer. Baseflow pollution could result from many different sources, including failed septic tanks and sewer lines, which are covered in more detail later in this chapter. Livestock, pets, and wildlife (birds, raccoons, rabbits, etc) could also contribute to the fecal coliform exceedances in the watershed because these animals have direct access to the stream, especially under low-flow conditions.
Wildlife Wildlife deposit coliform bacteria with their feces onto land surfaces, where they can be transported during storm events to nearby streams. Some wildlife (such as otters, beavers, raccoons, and birds) deposits their feces directly into the water. The bacterial load from naturally occurring wildlife is assumed to be background. In addition, any strategy employed to control this source would probably have a negligible impact on attaining water quality standards.
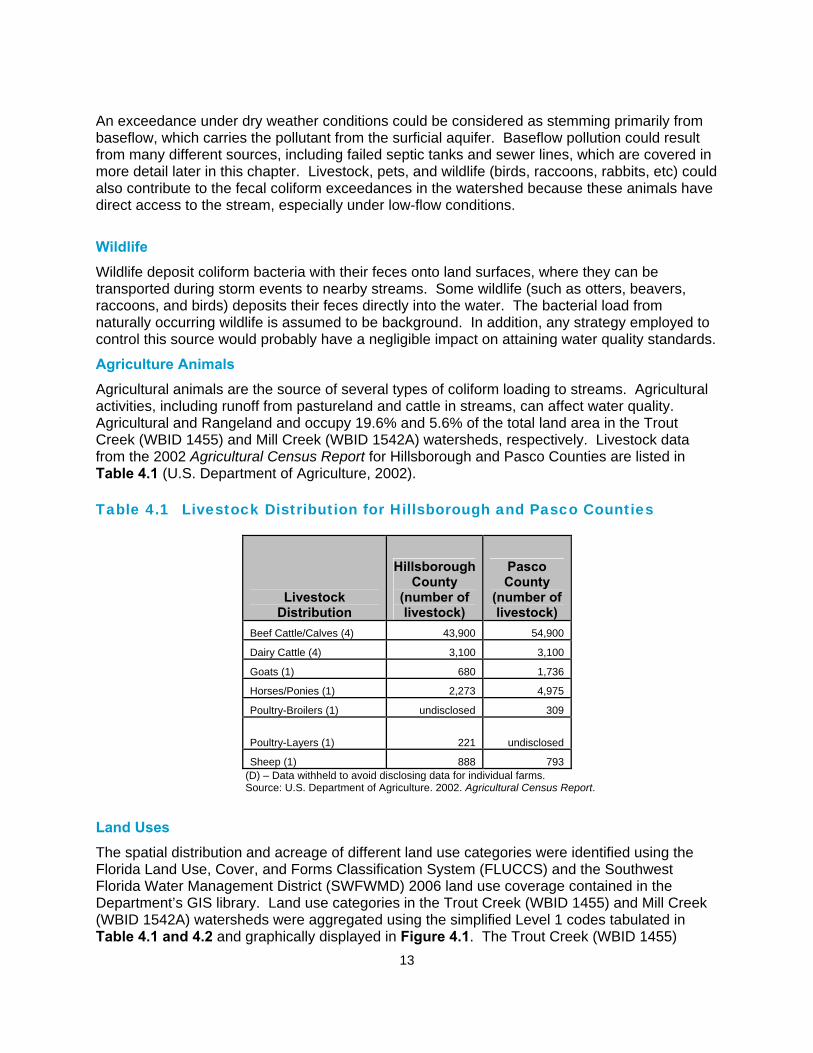
Agriculture Animals Agricultural animals are the source of several types of coliform loading to streams. Agricultural activities, including runoff from pastureland and cattle in streams, can affect water quality. Agricultural and Rangeland and occupy 19.6% and 5.6% of the total land area in the Trout Creek (WBID 1455) and Mill Creek (WBID 1542A) watersheds, respectively. Livestock data from the 2002 Agricultural Census Report for Hillsborough and Pasco Counties are listed in Table 4.1 (U.S. Department of Agriculture, 2002). Table 4.1 Livestock Distribution for Hillsborough and Pasco Counties
Hillsborough County
(number of livestock)
Pasco County
(number of livestock)
Livestock Distribution
Beef Cattle/Calves (4) 43,900 54,900
Dairy Cattle (4) 3,100 3,100
Goats (1) 680 1,736
Horses/Ponies (1) 2,273 4,975
Poultry-Broilers (1) undisclosed 309
Poultry-Layers (1) 221 undisclosed
Sheep (1) 888 793 (D) – Data withheld to avoid disclosing data for individual farms. Source: U.S. Department of Agriculture. 2002. Agricultural Census Report.
Land Uses The spatial distribution and acreage of different land use categories were identified using the Florida Land Use, Cover, and Forms Classification System (FLUCCS) and the Southwest Florida Water Management District (SWFWMD) 2006 land use coverage contained in the Department’s GIS library. Land use categories in the Trout Creek (WBID 1455) and Mill Creek (WBID 1542A) watersheds were aggregated using the simplified Level 1 codes tabulated in Table 4.1 and 4.2 and graphically displayed in Figure 4.1. The Trout Creek (WBID 1455)
13

watershed encompasses 14,958 acres. The predominant landuses are approximately 5,230 acres of urban and built-up, 3,853 acres of wetlands, and 1764 acres of rangeland. The Mill Creek (WBID 1542A) watershed encompasses 3,456 acres. The predominant landuses are approximately 2,285 acres of urban and built-up and 530 acres of wetlands.
14

Figure 4.1 Principal Land Uses in the Trout Creek (WBID 1455) and Mill Creek Watersheds, 2006
15

Table 4.2 Classification of Land Use Categories in the Trout Creek (WBID 1455) Watershed
16
% Land Use Acreage Acreage Level 1 Code
1000 Urban and Built-Up 2490 16.65 1100 Residential Low Density 328 2.19 1200 Residential Medium Density 783 5.23 1300 Residential High Density 1628 10.88 2000 Agriculture 1165 7.79 3000 Rangeland 1764 11.80 4000 Upland Forest/Rural Open 1426 9.53 5000 Water 677 4.53 6000 Wetlands 3853 25.76 7000 Barren Land 53 0.35 8000 Transportation, Communication, & Utilities 791 5.29
TOTAL 14958 100.00 Table 4.3 Classification of Land Use Categories in the Mill Creek (WBID
1542A) Watershed
% Land Use Acreage Acreage Level 1 Code
1000 Urban and Built-Up 1015 29.37 1100 Residential Low Density 94 2.71 1200 Residential Medium Density 965 27.92 1300 Residential High Density 212 6.13 2000 Agriculture 194 5.61 3000 Rangeland 0 0.00 4000 Upland Forest/Rural Open 177 5.12 5000 Water 25 0.72 6000 Wetlands 530 15.32 7000 Barren Land 37 1.07 8000 Transportation, Communication, & Utilities 208 6.02
TOTAL 3456 100.00

Urban Development Pets (especially dogs) could be a significant source of coliform pollution through surface runoff in the Trout Creek (WBID 1455) and Mill Creek (WBID 1542A) watersheds. In addition to pets, other animal fecal coliform contributors commonly seen in urban areas include rats, pigeons, and sometimes raccoons. Studies report that up to 95 percent of the fecal coliform found in urban stormwater can come from nonhuman origins (Alderiso et al., 1996; Trial et al., 1993). The most important nonhuman fecal coliform contributors appear to be dogs and cats. In a highly urbanized Baltimore catchment, Lim and Olivieri (1982) found that dog feces were the single greatest source for fecal coliform and fecal streptococcus bacteria. Trial et al. (1993) also reported that cats and dogs were the primary source of fecal coliform in urban watersheds. Using bacteria source tracking techniques, Watson (2002) found that the amount of fecal coliform bacteria contributed by dogs in Stevenson Creek in Clearwater, Florida, was as important as that from septic tanks. According to the American Pet Products Manufacturers Association (APPMA), about 4 out of 10 U.S. households include at least one dog. A single gram of dog feces contains about 23 million fecal coliform bacteria (Van der Wel, 1995). Unfortunately, statistics show that about 40 percent of American dog owners do not pick up their dogs’ feces. Table 4.4 shows the fecal coliform concentrations of surface runoff measured in two urban areas (Bannerman et al., 1993; Steuer et al., 1997). While bacteria levels were widely different in the two studies, both indicated that residential lawns, driveways, and streets were the major source areas for bacteria.
Table 4.4 Concentrations (Geometric Mean Colonies per 100 mL) of Fecal Coliform from Urban Source Areas (Steuer et al., 1997; Bannerman et al., 1993)
Marquette, MI Madison, WI Geographic Location Number of storms sampled 12 9
Commercial parking lot 4,200 1,758 High-traffic street 1,900 9,627
Medium-traffic street 2,400 56,554 Low-traffic street 280 92,061
Commercial rooftop 30 1,117 Residential rooftop 2,200 294
Residential driveway 1,900 34,294 Residential lawns 4,700 42,093
Basin outlet 10,200 175,106 The number of dogs in the Trout Creek (WBID 1455) and Mill Creek (WBID 1542A) watersheds are not known. Therefore, this analysis used the statistics produced by APPMA to estimate the possible fecal coliform loads contributed by dogs. Using county census (population density, housing units, etc.) and area (mi 2) information, the census information was extrapolated for the Trout Creek (WBID 1455) and Mill Creek (WBID 1542A) watersheds. Trout Creek is located partially in Hillsborough and Pasco County. The estimated human population in Hillsborough and Pasco County (calculated from the U.S. Census Bureau in 2007) was approximately
17

1,174,727 and 462,715, respectively. The extrapolated human population in the Trout Creek (WBID 1455) watershed was approximately 27,442 (Hillsborough County: 24,527 people or 2,666 persons per square mile; Pasco County: 2,915 people or 198 persons per square mile). According to the U.S. Census Bureau in 2007, there were 2.51 persons per household in Hillsborough County and 2.30 persons per household in Pasco County. The total number of households is 11,038 (Hillsborough County: 9,771 households and Pasco County: 1,267 households). Assuming that 40 percent of the households in this area have 1 dog, the total number of dogs in the Trout Creek watershed is about 3,959 (Hillsborough County: 3,908 dogs; Pasco County: 51 dogs). Mill Creek is located in Hillsborough County. The estimated human population in Hillsborough County (calculated from the U.S. Census Bureau in 2007) was approximately 1,174,727. The extrapolated human population in the Mill Creek (WBID 1542A) watershed was approximately 1,944 people or 360 persons per square mile. The total number of households is 774. According to the U.S. Census Bureau in 2007, there were 2.51 persons per household in Hillsborough County. Assuming that 40 percent of the households in this area have 1 dog, the total number of dogs in the Mill Creek watershed is about 310. According to the waste production rate for dogs and the fecal coliform counts per gram of dog wastes listed in Table 4.5, and assuming that 40 percent of dog owners do not pick up dog feces, the total waste produced by dogs and left on the land surface of residential areas would be 577,080 grams/day. The total fecal coliform load produced by dogs for Trout Creek and Mill Creek would be 1.5 x 10¹² counts/day and 1.2 x 10¹¹ counts/day of fecal coliform, respectively. It should be noted that this load only represents the fecal coliform load created in the watershed and is not intended to be used to represent a part of the existing load that reaches the receiving waterbody. The fecal coliform load that eventually reaches the receiving waterbody could be significantly less than this value due to attenuation in overland transport. Table 4.5 Dog Population Density, Wasteload, and Fecal Coliform Density
18
Population density (an/household) Waste load (g/an-day) Fecal coliform density
(fecal coliform/g) Type
Dog 0.4* 450 2,200,000 * Number from APPMA. Source: Weiskel et al., 1996.
Septic Tanks Septic tanks are another potentially important source of coliform pollution in urban watersheds. When properly installed, most of the coliform from septic tanks should be removed within 50 meters of the drainage field (Minnesota Pollution Control Agency, 1999). However, in areas with a relatively high ground water table, the drainage field can be flooded during the rainy season, and coliform bacteria can pollute the surface water through storm runoff. Septic tanks may also cause coliform pollution when they are built too close to irrigation wells. Any well that is installed in the surficial aquifer system will cause a drawdown. If the septic tank system is built too close to the well (e.g., less than 75 feet), the septic tank discharge will be within the cone of influence of the well. As a result, septic tank effluent may go into the well and once the polluted water is used to irrigate lawns, coliform bacteria may reach the land surface and wash into surface waters during the rainy season.

A rough estimate of fecal coliform loads from failed septic tanks in each watershed can be made using Equation 4.1:
L = 37.85* N * Q * C * F Equation 4.1 Where,
L is the fecal coliform daily load (counts/day); N is the total number of septic tanks in the watershed (septic tanks); Q is the discharge rate for each septic tank; C is the fecal coliform concentration for the septic tank discharge, and F is the septic tank failure rate.
Based on 2007 Florida Department of Health (FDOH) onsite sewage GIS coverage (http://www.doh.state.fl.us/environment/programs/EhGis/EhGisDownload.htm), about 64 and 61 housing units (N) were identified as being on septic tanks in the Trout Creek and Mill Creek watersheds, respectively (Figure 4.2). FDEP is aware that the FDOH onsite sewage GIS coverage does not include all septic tanks and when an area converts to sewer line the septic tank information is not removed. The discharge rate from each septic tank (Q) was calculated by multiplying the average household size by the per capita wastewater production rate per day. Based on the information published by the U.S. Census Bureau in 2007, the average household size for Hillsborough and Pasco Counties are about 2.51 and 2.30 people/household, respectively. The same population density was assumed for the Trout Creek and Mill Creek watersheds. A commonly cited value for per capita wastewater production rate is 70 gallons/day/person (EPA, 2001). The commonly cited concentration (C) for septic tank discharge is 1x10⁶ counts/100mL for fecal coliform (EPA, 2001). No measured septic tank failure rate data were available for the watershed at the time this TMDL analysis was conducted. Therefore the failure rate was derived from the number of septic tank and septic tank repair permits for the county published by FDOH (http://www.doh.state.fl.us/environment/OSTDS/statistics/ostdsstatistics.htm). The number of septic tanks in the county was calculated assuming that none of the installed septic tanks will be removed after being installed (Table 4.6 and 4.7). The reported number of septic tank repair permits was also obtained from the FDOH website (Table 4.6 and 4.7). Based on this information, a discovery rate of failed septic tanks for each year between 2002 and 2007 was calculated and listed in Table 4.6 and 4.7. Using the table, the average annual septic tank failure discovery rate for Hillsborough County is about 0.81 percent and for Pasco County is about 0.93 percent. Assuming that failed septic tanks are not discovered for about 5 years, the estimated annual septic tank failure rate is about 5 times the discovery rate, or 4.03 percent for Hillsborough County and 4.63 percent for Pasco County. Based on Equation 4.1, the estimated fecal coliform loading from failed septic tanks in the Trout Creek watershed is approximately 1.64 x 10¹⁰ counts/day and in the Mill Creek watershed is approximately 1.63 x 10¹⁰ counts/day. Table 4.6 Estimated Septic Numbers and Septic Failure Rates for
Hillsborough County, 2002–07
2002 2003 2004 2005 2006 2007 Average New installation (septic tanks) 986 1031 1005 1314 1236 487 1010
19

Accumulated installation (septic tanks) 100,483 101,469 102,500 103,505 104,819 106,055 103,138Repair permit (septic tanks) 998 929 735 815 751 754 830 Failure discovery rate (%) 0.99 0.92 0.72 0.79 0.72 0.71 0.81
Failure rate (%)* 4.97 4.58 3.59 3.94 3.58 3.55 4.03 * The failure rate is 5 times the failure discovery rate. Table 4.7 Estimated Septic Numbers and Septic Failure Rates for Pasco
County, 2002–07
2002 2003 2004 2005 2006 2007 Average New installation (septic tanks) 726 760 585 670 659 416 636
Accumulated installation (septic tanks) 66,583 67,309 68,069 68,654 69,324 69,983 68,320 Repair permit (septic tanks) 688 667 643 643 602 549 632 Failure discovery rate (%) 1.03 0.99 0.94 0.94 0.87 0.78 0.93
Failure rate (%)* 5.17 4.95 4.72 4.68 4.34 3.92 4.63 * The failure rate is 5 times the failure discovery rate.
Sanitary Sewer Overflows Sanitary sewer overflows (SSOs) can also be a potential source of fecal bacteria pollution. Human sewage can be introduced into surface waters even when storm and sanitary sewers are separated. Leaks and overflows are common in many older sanitary sewers where capacity is exceeded, high rates of infiltration and inflow occur (i.e., outside water gets into pipes, reducing capacity), frequent blockages occur, or sewers are simply falling apart due to poor joints or pipe materials. Power failures at pumping stations are also a common cause of SSOs. The greatest risk of an SSO occurs during storm events; however, few comprehensive data are available to quantify SSO frequency and bacteria loads in most watersheds. Fecal coliform loading from sewer line leakage can be calculated, based on the number of people in the watershed, typical per household generation rates, and the typical fecal coliform concentration in domestic sewage, assuming a leakage rate of 0.5 percent (Culver et al., 2002). Based on this assumption, a rough estimate of fecal coliform loads from leaks and overflows of sanitary sewer in the Trout Creek and Mill Creek watersheds can be made using Equation 4.2:
L = 37.85* N * Q * C * F Equation 4.2 Where,
L is the fecal coliform daily load (counts/day); N is the number of households using sanitary sewer in the watershed; Q is the discharge rate for each household; C is the fecal coliform concentration for the domestic wastewater discharge, and F is the sewer line leakage rate.
The number of households (N) in Trout Creek (WBID 1455) and Mill Creek (1542A) watersheds that use sewer lines are 9,813 and 714 (total households minus septic tank households obtained from 2007 FDOH onsite sewage GIS coverage), respectively. FDEP is aware that the FDOH onsite sewage GIS coverage does not include all septic tanks and when an area converts to sewer line the septic tank information is not removed. The discharge rate through
20

the sewer line from each household (Q) was calculated by multiplying the average household size by the per capita wastewater production rate per day (70 gallons). The commonly cited concentration (C) for domestic wastewater is 1x10⁶ counts/100mL for fecal coliform (EPA, 2001). Of the total number of households using the sewer line, 0.5 percent (F) was assumed as the sewer line leakage rate (Culver et al., 2002). Based on Equation 4.2, the estimated fecal coliform loading from sewer line leakage in the Trout Creek and Mill Creek watersheds are about 3.26 x 10¹¹ counts/day and 2.36 x 10¹⁰ counts/day, respectively.
21
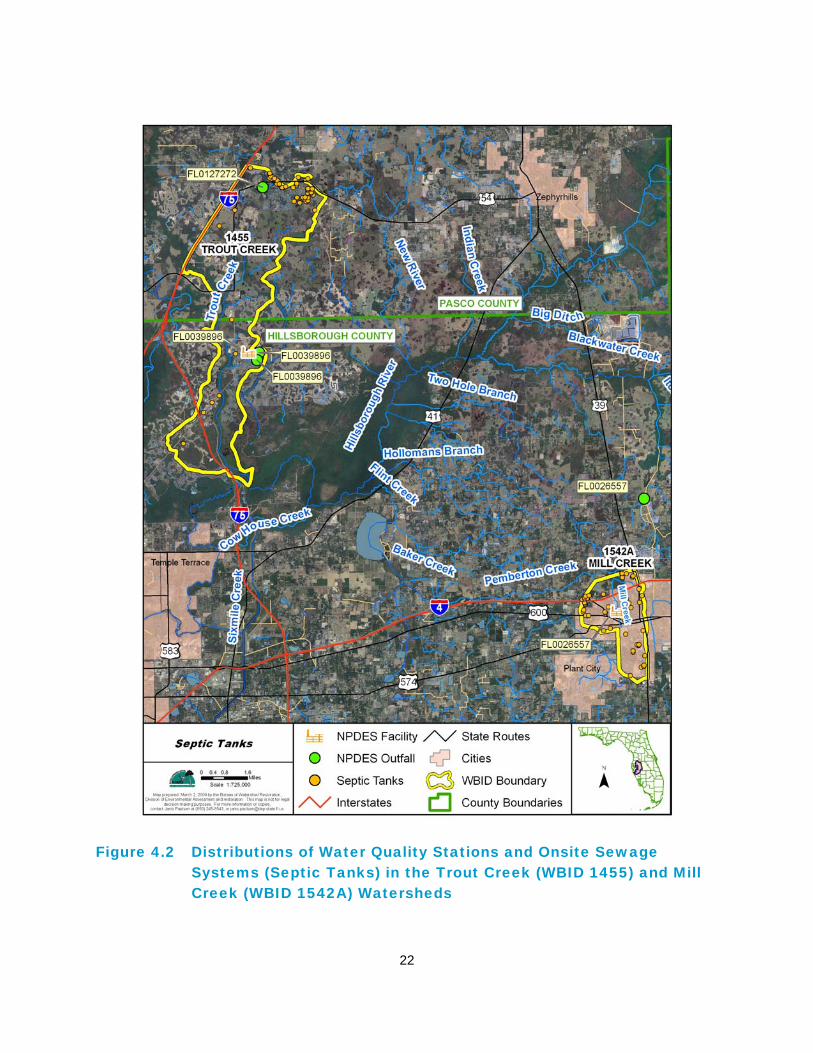
Figure 4.2 Distributions of Water Quality Stations and Onsite Sewage Systems (Septic Tanks) in the Trout Creek (WBID 1455) and Mill Creek (WBID 1542A) Watersheds
22

Chapter 5: DETERMINATION OF ASSIMILATIVE CAPACITY
5.1 Determination of Loading Capacity
This fecal coliform TMDL was developed using the “percent reduction” method. For this method, the percent reduction needed to meet the applicable criterion is calculated for each value above the criterion. Then a median percent reduction is calculated.
5.1.1 Data Used in the Determination of the TMDL
The data used to develop this TMDL were mainly provided by Hillsborough County (Trout Creek station: 21FLHILL 145; Mill Creek: 21FLHILL 149). Figure 5.1 displays the locations of the water quality stations from which fecal coliform data were collected for Trout Creek and Mill Creek. The fecal coliform data used in this analysis for the Trout Creek (WBID 1455) and Mill Creek (WBID 1542A) watersheds are located in Appendix B. For graphical representation of the data refer to Figure 2.1.
5.1.2 TMDL Development Process
As described in Section 5.1, the percent reduction needed to meet the fecal coliform criterion was determined for each individual exceedance using the following equation:
(2) [measured exceedance – criterion]*100 measured exceedance
The fecal coliform TMDL was calculated as the median of the percent reductions needed over the data range where exceedances occurred (see Appendix C for data). The median percent reduction for this data period (January 2001 – June 2008) was 53 percent for Trout Creek (WBID 1455) and a 66 percent for Mill Creek (WBID 1542A).
23
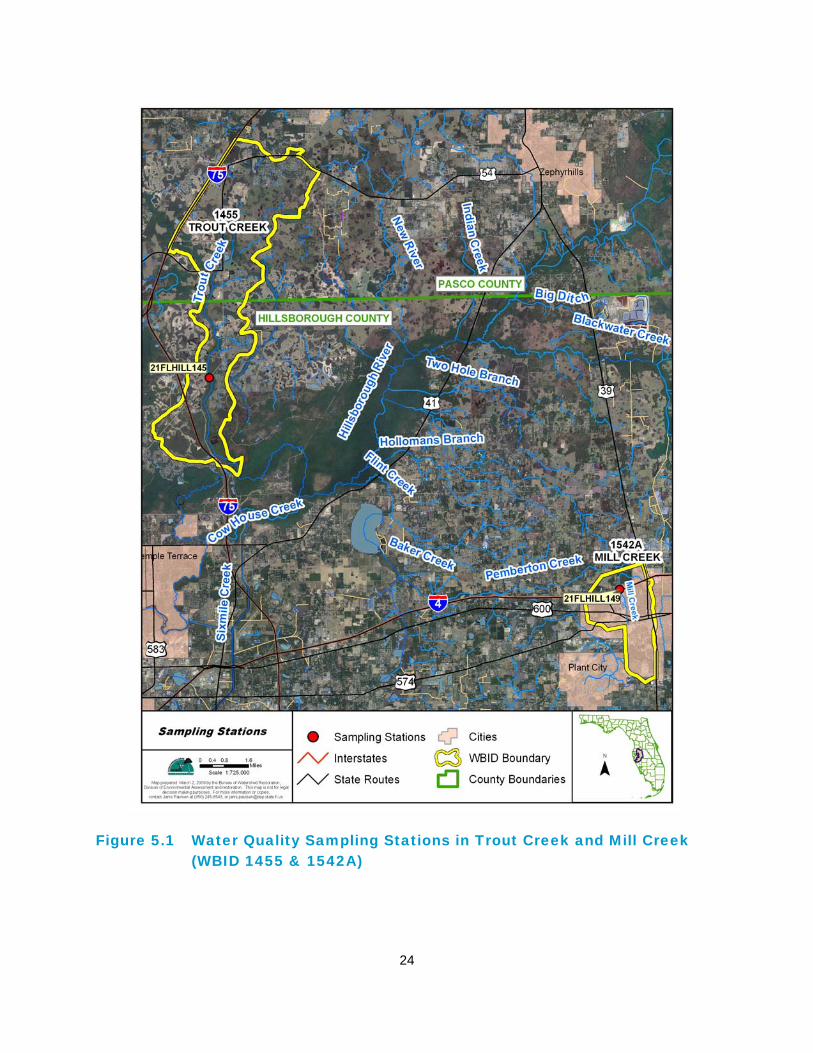
Figure 5.1 Water Quality Sampling Stations in Trout Creek and Mill Creek (WBID 1455 & 1542A)
24

Define the Critical Condition The critical condition for coliform loadings in a given watershed depends on many factors, including the presence of point sources and the land use pattern in the watershed. Typically, the critical condition for nonpoint sources is an extended dry period followed by a rainfall runoff event. During the wet weather period, rainfall washes off coliform bacteria that have built up on the land surface under dry conditions, resulting in the wet weather exceedances. However, significant nonpoint source contributions can also appear under dry conditions without any major surface runoff event. This usually happens when nonpoint sources contaminate the surficial aquifer, and fecal coliform bacteria are brought into the receiving waters through baseflow. In addition, livestock and wildlife having direct access to the receiving water can contribute to the exceedance during dry weather. The critical condition for point source loading typically occurs during periods of low stream flow, when dilution is minimized. Based on the dominant type of landuse (urban land and agriculture) in this watershed, it is likely that many of the exceedances are from nonpoint sources and MS4s entering the waters through surface runoff. This could indicate that fecal coliform builds up on the land during dry periods and washes off into local waters during rain events. 5.1.3 Temporal Patterns Measurements were sorted by month to determine whether there was a temporal pattern of exceedances. Monthly average rainfall data from Tampa WSCMO Airport (088788) for the Trout Creek watershed and monthly average rainfall data from Plant City, Florida (087205) for the Mill Creek watershed were obtained and included in the analysis. Due to incomplete exceedance values for each month a seasonal analysis could not be performed. Refer to Tables 5.1 and 5.2 for summary statistics by month for fecal coliform and rainfall measurements. Refer to Figures 5.2 and 5.3 for graphical representation.
Trout Creek (WBID 1455) As shown in Figure 5.2, exceedances of the fecal coliform criteria in the Trout Creek watershed occur across the entire span of the average monthly rainfall record and throughout all seasons implying potential fecal coliform bacteria sources during both baseflow and surface runoff events.
Mill Creek (WBID 1542A) As shown in Figure 5.3, exceedances of the fecal coliform criteria in the Mill Creek watershed occur primarily during the Summer months (June – September) implying potential fecal coliform bacteria sources during surface runoff events. During the wet weather period, rainfall washes off coliform bacteria that have built up on the land surface under dry conditions, resulting in the wet weather exceedances.
25
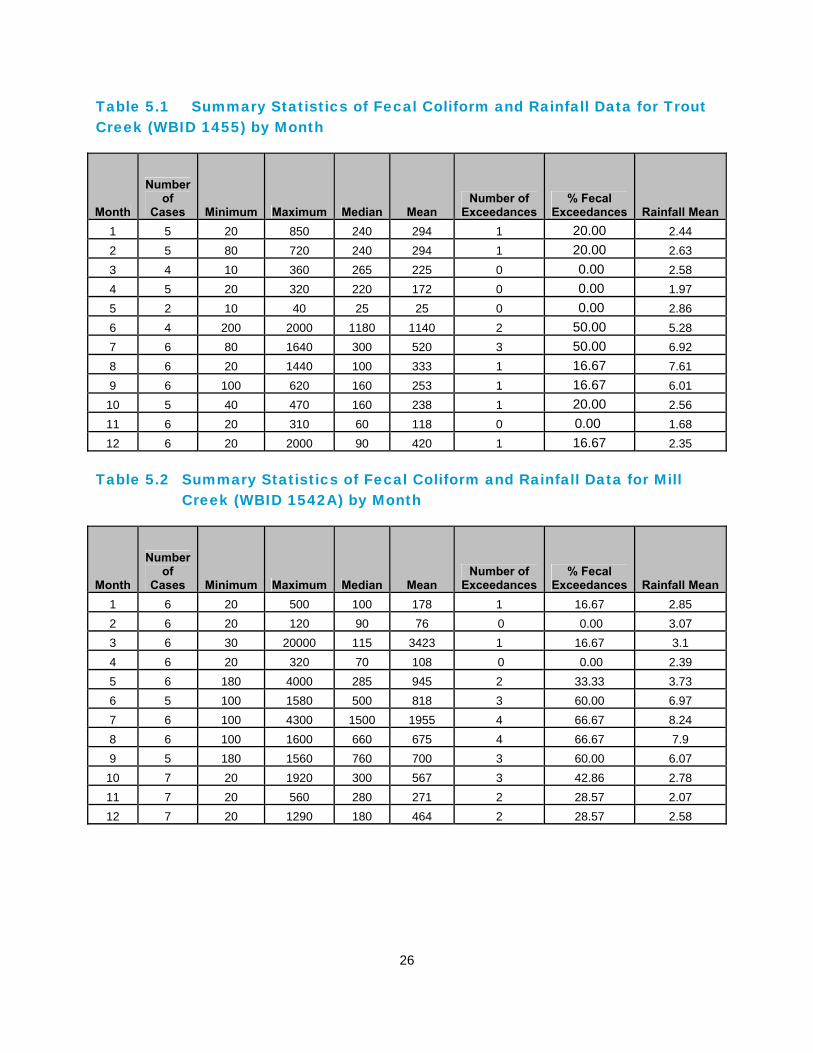
Table 5.1 Summary Statistics of Fecal Coliform and Rainfall Data for Trout Creek (WBID 1455) by Month
Number of
Cases Minimum Maximum Median Mean Number of
Exceedances% Fecal
Exceedances Rainfall MeanMonth 1 5 20 850 240 294 1 20.00 2.44 2 5 80 720 240 294 1 20.00 2.63 3 4 10 360 265 225 0 0.00 2.58 4 5 20 320 220 172 0 0.00 1.97 5 2 10 40 25 25 0 0.00 2.86 6 4 200 2000 1180 1140 2 50.00 5.28 7 6 80 1640 300 520 3 50.00 6.92 8 6 20 1440 100 333 1 16.67 7.61 9 6 100 620 160 253 1 16.67 6.01 10 5 40 470 160 238 1 20.00 2.56 11 6 20 310 60 118 0 0.00 1.68 12 6 20 2000 90 420 1 16.67 2.35
Table 5.2 Summary Statistics of Fecal Coliform and Rainfall Data for Mill
Creek (WBID 1542A) by Month
Number of
Cases Minimum Maximum Median Mean Number of
Exceedances% Fecal
Exceedances Rainfall MeanMonth 1 6 20 500 100 178 1 16.67 2.85 2 6 20 120 90 76 0 0.00 3.07 3 6 30 20000 115 3423 1 16.67 3.1 4 6 20 320 70 108 0 0.00 2.39 5 6 180 4000 285 945 2 33.33 3.73 6 5 100 1580 500 818 3 60.00 6.97 7 6 100 4300 1500 1955 4 66.67 8.24 8 6 100 1600 660 675 4 66.67 7.9 9 5 180 1560 760 700 3 60.00 6.07 10 7 20 1920 300 567 3 42.86 2.78 11 7 20 560 280 271 2 28.57 2.07 12 7 20 1290 180 464 2 28.57 2.58
26
Fecal Coliform % Exceedances and Average Monthly Rainfall
0.00
20.00
40.00
60.00
80.00
100.00
1 2 3 4 5 6 7 8 9 10 11 12
Month
% E
xcee
danc
es
012345678
Rain
fall
(in/m
onth
)
% Fecal Exceedances Rainfall Mean
Figure 5.2 Fecal Coliform Exceedances and Rainfall for Trout Creek (WBID 1455) by Month
Fecal Coliform % Exceedances and Average Monthly Rainfall
0.00
20.00
40.00
60.00
80.00
100.00
1 2 3 4 5 6 7 8 9 10 11 12
Month
% E
xcee
danc
es
0
2
4
6
8
10
Rain
fall
(in/m
onth
)
% Fecal Exceedances Rainfall Mean
Figure 5.3 Fecal Coliform Exceedances and Rainfall for Mill Creek (WBID 1542A) by Month
27

5.1.4 Spatial Patterns
Trout Creek (WBID 1455) Since, only one station exists within the Trout Creek watershed, no spatial pattern could be determined.
Mill Creek (WBID 1542A) Since, only one station exists within the Mill Creek watershed, no spatial pattern could be determined.
28
Chapter 6: DETERMINATION OF THE TMDL
6.1 Expression and Allocation of the TMDL
The objective of a TMDL is to provide a basis for allocating acceptable loads among all of the known pollutant sources in a watershed so that appropriate control measures can be implemented and water quality standards achieved. A TMDL is expressed as the sum of all point source loads (Waste Load Allocations, or WLAs), nonpoint source loads (Load Allocations, or LAs), and an appropriate margin of safety (MOS), which takes into account any uncertainty concerning the relationship between effluent limitations and water quality:
TMDL = ∑ WLAs + ∑ LAs + MOS
As discussed earlier, the WLA is broken out into separate subcategories for wastewater discharges and stormwater discharges regulated under the NPDES Program:
TMDL ≅ ∑ WLAswastewater + ∑ WLAsNPDES Stormwater + ∑ LAs + MOS
It should be noted that the various components of the revised TMDL equation may not sum up to the value of the TMDL because a) the WLA for NPDES stormwater is typically based on the percent reduction needed for nonpoint sources and is also accounted for within the LA, and b) TMDL components can be expressed in different terms (for example, the WLA for stormwater is typically expressed as a percent reduction, and the WLA for wastewater is typically expressed as mass per day). WLAs for stormwater discharges are typically expressed as “percent reduction” because it is very difficult to quantify the loads from MS4s (given the numerous discharge points) and to distinguish loads from MS4s from other nonpoint sources (given the nature of stormwater transport). The permitting of stormwater discharges also differs from the permitting of most wastewater point sources. Because stormwater discharges cannot be centrally collected, monitored, and treated, they are not subject to the same types of effluent limitations as wastewater facilities, and instead are required to meet a performance standard of providing treatment to the “maximum extent practical” through the implementation of BMPs. This approach is consistent with federal regulations (40 CFR § 130.2[I]), which state that TMDLs can be expressed in terms of mass per time (e.g., pounds per day), toxicity, or other appropriate measure. The TMDL for Trout Creek (WBID 1455) and Mill Creek (WBID 1542A) is expressed in terms of MPN/day and percent reduction, and represent the maximum daily fecal coliform loads the stream can assimilate and maintain the fecal coliform criterion (Table 6.1).
29

Table 6.1 TMDL Components for Fecal Coliform in the Trout Creek (WBID 1455) and Mill Creek (WBID 1542A) watersheds
30
WLA Parameter TMDL
(counts/day) Wastewater (counts/day)
NPDES Stormwater
(% reduction)
LA (%
reduction) MOS WBID
Fecal Coliform 400 /100 mL
*point sources must meet permit
limits
53 53 Implicit 1455
1542A Fecal Coliform 400 /100 mL N / A 66 66 Implicit N/A – Not applicable. * See section 4.2.1 Point Sources for permit specifications
6.2 Load Allocation
A fecal coliform reduction of 53 and 66 percent for Trout Creek and Mill Creek is needed from nonpoint sources, respectively. It should be noted that the LA includes loading from stormwater discharges regulated by the Department and the water management districts that are not part of the NPDES Stormwater Program (see Appendix A).
6.3 Wasteload Allocation
6.3.1 NPDES Wastewater Discharges
As mentioned previously, the NPDES wastewater facilities with the Domestic Wastewater Program located in the Trout Creek and Mill Creek watersheds currently have potential discharge sites. The state already requires all NPDES point source dischargers to meet bacteria criteria at the end of the pipe. It is the Department’s current practice not to allow mixing zones for bacteria. These requirements will also be applied to any possible future point sources that may discharge in the watershed to meet end-of-pipe standards for coliform bacteria.
6.3.2 NPDES Stormwater Discharges
A fecal coliform reduction of 53 and 66 percent for Trout Creek and Mill Creek are needed from several NPDES Municipal Separate Storm Sewer System (MS4) permits exist within the Trout Creek and Mill Creek watersheds, respectively. The stormwater collection systems in the Trout Creek watershed are maintained by Hillsborough County (#FLS 000006), Pasco County (#FLS 000032), and Tampa Bay Palms Community Development District (FLR04E070). The stormwater collection systems in the Mill Creek watershed are owned and operated by Hillsborough County (#FLS 000006) and City of Plant City (Hillsborough Co-permittee). It should be noted that any future MS4 permittee is only responsible for reducing the anthropogenic loads associated with stormwater outfalls that it owns or otherwise has responsible control over, and it is not responsible for reducing other nonpoint source loads in its jurisdiction.
6.4 Margin of Safety

Consistent with the recommendations of the Allocation Technical Advisory Committee (Department, February 2001), an implicit MOS was used in the development of this TMDL. An MOS was included in the TMDL by meeting the water quality criterion of 400 colonies/100mL, while the actual criterion allows for a 10 percent exceedance over that level.
31

Chapter 7: NEXT STEPS: IMPLEMENTATION PLAN DEVELOPMENT AND BEYOND
7.1 TMDL Implementation
Following the adoption of this TMDL by rule, the Department will determine the best course of action regarding its implementation. Depending upon the pollutant(s) causing the waterbody impairment and the significance of the waterbody, the Department will select the best course of action leading to the development of a plan to restore the waterbody. Often this will be accomplished cooperatively with stakeholders by creating a Basin Management Action Plan, referred to as the BMAP. Basin Management Action Plans are the primary mechanism through which TMDLs are implemented in Florida [see Subsection 403.067(7) F.S.]. A single BMAP may provide the conceptual plan for the restoration of one or many impaired waterbodies. If the Department determines a BMAP is needed to support the implementation of this TMDL, a BMAP will be developed through a transparent stakeholder-driven process intended to result in a plan that is cost-effective, technically feasible, and meets the restoration needs of the applicable waterbodies. Once adopted by order of the Department Secretary, BMAPs are enforceable through wastewater and municipal stormwater permits for point sources and through BMP implementation for nonpoint sources. Among other components, BMAPs typically include:
• Water quality goals (based directly on the TMDL);
• Refined source identification;
• Load reduction requirements for stakeholders (quantitative detailed allocations, if technically feasible);
• A description of the load reduction activities to be undertaken, including structural projects, nonstructural BMPs, and public education and outreach;
• A description of further research, data collection, or source identification needed in order to achieve the TMDL;
• Timetables for implementation;
• Implementation funding mechanisms;
• An evaluation of future increases in pollutant loading due to population growth;
• Implementation milestones, project tracking, water quality monitoring, and adaptive management procedures; and
• Stakeholder statements of commitment (typically a local government resolution).
BMAPs are updated through annual meetings and may be officially revised every five years. Completed BMAPs in the state have improved communication and cooperation among local stakeholders and state agencies, improved internal communication within local governments, applied high-quality science and local information in managing water resources, clarified
32

obligations of wastewater point source, MS4 and non-MS4 stakeholders in TMDL implementation, enhanced transparency in DEP decision-making, and built strong relationships between DEP and local stakeholders that have benefited other program areas. However, in some basins, and for some parameters, particularly those with fecal coliform impairments, the development of a BMAP using the process described above will not be the most efficient way to restore a waterbody, such that it meets its’ designated uses. Why? Because fecal coliform impairments result from the cumulative effects of a multitude of potential sources, both natural and anthropogenic. Addressing these problems requires good old fashioned detective work that is best done by those in the area. There are a multitude of assessment tools that are available to assist local governments and interested stakeholders in this detective work. The tools range from the simple – such as Walk the WBIDs and GIS mapping - to the complex such as Bacteria Source Tracking. Department staff will provide technical assistance, guidance, and oversight of local efforts to identify and minimize fecal coliform sources of pollution. Based on work in the Lower St Johns River tributaries and the Hillsborough River basin, the Department and local stakeholders have developed a logical process and tools to serve as a foundation for this detective work. In the near future, the Department will be releasing these tools to assist local stakeholders with the development of local implementation plans to address fecal coliform impairments. In such cases, the Department will rely on these local initiatives as a more cost-effective and simplified approach to identify the actions needed to put in place a roadmap for restoration activities, while still meeting the requirements of Chapter 403.067(7), F.S.
33
References
Alderiso, K., D. Wait, and M. Sobsey. 1996. Detection and characterization of make-specific RNA coliphages in a New York City Reservoir to distinguish between human and nonhuman sources of contamination. In: Proceedings of a Symposium on New York City Water Supply Studies, J.J. McDonnell et al. (eds.). TPS-96-2. Herndon, Virginia: American Water Resources Association.
Association of Metropolitan Sewerage Agencies. 1994. Separate sanitary sewer overflows: What do we currently know? Washington, D.C.
Bannerman, R., D. Owens, R. Dodds, and N. Hornewer. 1993. Sources of pollutants in Wisconsin stormwater. Water Science and Technology 28(3-5): 241-259.
Culver T.B. Y. Jia, R. Tikoo, J. Simsic, and R. Garwood. 2002. Development of the Total Maximum Daily Load (TMDL) for fecal coliform bacteria in Moore’s Creek, Albemarle County, Virginia. Virginia Department of Environmental Quality.
Florida Administrative Code. Rule 62-302, Surface water quality standards.
Florida Administrative Code. Rule 62-303, Identification of impaired surface waters.
Florida Department of Environmental Protection. February 2001. A report to the Governor and the Legislature on the allocation of Total Maximum Daily Loads in Florida. Tallahassee, Florida: Bureau of Watershed Management.
———. 2002. Basin Status Report: –Tampa Bay Tributarties. Tallahassee, Florida: Bureau of Watershed Management.
Florida Department of Health Website. 2008. Available: http://www.doh.state.fl.us/environment/OSTDS/statistics/ostdsstatistics.htm.
Florida Watershed Restoration Act. Chapter 99-223, Laws of Florida.
Hirsch, R.M. 1982. A comparison of four streamflow record extension techniques. Water Resources Research, 18: 1081-1088.
Lim, S., and V. Olivieri. 1982. Sources of microorganisms in urban runoff. Jones Falls Urban Runoff Project. Baltimore, Maryland: Johns Hopkins School of Public Health and Hygiene.
Minnesota Pollution Control Agency. 1999. Effect of septic systems on ground water quality. Ground Water and Assessment Program. Baxter, Minnesota.
Singhofen & Associates, Inc. 2001. Little Econlockhatchee River Basin stormwater management master plan, final report. Prepared for the Board of County Commissioners, Orange County, Florida.
34

Steuer, J., W. Selbig, N. Hornewer, and J. Prey. 1997. Sources of contamination in an urban basin in Marquette, Michigan and an analysis of concentrations, loads, and data quality. USGS Water Resources Investigation Report 97-4242. Middleton, Michigan.
Trial, W., et al. 1993. Bacterial source tracking: Studies in an urban Seattle watershed. Puget Sound Notes. 30: 1-3.
U.S. Census Bureau Web site. 2007. Available at http://www.census.gov/.
U.S. Department of Agriculture. 2002. Agricultural Census Report.
U.S. Environmental Protection Agency. January 2001. Protocol for developing pathogen TMDLs. 1st ed. Assessment and Watershed Protection Division. EPA 841-R-00-002.
———. 1994. Nonpoint source pollution: The nation's largest water quality problem. Pointer No. 1. EPA-841-F-94-005. Available: http://www.epa.gov/owow/nps/facts/point1.htm.
Van der Wel, B. 1995. Dog pollution. The Magazine of the Hydrological Society of South Australia, 2(1) 1.
Watson, T. June 6, 2002. Dog waste poses threat to water. USA Today.
Weiskel, P.K., B.L Howes, and G.R. Heufflder. 1996. Coliform contamination of a coastal embayment: Sources and transport pathway. Environmental Science and Technology 1872-1881.
35

Appendices
Appendix A: Background Information on Federal and State Stormwater Programs
In 1982, Florida became the first state in the country to implement statewide regulations to address the issue of nonpoint source pollution by requiring new development and redevelopment to treat stormwater before it is discharged. The Stormwater Rule, as authorized in Chapter 403, F.S., was established as a technology-based program that relies on the implementation of BMPs that are designed to achieve a specific level of treatment (i.e., performance standards) as set forth in Chapter 62-40, F.A.C.
The rule requires the state’s water management districts (WMDs) to establish stormwater pollutant load reduction goals (PLRGs) and adopt them as part of a SWIM plan, other watershed plan, or rule. Stormwater PLRGs are a major component of the load allocation part of a TMDL. To date, stormwater PLRGs have been established for Tampa Bay, Lake Thonotosassa, the Winter Haven Chain of Lakes, the Everglades, Lake Okeechobee, and Lake Apopka. No PLRG has been developed for Newnans Lake at the time this study was conducted.
In 1987, the U.S. Congress established Section 402(p) as part of the federal Clean Water Act Reauthorization. This section of the law amended the scope of the federal NPDES stormwater permitting program to designate certain stormwater discharges as “point sources” of pollution. These stormwater discharges include certain discharges that are associated with industrial activities designated by specific Standard Industrial Classification (SIC) codes, construction sites disturbing five or more acres of land, and master drainage systems of local governments with a population above 100,000, which are better known as municipal separate storm sewer systems (MS4s). However, because the master drainage systems of most local governments in Florida are interconnected, the EPA has implemented Phase 1 of the MS4 permitting program on a countywide basis, which brings in all cities (incorporated areas), Chapter 298 urban water control districts, and the Florida Department of Transportation throughout the fifteen counties meeting the population criteria.
An important difference between the federal and state stormwater permitting programs is that the federal program covers both new and existing discharges, while the state program focuses on new discharges. Additionally, Phase 2 of the NPDES Program will expand the need for these permits to construction sites between one and five acres, and to local governments with as few as 10,000 people. These revised rules require that these additional activities obtain permits by 2003. While these urban stormwater discharges are now technically referred to as “point sources” for the purpose of regulation, they are still diffuse sources of pollution that cannot be easily collected and treated by a central treatment facility similar to other point sources of pollution, such as domestic and industrial wastewater discharges. The Department recently accepted delegation from the EPA for the stormwater part of the NPDES Program. It should be noted that most MS4 permits issued in Florida include a re-opener clause that allows permit revisions to implement TMDLs once they are formally adopted by rule.
36

Appendix B: Fecal Coliform Data for Trout Creek (WBID 1455) and Mill Creek (WBID 1542A) during the Verification Period (January 2001 – June 2008)
Trout Creek (WBID 1455)
year
month day station result
7 24 21FLHILL145 / Trout Creek at SR581 east side of northbound span 100 2001
8 21 21FLHILL145 / Trout Creek at SR581 east side of northbound span 20 2001
9 18 21FLHILL145 / Trout Creek at SR581 east side of northbound span 100 2001
10 16 21FLHILL145 / Trout Creek at SR581 east side of northbound span 400 2001
11 13 21FLHILL145 / Trout Creek at SR581 east side of northbound span 20 2001
1 15 21FLHILL145 / Trout Creek at SR581 east side of northbound span 850 2002
2 19 21FLHILL145 / Trout Creek at SR581 east side of northbound span 720 2002
3 19 21FLHILL145 / Trout Creek at SR581 east side of northbound span 10 2002
4 16 21FLHILL145 / Trout Creek at SR581 east side of northbound span 320 2002
6 18 21FLHILL145 / Trout Creek at SR581 east side of northbound span 2000 2002
7 23 21FLHILL145 / Trout Creek at SR581 east side of northbound span 100 2002
8 20 21FLHILL145 / Trout Creek at SR581 east side of northbound span 100 2002
9 17 21FLHILL145 / Trout Creek at SR581 east side of northbound span 120 2002
10 15 21FLHILL145 / Trout Creek at SR581 east side of northbound span 470 2002
11 19 21FLHILL145 / Trout Creek at SR581 east side of northbound span 310 2002
12 10 21FLHILL145 / Trout Creek at SR581 east side of northbound span 2000 2002
1 14 21FLHILL145 / Trout Creek at SR581 east side of northbound span 240 2003
2 18 21FLHILL145 / Trout Creek at SR581 east side of northbound span 110 2003
3 18 21FLHILL145 / Trout Creek at SR581 east side of northbound span 230 2003
4 15 21FLHILL145 / Trout Creek at SR581 east side of northbound span 220 2003
5 20 21FLHILL145 / Trout Creek at SR581 east side of northbound span 40 2003
6 17 21FLHILL145 / Trout Creek at SR581 east side of northbound span 1960 2003
7 15 21FLHILL145 / Trout Creek at SR581 east side of northbound span 500 2003
2003 8 12 21FLHILL145 / Trout Creek at SR581 east side of northbound span 240
37
9 16 21FLHILL145 / Trout Creek at SR581 east side of northbound span 380 2003
10 7 21FLHILL145 / Trout Creek at SR581 east side of northbound span 120 2003
11 18 21FLHILL145 / Trout Creek at SR581 east side of northbound span 100 2003
12 9 21FLHILL145 / Trout Creek at SR581 east side of northbound span 80 2003
1 13 21FLHILL145 / Trout Creek at SR581 east side of northbound span 20 2004
2 17 21FLHILL145 / Trout Creek at SR581 east side of northbound span 80 2004
3 16 21FLHILL145 / Trout Creek at SR581 east side of northbound span 300 2004
4 20 21FLHILL145 / Trout Creek at SR581 east side of northbound span 80 2004
6 15 21FLHILL145 / Trout Creek at SR581 east side of northbound span 400 2004
7 20 21FLHILL145 / Trout Creek at SR581 east side of northbound span 700 2004
8 17 21FLHILL145 / Trout Creek at SR581 east side of northbound span 100 2004
9 14 21FLHILL145 / Trout Creek at SR581 east side of northbound span 100 2004
10 19 21FLHILL145 / Trout Creek at SR581 east side of northbound span 40 2004
11 16 21FLHILL145 / Trout Creek at SR581 east side of northbound span 240 2004
12 14 21FLHILL145 / Trout Creek at SR581 east side of northbound span 280 2004
1 18 21FLHILL145 / Trout Creek at SR581 east side of northbound span 60 2005
2 15 21FLHILL145 / Trout Creek at SR581 east side of northbound span 240 2005
3 15 21FLHILL145 / Trout Creek at SR581 east side of northbound span 360 2005
4 19 21FLHILL145 / Trout Creek at SR581 east side of northbound span 20 2005
5 17 21FLHILL145 / Trout Creek at SR581 east side of northbound span 10 2005
6 14 21FLHILL145 / Trout Creek at SR581 east side of northbound span 200 2005
7 19 21FLHILL145 / Trout Creek at SR581 east side of northbound span 80 2005
8 16 21FLHILL145 / Trout Creek at SR581 east side of northbound span 100 2005
9 20 21FLHILL145 / Trout Creek at SR581 east side of northbound span 200 2005
11 15 21FLHILL145 / Trout Creek at SR581 east side of northbound span 20 2005
12 20 21FLHILL145 / Trout Creek at SR581 east side of northbound span 40 2005
12 19 21FLHILL145 / Trout Creek at SR581 east side of northbound span 100 2006
1 16 21FLHILL145 / Trout Creek at SR581 east side of northbound span 300 2007
2 20 21FLHILL145 / Trout Creek at SR581 east side of northbound span 320 2007
4 17 21FLHILL145 / Trout Creek at SR581 east side of northbound span 220 2007
2007 7 24 21FLHILL145 / Trout Creek at SR581 east side of northbound span 1640
38
8 14 21FLHILL145 / Trout Creek at SR581 east side of northbound span 1440 2007
9 18 21FLHILL145 / Trout Creek at SR581 east side of northbound span 620 2007
10 16 21FLHILL145 / Trout Creek at SR581 east side of northbound span 160 2007
11 27 21FLHILL145 / Trout Creek at SR581 east side of northbound span 20 2007
12 11 21FLHILL145 / Trout Creek at SR581 east side of northbound span 20 2007
Mill Creek (WBID 1542A)
year
month day station result
1 16 21FLHILL149 / Mill Creek at north side of I-4 100 2001
2 20 21FLHILL149 / Mill Creek at north side of I-4 100 2001
3 20 21FLHILL149 / Mill Creek at north side of I-4 140 2001
4 17 21FLHILL149 / Mill Creek at north side of I-4 100 2001
5 15 21FLHILL149 / Mill Creek at north side of I-4 200 2001
6 19 21FLHILL149 / Mill Creek at north side of I-4 400 2001
7 24 21FLHILL149 / Mill Creek at north side of I-4 100 2001
8 21 21FLHILL149 / Mill Creek at north side of I-4 100 2001
9 18 21FLHILL149 / Mill Creek at north side of I-4 800 2001
10 16 21FLHILL149 / Mill Creek at north side of I-4 300 2001
11 13 21FLHILL149 / Mill Creek at north side of I-4 100 2001
12 11 21FLHILL149 / Mill Creek at north side of I-4 100 2001
1 15 21FLHILL149 / Mill Creek at north side of I-4 300 2002
2 19 21FLHILL149 / Mill Creek at north side of I-4 80 2002
3 19 21FLHILL149 / Mill Creek at north side of I-4 30 2002
4 16 21FLHILL149 / Mill Creek at north side of I-4 150 2002
5 14 21FLHILL149 / Mill Creek at north side of I-4 370 2002
6 18 21FLHILL149 / Mill Creek at north side of I-4 1510 2002
7 23 21FLHILL149 / Mill Creek at north side of I-4 330 2002
8 20 21FLHILL149 / Mill Creek at north side of I-4 110 2002
9 17 21FLHILL149 / Mill Creek at north side of I-4 180 2002
2002 39
10 15 21FLHILL149 / Mill Creek at north side of I-4 170
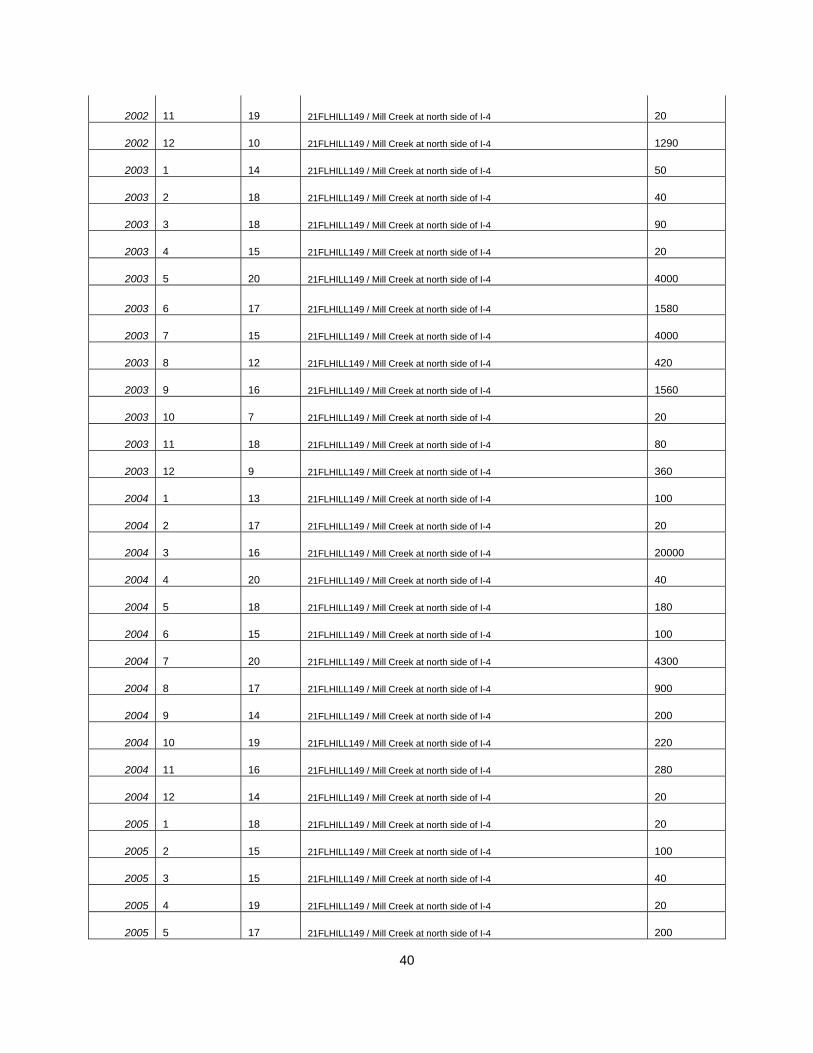
11 19 21FLHILL149 / Mill Creek at north side of I-4 20 2002
12 10 21FLHILL149 / Mill Creek at north side of I-4 1290 2002
1 14 21FLHILL149 / Mill Creek at north side of I-4 50 2003
2 18 21FLHILL149 / Mill Creek at north side of I-4 40 2003
3 18 21FLHILL149 / Mill Creek at north side of I-4 90 2003
4 15 21FLHILL149 / Mill Creek at north side of I-4 20 2003
5 20 21FLHILL149 / Mill Creek at north side of I-4 4000 2003
6 17 21FLHILL149 / Mill Creek at north side of I-4 1580 2003
7 15 21FLHILL149 / Mill Creek at north side of I-4 4000 2003
8 12 21FLHILL149 / Mill Creek at north side of I-4 420 2003
9 16 21FLHILL149 / Mill Creek at north side of I-4 1560 2003
10 7 21FLHILL149 / Mill Creek at north side of I-4 20 2003
11 18 21FLHILL149 / Mill Creek at north side of I-4 80 2003
12 9 21FLHILL149 / Mill Creek at north side of I-4 360 2003
1 13 21FLHILL149 / Mill Creek at north side of I-4 100 2004
2 17 21FLHILL149 / Mill Creek at north side of I-4 20 2004
3 16 21FLHILL149 / Mill Creek at north side of I-4 20000 2004
4 20 21FLHILL149 / Mill Creek at north side of I-4 40 2004
5 18 21FLHILL149 / Mill Creek at north side of I-4 180 2004
6 15 21FLHILL149 / Mill Creek at north side of I-4 100 2004
7 20 21FLHILL149 / Mill Creek at north side of I-4 4300 2004
8 17 21FLHILL149 / Mill Creek at north side of I-4 900 2004
9 14 21FLHILL149 / Mill Creek at north side of I-4 200 2004
10 19 21FLHILL149 / Mill Creek at north side of I-4 220 2004
11 16 21FLHILL149 / Mill Creek at north side of I-4 280 2004
12 14 21FLHILL149 / Mill Creek at north side of I-4 20 2004
1 18 21FLHILL149 / Mill Creek at north side of I-4 20 2005
2 15 21FLHILL149 / Mill Creek at north side of I-4 100 2005
3 15 21FLHILL149 / Mill Creek at north side of I-4 40 2005
4 19 21FLHILL149 / Mill Creek at north side of I-4 20 2005
2005 5 17 21FLHILL149 / Mill Creek at north side of I-4 200
40

7 19 21FLHILL149 / Mill Creek at north side of I-4 1480 2005
8 16 21FLHILL149 / Mill Creek at north side of I-4 920 2005
10 18 21FLHILL149 / Mill Creek at north side of I-4 1920 2005
11 15 21FLHILL149 / Mill Creek at north side of I-4 560 2005
12 20 21FLHILL149 / Mill Creek at north side of I-4 180 2005
10 17 21FLHILL149 / Mill Creek at north side of I-4 640 2006
11 14 21FLHILL149 / Mill Creek at north side of I-4 540 2006
12 19 21FLHILL149 / Mill Creek at north side of I-4 1160 2006
1 16 21FLHILL149 / Mill Creek at north side of I-4 500 2007
2 20 21FLHILL149 / Mill Creek at north side of I-4 120 2007
3 20 21FLHILL149 / Mill Creek at north side of I-4 240 2007
4 17 21FLHILL149 / Mill Creek at north side of I-4 320 2007
5 15 21FLHILL149 / Mill Creek at north side of I-4 720 2007
6 19 21FLHILL149 / Mill Creek at north side of I-4 500 2007
7 24 21FLHILL149 / Mill Creek at north side of I-4 1520 2007
8 14 21FLHILL149 / Mill Creek at north side of I-4 1600 2007
9 18 21FLHILL149 / Mill Creek at north side of I-4 760 2007
10 16 21FLHILL149 / Mill Creek at north side of I-4 700 2007
11 27 21FLHILL149 / Mill Creek at north side of I-4 320 2007
2007 12 11 21FLHILL149 / Mill Creek at north side of I-4 140
41
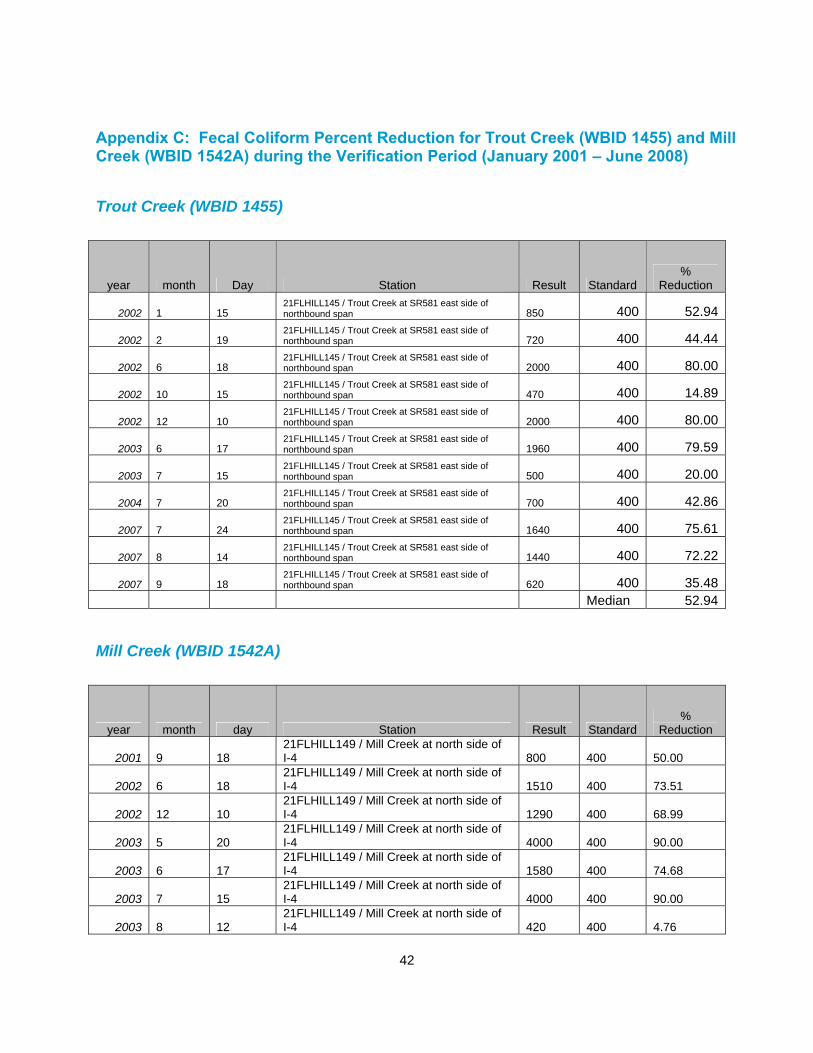
Appendix C: Fecal Coliform Percent Reduction for Trout Creek (WBID 1455) and Mill Creek (WBID 1542A) during the Verification Period (January 2001 – June 2008)
Trout Creek (WBID 1455)
month Day Station Result Standard %
Reduction year
1 15 21FLHILL145 / Trout Creek at SR581 east side of northbound span 850 400 52.942002
2 19 21FLHILL145 / Trout Creek at SR581 east side of northbound span 720 400 44.442002
6 18 21FLHILL145 / Trout Creek at SR581 east side of northbound span 2000 400 80.002002
10 15 21FLHILL145 / Trout Creek at SR581 east side of northbound span 470 400 14.892002
12 10 21FLHILL145 / Trout Creek at SR581 east side of northbound span 2000 400 80.002002
6 17 21FLHILL145 / Trout Creek at SR581 east side of northbound span 1960 400 79.592003
7 15 21FLHILL145 / Trout Creek at SR581 east side of northbound span 500 400 20.002003
7 20 21FLHILL145 / Trout Creek at SR581 east side of northbound span 700 400 42.862004
7 24 21FLHILL145 / Trout Creek at SR581 east side of northbound span 1640 400 75.612007
8 14 21FLHILL145 / Trout Creek at SR581 east side of northbound span 1440 400 72.222007
9 18 21FLHILL145 / Trout Creek at SR581 east side of northbound span 620 400 35.482007
Median 52.94
Mill Creek (WBID 1542A)
month day Station Result Standard %
Reduction year
9 18 21FLHILL149 / Mill Creek at north side of I-4 800 400 50.00 2001
6 18 21FLHILL149 / Mill Creek at north side of I-4 1510 400 73.51 2002
12 10 21FLHILL149 / Mill Creek at north side of I-4 1290 400 68.99 2002
5 20 21FLHILL149 / Mill Creek at north side of I-4 4000 400 90.00 2003
6 17 21FLHILL149 / Mill Creek at north side of I-4 1580 400 74.68 2003
7 15 21FLHILL149 / Mill Creek at north side of I-4 4000 400 90.00 2003
2003 8 12 21FLHILL149 / Mill Creek at north side of I-4 420 400 4.76
42

9 16 21FLHILL149 / Mill Creek at north side of I-4 1560 400 74.36 2003
3 16 21FLHILL149 / Mill Creek at north side of I-4 20000 400 98.00 2004
7 20 21FLHILL149 / Mill Creek at north side of I-4 4300 400 90.70 2004
8 17 21FLHILL149 / Mill Creek at north side of I-4 900 400 55.56 2004
7 19 21FLHILL149 / Mill Creek at north side of I-4 1480 400 72.97 2005
8 16 21FLHILL149 / Mill Creek at north side of I-4 920 400 56.52 2005
10 18 21FLHILL149 / Mill Creek at north side of I-4 1920 400 79.17 2005
11 15 21FLHILL149 / Mill Creek at north side of I-4 560 400 28.57 2005
10 17 21FLHILL149 / Mill Creek at north side of I-4 640 400 37.50 2006
11 14 21FLHILL149 / Mill Creek at north side of I-4 540 400 25.93 2006
12 19 21FLHILL149 / Mill Creek at north side of I-4 1160 400 65.52 2006
1 16 21FLHILL149 / Mill Creek at north side of I-4 500 400 20.00 2007
5 15 21FLHILL149 / Mill Creek at north side of I-4 720 400 44.44 2007
6 19 21FLHILL149 / Mill Creek at north side of I-4 500 400 20.00 2007
7 24 21FLHILL149 / Mill Creek at north side of I-4 1520 400 73.68 2007
8 14 21FLHILL149 / Mill Creek at north side of I-4 1600 400 75.00 2007
9 18 21FLHILL149 / Mill Creek at north side of I-4 760 400 47.37 2007
10 16 21FLHILL149 / Mill Creek at north side of I-4 700 400 42.86 2007
Median 65.52
43