proposed energy star tier i requirements · • for the next two decades, electricity consumption...
TRANSCRIPT

Preliminary Draft Review: Proposed Tier I Requirements
Craig Hershberg, US EPA
1

History of Computer Specification
Version 1.0 Effective June 92 Expired Sept 95
• A desktop in sleep mode must use ≤ 30 W; Integrated systems must use ≤ 60 W • Specified that a computer must go to “sleep” after a period of time or through user enabling
• A desktop in sleep mode must use ≤ 30 W; Integrated systems must use ≤ 60 W Version 2.0 • The computer must be shipped with power management functions that send the computer into
Effective Oct 95 sleep mode after 15 to 30 minutes Expired June 99 • Manufacturers must incorporate wording to educate consumers about sleep mode
• Computer must be able to send ENERGY STAR monitor into sleep mode
Version 3.0 Tier 1 Effective July 99 Expired July 00
• A desktop with a power supply rating ≤ 200 W must use ≤ 30 W in sleep mode; power supply rating > 200 W must use no more than 15% of the power supply rated value in sleep mode; Integrated computer systems must use < 45 W in sleep mode • Computers must have the ability to sleep when connected to a network • Computers must be able to “wake” when prompted by the network
2
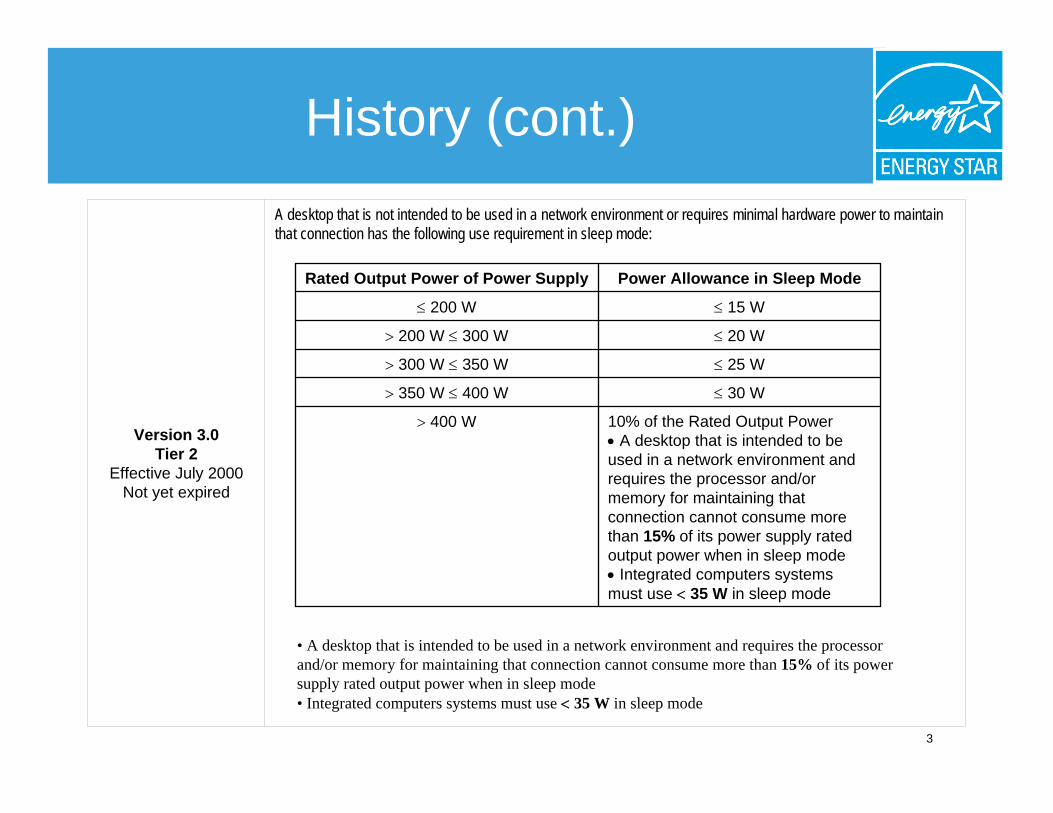
History (cont.) A desktop that is not intended to be used in a network environment or requires minimal hardware power to maintain that connection has the following use requirement in sleep mode:
Rated Output Power of Power Supply Power Allowance in Sleep Mode
≤ 200 W ≤ 15 W
> 200 W ≤ 300 W ≤ 20 W
> 300 W ≤ 350 W ≤ 25 W
> 350 W ≤ 400 W ≤ 30 W
Version 3.0 Tier 2
> 400 W 10% of the Rated Output Power • A desktop that is intended to be used in a network environment and
Effective July 2000 Not yet expired
requires the processor and/or memory for maintaining that connection cannot consume more than 15% of its power supply rated output power when in sleep mode • Integrated computers systems must use < 35 W in sleep mode
• A desktop that is intended to be used in a network environment and requires the processor and/or memory for maintaining that connection cannot consume more than 15% of its power supply rated output power when in sleep mode • Integrated computers systems must use < 35 W in sleep mode
3

Paradigm Shift for ENERGY STAR Computers
Old Approach New Approach
Modes addressed Sleep mode only All modes
Certainty of savings Depends on enabling Most savings automatic rates & user behavior (hardware-driven)
Promotion & Label only Label + utility incentives & differentiation marketing + preferential opportunities available gov & corp procurement Products covered Desktops, workstations, + Desktop-derived
laptops servers, thin clients, media PCs?
4

Why Revise the Specification?
• Current specification only considers sleep mode, does not address “active mode”
• Largest opportunities for energy savings are when computers are turned on, which occursduring peak demand times
• Current label has about 98% market penetration, offering little differentiation for innovative, energyefficient models
• Address low enabling rates
5

P e rc e n ta g e o f C o mp u te rs F o u n d
n =
Good Work Already Underway: Sleep and Standby Modes
Percentage of Computers Found in Each Mode • Sleep enabling rates lower than During LBNL Night Audits expected.
• Need technology improvements that automatically save energy in all100% modes, rather than only relying onusers to enable low power modes.
75% • Sleep and standby power levels are On already low in many Energy Star
50% Sleep specs. Further reductions can have
36%
60%
98%4% Standby diminishing returns. (i.e. 0.5 w to 0.3
25% w for ext. power supplies = 1 kwh/yrsavings).
0% 2% • People who buy labeled products Desktops Servers expect them to use less energy
n = 1453 n = 89 when in use and overall, not justwhen they are not operating.
6

Limited Additional Savings Potential: Sleep Mode
7

Growing Interest by Government and Corporate Procurement Officers
• Most have already specified ENERGY STAR levels forsleep mode and FEMP levels for standby – opportunity to save more with active
• Most already required to minimize lifecycle cost but nomeans for doing so until active data became available
• Availability of utility incentives can offset much of the incremental costs they would face in many facilities
• Power factor is a growing problem – Social Security Administration already imposed a 15% THD max for itscomputer purchases due to power quality problemsexperienced at its facilities
8

Importance of Reducing Desktop and Server Power Consumption
• IT equipment consumes $8 billion of electricity every year (100billion kWh)*
• For the next two decades, electricity consumption for office equipment (3.2% annually) will grow over twice as fast as electricityas a whole (1.4% annually)* – The most rapid increase in energy demand is predicted for electricity used in
computers – DOE 2004 Annual Energy Outlook with Projections to 2025 • Computers are a growing chunk of the opportunities left for saving
energy • Reducing power saves money, reduces heat and noise, and
improves reliability • It’s cheaper and better for the environment to save energy in
computers than generate it in power plants
*Source: IT Professional “IT and the $8 Billion Electric Bill”, November/December 2004 9

Potential Savings of Proposed Preliminary Draft Levels
Total 3 year Total 3 year Total 3 year Cumulative Cumulative National Equivalent Number
Cumulative National National Carbon Value of Electricity of American Energy Savings Dioxide Savings Saved per year Households Powered (millions kWh) (million tons CO2) (millions of dollars) for One Year
5098 3.4 372.1 498,844
10

Elements of the Preliminary Draft Specification
• Section 1: Definitions
• Section 2: Performance Specification and Test Procedure
• Section 3: Additional Requirements • Section 4: Effective Date • Section 5: Programmatic Changes from MOU to PA • Section 6: Tier II/Phase II
– Fixing the network problem – System energy efficiency
11

Product Categories/Definitions
• Product categories covered:– Desktops – Notebooks – Integrated Computers – Workstations – Desktop Derived Servers
• Operational Modes: Active, Idle, Sleep, Standby
12
Definitions/Categories
• Classify hardware and software distinctions between desktops, workstations, and servers – needed since workstations and servers are allowed higher power limits – Definition needed for workstation
• New category/definitions needed for:– Entertainment and/or Media PCs?– Thin clients and/or X terminals?
• Consider splitting servers and workstations into 1processor and 2- processor subcategories with different power limits
• Change “standby” mode to “off” mode?13
Definitions (cont.)
• Server definition– A computer that primarily provides services to other devices
on the network rather than to an individual interactive user. For purposes of this specification, this includes the following desktop derived, non-redundant type servers: EPS12V andthe EPS1U. Both are derived largely from desktop computerdesigns, but have slightly different form factors and may oftenhave multiple processors, different operating systems, andlarger data storage capabilities.
• Idle Mode definition– A subset of active mode, this is the mode in which the
operating system and other software have completedloading, the machine is not asleep and no activity, includingperipheral or network, requiring CPU processing time isoccurring.
14

Questions/Discussion
• Are these terms adequately defined?
• Are there any additional definitions and/or product types that should be included?
• Others?
15

Standby Levels
Proposed Performance Requirements
• Desktops & workstations: < 2 W • Notebooks: < 0.5 W • Integrated Computers < 3 W
• Follows FEMP standby recommendations
• Test Method: IEC 62301 (www.iec.ch)
16
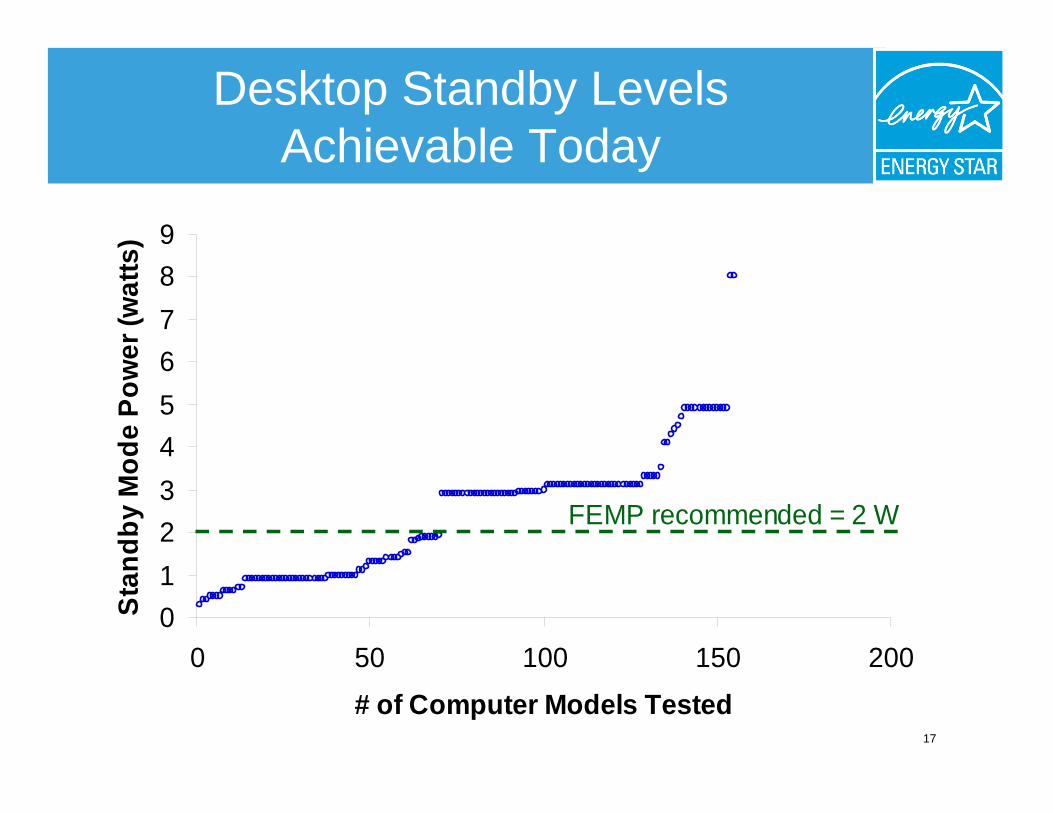
Desktop Standby Levels Achievable Today
Stan
dby
Mod
e Po
wer
(wat
ts) 9
8 7 6 5 4 3 2 1 0
FEMP recommended = 2 W
0 50 100 150 200
# of Computer Models Tested 17

Questions/Discussion
• Are these levels reasonable/achievable?
• Others?
18

Sleep Mode Levels
Proposed Performance Requirements
• Desktops, notebooks, workstations: < 5 W
• Integrated computers: < 7 W – Represents: 5 W desktop + Tier II ENERGY STAR
Monitor sleep level of 2 W
• Test Method: Existing ENERGY STAR (Version 3.0) computer test procedure
19

20
Sleep Mode Levels Achievable Today
Desktops:
Laptops: 42% meet Tier I levels
Source:
47% meet Tier I levels
ENERGY STAR Web site

21
Desktops: Sleep Levels Today
0
20
40
60
80
0 100 200 300 400 500 600
Power Supply Rated Power (watts)
Slee
p M
ode
Pow
er (w
atts
)
Desktops sold in 1999 and 2000
Desktops sold in 2001 and 2002
Desktops sold in 2003 and 2004
Proposed ENERGY STAR Sleep ModeLevel: 5 W
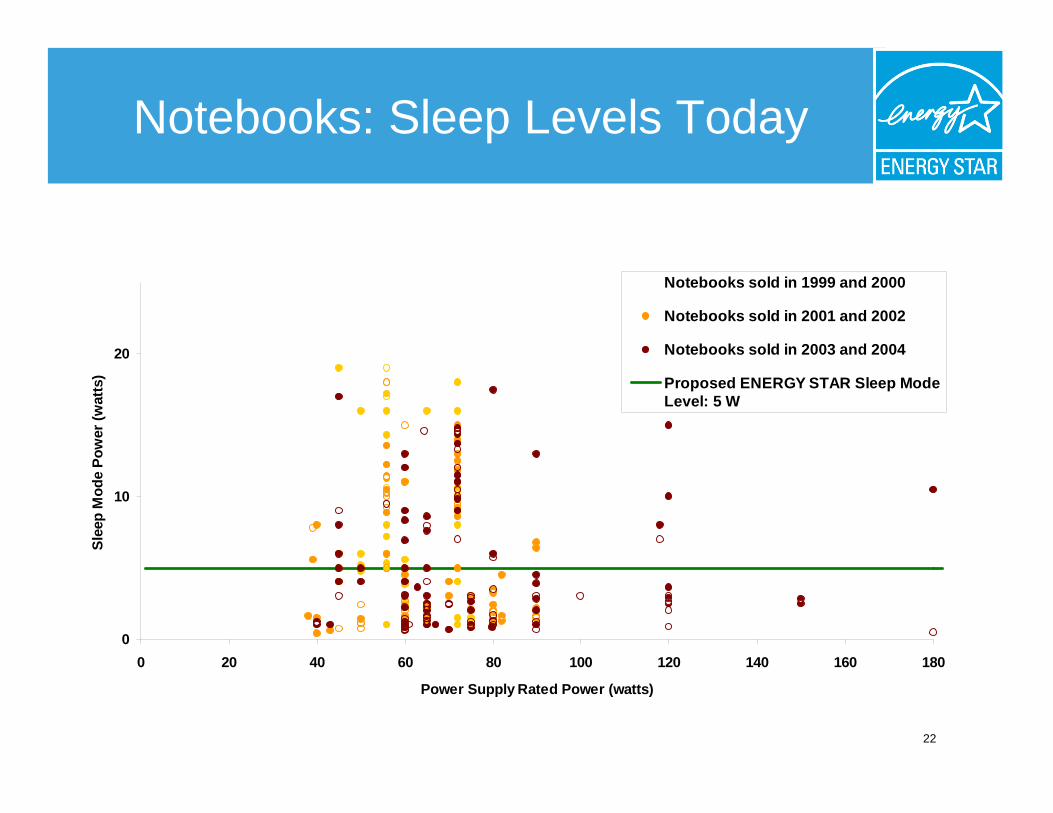
Notebooks: Sleep Levels Today Sl
eep
Mod
e Po
wer
(wat
ts)
Notebooks sold in 1999 and 2000
20
10
0
Notebooks sold in 2001 and 2002
Notebooks sold in 2003 and 2004
Proposed ENERGY STAR Sleep Mode Level: 5 W
0 20 40 60 80 100 120 140 160 180
Power Supply Rated Power (watts)
22

Sleep Mode Default
• Existing Requirement– Partner shall set the computer’s default to activate the
monitor’s sleep mode within 30 minutes of user inactivity.
• Proposed New Requirement – Default must be within 15 minutes of user inactivity
23
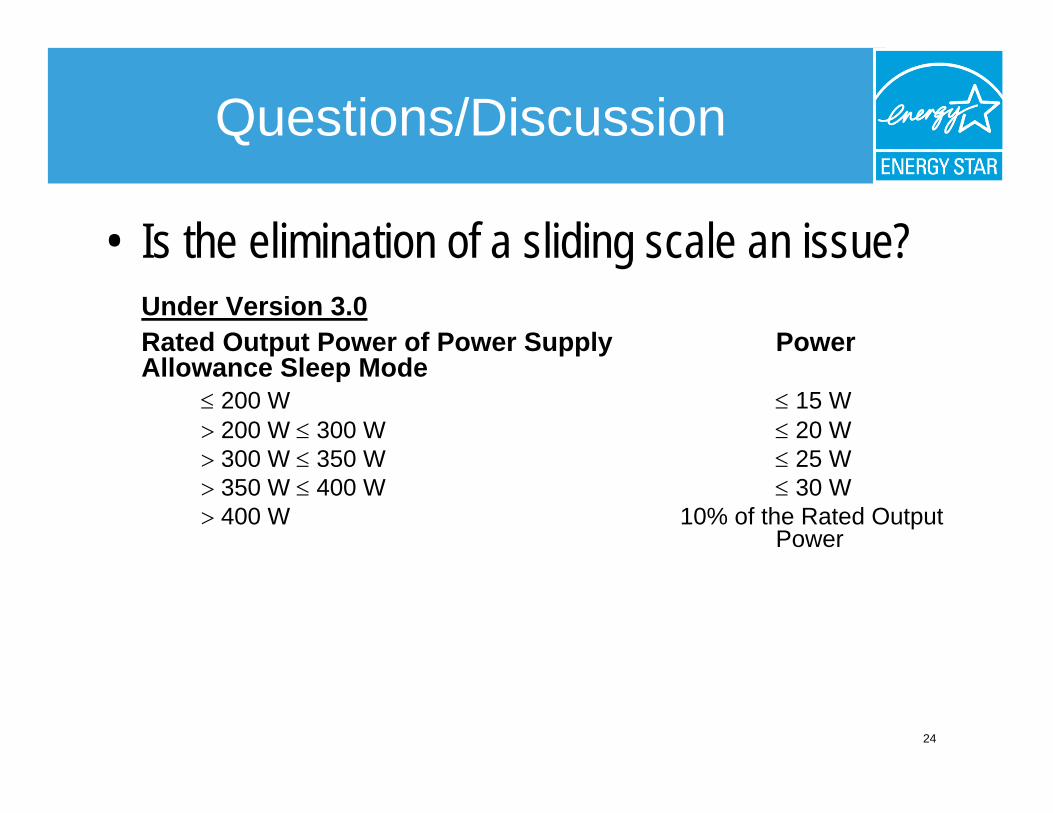
Questions/Discussion
• Is the elimination of a sliding scale an issue?Under Version 3.0 Rated Output Power of Power Supply Power Allowance Sleep Mode
≤ 200 W ≤ 15 W > 200 W ≤ 300 W ≤ 20 W > 300 W ≤ 350 W ≤ 25 W > 350 W ≤ 400 W ≤ 30 W > 400 W 10% of the Rated Output
Power
24

25
0
20
40
60
80
100
0 100 200 300 400 500 600 700
Power Supply Rated Power (watts)
Slee
p M
ode
Pow
er (w
atts
)
Desktop ComputersNotebook Computers
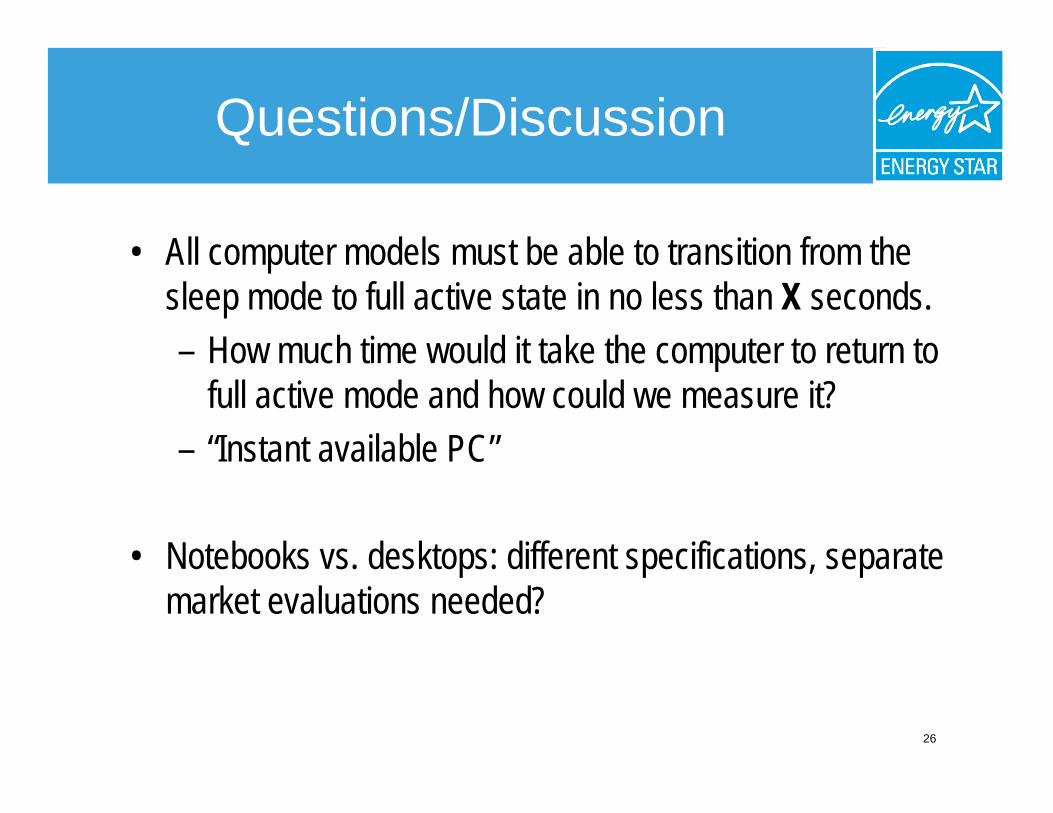
Questions/Discussion
• All computer models must be able to transition from the sleep mode to full active state in no less than X seconds. – How much time would it take the computer to return to
full active mode and how could we measure it? – “Instant available PC”
• Notebooks vs. desktops: different specifications, separate market evaluations needed?
26

Active Mode
• Comprises over 90% of annual energy use in typical residential and commercial desktops
• Active Mode requirements presented in two parts: – Idle State Requirements –Power Supply Requirements: External and Internal
27

Idle State Levels
Proposed Performance Requirements• Desktops: < 50 to 60 W • Notebooks: < 15 W • Integrated Computers: < 52 to 62 W
– Represents desktop idle level + 2 W monitor ENERGY STAR requirement
• Desktop Derived Servers/Workstations: < 90 to 100
• Test Method: TBD • More research needed
28

29
Idle State (cont.)
Screen shots illustrate Windows 2000 reporting of various operating parameters: System Idle Processes (3 hours and 2 minutes out of 3 hours and 6 minutes total) and CPU Utilization (2% in idle)
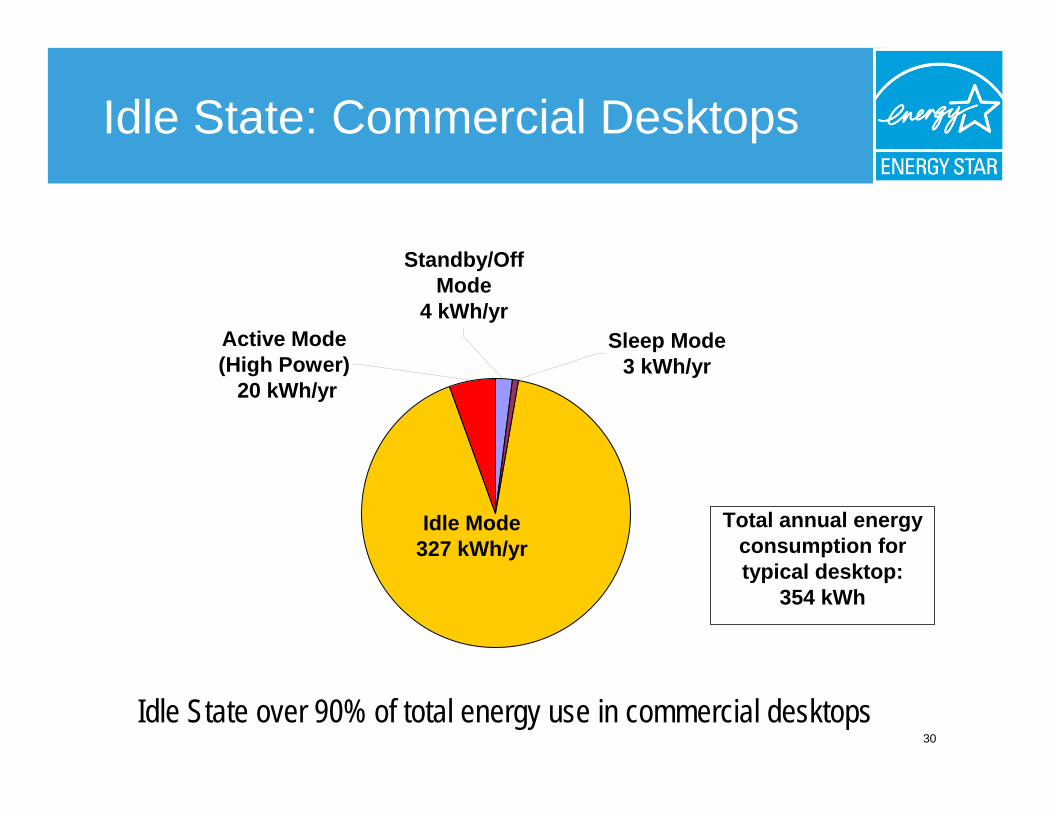
Idle State: Commercial Desktops
Standby/Off Mode
4 kWh/yr
)Sleep Mode
Total annual energy consumption for
354 kWh
Active Mode (High Power
20 kWh/yr
Idle Mode 327 kWh/yr
3 kWh/yr
typical desktop:
Idle State over 90% of total energy use in commercial desktops30

Idle State: Residential Desktops
Standby/Off Mode
64 kWh/yr
Idle Mode
Active Mode (High Power)
205 kWh/yr
15 kWh/yr Sleep Mode 1 kWh/yr
Total annual energy consumption for
typical residential desktop: 285 kWh
Idle State over 70% of total energy use in residential desktops31

Idle Power Levels Achievable Today
Individual PC Models 32
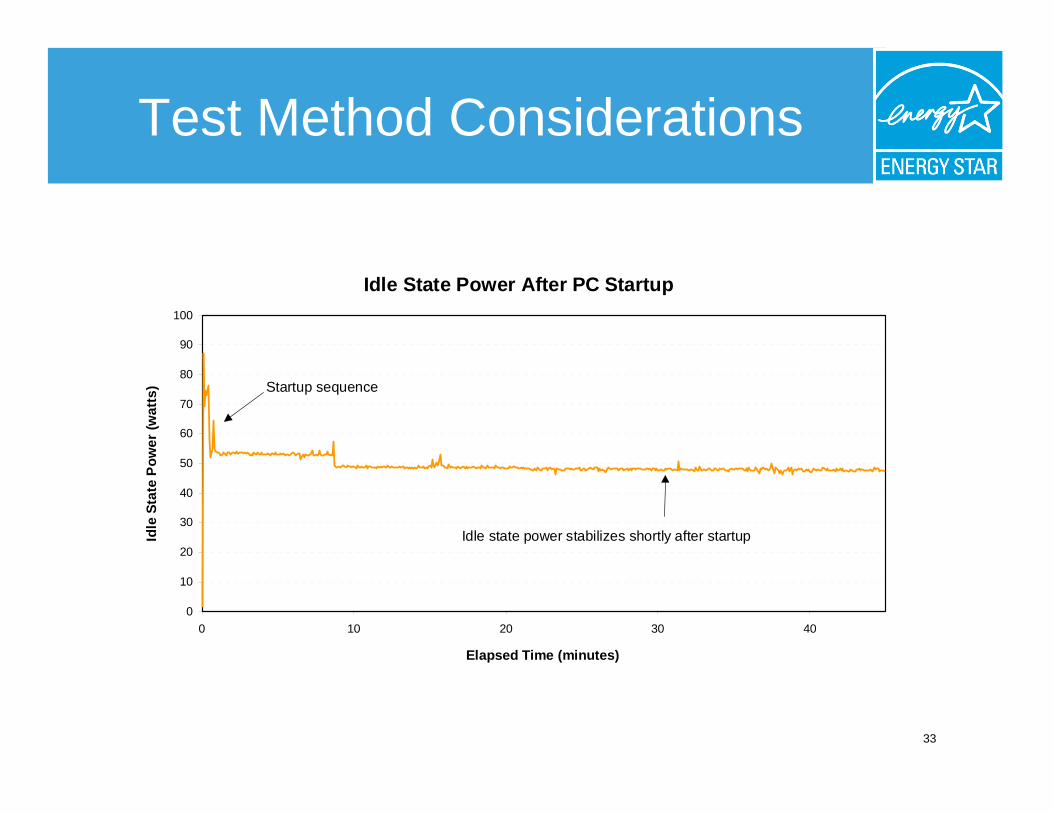
Test Method Considerations
Idle State Power After PC Startup
100
90
80
70
60
50
40
30
20
10
0
()
l lIdle
Sta
te P
ower
wat
ts
Startup sequence
Id e state power stabilizes short y after startup
0 10 20 30 40
Elapsed Time (minutes)
33
Key Strategies for Reducing Idle Power
• Improve power supply efficiency
• Size power supply properly
• Use more efficient processor and enabling software
• Use more efficient memory
• Improve cooling technology
34

Questions
• Are the proposed levels for idle state achievable?
• Preliminary thoughts regarding a method to test and measure idle power?
35

External Power Supply (EPS)
Proposed Performance Requirement• Notebooks and other Computers with an External
Power Supply must meet ENERGY STAR External Single Voltage Ac-Ac and Ac-Dc Power Supply specification
36
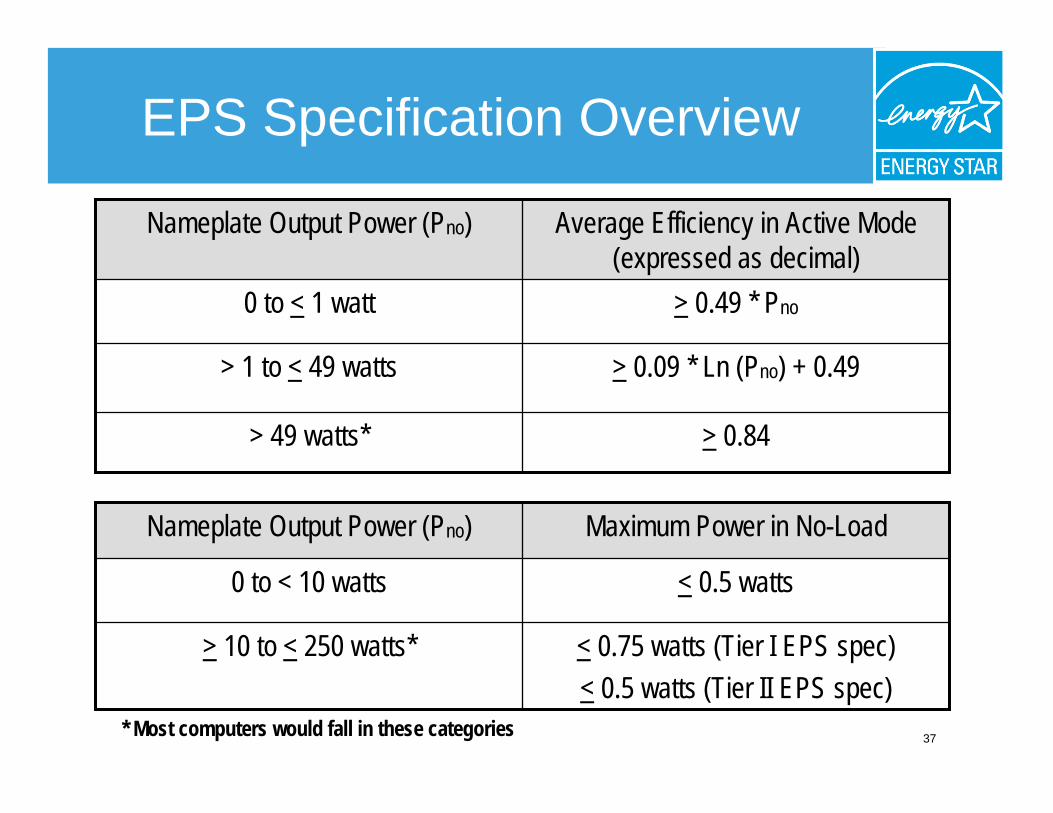
EPS Specification Overview
Nameplate Output Power (Pno) Average Efficiency in Active Mode (expressed as decimal)
0 to < 1 watt > 0.49 * Pno
> 1 to < 49 watts > 0.09 * Ln (Pno) + 0.49
> 49 watts* > 0.84
Nameplate Output Power (Pno) Maximum Power in No-Load
0 to < 10 watts < 0.5 watts
> 10 to < 250 watts* < 0.75 watts (Tier I EPS spec) < 0.5 watts (Tier II EPS spec)
* Most computers would fall in these categories 37

EPS: Calculating Active Power
• Calculate the model’s single average Active Modeefficiency value by testing at 100%, 75%, 50%, and 25% of rated current output and then use the averageof these four values.
• Based on the model’s nameplate output power, select the appropriate equation from the appropriate table andcalculate the minimum average efficiency.
• Compare the model’s actual average efficiency to the minimum average efficiency required by ENERGYSTAR. If actual average efficiency is greater than orequal to the minimum average efficiency, the model hassatisfied ENERGY STAR’s Active Mode requirement.
• Web site: www.energystar.gov/powersupplies38

Internal Power Supply (IPS)
Proposed Performance Requirements
% Load 20% Load 50% Load 100% Load
Desktops, Workstations, Integrated Computers
80% 80% 80%
• Adapted from Intel’s internal computer power supply design guide recommendations (www.formfactors.org)
• Test Method: Draft test procedure available at www.efficientpowersupplies.org
39
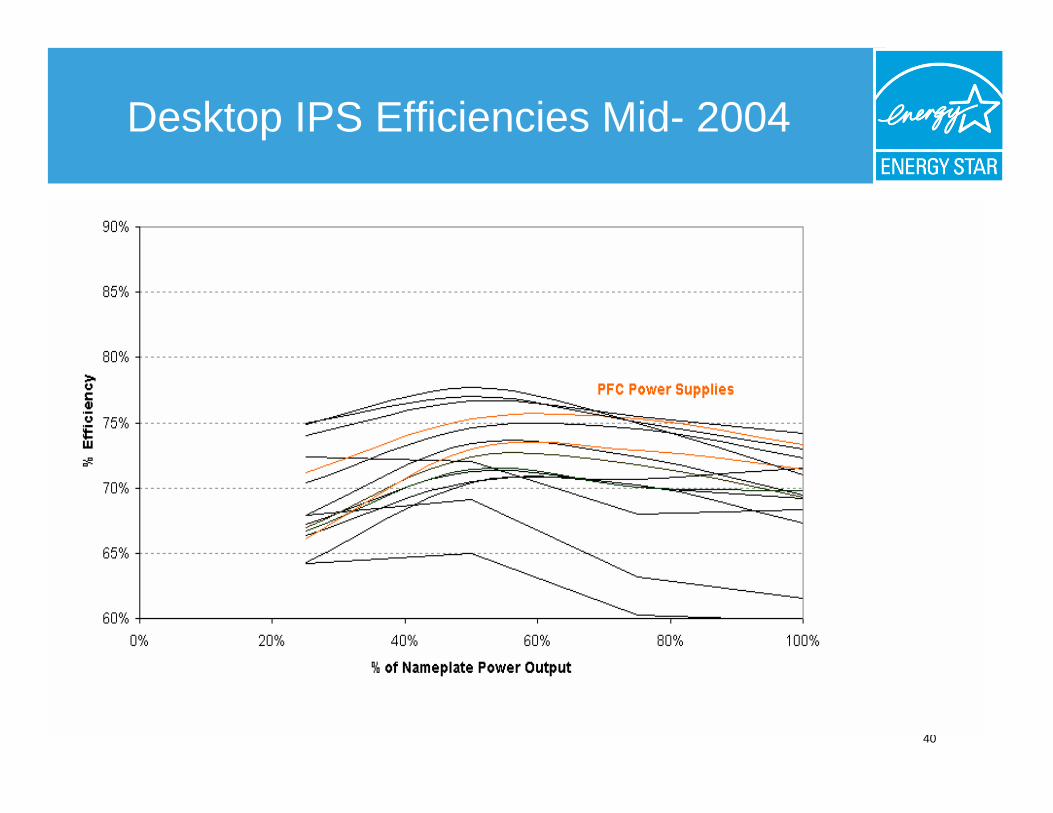
Desktop IPS Efficiencies Mid- 2004
40

Desktop IPS Efficiencies Today
41

Power Supply Efficiency Helps Achieve Idle Mode Savings
Note: power measured while 2.66 Ghz Pentium 4 Media PC was running PCMark 2004 benchmarking software. No changes made to processor, memory, video card, or fans to reduce idle state power use. 42

IPS Requirements (cont.)
Proposed Performance Requirements• Desktop Derived Servers
% Load 20% Load 50% Load 100% Load EPS12V 75% 80% 77%
% Load 20% Load 50% Load 100% Load EPS1U 78% 83% 80%
• Harmonized with proposed Server System Infrastructure (SSI) recommended levels • Test Method: Draft test procedure available at www.efficientpowersupplies.org
43

44
EPS12V IPS Efficiency Levels Achievable Today

45
EPS1U IPS Efficiency Levels Achievable Today

Questions
• Are these proposed levels achievable?
• Others?
46
Addressing Power Supply Oversizing
• Most desktops today sold with significantly oversized power supplies – Commonly sold with 300 to 450 W power supplies,
sometimes 600 W • Larger power supplies more likely to run at
lower, less efficient loads most of the time –Efficiency tends to increase with load –Example: Desktop requiring 40 W in idle:
• 200 W IPS – 20% of total load (80% eff)• 500 W IPS – 8% of total load (50% eff)
47

Power Supply Sizing
48
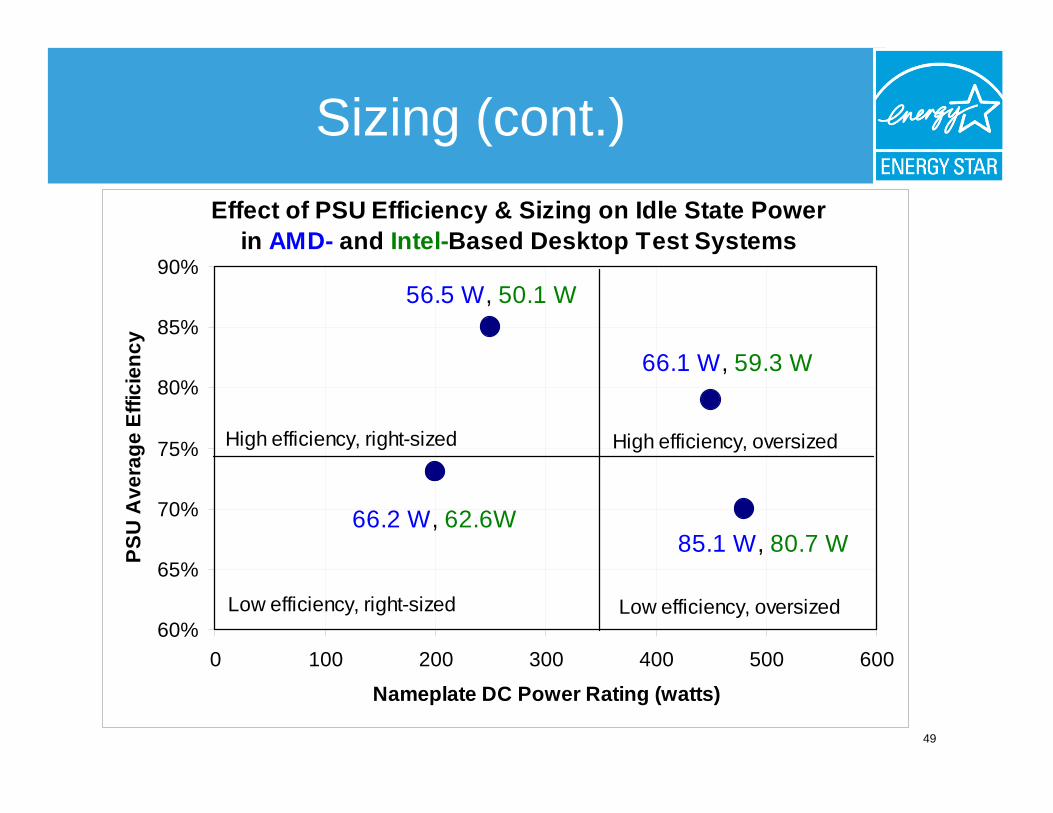
Sizing (cont.) Effect of PSU Efficiency & Sizing on Idle State Power
PSU
Ave
rage
Effi
cien
cy
in AMD- and Intel-Based Desktop Test Systems 90%
85%
80%
75%
70%
65%
60% 0 100 200 300 400 500 600
56.5 W, 50.1 W
66.1 W, 59.3 W
High efficiency, right-sized High efficiency, oversized
66.2 W, 62.6W 85.1 W, 80.7 W
Low efficiency, right-sized Low efficiency, oversized
Nameplate DC Power Rating (watts)
49

Additional Tier I Requirements
50
User Interface Recommendations
• Proposed Requirement:– Although not mandatory, manufacturers are strongly
recommended to design products in accordance with the Power Control User Interface Standard — IEEE 1621
• IEEE 1621 covers terms, symbols, colors
• Requirement already in ENERGY STAR Monitor (Version 4.0) and Draft Imaging specification
• Benefits: Consistent and clear user interface should increase enabling rates, energy savings, and user satisfaction with power management.
51

Key Elements of IEEE 1621
• 3 Basic Power States: On, Sleep, Off …
• … with standard colors: Green, Amber, Off• Key symbols: Power; Sleep • Sleep Metaphor (“wake up”) • “Hibernate” a form of Off
Comments on merit of interface consistency — not on content of standard
52

Tier I Effective Date
• Date in which manufacturers may begin labeling models under the new specification
• Proposed: January 1, 2007
• EPA’s goal is to finalize Tier I by the end of 2005, which would allow manufacturers at least one year to redesign and retest products, if necessary
53

Transition from MOU to PA
• In 2000, EPA developed a new streamlined Partnership Agreement (PA)
• Starting in 2001, EPA/DOE began transitioning partners to the new PA as specifications were revised
• Most product categories are now completely transitioned to the PA – computers are next
• Partnership Agreement: 3 sections– Commitment Form – Partner Commitments – Eligibility Criteria (aka specification)
54

Partner Commitments
Three Standard Commitments:
• Annual submission of product information
• Clear display of the ENERGY STAR on products, on product packaging, in product literature, and on company Web site
• Annual submission of ENERGY STAR unit shipment data
55

Annual Submission of Product Information
Goal: to ensure qualified product information provided onthe Web site is current
• Qualifying products do not need to be retested if the specification has not changed
• Submit list of products that continue to qualify• Report products that have been discontinued year
round
56

Product Labeling
Goals:• To ensure that participating manufacturers get
recognition for their efforts • To increase awareness of ENERGY STAR among
consumers • To make it easy for specifiers, purchasers,
distributors, and/or others to identify energy-efficientmodels
• To maintain the integrity of the ENERGY STAR brand by ensuring that the symbol is visible in themarketplace
57

Annual Shipment Data
Goal: to determine market penetration of ENERGY STAR; determine program success and if changes are needed
• EPA will work with partners to determine data collection format
• Data can be masked and/or aggregated
• Data may be provided by a third party or trade association on behalf of its members
58

Other PA Requirements
• Grandfathering Not Allowed– All products, including models qualified under Version
3.0, with a date of manufacture on or after the proposed [January 1, 2007] effective date, must meet the new Version 4.0 requirements to remain ENERGY STAR
– Date of manufacture: date (e.g., month and year) of which the unit is considered completely assembled
– EPA gives manufacturers 1 year transition period to qualify new products which allows time for older products to filter through marketplace
59

Tier I Next Steps
• EPA will take into consideration comments and suggestions made today and develop a Draft 1 specification for stakeholder review – All stakeholders are encouraged to provide written
comments as well – Comments and discussion notes will be posted to
the ENERGY STAR Product Development Web site at www.energystar.gov/productdevelopment
60