proposed agricultural land use plan for ratholo ... · aldep alup ap approx. aprru apsramb arap as1...
TRANSCRIPT
APRIL 1995
BOT/91/001Field Document 3
Land use planning for Sustainable Agricultural Development
BOTSWANA
PROPOSED
AGRICULTURAL LAND USE PLAN
Fc)R
RATHOLO AGRICULTURAL EXTENSION AREA
CENTRAL REGION
Food & Agriculture Republic of United NationsOrganization of Botswana Development
the United Nations Programme
Land use planning for Sustainable Agricultural Development
BOTSWANA
PROPOSED
AGRICULTURAL LAND USE PLAN
FOR
RATHOLO AGRICULTURAL EXTENSION AREA
CENTRAL REGION
by
S. Paris, T.S. Moahi and J.H. Venema
Agricultural Land Use Planners,Central Region
APRIL 1995
BOT/91/001Field Document 3
Food & Agriculture Republic of United NationsOrganization of Botswana Developmentthe United Nations Programme
Paris, S., T.S. Moahi and J.H. Venema. 1995. Proposed Agricultur-al Land Use Plan for Ratholo Agricultural Extension Area, Centralregion. FAO/UNDP/Government of Botswana Project BOT/91/001 LandUse Planning for Sustainable Agricultural development. FieldDocument 3. 88 pp.
This field document is one of a series of reports prepared duringthe course of the project identified on the title page. Theconclusions and recommendations in the report are those consid-ered appropriate at the time of its preparation. They may bemodified in the light of further knowledge gained at subsequentstages of the project.
The definitions employed and the presentation of the material andmaps in this document does not imply the expression of anyopinion whatsoever on the part of the Food and AgricultureOrganization of the United Nations concerning the legal orconstitutional status of any country or territory or concerningthe delimitation of frontiers.
ii
TABLE OF CONTENTSPage
LIST OF ABBREVIATIONS AND ACRONYMS viiiACKNOWLEDGEMENTS ixEXECU'TIVE SUMMARY
CHAPTER 1. INTRODUCTION
1.1 OBJEC I IVES1.2 METHODOLOGY
1.2.1 Area selection 1
1.2.2 Data collection and analysis 21.2.3 Consultation 3
CHAPTER 2. PHYSICAL ENVIRONMENT 5
2.1 LOCATION 5
2.2 CLIMATE 5
2.3 GEOLOGY AND LANDFORMS 92.4 SOILS 9
2.4.1 Characteristics and distribution 92.4.2 Soil degradation 14
2.5 LAND COVER AND PRESENT LAND USE 15
2.5.1 Land cover 15
2.5.1.1 Vegetation zones 15
2.5.1.2 Grass cover 16
2.5.2 Present land use 16
2.6 WATER RESOURCES 192.7 LAND UNITS 21
CHAPTER 3. SOCIO-ECONOMIC CONDITIONS 25
3.1 POPULATION 253.2 LAND TENURE AND LEGISLATION 253.3 GROUPS OF FARMERS 263.4 FARMING SYSTEMS 26
3.4.1 Arable farming 26
3.4.1.1 Farm size 273.4.1.2 Farming operations and labour use 273.4.1.3 Crops 313.4.1.4 Soil fertility maintenance 31
3.4.1.5 Pests and diseases 33
iv
3.4.2 Livestock production 33
3.4.2.1 Numbers and other main aspects 333.4.2.2 Grazing patterns 343.4.2.3 Animal health 343.4.2.4 Drinking water 353.4.2.5 Fencing 35
3.4.3 Collection of veld products and fuel wood 353.4.4 Irrigated agriculture 363.4.5 Forestry 36
3.5 INSTITUTIONS AND ORGANIZATIONS 36
CHAPTER 4. LAND USE PROBLEMS AND SUGGES1hD OPTIONS 39
4.1 INTRODUCTION 394.2 LOW CROP PRODUCTION 40
4.2.1 Constraints 404.2.2 Suggested options 41
4.3 INADEQUATE OR UNSUSTAINABLE LIVESTOCK PRODUCTION 43
4.3.1 Constraints 434.3.2 Suggested options 44
4.4 LAND DEGRADATION 45
4.4.1 The problem 454.4.2 Suggested options 45
4.5 FARMERS' SOCIO-ECONOMIC ENVIRONMENT 45
CHAPTER 5. LAND EVALUATION 47
5.1 RECOMMENDED LAND USES FOR LAND UNITS 475.2 EVALUATION OF CROP BASED PRODUCTION SYSTEMS 48
5.2.1 Introduction 48
5.2.1.1 CYSLAMB 485.2.1.2 Initial analysis and assumptions 49
5.2.2 Present crop production system 51
5.2.3 Potential crop production system 51
5.2.3.1 Crops and yields 51
5.2.3.2 Possible interventions in the present system 54
5.3 EVALUATION OF LIVESTOCK BASED PRODUCTION SYSTEMS 56
5.3.1 Present livestock production system 585.3.2 Potential lives-tock production system 58
5.4 POTENTIAL FOR AGROFORESTRY 625.5 POTENTIAL CROPS 625.6 EVALUATION OF IRRIGATED AGRICULTURE 645.7 EVALUATION OF THE PHANE PRODUCTION SYSTEM 64
CHAPTER 6. ANALYSIS OF PRODUCTION AND FINANCIAL EVALUATION 65
6.1 PRODUCTION IMPACT 65
6.1.1 Arable component 656.1.2 Livestock component 686.1.3 Veld product component 68
6.2 FINANCIAL ANALYSIS 68
6.2.1 Valuation of farm production 686.2.2 Operating expenditure 686.2.3 Investments and labour use 696.2.4 Gross margins 696.2.5 Farm budgets 70
CHAPTER 7. CONCLUSIONS AND RECOMMENDATIONS 73
7.1 RAINFED ARABLE FARMING 73
7.1.1 Field pattern and suitability of Land Units 737.1.2 Crop production 737.1.3 Soil degradation and conservation in farmers' fields 77
7.2 ANIMAL PRODUCTION 77
7.2.1 General 777.2.2 Grazing pattems and range conservation 78
7.3 PHANE PRODUCTION 787.4 IRRIGATED AGRICULTURE 787.5 FORESTRY 797.6 SMALL SCALE AGRO-INDUSTRIES 797.7 INSTITUTIONAL SUPPORT 79
7.7.1 Extension 797.7.2 Financial assistance and infrastructure 80
7.7.2.1 Subsidies and credit facilities 807.7.2.2 Marketing infrastructure 81
7.7.2.3 Fencing 81
REFERENCES 82
ANNEX: TABLES SUPPORTING FINANCIAL ANALYSIS 83
TABLE Al. Producer prices 84
TABLE A2. Value of agricultural produce, of pattem farms, dependable yields, LU 7 85TABLE A3. Value of agricultural produce, of pattern farrns, median yields, LU 7 86TABLE A4. Operating expenditures and investment costs 87
TABLE A5. Drought relief subsidies 87
TABLE A6. Annual operating expenditure of pattern farms, dependable and medium yields 88
LIST OF TABLES (in main text)
TABLE 1. Synoptic meteorological data, Mahalapye 7
TABLE 2. Inferred synoptic meteorological data, Ratholo 7
TABLE 3. Mean monthly and annual rainfall of selected stations 7
TABLE 4. Monthly rainfall data, Palapye 8
TABLE 5. Soil map legend 12
TABLE 6. Soil analytical data of representative profiles 13
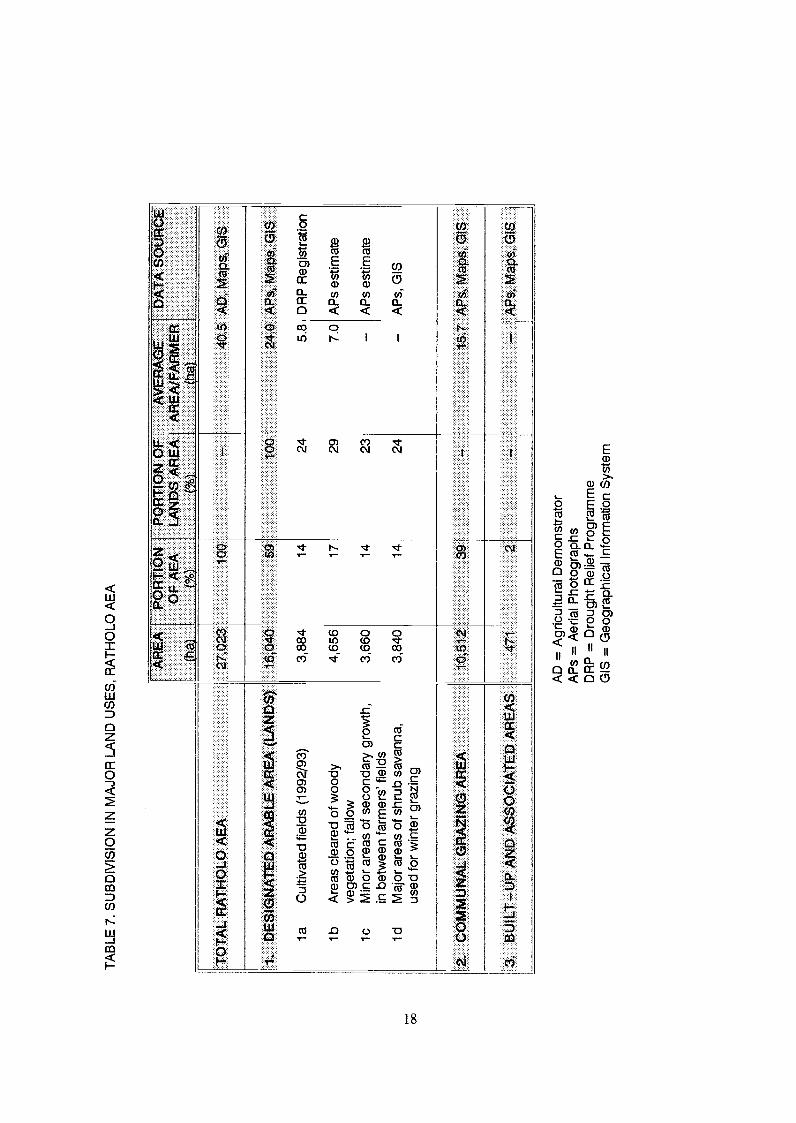
TABLE 7. Subdivision in major land uses 18
TABLE 8. Land unit map legend 23
TABLE 9. Population composition 28
TABLE 10. Age distribution of farmers 28
TABLE 11. Major characteristics of farms 28
TABLE 12. Mixed crop yields for selected farms, 1992/93 32
TABLE 13. Number of planting opportunities per year (1960-1992) 50
TABLE 14. Crop based production systems analysed using CYSLAMB 52
TABLE 15. Yields of sorghum in traditional mixed cropping 53
TABLE 16. Yields of sorghum in improved single cropping 53
TABLE 17. Yields of maize in traditional mixed cropping 55
TABLE 18. Yields of groundnuts in improved single cropping 55
TABLE 19. Livestock based production systems 57
TABLE 20. Livestock feed requirements 59
TABLE 21. Grazing carrying capacity, 1993/94 59
TABLE 22. Production of cattle and cattle products 61
TABLE 23. Selected potential crops 63
TABLE 24. Definition of pattern farms 66TABLE 25. Yield and production of veld products, of pattern farms 66TABLE 26. Yield and production of arable farming, of pattern farms, dependable yields 67
TABLE 27. Yield and production of arable farming, of pattem farms, median yields 67
TABLE 28. Contribution of farming system components to the value of farm production,for pattern farms 68
TABLE 29. Gross margins for main farming system components 70
TABLE 30. Farm budgets, of pattern farms, dependable yields 71
TABLE 31. Farm budgets, of pattern farms, median yields 71
TABLE 32. Legend Map 7: Recommended Land Use 74
vi
LIST OF MAPS
MAP 1. Location Rath°lo AEA 6MAP 2. Major landscapes 10MAP 3. Soils 11
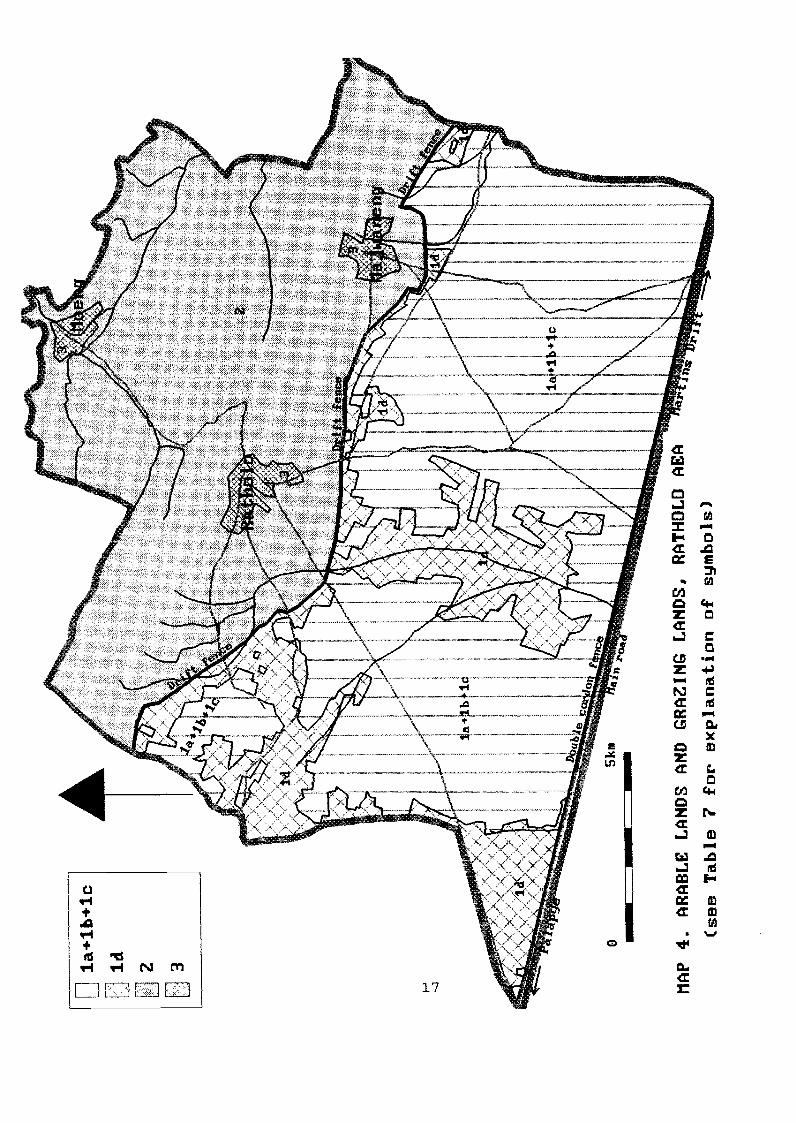
MAP 4. Arable lands and grazing lands 17
MAP 5. Water resources 20MAP 6. Land units 22MAP 7. Recommended land use 74
Note: In this report Map 7 is presented at scale 1:100,000. The Map is also available at scale 1:50,000from the Land Utilisation Division, MoA, Gaborone
LIST OF FIGURES
FIGURE 1. Land use calendar and labour use, of pattern farms 29FIGURE 2. Time lapse between seeding and weeding 30
vii
LIST OF ABBREVIATIONS AND ACRONYMS
ADAEAALDEPALUPAPapprox.APRRUAPSRAMBARAPas1
BAMBBCUBDCBMCCYSLAMBDAHPDAODCPFDDCDLUPUDO(D)DO(L)DLRFSDRPEFSAIPFAOFABFAPGISLACLGPLSULULUOLUPSADMoAOSSCAPDTPETpHpl/happmPPOPRICERAOSI
SMCS
'PV A
VDC
Agricultural DemonstratorAgricultural Extension AreaArable Land Development ProgrammeAgricultural Land Use Planner (MoA)Aerial PhotographapproximatelyAnimal Production and Range Research UnitAnimal Production System and Resource Assessment Model for BotswanaAccelerated Rainfed Arable Programmeabove sea level (altitude)Botswana Agricultural Marketing BoardBotswana Co--operative UnionBotswana Development CorporationBotswana Meat CommissionCrop Yield Simulation and Land Assessment Model for BotswanaDepartment of Animal Health and ProductionDistrict Agricultural Office(r)Department of Crop Production and ForestryDistrict Development CoinmitteeDistrict Land Use Planning UnitDistrict Officer (Development)District Officer (Lands)Dryland Farming Research SchemeDrought Relief ProgrammeEvaluation of Farming Systems and Agricultural Implements ProjectFood and Agricultural Organization of the United NationsForestry Association BotswanaFinancial Assistance PolicyGeographical Inforniation SystemLivestock Advisory CentreLength of Growing PeriodLivestock UnitLand UnitLand Use Officer (MoA)Land Use Planning for Sustainable Agricultural DevelopmentMinistry of AgricultureOne Stop Service Centre for AgriculturePalapye Development TrustPotential Evapo-transpirationAn indication of (soil) acidityplants per hectareparts per millionPlant Protection Office(r)Pioneer Rural Industries CentreRegional Agricultural Office(r)Stock InspectorSerowe Marketing Cooperative Society (Ltd)speciesVeterinary AssistantVillage Development Committee
viii
ACKNOWLEDGEMENTS
This study was carried out under the general guidance of Mr. I. Martdevu, National Project Coordinator,and Mr. D.J. Radcliffe, Chief Technical Advisor of the Project. The direction and logistical support theyprovided are very much appreciated.
Teclmical advice provided by,,Mr. J.M. Powell, Livestock/Range Ecology expert on the Project, Mr. D.Radcliffe, Mr. A. Neher, GIS specialist on the Project, and other colleagues are acicnowledged. Specialmention is made of Mr. Powell, on whose lcnowledge and experience we have drawn during range andlivestock oriented fieldwork.
Mr. B.E. Moji, Regional Agricultural Officer of the Central Region, and his staff are credited withproviding insights into the prevalent farming situation and with providing logistical support whenevernecessary. Mr. E. Mathibela, Assistant Land Use Officer, assis-ted with fieldwork.
Special thanks are due to Mr. T. Maeka, Agricultural Demonstrator of Ratholo Extension Area, whoprovided many bits of essential information and who spent time facilitating interviews with informantsand preparing field activities.
ix

EXECUTIVE SUMMARY
Location, population
Ratholo Agricultural Extension Area (AEA) covers an area of approximately 27,000 ha in easternCentral District half-way between Palapye and Martins Drift. The area includes the villages ofRath°lo and Majwaneng, and Moeng College. The total population of the area is 5,031 or 840families. An estimated 80 % of households is involved in agricultural activities. Most of the residentadults are female and day-to-day life in most farm households is run by a woman. The average ageof the farmer is around 50. Land is communally owned and used by local communities for livestockgrazing, arable farming and collection of veld products.
Land resources, land suitability
The mean annual rainfall in the AEA is 400 mm, with a standard deviation of 148 mm. Most ofthe rain falls in isolated storms scattered over a long se,ason. Dry spells of several weelcs occur withinthe growing season. The semi-arid climate poses severe re,strictions to arable fartning and causesshortages of drinking water and highly variable range conditions for livestock.
The main landforms of the AEA are the Tswapong Hills and their footslopes at an altitude of 1000to 1160 m in the north, and the almost flat Molapo plain at an altitude of approximately 900 m inthe south. All soils are deficient in major plant nutrients and thus have inherent restrictions forfarrning. The best soils are deep, freely drained and medium textured Luvisols of the footslope zoneand the higher reaches of the Molapo plain. Most soils in the lower and most southem part of theplain have a gravelly layer in the subsoil, posing an impediment to root development. Minor partsof the plain and footslope area occasionally suffer from flooding after rainstorms. Soils in the hillsare shallow and stony, with frequent rock outcrops.
Moderate to severe sheet and rill erosion has affected 4,200 ha mainly in the footslope zone, andhas done irreversible damage in some localised areas. Topsoil deterioration and crusting of topsoilsare widespread both in farmer's fields and in rangelands. Soil degradation is expected to spread andintensify in the future if no appropriate action is taken.
Most of the AEA is covered with degraded tree and shrub savanna. Degradation of the herbaceouslayer (grasses and forbs) is widespread. The grass density is low and species which have little valuefor grazing dominate. The woody vegetation of the plain is dominated by mopane (Colophospermumniopane). This tree is the host of the Mopane moth (Gonimbrasia belina) (see Paragraph 10).
Nine Land Units (LUs) have been identified and mapped on the basis of variations in landforrnand soil. Almost half of the AEA is suitable for arable farming (LUs 2, 7 and 8). Another 9 % ismarginally suitable due to limited soil depth (LU 9). Arable farming is presently confined to LUs 7,8 and 9. The remaining part of the AEA is unsuitable for cultivation due to flood risk (LU 6), presenterosion and erosion hazard (LUs 3, 4 and 5), and a combination of steep slope and shallow soil(LU 1). Land not used for arable farming is used for grazing and the collection of veld products.
Present land use
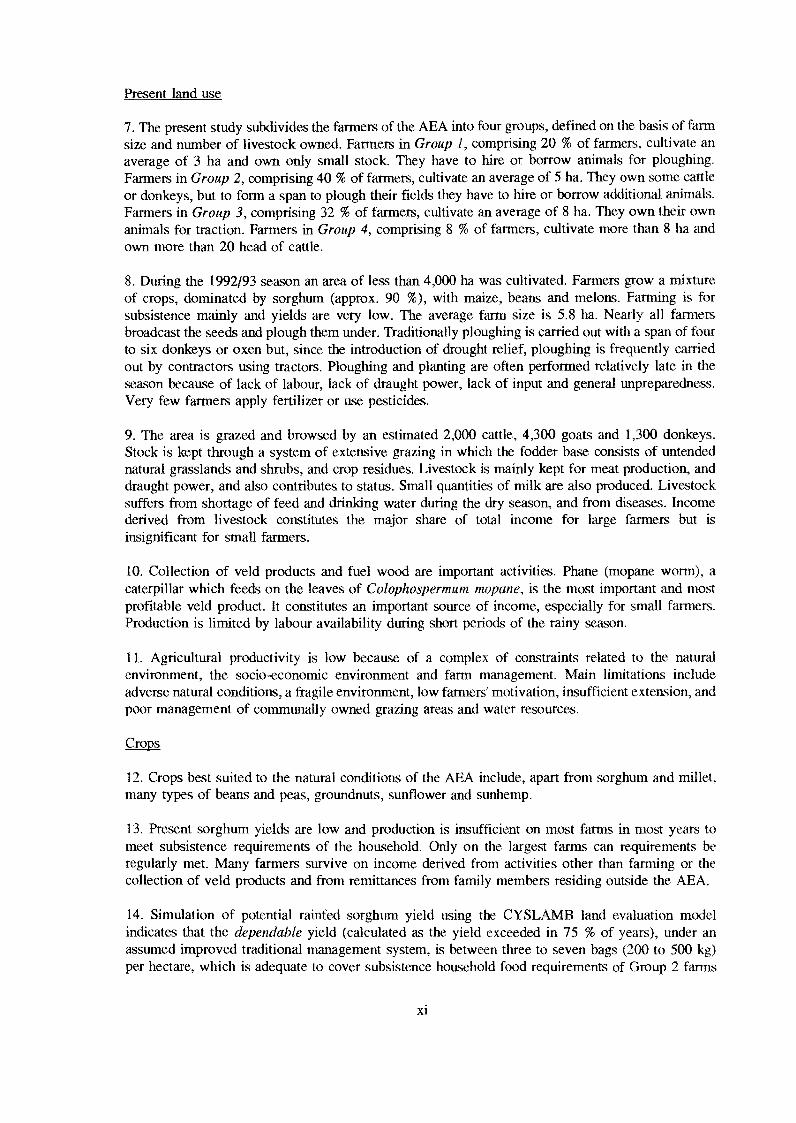
The present study subdivides the farmers of the AEA into four groups, defined on the basis of farmsize and number of livestock owned. Farmers in Group I, comprising 20 % of farmers, cultivate anaverage of 3 ha and own only small stock. They have to hire or borrow animals for ploughing.Farmers in Group 2, comprising 40 % of farmers, cultivate an average of 5 ha. They own some cattleor donkeys, but to form a span to plough their fields they have to hire or borrow additional animals.Farmers in Group 3, comprising 32 % of farmers, cultivate an average of 8 ha. They own their ownanimals for traction. Farmers in Group 4, comprising 8 % of farmers, cultivate more than 8 ha andown more than 20 head of cattle.
During the 1992/93 season an area of less than 4,000 ha was cultivate-d. Farmers grow a mixtureof crops, dominated by sorghum (approx. 90 %), with maize, beans and melons. Farming is forsubsistence tnainly and yields are very low. The average farm size is 5.8 ha. Nearly all farmersbroadcast the seeds and plough them under. Traditionally ploughing is carried out with a span of fourto six donkeys or oxen but, since the introduction of drought relief, ploughing is frequently carriedout by contractors using tractors. Ploughing and planting are often performed relatively late in theseason because of lack of labour, lack of draught power, lack of input and general unpreparedness.Very few farmers apply fertilizer or use pesticides.
The area is grazed and browsed by an estimated 2,000 cattle, 4,300 goats and 1,300 donkeys.Stock is kept through a system of extensive grazing in which the fodder base consists of untendednatural grasslands and shrubs, and crop residues. Livestock is mainly kept for meat production, anddraught power, and also contributes to status. Small quantities of milk are also produced. Livestocksuffers from shortage of feed and drinking water during the dry season, and from dise,ases. Incomederived from livestock constitutes the major share of total income for large farmers but isinsignificant for small farmers.
Collection of veld products and fuel wood are important activities. Phane (mopane worm), acaterpillar which feeds on the leaves of Colophospermum mopane, is the most important and mostprofitable veld product. It constitutes an important source of income, especially for small fanners.Production is limited by labour availability during short periods of the rainy season.
Agricultural productivity is low because of a complex of constraints related to the naturalenvironment, the socio-economic envirotunent and farm management. Main limitations includeadverse natural conditions, a fragile environment, low farmers' motivation, insufficient extension, andpoor management of communally owned grazing areas and water resources.
Crops
Crops best suited to the natural conditions of the AEA include, apart from sorghum and millet,many types of beans and peas, groundnuts, sunflower and sunhemp.
Present sorghum yields are low and production is insufficient on most farms in most years tomeet subsistence requirements of the household. Only on the largest farms can requirements beregularly met. Many farmers survive on income derived ftom activities other than fanning or thecollection of veld products and from retnittances from family members residing outside the AEA,
Simulation of potential rainfed sorghum yield using the CYSLAMB land evaluation modelindicates that the dependable yield (calculated as the yield exceeded in 75 % of years), under anassumed improved traditional management system, is between three to seven bags (200 to 500 kg)per hectare, which is adequate to cover subsistence household food requirements of Group 2 farms
xi
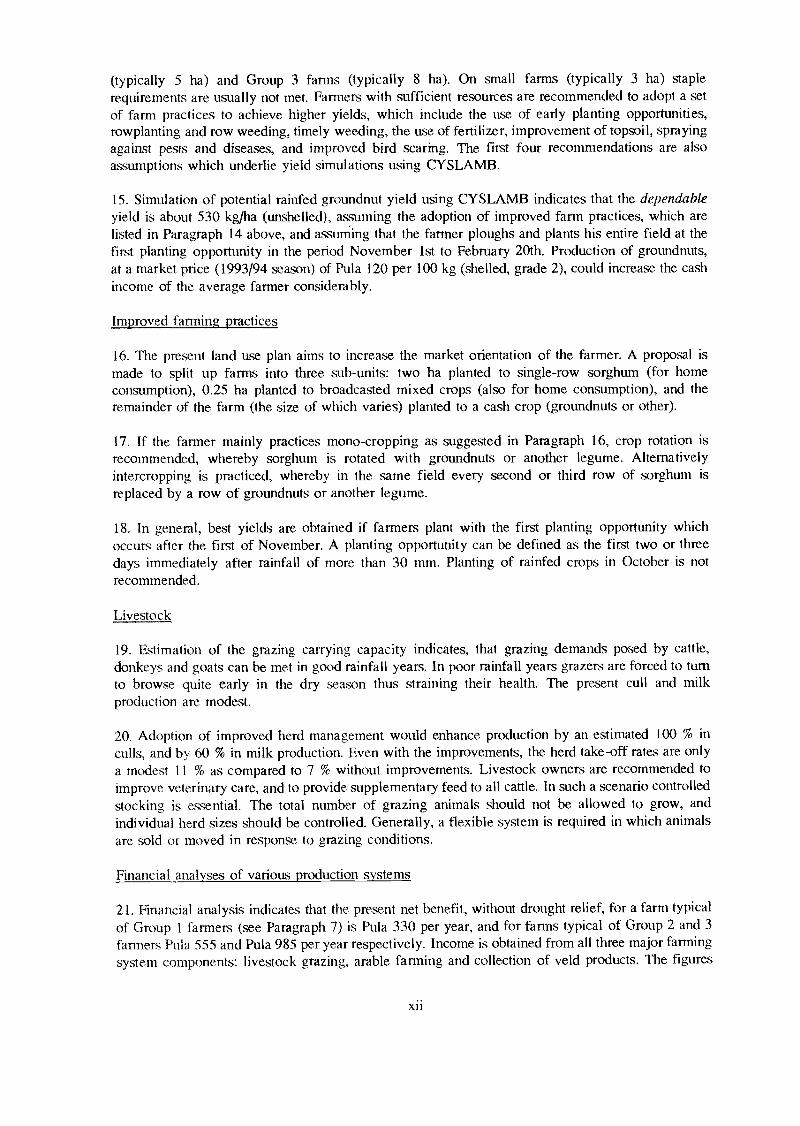
(typically 5 ha) and Group 3 farms (typically 8 ha). On small farms (typically 3 ha) staplerequirements are usually not met. Farmers with sufficient resources are recommended to adopt a setof farm practices to achieve higher yields, which include the use of early planting opportunities,rowplanting and row weeding, timely weeding, the use of fertilizer, improvement of topsoil, sprayingagainst pests and diseases, and improved bird scaring. The first four recommendations are alsoassumptions which underlie yield simulations using CYSLAMB.
Simulation of potential rainfed groundnut yield using CYSLAMB indicates that the dependableyield is about 530 kg/ha (unshelled), assuming the adoption of improved farm practices, which arelisted in Paragraph 14 above, and assuming that the farmer ploughs and plants his entire field at thefirst planting opportunity in the period November 1st to February 20th. Production of groundnuts,at a market price (1993/94 season) of Pula 120 per 100 kg (shelled, grade 2), could increase the cashincome of the average farmer considerably.
Improved farming practices
The present land use plan aims to increase the market orientation of the farmer. A proposal ismade to split up farms into three sub-units: two ha planted to single-row sorghum (for homeconsumption), 0.25 ha planted to broadcasted mixed crops (also for home consumption), and theremainder of the farm (the size of which varies) planted to a cash crop (groundnuts or other).
If the farmer mainly practices mono-cropping as suggested in Paragraph 16, crop rotation isrecommended, whereby sorghum is rotated with groundnuts or another legume. Alternativelyintercropping is practiced, whereby in the same field every second or third row of sorghum isreplaced by a row of groundnuts or another legume.
In general, best yields are obtained if farmers plant with the first planting opportunity whichoccurs after the first of November. A planting opportunity can be defined as the first two or threedays immediately after rainfall of more than 30 mm. Planting of rainfed crops in October is notrecommended.
Livestock
Estimation of the grazing carrying capacity indicates, that grazing demands posed by cattle,donkeys arid goats can be met in good rainfall years. In poor rainfall years grazers are forced to tumto browse quite early in the dry season thus straining their health. The present cull and milkproduction are modest.
Adoption of improved herd management would enhance production by an estimated 100 % inculls, and by 60 % in milk production. Even with the improvements, the herd take-off rates are onlya modest 11 % as compared to 7 % without improvements. Livestock owners are recommended toimprove veterinary care, and to provide supplementary feed to all cattle. In such a scenario controlledstocking is e,ssential. The total number of grazing animals should not be allowed to grow, andindividual herd sizes should be controlled. Generally, a flexible system is required in which animalsare sold or moved in response to grazing conditions.
Financial analyses of various production systems
Financial analysis indicates that the present net benefit, without drought relief, for a farm typicalof Group 1 farmers (see Paragraph 7) is Pula 330 per year, and for farms typical of Group 2 and 3farmers Pula 555 and Pula 985 per year respectively. Income is obtained from all three major farmingsystem components: livestock grazing, arable farming and collection of veld products. The figures
xii
above show a low income from farming and the collection of veld products and confirm theassumption that many farmers depend on additional sources of income (see also Paragraph 13).
Financial analysis indicates that adoption of improved farm practices leads to an estimatedpotential net benefit for typical Group 2 and Group 3 farms of Pula 770 and Pula 2,713 per yearrespectively. 'These benefits are considerably higher than at present, representing an increase of 39 %for Group 2 farms and 175 % for Group 3 farms. The largest share of the increased benefit is derivedfrom groundnut farming, which would thus outperform livestock.
Adoption of improved farm practices does not make sense in the case of the resource-poor smallfarmer (Group 1). The potential net benefit is estimated to be negative, because of high cost for hireddraughtpower and implements. Introduction of improved management is clearly pointless on smallfarms which are without means of traction. The high production costs could be mitigated by aGovernment subsidy directed to stnall farmers. A programme a,ssisting stnall farmers in obtainingdonkeys or oxen should be designed in such a way so as not to overburden the already stressedgrazing resources.
Financial analysis indicates that drought relief in its present form reduces operating expendituresto close to zero on farms without means of traction and to negative for larger farms which do havemeans of traction. Larger farms benefit more than smaller farms from drought relief.
Labour
Labour availability is a crucial determining factor in the adoption of improved managementpractices. At present, a labour shortage exists on larger farms (Group 3) and excess labour may beavailable on some small farms (Group 1). It is estimated that the change to rowplanting and relatedoperations would increase overall labour demand by 25 % during the cropping season. In addition,the production of groundnuts is assumed to increase labour demand during the growing season withanother 25 % as compared to sorghum. Labour availability within the area seems adequate to meetthis demand.
Land allocation
It is recommended that the present pattern of arable fields be maintained, and not to attempt tomodify it either by consolidation of farms or relocation of farms on better soils. It is considered thatthe social and infrastructural disruption, which the re-location of farms might provoke, are not counterbalanced by sufficient benefits. However, future land allocation should concentrate on the deep soilssouth of the drift fence (unit 7b on Map 7).
Soil conservation
Soil conservation both in farmers' fields and in rangelands will be required to prevent furtherdeterioration of topsoils and vegetation. Fertility maintenance of arable soils should be promoted bythe use of kraal manure, ploughing in of crop residues and/or green manure, crop rotation, and theuse of chemical fertilizer. The installation of a system of paddocks to control grazing, is required.This subject should be further discussed with the whole community.
Settlements, tree planting
The villages of Ratholo and Majwaneng are threatened by erosion caused by nm-off from theTswapong footslopes. Future expansion of the villages should be in southerly direction and not furtherupslope. The footslopes north of the villages should be protected and provide good sites for woodlots.
Tree planting within the compomds should be encouraged. Some physical structures will be neededto control gully erosion in the villages.
Dams, springs, irrigation
No suitable dam sites have been identified in the area below the Tswapong Hills. Present damsare shallow and not properly managed. Various actual and potential perennial water sources exist inthe Tswapong Hills. The spring north of Rath°lo village is intensively used for human and livestockconsumption and needs rehabilitation and protection. The spring and dam above Moeng College areneglected and under-utilized.
There is not much scope for irrigated agriculture in the AEA. Irrigation from boreholes will onlybe productive if the irrigated area is intensively used and well managed.
Potential for agro-industries
Groundnuts can only be sold in shelled form. Shelling could provide a labour intensive small-scale local industry which provides employment during the dry season. If sufficient groundnuts areproduced, the production of peanut butter should be considered. Another possible small-scale agro-industry is the advanced processing and marketing of phane.
Extension
Advice given to farmers must be improved both in content and effort. The AgriculturalDemonstrator (AD) and Stock Inspector (SI) must be provided with clear instructions and manualsto assist them in getting messages across to farmers. The AD must be freed from drought reliefadministration and the SI of participation in vaccination campaigns elsewhere. Additional extensionstaff may be required in the future. The AD and SI should continue to support the Farmers'Committee, which could be instrumental in the education and organization of farmers. ExtensionOfficers should take into account the gender and age of the "average" farmer (see Paragraph 1).Different messages will be needed for different Groups of farmers (see Paragraphs 7, 22 and 23).
Institutions
Some of the suggestions given in the previous Paragraphs need additional support from variousGovernment institutions. Por example, seed and fertilizer for proposed crops should be readilyavailable and pricing of produce and subsidies should encourage appropriate farming practices.
xiv
CHAPTER 1
INTRODUCTION
Land use planning is the assessment of the physical resources and the economic and social conditions ofan area, and an evaluation of potential sustainable land-uses. Its purpose is to select and put into practicethose land uses which will protect the long-term interests of the of present and future users.
Land use planning does not necessarily mean a complete change of land use and re-settlement. Presentuse of the land has developed over a long period of time and usually makes very good sense. However,because of rapidly changing social and economic conditions (e.g. population growth and changes inlifestyle and expectations), the present land use has to be adjusted and made more productive. The landuse planner helps with making such adjustments.
1.1 OBJECTIVES
The pre,sent study has two objectives:
The first objective is to create a land use plan for the benefit of the people of Ratholo AEA, drawn upin consultation with farmers, local authorities and relevant Government institutions. Since the area isthought to be representative of large parts of Palapye Agricultural District, it is hoped that the conclusionsand recommendations of the plan can be extrapolated or replicated to similar areas in the District.
The second objective is to establish and test a methodology of land use planning, applicable to studies ofsimilar nature and scale throughout the country. Land use planning is a relatively new discipline inBotswana, and the Ratholo study can be considered as one of the test cases for the planning of establishedcommunal areas in the country.
1.2 METHODOLOGY
1.2.1 Area selection
Land use planning can be done for any area of land, such as a single farm or an entire District or Region.The present study is a plan for an Agricultural Extension Area (AEA). The AEA is the smallest unit inthe hierarchy of the Ministry of Agriculture. In conjunction with the RAO management and the DistrictLand Use Planning Unit (DLUPU) (1), Ratholo AEA was selected as the first area for study, using anumber of criteria such as potential for crop production, high population density, presence of erosionproblems, presence of land use conflicts, variation in land resources/production potential, and the presenceof capable extension agents in the area.
The DLUPU covers the Central District (Administrative), which is larger than the Central Region of the Ministry ofAgriculture (see also Section 3.5)
1
1.2.2 Data collection and analysis
The following surveys were carried out in the area as part of the study:
1 Informal farm survey (1 eek). Short interviews with 15 farmers were held. Local authorities andseveral key informants were also interviewed. The survey was carried out to develop anunderstanding of farming practices, constraints and opportunities, and farmers objectives andstrategies. Another aim of the survey was to determine recommendation domains.
2 Additional farming systems survey (2 weelcs) for collection of quantified data on key agriculturalparameters. Interviews were held with some 30 farmers. Data were entered into the Land UseDatabase (FAO et al, 1994)
3 Natural resource survey (2 weeks). Soils were described from 36 augerings and 6 soil pits. Surfacecharacteristics (slope, erosion and crusting) were also recorded. Twenty five topsoil samples weretaken and sent to the laboratory for analysis of phosphorus, pH and organic carbon. Vegetationdata were collected, including data on the tree and shrub layer in terms of species compositionand canopy cover. The location and seasonality of water sources (bore holes, wells, springs, pansand streams) was also surveyed.
4 Herd survey (3 days) was carried out in cooperation with the Livestock Production Specialist ofthe LUPSAD project.
5 Vegetation and grasses survey (3 days) was carried out during the rainy season, also together withthe Livestock Production Specialist.
6 Area boundary survey (1 day) was carried out together with the Agricultural Demonstrator (AD).
Other data collected include drought relief data, population census data, livestock census data, andmeteorological data of recent years.
Other important sources of existing information were farm management surveys, tillage trials andagricultural statistics conducted or collected by the Ministry of Agriculture countrywide.
Extensive use was made of the following existing maps and photographs:
Palapye sheet of the Soil Map, scale 1:250,000 (Remmelzwaal, 1989)Moeng sheet of the Geological Map, scale 1:125,000 (Geological Survey)Vegetation Map, scale 1:500,000 (Timberlake, 1980)'Topographic map sheets, scale 1:50,000 (Dept. of Surveys and Lands, 1984-1986)Monochrome (B&W) aerial photography, scale 1:50,000, flown in 1988Satellite imagery (Landsat-TM) image, scale 1:250,000, recorded on 24 July 1993
The following computer programmes and applications were used:
ILWIS GIS for map production (Version 1.4, ITC, 1993).CYSLAMB for crop yield simulation (De Wit et al., 1993-1994).METE() for retrieval of meteorological data (FAO, 1991).Botswana Soil Data Base for existing soils data (Van Waveren, 1988).Waterpoint Database/GIS for existing water points (Wellfield Consultants, 1992)
- Land Use Database for storage and retrieval of farming systems data (ITC/FAO/WAU, 1994).
2
Carrying capacity and herd projection spreadsheets (Powell, 1994).LOTUS 123 for analysis and processing of various data and presentation of tables(Version 3.1+, 1989).
1.2.3 Consultation
The consultation process consisted of three stages:
1 Initial presentation of project activities and consultation with the DLUPU, District DevelopmentCommittee (DDC), RAO staff, District Agricultural Office (DAD) staff, Agricultural Demonstrator(AD) and Stock inspector (SI), and local authorities at village level (Headman, VillageDevelopment Committee (VDC) and farmers committee).
2 Regular consultation of AD and other RAO staff during data collection and data analysis.
3 Presentation of results and further discussions and consultations with RAO, DLUPU, Landboardand local authorities.

CHAPTER 2
PHYSICAL ENVIRONMENT
2.1 LOCATION
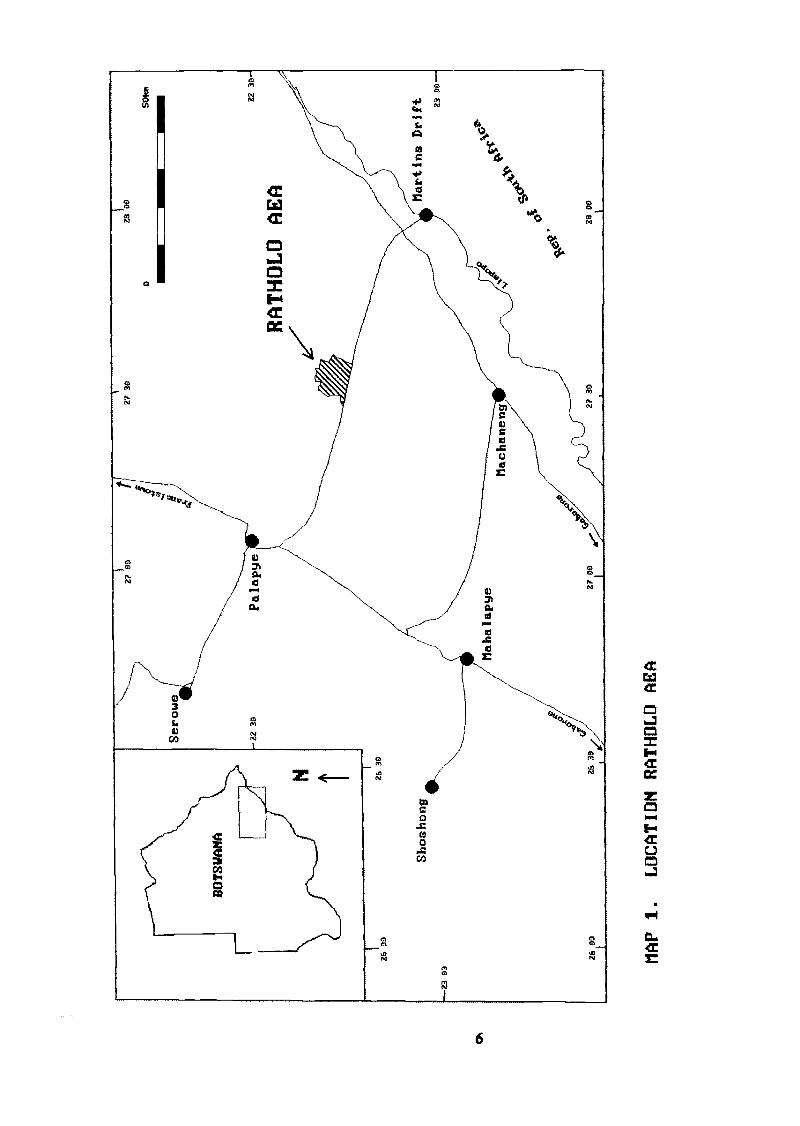
The Ratholo Agricultural Extension Area is located on the southem footslopes of the Tswapong Hills. Itlies halfway between Palapye and Martins Drift (both are approx. 50 km away) and is easily accessiblevia the road which linlcs these two places. The coordinates of the centre of the area are close to 22' 45'South and 27°35' East. See Map 1.
Ratholo AEA covers an area of approx. 270 km2. Its southem border is formed by the Palapye - MartinsDrift road, which coincides with the Makoro cordon fence, while the northem border mostly followssouth-facing escarpments of the Tswapong Hills near Moeng. The eastern and western boundaries do notfollow any natural features.
Ratholo AEA encompasses the villages of Ratholo and Majwaneng and also includes Moeng college. Ingeneral administrative terms Ratholo AEA lies within Palapye/Serowe sub-District in the Central District.For agricultural administration it is located in Palapye Agricultural District (Offices in Palapye) in theCentral Agricultural Region (Offices in Serowe).
2.2 CLIMATE
The meteorological station nearest to Ratholo is Mahalapye (lying 90 km in south-westerly direction).Mahalapye has 27 years of record and its meteorological parameters are summarised in Table 1. The datafrom Mahalapye are used in the land evaluation procedure (Chapter 5). Inferred synoptic data for Ratholoare presented in Table 2. The nearest rainfall stations with reliable long term records are Martins Drift (50km E), Machaneng (50 km S) and Palapye (50 km W). See Table 3. Other rainfall stations located nearby,such as Maunatlala (15 km N) and Lerala (20 km E), have records of fewer years and records are oftenincomplete. Rainfall station Palapye (for the period 1960-1992) is selected to be used for land evaluationof the Ratholo area, since its natural setting resembles the conditions in Ratholo best.
Mean annual rainfall is around 400 mm, the larger part of which falls during a limited number of showersduring the rainy season, which lasts from October through April. Long term rainfall records of Palapyeare presented in Table 4. The year-to-year variation in annual rainfall is high, about 150 mm on average.Dry spells may occur during middle of the rainy season. Table 4 shows that in 13% of all years the wholemonth of January received less than 25 mm of rain, and in 23% of all years the whole month of Februarywas almost dry. Annual potential evapo-transpiration (PET) is high, about 1600 mm, with the highestmonthly figures (180 mm) occurring during the rainy season. On average, the period that rainfall exceedshalf PET is 54 days, from mid January to early March. This period is called the Length of Growing Period(LGP). The mean annual temperature is 20.5 °C. Average minimum temperatures vary from 4.6 °C in Julyto 19.1 °C in January and mean maximum temperatures from 22.5 °C to 30.9 °C in the same months.
5
Shoshong
Ilartfns Drift a OD-
RA
TH
OLO
AE
A
Z
NAP 1.
LOCATION RATHOLO AEA
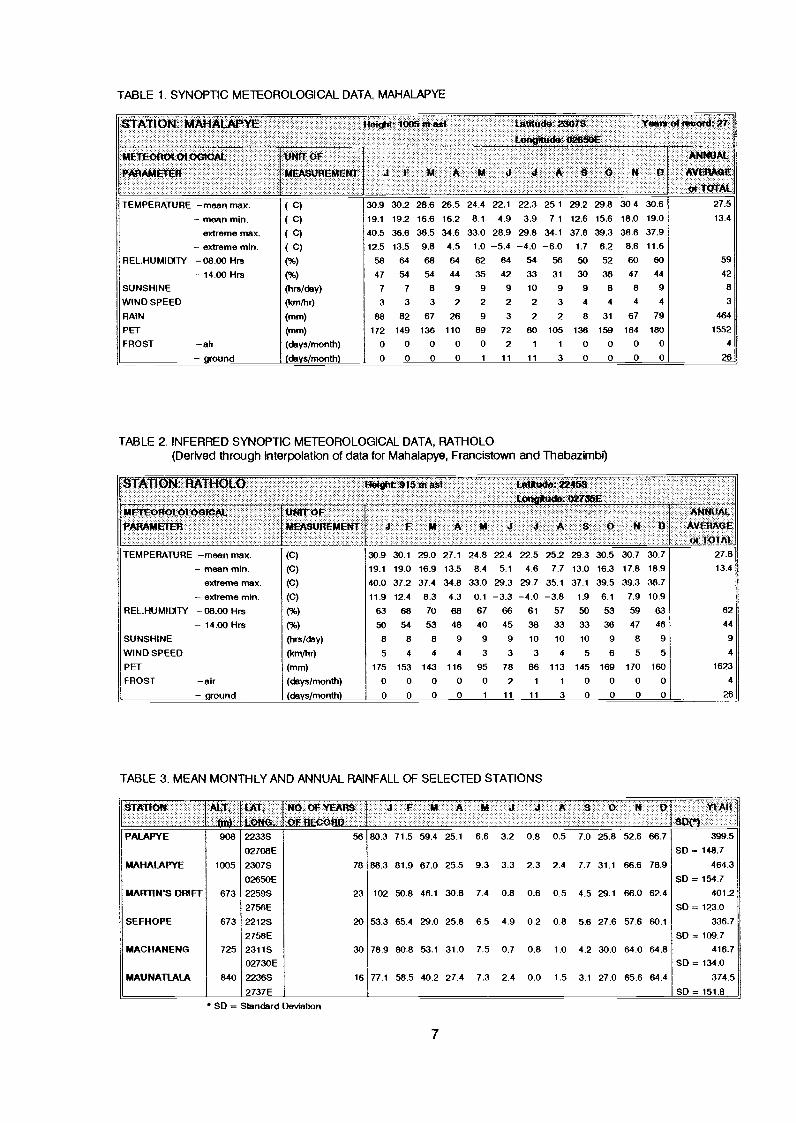
TABLE 1. SYNOPTIC METEOROLOGICAL DATA, MAHALAPYE
TABLE 2. INFERRED SYNOPTIC METEOROLOGICAL DATA, RATHOLO(Dertved through Interpolation of data for Mahalapya, Francistown and Thabazimbi)
TABLE 3. MEAN MONTHLY AND ANNUAL RAINFALL OF SELECTED STATIONS
* SD Standard Deviation
7
STATION: 'MAHAL/III Height 1005 ttl *Si
Jr 10 AM 4
tiflitudtE 23078
Longitutiox 020350E
4ASO N
Yoatt
O
at recootv
ANNUAL
AVEMOE
ot TOTAL
ME1E01%01010GteAt.
PAIIANE tftUNIT or
MEASUREMENT
TEMPERATURE -mean max. ( C) 30.9 30.2 28.6 26.5 24.4 22.1 22.3 25.1 292 29.8 30.4 30.6 27.5
- mean min. ( C) 19.1 19.2 16.6 16.2 8.1 4.9 3.9 7.1 12.6 15.6 18.0 19.0 13.4
extreme max. ( C) 40.5 36.6 36.5 34.6 33.0 28.9 29.8 34.1 37,6 39.3 38.6 37.9- extreme min. ( c) 12.5 13.5 9.8 4.5 1.0 -5.4 -4.0 -6.0 1.7 6.2 8.6 11.6
REL.HUMIDITY -08.00 Hrs (%) 58 64 68 64 62 64 54 56 50 52 60 60 59
- 14.00 Hrs (%) 47 54 54 44 35 42 33 31 30 38 47 44 42
SUNSHINE (hrs/day) 7 7 8 9 9 9 10 9 9 8 8 9 8
WIND SPEED (krn/hr) 3 3 3 2 2 2 2 3 4 4 4 4 3
RAIN (mm) 88 82 67 26 9 3 2 2 8 31 67 79 464
PET (mm) 172 149 136 110 89 72 80 105 138 159 164 180 1552
FROST -air (days/month) 0 0 0 0 0 2 1 1 0 0 0 0 4
- ground (days/month) 0 0 0 0 1 11 11 3 0 0 0 0 26
TA IFAVTOR0LbtooteAL unfroF
tot 915 1,100k0W 22454
LortotAK 407000
----iANNUAL
PARAMETE'R MEASUREMENT J F M- A M J J A S. O tt ID AVERAGE
Ot TOTAL
TEMPERATURE -mean max. (C) 30.9 30.1 29.0 27.1 24.8 22.4 22.5 252 29.3 30.5 30.7 30.7 27.8
- mean min. (C) 19.1 19.0 16.9 13.5 8.4 5.1 4.6 7.7 13.0 16.3 17.8 18.9 13.4
extreme max. (C) 40.0 37.2 37.4 34.8 33.0 29.3 29.7 35.1 37.1 39.5 39.3 38.7- extreme min. (C) 11.9 12.4 8.3 4.3 0.1 -3.3 -4.0 -3.8 1.9 6.1 7.9 10.9
REL.HUMIDITY -08.00 Hrs (%) 63 68 70 68 67 66 61 57 50 53 59 63 62
- 14.00 Hrs (%) 50 54 53 48 40 45 38 33 33 36 47 46 44
SUNSHINE (hrn/daY) 8 8 8 9 9 9 10 10 10 9 8 9 9
WIND SPEED (krrithr) 5 4 4 4 3 3 3 4 5 6 5 5 4
PET (mm) 175 153 143 116 95 78 86 113 145 169 170 180 1623
FROST -air (days/month) 0 0 0 0 0 2 1 1 0 0 0 0 4
- ground (days/month) 0 0 0 0 1 11 11 3 0 0 0 0 26
trATION MX:(M) .
LAT.
LONG.
Nei. OFYFA ,
OF RECORD
JF It A.
M 0 N D YEAR
ROM .PALAPYE 908 2233S 56 80.3 71.5 59.4 25.1 6.6 3.2 0.8 0.5 7.0 25.8 52.6 66.7 399.5
02708E SD = 148.7
MAHALAPYE 1005 2307S 78 88.3 81.9 67.0 25.5 9.3 3.3 2.3 2.4 7.7 31.1 66.6 78.9 464.3
02650E SD = 154.7
MARTIN'S DRIFT 673 2259S 23 102 50.8 46.1 30.8 7.4 0.8 0.6 0.5 4.5 29.1 66.0 62.4 401.2
2756E SD = 123.0
SEFHOPE 673 2212S 20 53.3 65.4 29.0 25.8 6.5 4.9 0.2 0.8 5.6 27.6 57.6 60.1 336.7
2758E SD = 109.7
MAC HANENG 725 2311S 30 78.9 80.8 53.1 31.0 7.5 0.7 0.8 1.0 42 30.0 64.0 64.8 416.7
02730E SD = 134.0
MAUNATLALA 840 2236S 16 77.1 58.5 402 27.4 7.3 2.4 0.0 1.5 3.1 27.0 65.6 64.4 374.5
2737E SD = 151.1)
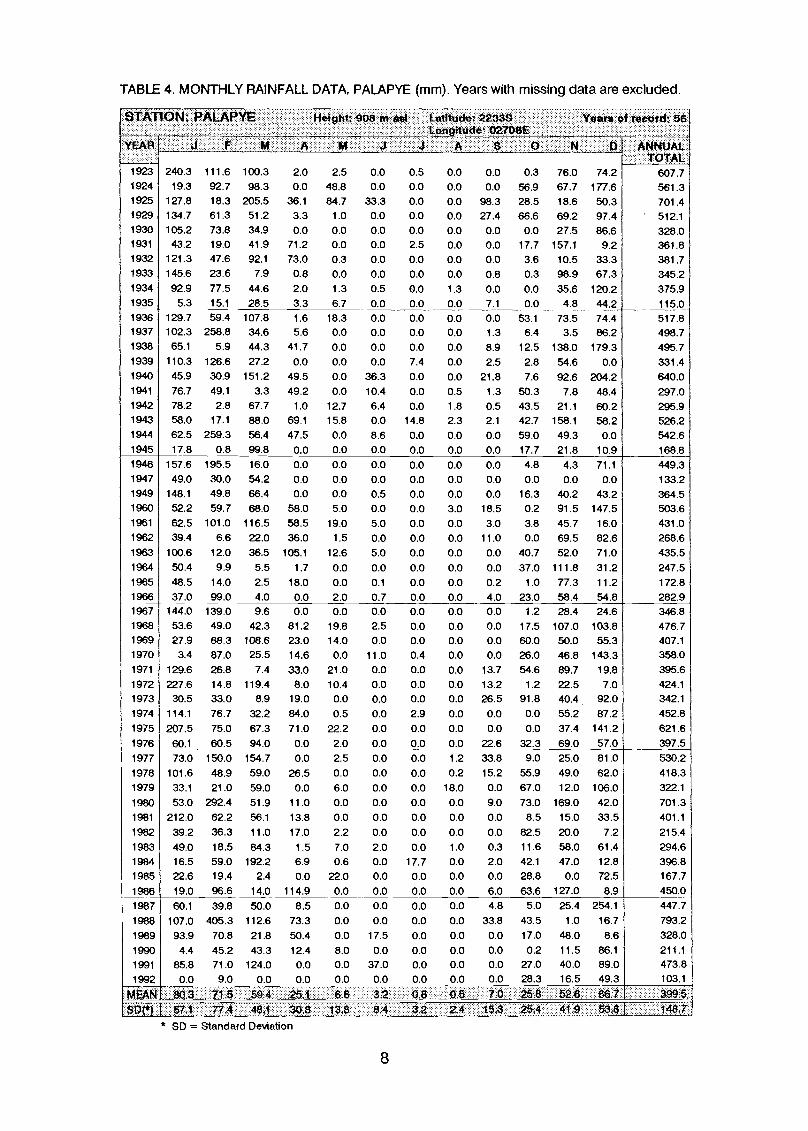
TABLE 4. MONTHLY RAINFALL DATA, PALAPYE (mm). Years with missing data are excluded.
* SD = Standard Deviation
8
STATION;
YEANT
PALAPYE
M.A1-8149ht, 908 m set
. .
OA 4 ,E
Latitude: 2233SLongittidet 02708E
A S O N
Ye** of
I)
rotor-tit 56'
ANNUALTOTAL
. Jr1923 240.3 111.6 100.3 2.0 2.5 0.0 0.5 0.0 0.0 0.3 76.0 74.2 607.71924 19.3 92.7 98.3 0.0 48.8 0.0 0.0 0.0 0.0 56.9 67.7 177.6 561.31925 127.8 18.3 205.5 361 84.7 33.3 0.0 0.0 98.3 28.5 18.6 50.3 701.41929 134.7 6t3 51.2 3.3 1.0 0.0 0.0 0.0 27A 66.6 69.2 97.4 512.11930 105.2 73.8 34.9 0.0 0.0 0.0 0.0 0.0 0.0 0.0 27.5 86.6 328.01931 43.2 19.0 41.9 71.2 0.0 0.0 2.5 0.0 0.0 17.7 157.1 9.2 361.81932 121.3 47.6 92.1 73.0 0.3 0.0 0.0 0.0 0.0 3.6 10.5 33.3 381.71933 145.6 23.6 7.9 0.8 0.0 0.0 0.0 0.0 0.8 0.3 98.9 67.3 345.21 934 92.9 77.5 44.6 2.0 1.3 0.5 0.0 1.3 0.0 0.0 35.6 120.2 375.91935 5.3 15.1 28.5 3.3 6.7 0.0 0.0 0.0 7.1 0.0 4.8 44.2 115.01936 129.7 59.4 107.8 1.6 18.3 0.0 0.0 0.0 0.0 53.1 73.5 74.4 517.81937 102.3 258.8 34.6 5.6 0.0 0.0 0.0 0.0 1.3 6.4 3.5 86.2 498.71938 65.1 5.9 44.3 41.7 0.0 0.0 0.0 0.0 8.9 12.5 138.0 179.3 495.71939 110.3 126.6 27.2 0.0 0.0 0.0 7.4 0.0 2.5 2.8 54.6 0.0 331.41940 45.9 30.9 151.2 49.5 0.0 36.3 0.0 0.0 21.8 7.6 92.6 204.2 640.01941 76.7 49.1 3.3 49.2 0.0 10.4 0.0 0.5 1.3 50.3 7.8 48.4 297.01942 78.2 2.8 67.7 1.0 12.7 6.4 0.0 1.8 0.5 43.5 21.1 60.2 295.91943 58.0 17.1 88.0 69.1 15.8 0.0 14.8 2.3 2.1 42.7 158.1 58.2 526.21944 62.5 259.3 56.4 47.5 0.0 8.6 0.0 0.0 0.0 59.0 49.3 0.0 542.61945 17.8 0.8 99.8 0.0 0.0 0.0 0.0 0.0 0.0 17.7 21.8 10.9 168.81946 157.6 195.5 16.0 0.0 0.0 0.0 0.0 0.0 0.0 4.8 4.3 71.1 449.31947 49.0 30.0 54.2 0.0 0.0 0.0 0.0 0.0 0.0 0.0 0.0 0.0 133.21949 148.1 49.8 66.4 0.0 0.0 0.5 0.0 0.0 0.0 16.3 40.2 43.2 364.51960 52.2 59.7 68.0 58.0 5.0 0.0 0.0 3.0 18.5 0.2 91.5 147.5 503.61961 62.5 101.0 116.5 58.5 19.0 5.0 0.0 0.0 3.0 3.8 45.7 16.0 431.01962 39.4 6.6 22.0 36.0 1.5 0.0 0.0 0.0 11.0 0.0 69.5 82.6 268.61963 100.6 12.0 36.5 105.1 12.6 5.0 0.0 0.0 0.0 40.7 52.0 71.0 435.51 964 50.4 9.9 5.5 1.7 0.0 0.0 0.0 0.0 0.0 37.0 111.8 31.2 247.51965 48.5 14.0 2.5 18.0 0.0 0.1 0.0 0.0 0.2 1.0 77.3 11.2 172.8
1966 37.0 99.0 4.0 0.0 2.0 0.7 0.0 0.0 4.0 23.0 58.4 54.8 282.91967 144.0 139.0 9.6 0.0 0.0 0.0 0.0 0.0 0.0 1.2 28.4 24.6 346.81968 53.6 49.0 42.3 81.2 19.8 2.5 0.0 0.0 0.0 17.5 107.0 103.8 476.71969 27.9 68.3 108.6 23.0 14.0 0.0 0.0 0.0 0.0 60.0 50.0 55.3 407.11970 3.4 87.0 25.5 14.6 0.0 11.0 0.4 0.0 0.0 26.0 46,8 143.3 358.01971 129.6 26.8 7.4 33.0 21.0 0.0 0.0 0.0 13.7 54.6 89.7 19.8 395.61972 227.6 14.8 119.4 8.0 10.4 0.0 0.0 0.0 13.2 1.2 22.5 7.0 424.1
1973 30.5 33.0 8.9 19.0 0.0 0.0 0.0 0.0 26.5 91.8 40.4 92.0 342.1
1974 114.1 76.7 32.2 84.0 0.5 0.0 2.9 0.0 0.0 0.0 55.2 87.2 452.8
1975 207.5 75.0 67.3 71.0 22.2 0.0 0.0 0.0 0.0 0.0 37.4 141.2 621.6
1976 60.1 60.5 94.0 0.0 2.0 0.0 0.0 0.0 22.6 32.3 69.0 57.0 397.51977 73.0 150.0 154.7 0.0 2.5 0.0 0.0 1.2 33.8 9.0 25.0 81.0 530.2
1978 101.6 48.9 59.0 26.5 0.0 0.0 0,0 0.2 15.2 55.9 49.0 62.0 418.3
1979 33.1 21.0 59.0 0.0 6.0 0.0 0.0 18.0 0.0 67.0 12.0 106.0 322.1
1980 53.0 292.4 51.9 11.0 0.0 0.0 0,0 0.0 9.0 73.0 169.0 42.0 701.31981 212.0 62.2 56.1 13.8 0.0 0.0 0.0 0.0 0.0 8.5 15.0 33.5 401.1
1982 39.2 36.3 11.0 17.0 2.2 0.0 0.0 0.0 0.0 82.5 20.0 7.2 215.4
1983 49.0 18.5 84.3 1.5 7.0 2.0 0.0 1.0 0.3 11.6 58.0 61.4 294.61984 16.5 59.0 192.2 6.9 0.6 0.0 17.7 0.0 2.0 42.1 47.0 12.8 396.81985 22.6 19.4 2.4 0.0 22.0 0.0 0.0 0.0 0.0 28.8 0.0 72.5 167.7
1986 19.0 96.6 14.0 114.9 0.0 0.0 0.0 0.0 6.0 63.6 127.0 8.9 450.0
1987 60.1 39.8 50.0 8.5 0.0 0.0 0.0 0.0 4.8 5.0 25.4 254.1 447.7
1988 107.0 405.3 112.6 73.3 0.0 0.0 0.0 0.0 33.8 43.5 1.0 16.7 793.2
1989 93.9 70.8 21.8 50.4 0.0 17.5 0.0 0.0 0.0 17.0 48.0 8.6 328.0
1990 4.4 45.2 43.3 12.4 8.0 0.0 0.0 0.0 0.0 0.2 11.5 86.1 211.1
1991 85.8 71.0 124.0 0.0 0.0 37.0 0.0 0.0 0.0 27.0 40.0 89.0 473.8
1992 0.0 9.0 0.0 0.0 0.0 0.0 0.0 0.0 0.0 28.3 16.5 49.3 103.1
MEAN 803 71.,5 59.4 .25.1. 65 32 0,8 05 ' 75 255 52,6, 66.7 399.5
6 1 ,f 77,4 46i .305 10,8 A $.2 ZA 155 a4 419 504 L 1461

2.3 GEOLOGY AND LANDFORMS
Ratholo AEA is made up of three major landforms (see Map 2):
T - Tswapong HillsF - Footslopes of the TswapongM - Molapo plain
The northern half of the area is taken up by rolling, and in some places strongly dissected flat-topped hillsof the Tswapong range at an altitude of 1000-1150 m above sea level (as!). The hills are bisected by a2 km wide valley, which nuts from WNW to ESE. The valley is bounded by escarpments and its bottom(categorised as footslopes) lies about 100 m below the level of the hills. To the south, the Tswapong hillsare bounded by a steep escarpment of 100-150 m high which separates them from the footslopes and plainbelow. The footslope zone to the south of the Tswapong, is about 4 km wide and has an average slopeof less than 2 %. The southern half of the study area consists of a slightly undulating plain which verygentle slopes with a gradient of 0.5 % towards the south and south-east. Drainage on the plain is fromnorth to south through shallow, broad, almost invisible depressions. In addition to these drainage lines,small, circular depressions (pans) occur throughout the plain which may contain water during the rainyseason.
Information on the hardrock geology of the area is taken from Moeng Sheet of the Geological Survey ofBotswana at scale 1:125 000. The Tswapong hills consist of Quartzites (and possibly Andesites) of thePalapye Group which dates from the Middle Precambrian age. The footslopes of the Tswapong consistof recent alluvial and colluvial deposits derived by weathering from the Tswapong Quartzites andassociated rocks. The Molapo plain is underlain by Granitoid rocks of Early Precambrian age. Althoughcolluvial and alluvial processes have played an important role in shaping this plain, the material coveringthese plains is primarily residual in nature.
2.4 SOILS
2.4.1 Characteristics and distribution
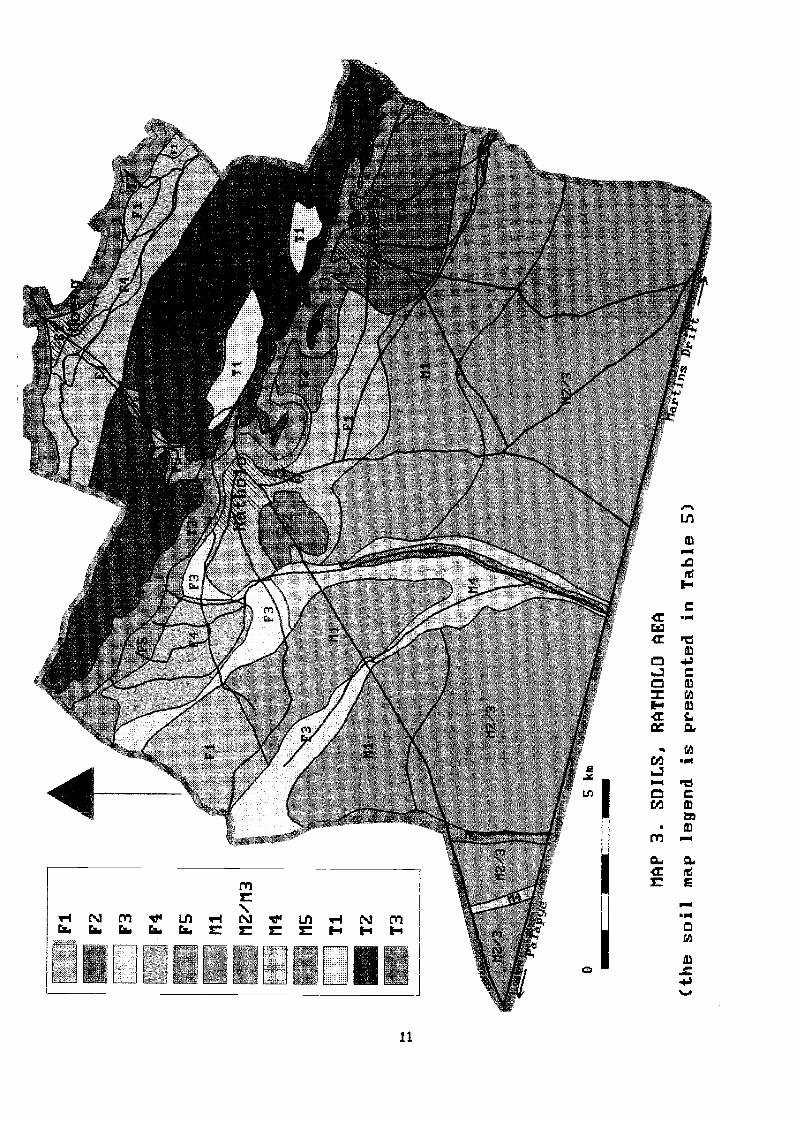
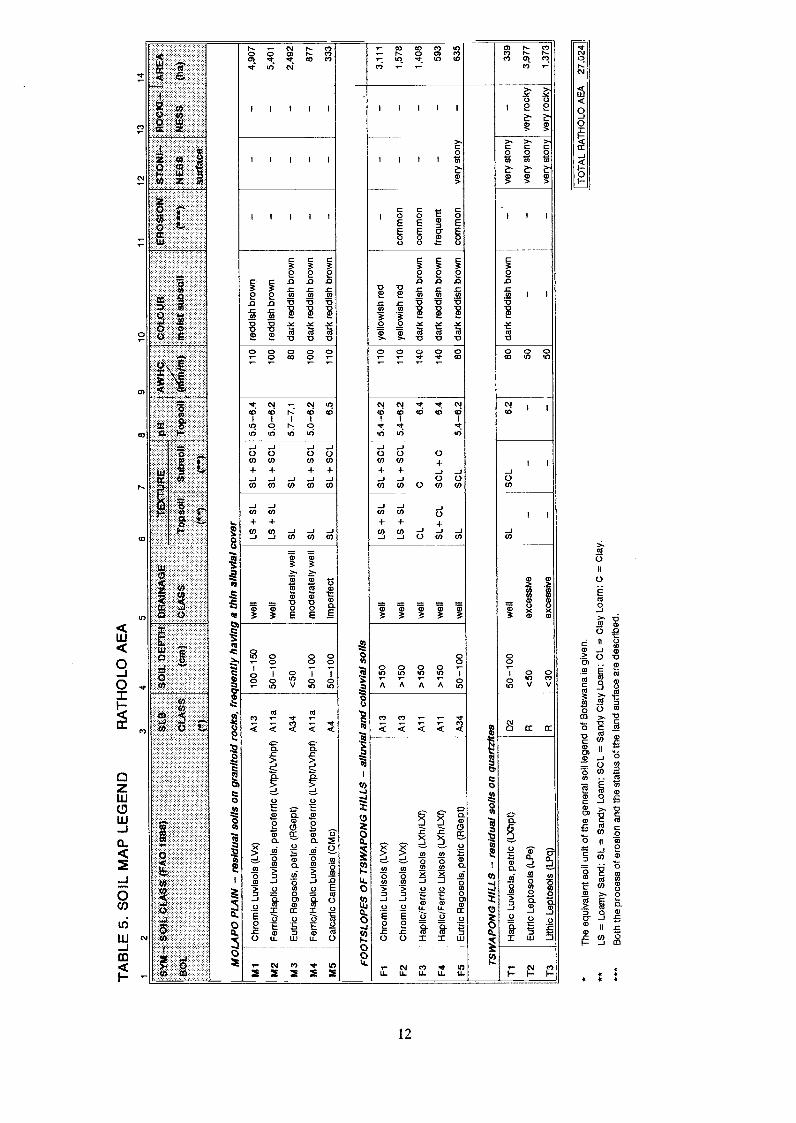
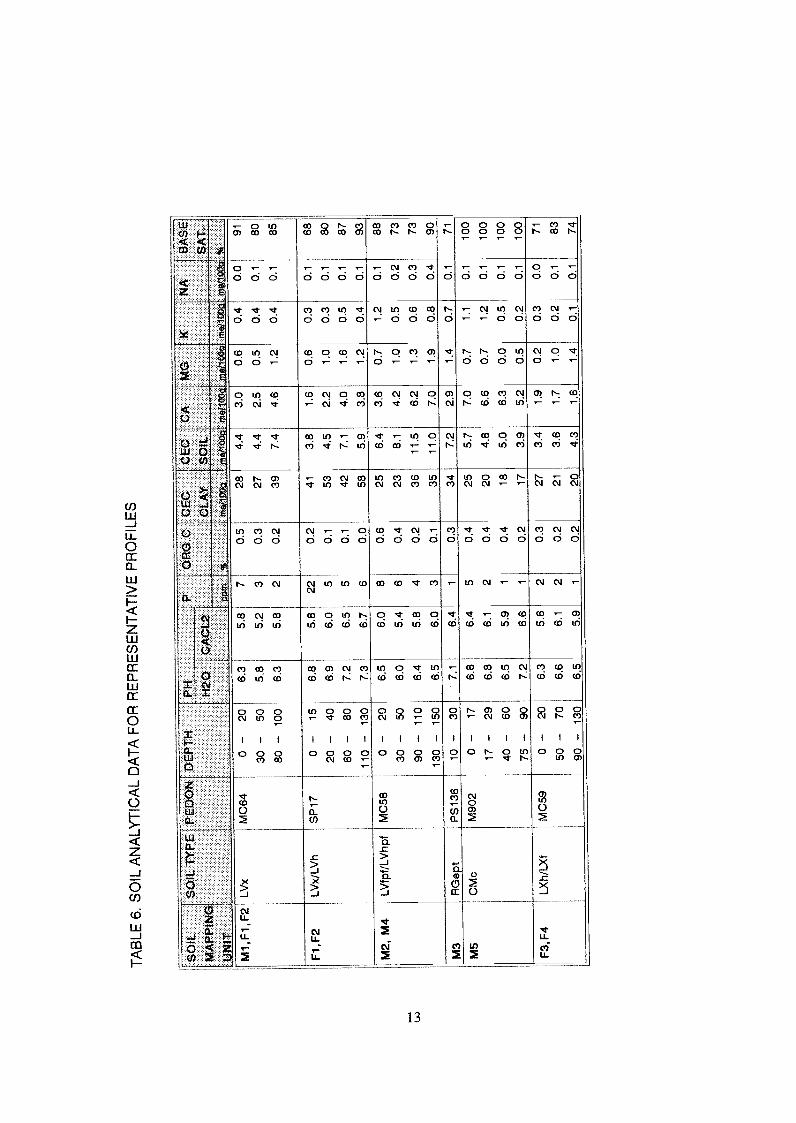
The distribution of soils in the Ratholo AEA is shown on Map 3. The main soil characteristics arepresented in the legend (Table 5). The map and legend are partly based on information derived from theSoil Map of Botswana, scale 1:250 000 (Remmelzwaal, 1989) and partly on data gathered by additionalfieldwork. Analytical data of representative soil profiles are given in Table 6.
The three major lancLscapes which were identified in Section 2.3, i.e. Molapo plain, Footslopes of theTswapong, and the Tswapong Hills, are again used for major subdivision. Homogeneous soil units havebeen mapped, which are different from each other in terms of characteristics most relevant for their use.Both inherent soil characteristics, such as depth and texture, and surface characteristics, such as slope anderosion status, have been used for separation of soils on the map.
- Soils of the Molapo plain
Most soils of the Molapo plain are medium textured (sandy loam over sandy clay loam), acid and havefree drainage. Only close to drainage ways is the drainage slightly impeded and do occasional flashfloods
9

H 0
o MAP 2. MAJOR LANDSCAPES, RATHOLD
AEA
(for
exp
lana
tion
SE
IBte
xt)
11
o
TA
BLE
5. S
OIL
MA
P L
EG
EN
DR
AT
HO
LO A
EA
4
The
equ
ival
ent s
oil u
nit o
f the
gen
eral
sol
i leg
end
of B
otsw
ana
is g
iven
.
LS =
Loa
my
San
d; S
L =
San
dy L
oarn
; SC
L =
San
dy C
lay
Loam
; CL
= C
lay
Loam
; C =
Cla
y.
Bot
h th
e pr
oces
s of
ero
sion
and
the
stat
us o
f the
land
sur
face
are
des
crib
ed.
7
TO
TA
L R
AT
HO
LO A
EA
27,0
24
BO
L
A
CLA
SS
01 O
EF
TH
(cm
)
UR
AIN
AG
ET
WW
E_ pH
Sub
soiL
Top
s
AA
RE
A
Top
ton'
)1
MO
LAP
O P
LAIN
resi
dual
soi
ls o
n gr
anito
ld r
ocks
, fre
quen
ly h
avin
g a
thin
allu
vial
Mi
Chr
omic
Luv
lsoi
s (L
Vx)
A13
100-
150
wel
lS
LS
L+
SC
L 5.
5-6.
411
0re
ddis
h br
own
4,90
7
M2
Fer
ric/I-
look
Luv
lsol
s, p
etro
ferr
Ic (
LVfp
f/LV
hpA
11a
50-1
00w
ell
SL
SL
+S
CL
5.0-
6.2
100
redd
ish
brow
n5,
401
M3
Eut
ric R
egos
ols,
pet
ric (
RG
ept)
A34
<50
mod
erat
ely
wel
lS
LS
L5.
7-7.
180
dar
k re
ddis
h br
own
2,49
2
M4
Fer
ric/H
aplic
Luv
lsol
s, p
etro
ferr
ic (
LVfp
f/LV
hpA
11a
50-1
00m
oder
atel
y w
ell
SL
SL
+S
CL
5.0-
6.2
100
dark
red
dish
bro
wn
677
5C
alca
nc C
ambl
sois
(C
Mc)
A4
50-1
00Im
perf
ect
SL
SC
L6.
511
0 da
rk r
eddi
sh b
row
n
FO
OT
SLO
PE
S O
F T
SW
AP
ON
G H
ILLS
allu
vial
and
co
luvi
al s
oils
Fi
Chr
omic
Luv
lsol
s (L
Vx)
A13
>15
0w
ell
LS+
SL
SL
+S
CL
5.4-
6.2
110
yello
wis
h re
d3,
111
F2
Chr
omic
Luv
lsol
s (L
Vx)
A13
150
wel
lLS
+S
LS
L+
SC
L 5.
4-6.
211
0ye
llow
ish
red
com
mon
1,57
8
F3
Hoo
k/F
erric
Lix
isol
s (L
Xh/
LXf)
A11
>15
0w
ell
CL
C6.
414
0da
rk r
eddi
sh b
row
nco
mm
on1,
408
F4
Hap
lIc/F
errI
c U
xiso
ls (
LXh/
I-X
f)A
11>
150
wel
lS
L+ C
LS
CL
+C
6.4
140
dark
red
dish
bro
wn
freq
uent
593
F5
Eut
rlc R
egos
ols,
pet
rIc
(RG
ept)
A34
50-1
00w
ell
SL
SC
L4-
6.2
80 d
ark
redd
Ish
brow
nco
mm
onve
ry s
tony
635
TS
AP
ON
G H
ILLS
resi
dual
soi
ls o
n qu
artz
ltes
Ti
Hoo
k Lu
vlso
ls, p
etric
(LX
hpt)
D2
50-1
00w
ell
SL
SC
L62
80 d
ark
redd
ish
brow
nve
ry s
tony
339
T2
Eut
ric L
epto
sols
(LP
e)R
<50
exce
ssiv
e50
very
sto
ny v
ery
rock
y3,
977
T3
Uth
Ic L
epto
sols
(LP
q)R
<30
exce
ssIv
e0
very
sto
ny v
ery
rock
y1,
3731
810
1112
1314
** ***
TA
BLE
6. S
OIL
AN
ALY
TIC
AL
DA
TA
FO
R R
EP
RE
SE
NT
AT
IVE
PR
OF
ILE
S
eve,
» A
rti
f!C1P
r t
("P
rM
GSO
IL1.
..)11
.I T
rt r
muu
r4r
t.mr
irt
VII
r...
. I .
MA
PP
ING
H20
CA
CL
2C
LA
YSO
IL'
SAT
.
'
UN
ITM
C64
0 -
205.
8
:
7
ni1
28
ni
4.4
m 1
ni10
0ni
i%
,
MI ,
Fl ,
F2
LVx
6.3
0.5
3.0
0.6
0.4
0.0
91
30 -
505.
85.
23
0.3
274.
42.
50.
50.
40.
180
80 -
100
6.3
5.8
20.
239
7.4
4.6
1.2
0.4
0.1
85
Fl ,
F2
LVx/
LVh
SP
17
0 -
156.
85.
822
0.2
413.
81.
60.
60.
30.
168
20 -
406.
96.
05
0.1
534.
52.
21.
00.
30.
180
60 -
807.
26.
55
0.1
427.
14.
01.
60.
50.
187
110
- 13
07.
36.
76
0.0
585.
93.
81.
20.
40,
193
M2,
M4
LVf p
f/LV
hpf
MC
580
-20
6.5
6.0
80.
625
6.4
3.6
0.7
1.2
0.1
88
30 -
506.
05.
46
0.4
238.
14.
21.
00.
50.
273
90 -
110
6.4
5.8
40.
236
11.5
6.2
1.3
0.6
0.3
73
130
- 15
06.
56.
03
0.1
3511
.07.
01.
90.
80.
490
M3
RG
ept
PS
136
10 -
307.
16.
41
0.3
347.
22.
91.
40.
70.
171
M5
CM
cM
902
0 -
176.
86.
45
0.4
255.
77.
00.
71.
10.
110
0
17 -
296.
86.
12
0.4
204.
86.
60.
71.
20.
110
0
40 -
606.
55.
91
0.4
185.
06.
30.
00.
50.
110
0
75 -
907.
26.
61
0.2
173.
95.
20.
50.
20.
110
0
F3,
F4
LXh/
LXf
MC
590
-20
6.3
5.6
20.
327
3.4
1.9
0.2
0.3
0.0
71
50 -
706.
66.
12
0.2
213.
61.
71.
00.
20.
183
90 -
130
6.5
5.9
10.
220
4.3
1.6
1.4
0.1
0.1
74
14
occur. A petroferric2 or gravelly layer occurs universally in the soil profile, at a depth of less than 50 cmin the south, 50-100 cm in the central plain and at more than 100 cm depth towards the north. The depthof this layer has been used as the main criterion for subdivision of soils in the plain. Most soils derivefrom residual material of the underlying granitoid rocks and are moderately weathered and leached(depleted of nutrients). They mainly classify as Ferric or Haplic Luvisols, petroferric phase (FAO, 1988).
- Soils of the Footslopes
The soils of the footslopes of the Tswapong Hills are medium (sandy loatn over sandy clay loam) or finetextured (clay loam over clay), acid and freely drained. They are situated on gentle slopes (1-2 %gradient), have no stones at the surface and are very deep (no impediment to root development). Onlyclose to the northern escarpment do the soils occur on somewhat steeper slopes, and are locally stony andshallow. Rill and sheet erosion is a frequent phenomenon in the footslopes, and its presence has been usedas a criterion for subdivision on the soil map. These soils have developed in alluviated weatheringmaterials derived from the Tswapong Quartzites and related rocks and are moderately weathered andleached. They classify as Chromic Luvisols and Haplic or Ferric Lixisols (FAO, 1988).
- Soils of the Tswapong Hills
The soils of the Tswapong hills are mostly (very) shallow and very stony. Rock outcrops occur frequently.These soils classify as Leptosols (FAO, 1988). Gently sloping (2-4 % gradient) areas with deeper soiloccur in some places. These soils are medium textured and well drained and classify as Haplic Luvisols,petric phase (FAO, 1988).
2.4.2 Soil degradation
Three types of soil degradation are widespread in Ratholo AEA:
Sheet and rill erosionSplash erosionCrusting and loss of topsoil structure
A combination of sheet and rill erosion occurs in the footslopes of the Tswapong hills. Very locally sotnerills have developed into gullies. An area of about 4,200 ha is affected (mapping units F2, F3, F4 and F5on Map 3), about 15 % of which seriously (mapping unit F4). The erosion is the result of a decline of theprotective vegetative cover and a loss of topsoil structure, caused by overgrazing and deforestation. Withthe natural protection partly removed, large amounts of water discharge from the hillsides after downpours,having a strong erosive effect on the gently sloping footslopes.
Splash erosion is widespread throughout Ratholo AEA, both in grazing areas and on farmers' fields.Wherever the vegetative cover is poor, direct impact of raindrops causes a redistribution of finer particleson the surface, which leads to deterioration of topsoil structure and to sealing. The net loss of topsoilwithin a catchment is probably limited due to rapid re-deposition of soil particles on the very gentle toalmost flat slopes.
2 Gravelly and sometimes cemented material with a high content of iron oxides
Topsoil deterioration and crusting is very widespread in the area, particularly in farmers' fields and inintensively grazed rangeland. Because of a loss of topsoil structure, crusts of 1-2 mm thick will form afterheavy rainfall, sealing off the soil surface. In the dry season topsoil crusts are hard, in the rainy seasonthey are less conspicuous. In farmers' fields crusts are regularly broken by cultivation and are thereforeless well developed. There are many causes for topsoil deterioration: in cultivated fields it is mainlythrough repeated ploughing, nutrient extraction through harvesting, and sheet and splash erosion; onintensively grazed rangeland it is mainly through reduced leaf and litter fall, trampling and erosion.
2.5 LAND COVER AND PRESENT LAND USE
2.5.1 Land cover
The Vegetation Map of South East Botswana at scale 1:500 000 by Timberlake (1980) was used as aguide, but field observations constitute the main source of information for this Section.
2.5.1.1 Vegetation zones
The vegetation in the area is affected in varying degrees by land clearing for arable farming, felling oftrees for construction, collection of wood for fuel, and grazing and browsing by domestic animals. Threevegetation zones are distinguished in the area. They largely coincide with the major landscapes describedin Section 2.3 and shown on Map 2. The subdivision is based on differences in composition of tree andshrub species and on the degree of influence by man:
- Shrub savanna of the Molapo plains
About 50 percent of the Molapo plains is cleared of woody vegetation for arable farming, while theremainder of this zone is dominated by low stands of pioneer species and other invading species(Colophospermum mopane and Acacia tortilis) or species selectively maintained by farmers for theirusefulness (C. mopane for phane worm, Sclerocarya caffra for morula fruits and Boscia albitrunca forshade and browse). The shrubs reach a height of usually not more than two to three meters, except for theremaining inorula trees which easily reach ten meters. Shrub density is usually between 10 and 20 percentground cover. The area is heavily grazed and browsed mainly during the dry season. The shrub layer isdominated by C. mopane which often represents more than 50 percent of the woody vegetation andsoinetimes occurs in almost pure stands. B. albitrunca, A. tortilis, S. caffra, Grewia flava andDichrostachys cinerea also occur frequently. Less frequent species include Combretum apiculatum, Acaciaerubesc ens, A. ntellifera, A. nigrescens, Peltophorum africanum and Adansonia digitata.
- Tree and shrub savanna of the footslope zones of the Tswapong hills
The footslope zone is characterised by very deep and freely drained soils. Grazing is the main land use,with tree felling and bush clearing only important close to the villages. Trees and shrubs are generallytaller (commonly up to seven meters) than in the lands areas of the Molapo plain. Tree and bush densityvaries between 20 and 50 percent ground cover. The species composition is largely the same as for theplains area, although C. mopane occurs less frequently and dominates with species such as G. flava, A.tortilis and C. apiculatum. In addition to the species listed for the plains area, Albizia anthelminthica, A.harveyii, Lonchocarpus capassa, Xanthocercis zambesiaca, Ximenia americana, Commiphorapyracanthoides and Cassia breviata also occur.
15

- Hill woodland of the Tswapong hills
Grazing and browsing is the only land use in the Tswapong Hills, together with collection of wood andother veld products. Density and height of vegetation varies much (between 20 and 70 percent groundcover), mainly as a function of soil depth and the occurrence of rock outcrops. Dominant species includeAcacia nigrescens, A. erubescens, Dichrostachys cinerea, Combretum apiculatum and Peltophorumafricanum. Other commonly occurring species are Grewia flavescens, Kirkia acuminata, Zizyphusmucronata, Colophospermum mopane, Boscia albitrunca, Ximenia americana and Terminalia prunoides.
2.5.1.2 Grass cover
Gra,ss cover is good to fair during the rainy season and pmctically absent during the later part of the dryseason. Grazing livestock, termites and natural mortality of aimual species are the main reasons for thesharp decline of grass cover after the rainy season. Grass cover during the rainy season, both in terms ofspecies composition and density of the stand, is strongly dependent on recent land use changes, degreeof grazing and proximity of trees. It therefore varies over short distances and can change also fairly rapidlyover time. The main grass species encountered include Eragrostis biflora, E. rigidior, E. superba, Tragusberteronianus, Setaria sp., Urochloa trichopus, Dactyloctenium aegyptyium, Enneapogon cenchroides,Eustachys paspaloides, Panicum maximum, Digitaria milanjiana, Cenchrus ciliaris, Aristida congesta,Rhyncelytrium repens and Juncus sp. Echinocloa holubii is found in pans and along water courses.
Grasses occur in a remarkable pattern which is consistently found in all three vegetation zones. The moredesirable species (e.g. U. trichopus, D. milanjiana, E. paspaloides) occur frequently under trees andshrubs, but are uncommon in areas without a canopy of woody vegetation. In open spaces, less desirablespecies (e.g. T berteronianus, E. rigidior, A. congesta, Juncus sp.) are found. The poor grazing conditionsaway from canopy are enhanced by the low density of grasses (20-50 % ground cover). Directly undertrees and shrubs, grass density approaches 100 % ground cover. This dependence on canopy cover causesthe good-fodder species to occupy not more than 20 percent of the land in most areas. The determiningfactor lies probably in the quality of the topsoil: under the trees the soil is higher in organic matter andnutrients (notably nitrogen) and less crusted (better aeration and higher infiltration) than out in the open.The reasons for this pattern are to be found in differences in trampling by cattle, grazing intensity, sheetand splash erosion, temperature, leaf and litter fall, and seed germination.
The main agricultural weeds found in the area are Abutilon austro-africanum, Hibiscus meeusei("rnmabasete"), Ipomoea obscura ("motantanyane" or "motsididi"), Eragrostis rigidior, Striga asiatica("matabele" or "molelwana"), and "mabetsane" (scientific name not identified).
2.5.2 Present land use
Present agricultural land use in Ratholo AEA is classified in four categories of major land use:
Arable fanning (rainfed)Extensive grazing and browsingCollection of veld products, fuel wood and polesIrrigated farming
The distribution of arable farming is presented on Map 4 and summarised in Table 7 in relation to otherland uses. For a description of the present fan-ning systems see Chapter 3.
16
I
la+lb+lc
id
2 3
oSk
rero
e
MAP 4. ARABLE LANDS AND GRAZING
LANDS, RATHOLO AEA
(see Table 7
forexplanation
ofsymbols)
TA
BLE
7. S
UB
DIV
ISIO
N IN
MA
JOR
LA
ND
US
ES
, FtA
TH
OLO
AE
A
(LA
N
laC
ultiv
ated
fiel
ds (
1992
/93)
lbA
reas
cle
ared
of w
oody
vege
tatio
n; fa
llow
1cM
inor
are
as o
f sec
onda
ry g
row
th,
in b
etw
een
farm
ers'
fiel
dsld
Maj
or a
reas
of s
hrub
sav
anna
,us
ed fo
r w
inte
r gr
azin
g
2. C
OM
MU
NA
L G
RA
ZIN
G A
RE
A
AR
EA
PO
RT
ION
PO
RT
I ON
OF
OF
AE
ALA
ND
S A
RS
A(9
4)(%
)
3,88
4
4,65
6
3,66
0
3,84
0
AD
= A
gric
ultu
ral D
emon
stra
tor
AP
s =
Aer
ial P
hoto
grap
hsD
RP
= D
roug
ht R
elie
f Pro
gram
me
GIS
= G
eogr
aphi
cal I
nfor
mat
ion
Sys
tem
AV
EG
EA
RE
A/ A
RM
ED
AT
AU
CE
.i:
Kita
PS
, GIS
1424
5.8
DR
P R
egis
trat
ion
1729
7.0
AP
s es
timat
e
1423
AP
s es
timat
e
1424
AP
s, G
IS
:, 2
7:02
3"""
.T
OT
AL
RA
TH
OLO
AE
A
..
3. B
UIL
TU
P A
ND
AS
SO
CIA
TE
D A
RE
AS
471
.::
s, M
aps,
GIS
19
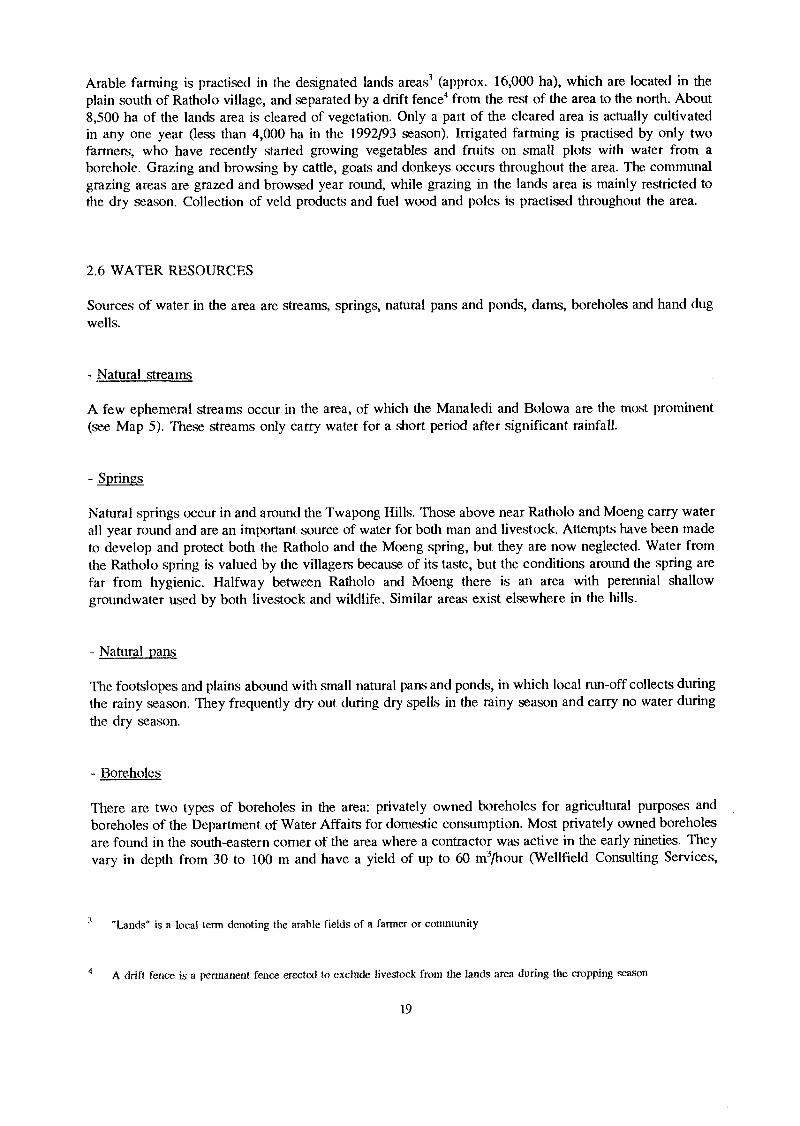
Arable farming is practised in the designated lands areas' (approx. 16,000 ha), which are located in theplain south of Ratholo village, and separated by a drift fence from the rest of the area to the north. About8,500 ha of the lands area is cleared of vegetation. Only a part of the cleared area is actually cultivatedin any one year (less than 4,000 ha in the 1992/93 season). Irrigated farming is practised by only twofarmers, who have recently started growing vegetables and fruits on small plots with water from aborehole. Grazing and browsing by cattle, goats and donkeys occurs throughout the area. The communalgrazing areas are grazed and browsed year round, while grazing in the lands area is mainly restricted tothe dry season. Collection of veld products and fuel wood and poles is practised throughout the area.
2.6 WATER RESOURCES
Sources of water in the area are streatns, springs, natural pans and ponds, dams, boreholes and hand dugwells.
Natural streatns
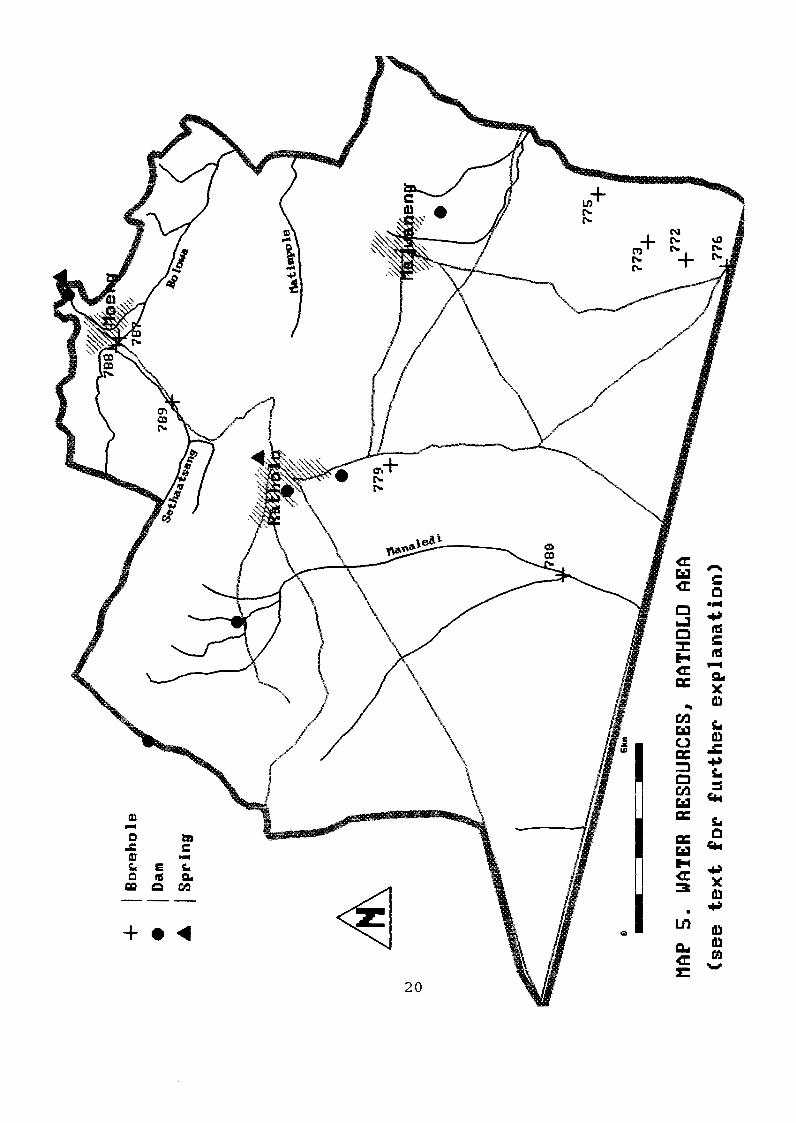
A few ephemeral streams occur in the area, of which the Manaledi and BoIowa are the most prominent(see Map 5). These streams only carry water for a short period after significant rainfall.
Springs
Natural springs occur in and around the Twapong Hills. Those above near Ratholo and Moeng carry waterall year round and are an important source of water for both man and livestock. Attempts have been madeto develop and protect both the Ratholo and the Moeng spring, but they are now neglected. Water fromthe Ratholo spring is valued by the villagers because of its taste, but the conditions around the spring arefar from hygienic. Halfway between Ratholo and Moeng there is an area with perennial shallowgroundwater used by both livestock and wildlife. Similar areas exist elsewhere in the hills.
Natural pans
The footslopes and plains abound with small natural pans and ponds, in which local run-off collects duringthe rainy season. They frequently dry out during dry spells in the rainy season and carry no water duringthe dry season.
Boreholes
There are two types of boreholes in the area: privately owned boreholes for agricultural purposes andboreholes of the Department of Water Affairs for domestic consumption. Most privately owned boreholesare found in the south-eastern corner of the area where a contractor was active in the early nineties. Theyvary in depth from 30 to 100 m and have a yield of up to 60 m3/hour (VVellfield Consulting Services,
" is a local tenn denoting tlie arable fields of a farmer or cornmunity
4 A drift fence is a permanent fence erected to exclude livestock from the lands area during the cropping season
N 0
I Bor
ehol
eI D
am
1 S
prin
g
MAP 5. WATER RESOURCES, RATHOLO AEA
(see text for further explanation)

1992). Some of these boreholes have a diesel pump, others are hand-operated. Two boreholes are usedfor small-scale irrigation. Water is frequently sold by borehole owners to farmers for watering of livestock.
Rath°lo village has piped water supplied by borehole in the Twapong Hills halfway between Ratholo andMoeng. Similarly, Majwaneng village is serviced by a borehole situated outside the study area, halfwaybetween Majwaneng and Lerala. Moeng derives its water from a few boreholes situated south of theCollege .
Hand-dug wells
There are an unlcnown number of several deep hand dug wells (10 meter or more) throughout the plainarea. They are important for both people and livestock as a source of drinking water. Most of them rundry in September/October.
Dams
There are five small dams in the study area, one of which is situated at the border with Gootau AEA.They were built to provide drinking water for livestock. They consist of earth walls thrown up aroundnatural depressions and can only hold a shallow depth of water. All run dry around August and althoughuseful, are ineffective in taking livestock through the dry season. Some have fallen in disrepair. Thefootslopes and plains of Ratholo AEA have very few good dam sites, because of its flat topography.Above Moeng College there is a concrete dam holding water from a perennial spring. The dam was onceused for irrigation and domestic purposes, but is now neglected and used by roaming cattle and wildlifeonly.
Water catchment tanks
A few farmers have installed underground tanks at their lands for rainwater harvesting. Water caught inthese tanks is meant to supply drinking water for the farmer and draught animals to facilitate earlyploughing. Such tanks are part of the ALDEP package.
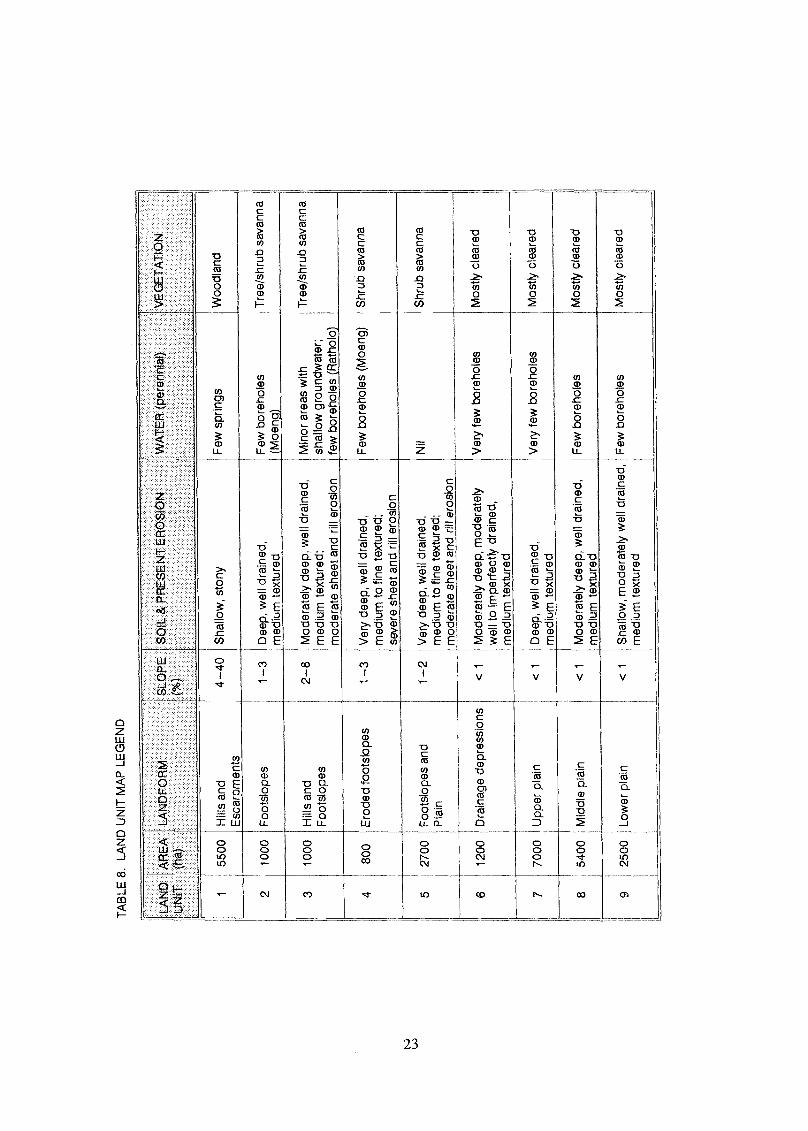
2.7 LAND UNITS
Land Units (LUs) are ateas which are relatively homogeneous in terms of landform, soil, vegetation andavailability of perennial water. LUs form the basis for land evaluation (Chapter 5) and RecommendedLand Use (Chapter 7). Nine different LUs have been distinguished for Ratholo AEA. They are listed anddescribed in Table 8 and depicted on Map 6.
21

MA
P 6.
LA
MD
UN
ITS,
RA
TH
ER
.° A
EA
(for
exp
lana
tion
see
Tab
le E
)
r
2
TA
BLE
8. L
AN
D U
NIT
MA
P L
EG
EN
D
LAN
DU
NIT
AR
EA
(ha)
LAN
DF
OR
MS
LOP
ES
OIL
PR
ES
EN
T E
RO
SIO
NW
AT
ER
(pe
renn
ial)
VE
GE
TA
TIO
N
5500
Hill
s an
dE
scar
pmen
ts4-
40S
hallo
w, s
tony
Few
spr
ings
Woo
dlan
d
210
00F
oots
lope
s1-
3D
eep,
wel
l dra
ined
,m
ediu
m te
xtur
edF
ew b
oreh
oles
(Moe
ng)
Tre
e/sh
rub
sava
nna
1000
Hill
s an
dF
oots
lope
s2-
8M
oder
atel
y de
ep, w
ell d
rain
ed,
med
ium
text
ured
;m
oder
ate
shee
t and
rill
e o
s on
Min
or a
reas
with
shal
low
gro
undw
ater
;fe
w b
oreh
oles
(R
atho
lo)
Tre
e/sh
rub
sava
nna
480
0E
rode
d fo
otsl
opes
1-3
Ver
y de
ep, w
ell d
rain
ed,
med
ium
to fi
ne te
xtur
ed;
seve
re s
heet
and
rill
ero
sion
Few
bor
ehol
es (
Moe
ng)
Shr
ub s
avan
na
527
00F
oots
lope
s an
dP
lain
1-2
Ver
y de
ep, w
ell d
rain
ed,
med
ium
to fi
ne te
xtur
ed;
Nil
Shr
ub s
avan
na
mod
erat
e sh
eet a
nd n
h er
osio
n
612
00D
rain
age
depr
essi
ons
Mod
erat
ely
deep
, mod
erat
ely
wel
l to
impe
rfec
ty d
rain
ed,
med
ium
text
ured
Ver
y fe
w b
oreh
oles
Mos
tly c
lear
ed
770
00U
pper
pla
in<
1D
eep,
wel
l dra
ined
,m
ediu
m te
xtur
edV
ery
few
bor
ehol
esM
ostly
cle
ared
854
00M
iddl
e pl
ain
Mod
erat
ely
deep
, wel
l dra
ined
,m
edlu
m te
xtur
edF
ew b
oreh
oles
Mos
tly c
lear
ed
925
00Lo
wer
pla
in<
1S
hallo
w, m
oder
atel
y w
ell d
rain
ed,
med
ium
text
ured
Few
bor
ehol
esM
ostly
cle
ared
CHAPTER 3
SOCIO-ECONOMIC CONDITIONS
3.1 POPULATION
The total population of Ratholo and Majwaneng villages and associated localities was 4,563 persons in1991 (Central Statistics Office, 1992), 55 percent of then1 female and 45 percent male. Assuming anannual population increase of 3.3 percent, the 1994 total population is estimated at 5,031 persons or about840 families (assuming an average family size of 6 persons (Division of Planning and Statistics, 1991).See Table 9. An additional 173 people were registered in Moeng College in 1991.
The number of registered farmers in 1993/1994 cropping seäson, i.e. farmers registered for drought relief,totals 668 farmers (713 farmers in the 1992/93 season). The average farmer's age is 49.2 years. Abreakdown of the farm population in age groups is presented in Table 10. Eighty two percent of thoseregistered are female.
Three main conclusions can be derived from these statistics:
The majority of households (80 percent) is involved in arable fanning.The majority of farm households (82 percent) is de-facto headed by a female. Many males(notably the younger ones) are not permanently based in the village but have soughtaltemative employment elsewhere.The average farmer's age is high (49.2 years).
The majority (estimated 80 percent) of farmers reside in the villages of Ratholo and Majwaneng. Theremainder reside on their land. All farmers have lands areas within Ratholo AEA, the very few withoutland share with others. Only very few farmers in Ratholo AEA reside in sun-ounding villages locatedoutside the AEA. The majority of farmers maintain a second dwelling on their lands. The distance fromhomestead to lands varies from a few hundred meters to up to 10 km.
3.2 LAND TENURE AND LEGISLATION
Under customary law, every tribesman is entitled to sufficient land to meet his subsistence needs forhousing and arable farming. Housing compounds and arable fields may be fenced to preclude other peopleor other people's livestock. Every tribesman has also open access to the communal grazing lands and tosuiface water for feeding and watering his livestock.
All land in Ratholo AEA is communally owned. Housing compounds and arable fields have been allocatedby the chief in the past. Formal land certificates, issued by the Land Board, are held by only fewinhabitants who have major investments on their land (e.g. boreholes). In some cases grazing areas ofconsiderable size are included in the fenced-off areas leading to de-facto reservation of land for dry seasongrazing of the own herd.
25
3.3 GROUPS OF FARMERS
Farmers have been stratified into four homogeneous groups on the basis of fartn size and livestockownership:
1 Farmers in group 1 own no cattle and no donkeys. They depend on hired or borroweddraught power for ploughing. They practice arable farming for food subsistence. Farm sizeis 1-4 ha. They often own up to 10 goats. This group includes 20 percent of farmers.
2 Farmers in group 2 own some draught animals but have to hire or borrow additionalanimals to plough. They own between 1 and 10 cattle and no donkeys or no cattle but 3or less donkeys, and have a small income from livestock. These farmers practice arablefarming for food subsistence. Farm size is 3-6 ha. In addition they usually have 10-20goats. Stock is based in the communal grazing area near the villages. This group includes40 percent of farmers.
Farmers in group 3 have their own draught power and have some income from livestock.They depend on arable farming (farm size 7-10 ha) for food subsistence, and own between10 and 20 cattle or less than 10 cattle and at least 4 donkeys. In addition they usuallyhave 10-40 goats. Cattle is mainly based at cattle posts elsewhere. This group includes 32percent of farmers.
4 Farmers in group 4 own 20 to 40 cattle (5 percent of farmers) or more than 40 head ofcattle (3 percent of farmers), which are permanently based at cattle posts. Other livestockvaries in number. They often practice arable farming (fann size >8 ha) for foodsubsistence. The total percentage of farmers included in this group is 8.
Farmers practicing (small-scale) irrigated agriculture number only two at present, and started operationsin 1993.
3.4 FARMING SYSTEMS
The prevalent farming system has three components: livestock grazing, arable farming and collection ofveld products. 'There are sotne obvious linkages between the livestock and arable cropping components.Significant in this respect are the grazing by livestock of crop residues and weeds which are left in farmersfields after harvesting, the application and deposition of limited amounts of manure in the fields, and theprovision of traction by oxen and donkeys for ploughing and transport.
Agriculture accounts only for a part of the income of the average household in the area. In the prevailingpattern, sotne family members preserve the subsistence agricultural base in the village, while often theyounger or better trained seek paid employment elsewhere. The amount of time and money spent onfarming by individuals and households depend mainly on whether retums from farming can be expectedto be higher than from other gainful activities.
3.4.1 Arable farming
Arable farming is rainfed and involves the cultivation of a mix of crops. The main crop is sorghum, growntogether with millet, tnaize, vegetables and pulses. Crops are mainly grown for subsistence. Yields areusually low, but in a good year surplus is marketed. The cropping season lasts from Novetnber through

27
May. The amount of land cultivated varies from year to year, mainly as a function of the amount anddistribution of the rainfall during the season.
3.4.1.1 Farm size
The area cultivated per farmer varies from year to year. In the 1993/94 season, 668 farmers ploughed upa total area of 3,884 ha or an average of 5.8 ha per farmer. This is only about half of the area cleared ofvegetation for cultivation. It follows that enough land in the AEA is cleared for cultivation.
Farm size (i.e. area ploughed per year) varies from 1 to 12 ha. Farmers are approximately evenlydistributed over three farm size classes: 1-4, 5-8 and 9-12 ha. See Table 11.
3.4.1.2 Farming operations and labour use
A very large majority of arable farmers (estimated 99 percent) practice a traditional method of landpreparation and cultivation, i.e.:
1 Broadcasting of a mixture of seeds of subsistence crops on unprepared soil, followedimmediately by ploughing by either draft animals or tractor.
2 One time weeding by hoe, thirty to forty days after sowing.3 Bird scaring.4 Harvesting.
The timing in the year of each of these operations (seeding and ploughing taken as one operation), asobserved during the 1992/93 season, is included in Figure 1. The time at which an individual farmer startsploughing depends on many factors: rainfall pattern, availability of draughtpower and inputs, availabilityof labour, and tradition. During the 1994/95 season the Ministry of Agriculture advised farmers to ploughand plant with the first rain after Botswana Day (30 September). This advice was repeated by the Chiefof the area, who officially opened the growing season in the first week of October. And indeed, in 1994,some farmers ploughed as early as the last week of October5. On the other hand, some farmers may delayploughing until February. Farmers often carry out several broadcasting/ploughing operations during oneseason in adjacent plots, using several planting opporttmities during the rainy season.
In the 1992/93 season, which was a season when drought relief was in operation, an estimated 50 %of farmers used their own animals or hired animals for traction for ploughing while the remaining 50 %hired a tractor. In other years the percentage of farmers hiring tractors is very much lower. Both donkeysand cattle are used for ploughing in spans of four to eight animals. Male animals are preferred. Anestimated 60 % of farmers do not own enough animals for traction. An estimated 70 percent of farmersown their own plough. There are many reasons for untimely ploughing, but shortage of draught power anda poor physical condition of draft animals at the end of the dry season are amongst them. Tractor servicesare usually provided on a first-come-first-serve basis, after the tractor owner has ploughed his own field.There are eight tractors within the area, all privately owned. Some additional tractors are hired fromcommercial farmers of the Tuli Block and from South Africa. Some farmers, seeking tractor services, haveto wait till January or February.
5 The crop failed, as it did not rain in November.
6 Drought relief comprises of direct assistance to farmers in the form of a subsidy and of community oriented projects, in times ofdrought. See also Table 30.

TABLE 9. POPULATION COMPOSMON, RATHOLO AEA (1994)
Based on population census data (1991) adapted for 1994 and on anatysis ofdrought relief data (1993/94)
TABLE 10. AGE DISTRIBUTION OF FARMERS
Based on analysis of drought relief data (1993/94)
TABLE 11. MAJOR CHARACTERISTICS OF FARMS, RATHOLO AEA(farm size, herd sizes, distribution of livestock and phane collection)
28
TOÎAL IEMÄLEni LMOMMAMMOMMEMUMni
TOTAL POPULATION 5031 2756 55 2275 45
HOUSEHOLDS 839 - - -FARM HOUSEHOLDS 668 551 82 117 18
Number 38 137 148 94 110 46 16
Percentage 6.5 23.3 25.1 16 18.7 7.8 2.7
MIXED CROPPING.
FarntSiZa eta) .TOTAL1-2 3-4 5-6 7-8 9-10 >10
Farms (number) 59 163 151 93 187 15 668
Farmers' distributi % 9 24 23 14 28 2 100i
CATTLE PRODUCTION Herd sae TOTAL0 1-10 11-20 21-40
Permanently based inside AEA (head) 0 1,400 0 0 0 1,400Seasonally based inside AEA (head) 0 0 400 100 100 600Permanently based outside AEA (head) 0 0 1,910 950 950 3,810All cattle owned by AEA farmers (head) 5810
Farmers' distribution (%) 30 40 22 5 3 100
GOAT PRODUCTION Herd Size TOTAL0 1-10 11-20 21-40
Permanently based inside AEA (number) 0 1,750 1,811 735 4,296Permanently based outside AEA (number) 0 0 604 735 1,339
Farmers' distribution (%) 20 50 23 7 100
DONKEY PRODUClION Herd size TOTAL1-5 6-10 11-15
Permanently based inside AEA (number) 0 350 490 420 1,260
Farmers' distribution (%) 60 25 10 5 100
PHANE COLLECTION Farmers Farmers TOTALinvolved not invOlved
Estimated farmers involved (number) 534 134 668
Farmers' distribution (%) 80 20 100

FIGURE 1. LAND USE CALENDAR AND LABOUR USE, OF PATTERN FARMS, RATHOLO AEA *
CD 30E
o
>, 20
E
3 ha farm
Nmonths of the year
8 ha farm50
40
O
Livestock
Weeding
A
months of the year
Phane production M Seeding/ploughingLi71 Bird scaring r_Zil Harvesting
VA
* Pattern farms are defined in Chapter 6.Note: Only ploughing by animal traction is considered here.Note: All labour use in excess of 30 days is hired.
29
N D J A Amonths of the year
5 ha farm
50
40
o
>. 20E
10

35
30
COcc 25
CC
u_ 20U_
oluo< 15
LLIoCt
10a_
FIGURE 2. TIME LAPSE BETVVEEN SEEDING AND WEEDING (in days)*(by comparison of starting dates of operations)
30
10-19 20-29 30-39 40-49 50-59 60-69 70-79 No weedingDAYS
* Based on a sample of 35 farmers.
31
Most farmers practice weeding. It is done once using hand hoes, about thirty to forty days after sowing.This is a labour intensive activity, mostly carried out by woman and children. In Figure 2 the time lapsebetween seeding and weeding is depicted for a sample of 35 farmers.
Farming is a family activity. The "average" farmer is assisted by one close relative; children and otherrelatives may make a contribution during peak periods, but are often only available during holidays orweekends. Farmers with sufficient resources may try to hire labour during peak periods of ploughing,weeding and harvesting. Farm labour use for three typical farm sizes and for each of the farmingoperations mentioned above is presented in Figure 1. Labour use as shown in Figure 1 is for a farm runby two adults, assuming that ploughing is carried out with animal draught power. The Figure shows thatpeak labour demand is during the months of December and April, and that even a small farm can not bemanaged by one full-time farmer. There seems to be a lot of labour available during the period from Juneto October.
3.4.1.3 Crops
Typically, a farmer grows a mixture of crops, dominated by sorghum (var. Segaolane) with beans(Phaseolus vulgaris), jugobeans 7, melon and watermelon as dominant intermixed crops. Sorghumrepresents 90 percent of the plant cover. Maize and millet are also common grain crops, u,sually grownintermixed with sorghum. Other secondary crops are cowpea, groundnut and pumpkin. Lablab was grownas a fodder by one farmer in the 1992/93 season. Most crops are grown for subsistence. Grain cropsprovide staple food; beans, peas and fruits are grown to supplement the diet. Cowpea and pumpkin leavesare eaten as a vegetable. Watermelon is grown for consumption as a fruit and for beer brewing. Croprotation is not normally practised, since the majority of farmers grow a similar crop mixture every year.A few progressive farmers grow crops in single stands using rowplanters and practice a simple rotation.They follow an alternate-year rotation schedule: 1-millet/2-sorghum, or 1-beans/2-jugobeans, or 1-sorghum/2-beans, or 1-millet/2-beans (in which 1 = year 1 and 2 = year 2).
Crop yields are usually very low. In the 1992/93 season, an average of less than 100 kg of sorghum wasobtained from one hectare of mixed cropping in which sorghum was the dominant crop. Many farmersobtained no yield at all. Yields for selected farms for the 1992/93 season are presented in Table 12. Theseyields are the take-home yields as estimated by the farmer. Actual yields may have been somewhat higheras part of the crop is harvested and consumed during the ripening stage (e.g. green maize). Surplus, if itoccurs, is marketed through local traders or the Botswana Agricultural Marketing Board (BAMB).
Traditionally, seeds of crops are kept by farmers from the previous harvest. However, because of droughtrelief in recent years, farmers have become more and more dependent on seeds distributed free of chargeby the Government. In the 1994/95 season farmers with at least five hectares were entitled to 40 kgsorghum seed and 10 kg maize seed. Prices of inputs (seeds, implements etc.) and of saleable produce arepresented in the Annex (Tables Al and A4).
3.4.1.4 Soil fertility maintenance
Crops extract nutrients from the soil and have to be replenished to maintain productivity. In Ratholo AEAfew farmers deliberately maintain soil fertility. Livestock tnanure is rarely applied, even in cases wherekraal manure is readily available, and not much of the crop re-sidues are ploughed into the soil. In the1992/93 season only one farmer was encountered who ploughs stover into the topsoil after harvest. The
7Also known as Bambara groundnuts; scientific name: Vigna subterranea or Voandzeia subterranea
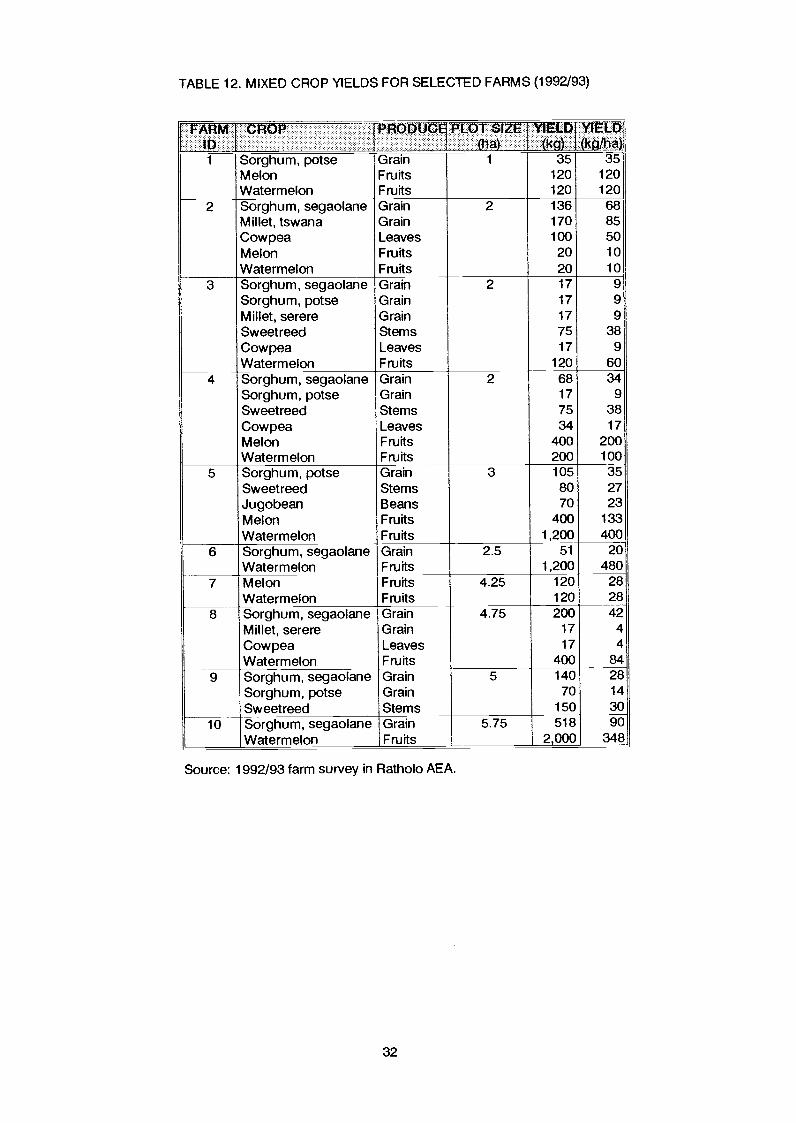
TABLE 12. MIXED CROP YIELDS FOR SELECTED FARMS (1992/93)
Source: 1992/93 farm survey in Ratholo AEA.
32
t
14
a k k /ha1 Sorghum, potse Grain 1 35 35
Melon Fruits 120 120Watermelon Fruits 120 120
2 Sorghum, segaolane Grain 2 136 68Millet, tswana Grain 170 85Cow pea Leaves 100 50Melon Fruits 20 10Watermelon Fruits 20 10
3 Sorghum, segaolane Grain 2 17 9Sorghum, potse Grain 17 9Millet, serere Grain 17 9Sweetreed Stems 75 38Cowpea Leaves 17 9Watermelon Fruits 120 60
4 Sorghum, segaolane Grain 2 68 34Sorghum, potse Grain 17 9Sweetreed Stems 75 38Cowpea Leaves 34 17Melon Fruits 400 200Watermelon Fruits 200 100
5 Sorghum, potse Grain 3 105 35Sweetreed Stems 80 27Jugobean Beans 70 23Melon Fruits 400 133Watermelon Fruits 1,200 400
6 Sorghum, segaolane Grain 2.5 51 20Watermelon Fruits 1,200 480
7 Melon Fruits 4.25 120 28Watermelon Fruits 120 28
8 Sorghum, segaolane Grain 4.75 200 42Millet, serere Grain 17 4
Cowpea Leaves 17 4
Watermelon Fruits 400 84
9 Sorghum, segaolane Grain 5 140 28Sorghum, potse Grain 70 14
Sweetreed Stems 150 3010 Sorghum, segaolane Grain 5.75 518 90
Watermelon Fruits 2,000 348
33
use of artificial fertilizer is practically absent, and nobody was seen to make compost. Occasional use offertilizer in the past was inspired by the free distribution through the Accelerated Rainfed ArableProgramme (ARAP).
3.4.1.5 Pests and diseases
Infestation of crops by pests varies strongly from year to year and from one area to the next The extentof the impact of pests is therefore difficult to quantify. The pests most frequently quoted by farmers arecomcricket and Quelea birds. Other common infestations are stalkborer, bollworm, stink bug, bagrada bug,ants, termites, beetles and aphids. Crop damage by cattle and goats as a result of inadequate fencing isalso common. Baboons are locally an important pest, particularly in the vicinity of the Tswapong Hills.Comcricket had a ruinous effect in many areas on the crop harvest of the 1992/93 season. Breeding sitesof Quelea are sprayed by Plant Protection Office (PPO) of the Department of Crop Production andForestry. No data are available on production losses as a result of pests and diseases.
3.4.2 Livestock production
Stock is kept through a system of extensive grazing in which the fodder base consists of untended naturalgrasslands and shrubs, fallow and harvest residues. Cattle are dominant but goats and donkeys are alsosignificant. Livestock is raised as a source of draught power and animal products (mainly milk), and forsale. Livestock also represents wealth and status.
3.4.2.1 Numbers and other main aspects
It is estimated that all farmers in Rath°lo AEA combined own 5,810 cattle, 5,635 goats and 1,260donkeys. Estimated livestock numbers by herd size are given in Table 11. The number of cattle kept inthe area permanently is estimated at 1,400. The remainder are kept outside the Rath°lo AEA at cattleposts, but some of these cattle are tracked back to the area for a short period after the harvest, taking thetotal number of cattle inside the AEA to about 2,000 during the period from May to August Most goatsand donkeys are kept inside the area all year round. It is important to note that the residents of RatholoAEA obtain income from livestock roatning a much larger area than Ratholo AEA alone.
Livestock numbers for the area are estimated from farm survey data and Agricultural Statistics of 1990(Division of Planning and Statistics, 1991). On the basis of the farm survey it is estimated that 30 % offarmers own no cattle, 40 % own 1 to 10 head of cattle, 22 % own 10 to 20 head, 5 % own 20 to 40 headand 3 % own more than 40 head (8). Extrapolation from these figures leads to a total estimate of 5,000to 7,000 head of cattle owned by farmers residing in Ratholo and Majwaneng. The Agricultural Statisticssupport the accuracy of this estimate. In 1990 there were 332,000 head of cattle in Serowe/Palapye Sub-District. For a total human population of 128,431 (Census 1991) there were about 2.5 head of cattle perperson in the area. This agrees well with the above estimate for Ratholo AEA, given the relative emphasison arable farming in the area. Numbers for goats and donkeys were estimated in a similar manner.
Birth rates for cattle naturally depend on the availability of feed and the general health of the cow, butranges between 27 and 50 percent depending on the year (Division of Planning and Statistics, 1992).
8 Stock census data (Jan/Feb 1993) based on vaccination campaigns give incorrect livestock numbers for the area (169 heads of cattle,347 goats and 83 donkeys distributed over 24 farmers)

Mortality varies widely according to occurrence of drought and outbreak of diseases, and lies between 4and 36 percent. Off-take rates vary between 5 and 10 percent.
Most of the cattle in the area is of local Tswana stock. Generally farmers are geared to herd expansion,mainly through natural increase. There are no catde posts inside Ratholo AEA. Large sca/e commerciallivestock production is not found in the area. Prices of inputs (feed, equipment etc.) and of saleableproduce (milk, stock) are presented in the Annex (Tables Al and A4).
3.4.2.2 Grazing patterns
Livestock is grazed on the range. Cattle depends on herbage and to some extent on browse. Goats and alsodonkeys rely to a large extent on browse. Grazing patterns and livestock movements in the area arecomplex and largely uncontrolled. During the rainy season most livestock is kept north of the drift fenceon comtnunal grazing lands, and further away from the villages at cattle posts outside Ratholo AEA, butsome livestock remains behind in the lands area, thus often causing damage to crops. Both grazing anddrinking water are normally adequate during the rainy season, although in poor rainfall yeats shortagesmay occur. After harvest of the crop, livestock is free to roam. Early in the dry season feed is ample inthe lands areas due to undergrazing during the preceding cropping season and due to crop residues leftin the fields. At this time of the year (May - August) some livestock is moved into the area from outlyingcattle posts. Later in the dry season when the range becomes depleted and water in the plain becomesscarce, livestock turns more and more to browsing the remaining green vegetation and concentrates nearthe foot of the escarpment where a few natural wells and springs provide water. Towards the end of thedry season most livestock depends on accumulated body fat and drinking water is in short supply. Goatssurvive this difficult period with greater ease than cattle.
Physical weakness, both of breeding cows and animals for traction, is a widespread problem. Only fewfarmers provide supplementary feed to their animals during the dry season, including crop residues (grainstalks, bean leaves, grain husks, left-over vegetables), bonemeal and catde maintenance licics (bothpurchased from the Livestock Advisory Centre (LAC). Only one farmer grew fodder (lablab) in the1992/93 season.
The Mafisa system is prevalent in the area, under which cattle is lend out by the owner to relatives orothers on a semi-permanent basis. The caretaker usually benefits from their draft power, milk and possiblya calf.
3.4.2.3 Animal health
Livestock suffer from a range of diseases, causing general weakness and mortality. Vaccination campaignsare nut annually by the Department of Animal Health and Production (DAHP) at no cost to the farmer.These vaccinations are for cattle only and are against Anthrax, Quarter Evil, Contagious Abortion and Footand Mouth Disease. Animals vaccinated during a campaign are recorded, but not all cattle is presentedby their owner or caretaker. In the campaign of 1993, 169 head of cattle were recorded in the Ratholoarea, which suggests that only a fraction of all cattle is regularly vaccinated. In drought years vaccinationagainst Botulism is provided. Vaccination against Rabies is only carried out locally after an outbreak isdetected, in which case all livestock in a locality is vaccinated.
Any other animal health precautions which livestock owners feel necessary are at their own expense. Veryfew owners vaccinate cattle against Lumpy Skin Disease and Pasteurellosis, or small stock against PulpyKidney. Also very few owners apply vermifuges. Sprayers for tick control are owned by some farmersor farmer groups, but are often not used.
Hyenas, jackals and baboons occasionally kill young cattle and small stock.
The nearest artificial insemination centres are located in Palapye and Sefophe, but are too far away forfarmers to take their cattle to.
3.4.2.4 Drinking water
Darns, wells, springs and pans provide drinking water during the rainy season, and hold out during thethe first part of the dry season. The pans are tmreliable sources and often periodically dry up even duringthe rainy season. During the dry months of July through October, drinking water shortages occur.Livestock are often watered at privately owned boreholes, with a fee paid to owner. In good years naturalsprings in and around the Tswapong Hills provide water all year round. See for more informationSection 2.6.
3.4.2.5 Fencing
The Makoro cordon fence, erected in 1977, forms the southern boundary of Ratholo AEA and effectivelyseals off the area for livestock movements towards or from the south. A drift fence separates the arablearea from the grazing area. Most livestock are kept behind the drift fence during the cropping season, butconsiderable numbers remain in the lands area in spite of strict regulations to the contrary laid down bythe community.
Many individual farmer's fields are fenced. An estimated 50 percent of fields are wire fenced (oftensubsidised by drought relief in the past). Another estimated 30 percent are fenced by thorny branches. Theremainder of fields are not fenced. Livestock remaining in the lands area are more closely herded thanlivestock kept outside, but unfenced fields in the lands area suffer from intrusion by animals (cattle andgoats) during the cropping season. There are no fences surrounding the villages.
3.4.3 Collection of veld products, fuel wood and poles
Collection and sale of veld products (phane, fruits) and secondary products (beer) is an important activityfor almost all households. The most significant veld product is phane (also called mopane worm), thelarval stage of the Mopane moth (Gonimbrasia belina), which feed in large number on the mopane tree(Colophospermum mopane), and are an important source of income and a much liked and nutritioussupplement of the diet. They are collected in December and to a lesser extent again in April. On the basisof the farm survey it is estimated that up to 80 percent of the population is involved in the collection ofphane at least for some time within a period of 3 to 6 weeks in November and December and to a lesserextent again in April. Between 2 and 10 hectares of mopane bush is harvested per family. The caterpillarsare squeezed, boiled and sun-dried or cured over a fire and sold in bags 9. The average number of bagscollected and sold annually varies f-rom 4 to 6, with an average of 3 in December and 2 in April. Theprices offered to farmers by traders are 100 to 130 Pula per bag. Most produce is taken to South Africaand sold for human consumption or as supplementary cattle feed at prices as high as 400 Pula per bag.Tables 11 and 25 give the production characteristics of phane.
9Either 50 kg fertilizer bags or 70 kg grain bags are used as a measure of volume: the actual weight of phane is much less
35
fruits of the morula tree Sclerocarya caffra) are another favoured veldproduct, both for directconsumption and beer brewing. Momia ripens in February and March. Fruits from Grewi a flaw("moretlwa") are also collected from the veld.
Collection of fuel wood and poles for construction and fencing is practised throughout the area. Mosthouseholds collect their own. Close to villages it has caused considerable degradation of the vegetation.
Preferred species are: Colo phospermum ntopane, Dichrostachys cinerea ("moselesele"), Combretumapiculatum ("mohudiri"), Acacia erubesc ens ("molotho"), A. nigresc ens ("mokoba") and A. tortilis("moshu"). Grass for thatching (mainly Eragrostis pallens) is also collected by many during the dryseason.
3.4.4 Irrigated agriculture
There is no surface water available for irrigation. Two irrigated farms started operations in the area in1993, assisted by a loan from the Financial Assistance Policy (FAP). Fruits (citrus, peaches and mangos)and vegetables are grown on fenced plots measuring less than half a hectare, taking water from boreholes.Produce is marketed in Palapye and Mahalapye. Some irrigated gardening is also done at Moeng College,mainly for educational purpose. There is a Horticultural Association at Regional level providing technicaland marketing support. Only very few farmers are able to make use of FAP assistance because of quiterigorous requirements: the applicant should possess a borehole, make a considerable cash contribution andhold a land certificate issued by the Land Board.
3.4.5 Forestry
Firewood, fencing poles and construction materials are collected by individual farmers from shrub- andwoodlands throughout the area. Some enterprising people may use donkey carts to collect large quantitiesin the Tswapong Hills and offer it for sale. There are no managed indigenous or planted forests in thearea. Various organizations (Palapye Development Trust, Ministry of Agriculture) occasionally give freetree seedlings to farmers. Most of these trees end up in farmers' compounds in the main villages. Theyinclude fruit trees (citrus, guava, mango, peach), ornamentals (oleander), shade trees (pepper tree) andothers (Eucalyptus and Acacia sp).
3.5 INSTITUTIONS AND ORGANIZATIONS
Ratholo AEA falls under the Bamangwato Tribal Administration, with the Chief in Serowe, the SeniorSub-tribal Authority in Palapye and the Sub-tribal Authority in Lerala. The main villages of Ratholo AEA(Ratholo and Majwaneng) have a Headman each; with several Ward Headmen in each village.
The Ratholo AEA falls under the jurisdiction of the Ngwato Land Board, which has its headquarters inSerowe, and the sub Land Board based in Palapye. The Land Board, which comprises of Govemmentofficials and elected representatives of the community, has the executive authority for allocating land toindividuals for arable farming or other uses. The District Officer Lands (DOL) and the District Land UsePlanning Unit (DLUPU) provides technical advice to the Land Board on matters of land allocation.
The Department of Crop Production and Forestry (DCPF) has a regional office (RAO) in Serowe and adistrict office (DAO) in Palapye. Specialist officers dealing with crop production, horticulture, irrigation,soil conservation, land use, forestry, beekeeping and plant protection are based in the RAO office.
36
Agricultural Demonstrators are responsible for providing agricultural extension in their areas. One AD isresponsible for agricultural extension in Ratholo AEA.
The Department of Animal Health and Production (DAHP) has a regional office in Francistown and a suboffice in Palapye. The Department is responsible for providing extension in all aspects of livestockhusbandry and health through Stock Inspectors (Sis) and Veterinary Assistants (VAs). Ratholo AEA fallswider the responsibility of a SI based in Ratholo.
The Palapye Development Trust is the only other organization active in the area in the field of agriculturaldevelopment. It is based in Palapye and sponsored by the Government and a number of extemal donors.It provides training to ADs and farmers, and operates small scale programmes for selected farmers orvillages in soil conservation, livestock breeding, horticulture and agroforestry. It has two "pioneer farmers"in Ratholo.
At the village level Ratholo has a Village Development Committee (VDC) who assess needs, make plans,and solicit support and funds for community projects (e.g. provision of piped drinking water, building ofschools). The farmers committee is an elected body made up of area representatives and are concernedwith agricultural issues (e.g. erection of drift fences, assessing training needs). The Village ExtensionTeam meets once a month and includes the AD, SI, VA, Clinic staff and the Headman. Other committeesinclude the Parent Teacher Organization and the Crime Prevention Committee.
37
CHAPTER 4
LAND USE PROBLEMS AND SUGGESTED OPTIONS
4.1 INTRODUCTION
There are many problems which stand in the way of a more productive and more sustainable land use.In this Chapter the main problems are discussed, segregated into a number of constraints. Possibleinterventions which may lead to the mitigation of constraints are discussed separately. In Chapter 5 thesepossible interventions will be subjected to land evaluation.
Problems identified vary between one group of farmer to the other and between the farmer and the landuse planner. The following problems were amongst those cited by farmers:
i) Crop production:
Seed not available or very expensive (e.g. groundnuts)Unreliable and decreasing rainfallFarmers are not ready and alertNo drinking water at the lands during ploughingAnimals left unattended inside drift fence during cropping season and causingdamage to cropsPests in connection with crops (Quelea, baboons)Land not fertile and fertilizer expensiveLow prices for produce
ii) Livestock production:
Livestock diseases and infection through animals which are not properly managedLack of drinking water during the dry season, both for human consumption andlivestockLow selling prices for cattle
General:
Average farmer is not supported enough by the Govemment, unlike poor farmerthrough ALDEP and rich farmer through FAP
In addition to the problems mentioned by farmers, the following issues also need attention:
i) Crop production:
Presence of aggressive weedsSoil degradation and decreasing soil fertilityShortage of draft power
39
Livestock production:
Poor range conditionHigh stocking ratesAbsence of supplementary feedingInferior breeds
General:
Poor uptake of extension menagesLand degradationNegative side effects of drought relief progratmne
4.2 LOW CROP PRODUC ION
L,ow crop yields are the standard. The yield of sorghum in Botswana, over the last 10 years, was 110-250 kg/ha (Division of Planning and Statistics, 1991). 'There are no reasons to think that the situation inRatholo AEA is different.
4.2.1 Constraints
The main reasons for low crop yields are listed below and are combined into three groups: constraintsposed by the natural environment (I), constraints related to poor farm management (II), and institutional,infrastructural or market related limitations (III).
I. Physical constraints related to the natural environment
la. Natural constraints. The natural environment is marginal for the cultivation of crops.
Low and erratic rainfall. Average annual rainfall is about 400 mm The variation from year toyear is high (as low as 100 mm in a drought year and as high as 700 mm in a very good year).Rainfall is poorly spread over the rainy season, which is characterised by long dry spells.
Low nutrient levels in soils. Topsoils are commonly rather coarse textured with low levels oforganic matter, phosphorus and nitrogen. In addition most soils are leached and thereforedeprived of nutrients such as potassium, calcium and magnesium.
Incidence of pests. Both migratory pests (notably Quelea), and non-migratory pests (comcricket and bollworm) are common. Damage to crops is frequent but erratic. Other causes forloss of crops are livestock and baboons. Inadequate or late spraying and inadequate birdscaring are common
Presence of aggressive weeds. Weeds are numerous and provide competition to crops formoisture, nutrients and light Poor weeding is common, mainly because it is labour intensive.
Ib. Constraints related to land use. Farmer's practices are generally not geared towards conservationof the production base, i.e. the soil.
40
Soil degradation in the form of the depletion of nutrients, loss of topsoil, and the formation ofsurface crusts are widespread. Crops are harvested every year, but little organic waste isreturned to the soil.
Management related constraints
Appropriate land and crop husbandry is essential to mitigate the cons-traints posed by the naturalenvironment, which is marginal for crop production. Unfortunately inadequate farming practices arewidespread.
Ila. Crop related management constraints
The traditional method of broadcasting a mixture of seeds, followed by ploughing leads to anirregular distribution of seeds and a variable planting depth. As a consequence, plant densitiesvary considerably over a farmer's field. Subsequent weeding is inefficient since it has to becarried out by hand. Pest control is more difficult because of the mixture of crops.
Late ploughing and seeding are common due to shortage of draught power at the time it isrequired. Physical weakness of draught animals and the limited availability of tractors are themain reasons.
Lib. Land related management constraints
Absence of fertility maintenance. Most crop residues are consumed by livestock and termites.Compost production is non-existent. No inorganic fertilizers are used. No organic waste isadded to the soil, except for some manure left by roaming animals and some crop residues andweeds not consumed by livestock.
Institutional, infrastructural or market related constraints
Lack of advice. In recent years the AD has be,en given the additional task of drought reliefadministration and can not concentrate fully on his advisory task.
Present drought relief subsidies are given on the basis of the area ploughed with no conditionsregarding production level or farming methods attached to it.
Market price,s for farmer's products are often not high enough to stimulate the production ofcash crops.
Distance to fields. Most farmers have their base in the village, and have to travel a long wayto their fields.
Distance to markets where produce can be sold is long. Means of transport are ofteninadequate.
4.2.2 Suggested oPtions
Changes which would have a positive impact on increased output and better sustainability of rainfed arablefarming are grouped under a few headings:
41
- Improved land management
Concentration of arable farming on the better soils. At present some shallow soils are cultivated,while some deep soils are not.
Complete fencing of arable fields. At present not all arable fields are fenced and damage of cropsby livestock during the cropping season is common. This in spite of the presence of a completedrift fence.
- Improved crop management and crop selection
Cultivation of crops and varieties which are appropriate for the natural environment. This meansdrought resistant and not very demanding crops and varieties with a short growing period.
Widespread adoption of modem cropping practices, including row planting, row inter-cropping,row weeding, early ploughing and planting, improved pest and disease control.
The physical condition of draught animals could be improved by the supplementary feeding ofhay, fodder crops and crop residues, stored during the winter.
Improved soil management
Widespread adoption of fertility maintenance by one or more of the following: application ofmanure, ploughing in of unused stover, use of fertilizer, rotational cropping and intercropping ofsorghum with legumes, will improve the production base, i.e. the soil in many ways, thuscontributing to increased production and higher sustainability of production systems.
Water conservation by tied bunding of fields which have a slope of more than 1%, would reduceoverland flow and increase infiltration, thus making a contribution to increased production andreduced erosion.
- Improved institutional support
Re-direct drought relief funds. Funds used for providing ploughing subsidies to farmers could bere-directed into programmes oriented towards higher production or investment in agriculturaldevelopment.
Improvement of extension advice by enabling extension staff to spend more time on extensionwork instead of drought relief administration.
Improvement of marketing channels, both for inputs and outputs. Seeds and fertilizer should beavailable in time and an accessible market for produce should exist. Farmers should organizethemselves to make marketing more efficient (see below).
Support the organisation of farmers to facilitate training in improved farming methods and toassist with marketing.
42
4.3 INADEQUATE OR UNSUSTAINABLE LIVESTOCK PRODUCTION
The main problem related to livestock production is poor herd management leading to overstocking ofcommunally owned fragile range lands. A number of natural, managerial and infrastructural constraintsare considered to be important and discussed below.
4.3.1 Constraints
Physical constraints related to the natural environment. The quantity of consumable biomass variesstrongly both in time (from one year to the other) and space (differences within an area at a givenpoint in time). Water availability naturally also varies over the years.
Ia. Natural constraints
Low and erratic rainfall. The annual variation is high and rainfall is poorly spread over therainy season (see also Section 4.2), resulting in varied range conditions.
Drinking water shortages during the dry season.
lb. Constraints induced by land use
Generally degraded nature of range, due to overgrazing and lack of range managementCompared with less heavily grazed areas in the same general ecological zone, there is a distinctimpoverishment of the herbaceous layer in terms of specie,s composition and plant density.
Poor topsoil quality in much of the rangelands. Topsoil is compacted and low in nutrients andorganic matter away from trees and shrubs. Under trees and shrubs the topsoil is in muchbetter condition. This pattern of soil degradation is attributed to high grazing intensity,trampling by livestock, increased sheet and splash erosion and reduced leaf and litter fall awayfrom trees and shrubs.
Management related constraints
Ila. Range management constraints
High stocking rates. Communal land ownership leads farmers to maximise herd size in the faceof competition by other herds for the same grazing area.
Uncontrolled grazing and browsing. A system of controlled grazing of the communal grazinglands by paddocking or herding is generally absent.
lib. Animal husbandry constraints
Inferior animal health. Improved animal health by vaccination of all animals would cause lowermortality rates and contribute to higher calving rates.
Lack of additional feeding. Few farmers provide additional fodder, bonemeal, salts etc. to theiranimals. Better supplementary feeding would improve health, increase weight, and raise growthrates and calving rates.
43
Cross breeding with cattle having better production properties might be beneficial. Such cattlehowever is generally more vulnerable to drought, diseases etc., and such intervention can onlybe effective with greatly improved nutrition and under vasdy improved management.
III. Infrastructural constraints
Distance to markets. The distance of about 40 km to the nearest railway station (Palapye) fortransport of animals to the abattoir makes marketing difficult and costly.
4.3.2 Suggested options
Changes which would have a positive impact on increased output and better sustainability of livestockproduction are grouped under a few headings:
Improved land management
Improvement of existing springs and dams. Some of the existing dams and springs would be moreproductive if managed properly.
Improved range management
Subdividing the range area in a number of fenced units. Paddocicing would, in combination withrotational grazing and stock density control, combat degradation and increase the sustainabilityof grazing systems.
The cultivation of fodder crops
Winter grazing of arable land could be improved by the cultivation of fodder crops, either as amonocrop or as a relay crop with sorghum.
Improved herd management
Improved animal health by regular vaccination of young stock and adequate dispensation of drugswhen required, will lower mortalit y rates of catde.
Provision of supplementary feed to all cattle will improve the general health condition of catdeand in particular increase calving rates. Supplementary food can be purchased or (partly) grownas fodder.
Itnproved institutional support
Improvement of extension advice.
Establishment of a local market oudet would reduce the cost of transport for the farmer andreduce high mortality in dry years.
44
4.4 LAND DEGRADA'TION
4.4.1 The problem
Topsoil deterioration and cnisting is very widespread in the area. Organic matter in topsoils is decreasing,cnksts of 1-2 mm thick seal off the surface. In the dry season they are hard, in the rainy season they areless conspicuous but still existing. The causes are multiple: trampling by cattle, intensive grazing, sheetand splash erosion, reduced leaf and litter fall, no retum of organic matter in arable fields. Crusting formsan essential, but much underestimated, link in the vicious circle of environmental degradation: crustsreduce infiltration, amplify run-off and inhibit seed germination. These consequences of crusting in turnlead to increased erosion, reduced vegetative growth, reduced production and reduced incorporation ofvaluable organic matter into the topsoil, etc. In farmers' fields crusts are broken by cultivation, yet thesituation is exacerbated by the consumptive farming methods which remove nutrients continuously fromthe system without replenishment.
Severe rill erosion is confined to the footslope zone of the Tswapong hills. An area of about 4,000 ha isaffected, of which approx. 600 ha seriously. Decline of the protective vegetative cover as a result ofovergrazing and deforestation has destabilised this fragile environment. Some of the rills have developedinto gullies.
4.4.2 Suggested options
Options for the recuperation of topsoils pertain to improved soil and range management and are listed inSections 4.2.2 and 4.3.2.
Controlled grazing will be required. This could be achieved by (expensive) fencing or by herding. To slowdown erosion, a protective plant cover has to be established. This may involve ripping of bare and crustedsoil and seeding with fast growing forestry and grass species . A few gullies need conservation structures.The less severely affected areas may be subjected to limited grazing.
4.5 THE FARMERS' SOCIO-ECONOMIC ENVIRONMENT
The motivation of farmers to adopt more modem farming practices is limited. Improved methods, aspropagated by ALDEP, ARAP and other programmes in the past have had a very low uptake by farmers.This may have been caused partly by the pre-occupation of the Extension Service with drought relief overthe last 10 years, but the lack of enthusiasm for change and intensification also has a number of rationalcauses:
Risk avoidance and conservatism. Present fanning methods have proved their worth in the pastfor farmers having to operate in a high risk environment (low and unreliable rainfall), and havinglitnited inputs (funds, labour and traction) available.
The way drought relief worlcs. Fanners receive a subsidy from Government for every hectare theyplough (to a maximum of 5 ha), without any condition for performance attached to it. Farmersare thus invited to plough the maximum area whenever draught power is available, even if therains are insufficient to plant or not enough labour is available to manage the crop.
Most farmers are old and not very innovative.
45

- Farmers have many interests, besides farming.. Some activities are more profitable, or give animmediate return. E.g. construction work in the context of drought relief provides a predictableand immediate income.
- Lack of market incentives. Prices are not attractive enough and markets are distant.
46
CHAPTER 5
LAND EVALUATION
Land evaluation estimates the performance of production systems on specified land units. In the semi-aridconditions of Botswana, there is a large difference in performance between years due to variations inannual rainfall For this reason, land evaluation for crop based production systems is based on a year byyear modelling of crop production using historic rainfall data. For this purpose the Crop Yield Simulationand Land Assessment Model for Botswana (CYSLAMB) was developed by the Ministry of Agriculture(De Wit et al, 1994). An Animal Production System and Resource Assessment Model for Botswana(APSRAMB) for the land evaluation for livestock based production systems is presently being developed.A carrying capacity estimation model and herd projection model developed in preparation of a moredefinitive model are used for the present evaluation.
In land evaluation individual Land Units are evaluated for specific production systems. Relevant LUs havealready been defined in Chapter 2. A first screening of relevant production systerns is carried out inSection 5.1. The production systems considered in the present study can be grouped under three headings:crop production, livestock production and phane production, and are listed in Tables in the respectiveSections below. The relevant present and potential production systems are subjected to financial analysisin Chapter 6.
5.1 RECOMMENDED USES FOR LAND UNITS
The Land Units (LUs) of Ratholo AEA are defined in Section 2.7 and delineated on Map 6. Present landuse of the Land Units is presented on Map 7 (see backpocket of this Report).
LU 1
The hills and escarpments are steep, have shallow soils and many rock outcrops. Extensive grazingand browsing is the only possible use, together with the collection of wood and other veldproducts.
LU 2
This unit is used for grazing. The soils are also suitable for arable farming, although the gentleslopes will pose an erosion risk.
LU 3
Most of this unit has severe limitations for agricultural land use because of moderately sleepslopes, erodibility, and stoniness. Only extensive uses as browsing and forestry must be consideredhere. An exception form pockets of gently sloping land with shallow groundwater, found locallyin LU 3. This land, although small in area, provides precious grazing and water in the dr/ seasonfor livestock and wildlife.
47
LU 4
Year round grazing and browsing is the dominant land use. The area is moderately to severelyeroded as a result of overgrazing. Fencing of the area to control grazing and to improve soil covermust be considered.
LU 5
Year round grazing and browsing is the dominant land use. A small area in the eastern part of theAEA is used for arable farming. The area is gently sloping and rill erosion is a commonphenomenon. The soils are similar to those of LU 7 and are suitable for arable farming, but sincethere is no shortage of arable land elsewhere, expansion of farming should not be considered here.Better control of grazing should be considered to curb erosion.
LU 6
Grazing and browsing during the dry season and veld product collection are the dominant landuses. The area is unsuitable for arable farming due to occasional flooding. Since there is sufficientarable land elsewhere (LU 7), no attempts are required to curb flooding and to try to make arablefarming possibl e.
LU 7
At present arable farming is the dominant land use. The best arable soils in Ratholo AEA arefound in this unit. Future arable farmirtg should therefore remain to be concentrated in this area.The erosion hazard is low as a result of very gentle slopes.
LU 8
Arable farming is the dominant land use. The soils are moderately deep soils, and suitability forarable farming. The erosion hazard is very low as a result of the very gentle slopes. LU 8 occursin association with LU 9; a detailed soil survey would be needed to separate the two.
LU 9
Arable farming is the dominant land use. The soils are shallow and not suitab1e for deep rootingcrops, such as sorghum. The erosion hazard is very low as a result of the very gentle slopes. LU 9occurs in association with LU 8; a detailed soil survey would be needed to separate the two.
5.2 EVALUATION OF CROP BASED PRODUCTION SYSTEMS
5.2.1 Introduction
5.2.1.1 CYSLAMB
Crop based production systems are evaluated using a computer programme called CYSLAMB (De Witet al, 1994). The characteristics of the selected land units (effective rainfall and synoptic meteorologicaldata, soil and weed characteristics) and production systems (crop characteristics, target plant densities and
49
management practices) are read from separate databases. Using this input data, CYSLAMB then simulatescrop biomass production and yield for every selected year for which rainfall data have been entered.
CYSLAMB first calculates what would be the maximum possible biomass yield for the crop under thespecified management conditions if there are no constraints due to soils or rainfall. This theoreticalmaximum yield is determined by solar radiation and temperature. The model then sets up a moisturebalance from the first dekad (10 day period) of each hydrological year (1st - 10th September is normallychosen in Botswana), taking into account incident effective rainfall, bare soil evaporation or weedevapotranspiration and water losses due to percolation or nin-off. Criteria for the definition of a plantingopportunity are defined based on effective incident rainfall and stored soil moisture. When these criteriaare met, the crop/soil water balance is then simulated through the crop growth cycle, and periods ofmoisture stress are accounted for in the calculation of the moisture limited biomass yield. The moisturelimited yield is then adjusted to take account of the effects of drainage conditions, nutrient supply andtoxicities. The biomass yield is converted to the yield of economic product by the harvest index.
The output yields reflect the production on the specified soil type under the climatic conditions over aperiod of years. In the case of the Ratholo evaluation, the model is nm over a period of 32 years, from1960 till 1992. The outputs are analysed statist ically giving estimates of the yield expres,sed as dependableyields, which are surpassed in 75% of years, and median yields, which are surpassed in 50% of years.
The output yields are expressed on the basis of a 'total plot'. CYSLAMB assumes that draught power isonly sufficient to plough and plant an area of 2-3 ha at each planting opportunity. Therefore, dependingon the size of his/her plot, a farmer may require one, two or three (or more) occasion(s) for the ploughingand planting of the full extent of his field. In years, when not enough planting opportunities occur, onlya portion of the plot can be ploughed and planted. 'Total plot' yields reflect the greater risk, andconsequently lower aggregated production, experienced by the farmers who are dependent on multipleplanting opportunities. The number of planting opportunities required is specified in the definition of cropproduction systems.
5.2.1.2 Initial analysis and assumptions
Land evaluation has been carried out using CYSLAMB to simulate the following three farming situations:
1 The entire field is ploughed and planted at the first planting opportunity in the periodNovember 1st - February 20th. In this case the farmer is assumed to have unrestrictedaccess to a tractor for farm operations.
2 The field is ploughed and planted during three successive planting opportunities in theperiod November 1st - February 20th. In this case the farmer must have access to animalor mechanical draughtpower at all times.
Ploughing and planting is carried out late in the season, making use of the first twoopportunities in the period January 1st - February 20th. In this case the farmer is a slowstarter or is forced to hire or borrow draughtpower when everybody else is finished.
The number of planting opportunities which occurred after November lsti° during the 32 years analysed(1960-1992) is shown in Table 13.
1.0 It is assumed that farmers rarely plough before November 1st, also not in an optimal potential situation. In 19 % of the 32 yearsanalysed an early planting opportunity occurred already in October,
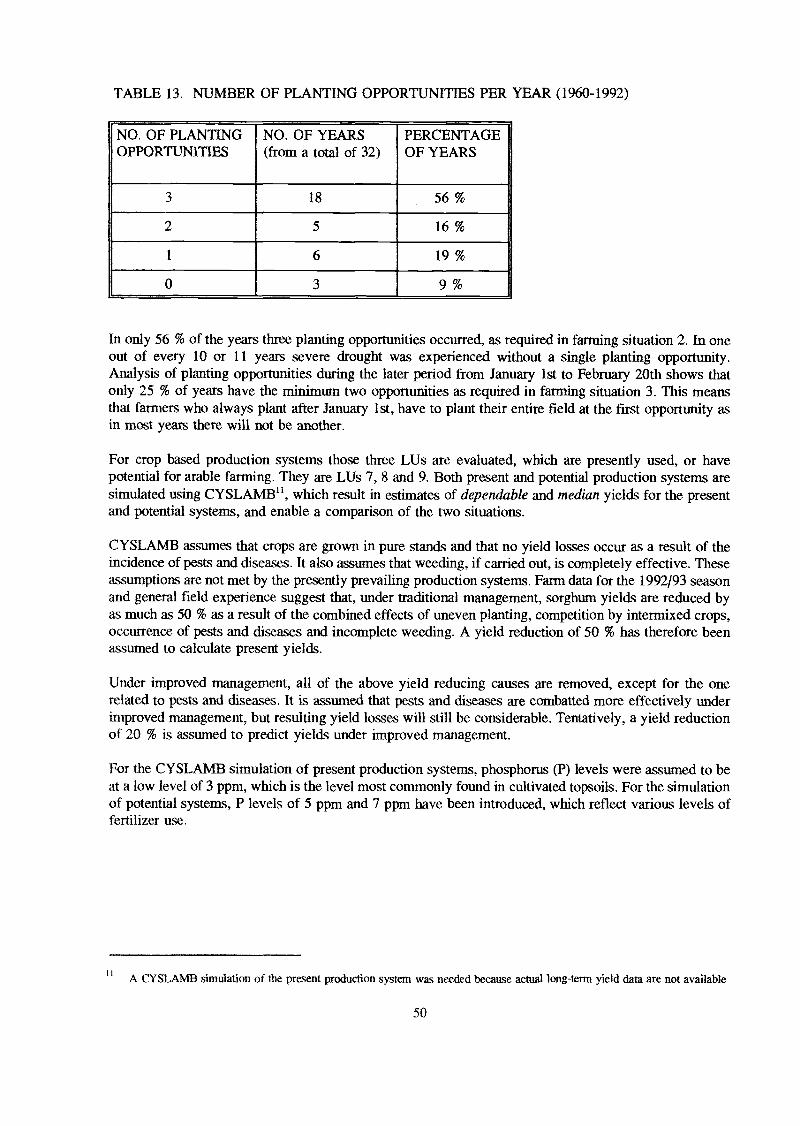
TABLE 13. NUMBER OF PLANTING OPPORTUNITIES PER YEAR (1960-1992)
In only 56 % of the years three planting opportunities occurred, as required in fanning situation 2. In oneout of every 10 or 11 years severe drought was experienced without a single planting opportunity.Analysis of planting opportunities during the later period from January 1st to February 20th shows thatonly 25 % of years have the minimum two opportunities as required in farming situation 3. This meansthat farmers who always plant after January 1st, have to plant their entire field at the first opportunity asin most years there will not be another.
For crop based production systems those three LUs are evaluated, which are presently used, or havepotential for arable farming They are LUs 7, 8 and 9. Both present and potential production systems aresimulated using CYSLAMB", which result in estimates of dependable and median yields for the presentand potential systems, and enable a comparison of the two situations.
CYSLAMB assumes that crops are grown in pure stands and that no yield losses occur as a result of theincidence of pests and diseases. It also assumes that weeding, if carried out, is completely effective. Theseassumptions are not met by the presently prevailing production systems. Farm data for the 1992/93 seasonand general field experience suggest that, under traditional management, sorghum yields are reduced byas much as 50 % as a resWt of the combined effects of uneven planting, competition by intermixed crops,occurrence of pests and diseases and incomplete weeding. A yield reduction of 50 % has therefore beenassumed to calculate present yields.
Under improved management, all of the above yield reducing causes are removed, except for the onerelated to pests and diseases. It is assumed that pests and diseases are combatted more effectively underimproved management, but resulting yield losses will still be considerable. Tentatively, a yield reductionof 20 % is assuined to predict yields under improved management.
For the CYSLAMB simulation of present production systems, phosphorus (P) levels were assumed to beat a low level of 3 ppm, which is the level most commonly found in cultivated topsoils. For the simulationof potential systems, P levels of 5 ppm and 7 ppm have been introduced, which reflect various levels offertilizer use.
A CYSLAMB simulation of the present production system was needed because actual long-term yield data are not available
50
NO. OF PLANTINGOPPORTUNITIES
NO. OF YEARS(from a total of 32)
PERCENTAGEOF YEARS
3 18 56%
2 5 16%
1 6 19%
0 3 9%
5.2.2 Present crop production system
The present production systems are characterised by a mixture of crops dominated by sorghum (var.Segaolane) which takes up 90 % of the plant cover. 'There is no use of fertilizer. Main operations includebroadcasting-cum-ploughing during one or more planting opportunities and (incomplete) weeding after 30to 40 days after planting. Plant densities, as observed in the field, vary from 15,000 to 55,000 pl/ha with25,000 to 35,000 p1/ha in the majority of cases. Typical production systems, which vary according toplanting dates and number of planting occasions, are Msl, Ms2 and Ms3 (see Table 14). CYSLAMByields are given in Table 15. Analysis of results leads to the following observations:
The dependable yield of sorghum in production system Ms! (entire field planted at firstopportunity, yields at 50 % reduction level) is about 200 kg/ha. Median yields for thisgroup are about 400 kg/ha.
The dependable yield of sorghum in production system Ms2 (field planted successivelyduring first three planting occasions, yields at 50 % reduction level) is less than 100 kg/hafor LUs 7 and 8. This accords well with recorded yields in the area and in Botswana asa whole. Median yields are 200-300 kg/ha.
The dependable yield of sorghum in production system Ms3 (planting after Jan 1st duringfirst two planting occasions, yields at 50 % reduction level) is around 40 kg/ha. Medianyields are about 200 kg/ha.
Dependable yields are higher at 15,000 p1/ha than at 55,000 p1/ha, as a result of lesscompetition for water. However, in years with relatively high rainfall the trend is reversed,except for the shallow soils of LU 9. Median yields are lower at 15,000 pl/ha than at55,000. Por traditional type farming, 15,000 p1/ha is the recommended plant density, butfor more progressive farmers higher plant densities could be recommended.
Maize is grown at present only in mixed stands with sorghum and other crops and is a minor crop inRatholo AEA. If it would be grown in a traditional way but as a dominant crop (90 % maize and 10 %other crops), the dependable yield would be very low, as shown in Table 18. CYSLAMB has not beenused to simulate other traditional crops.
5.2.3 Potential crop production system
5.2.3.1 Crops and yields
Sorghum and groundnuts are evaluated for potential production systems, as listed in Table 14 (indicatedby codes Rsl to Rs5, and Rg 1 to Rg3). Other suitable crops, not yet incorporated in the CYSLAMBmodel, will be discussed in Section 5.5. Maize is not considered under improved management because ofits low potential.
Potential CYSLAMB yields for sorghum, assuming the introduction of improved farming practices, arepresented in Table 16. Comparison of yields of sorghum produced under traditional and improved systems(Tables 15 and 16) leads to the following observations:
The dependable yield of sorghum of production system Rsl (improved management,entire field planted at first opportunity, limited use of fertilizer, assumed yield reductionof 20 % because of pests and diseases), is 400 - 450 kg/ha. This is about double the
51
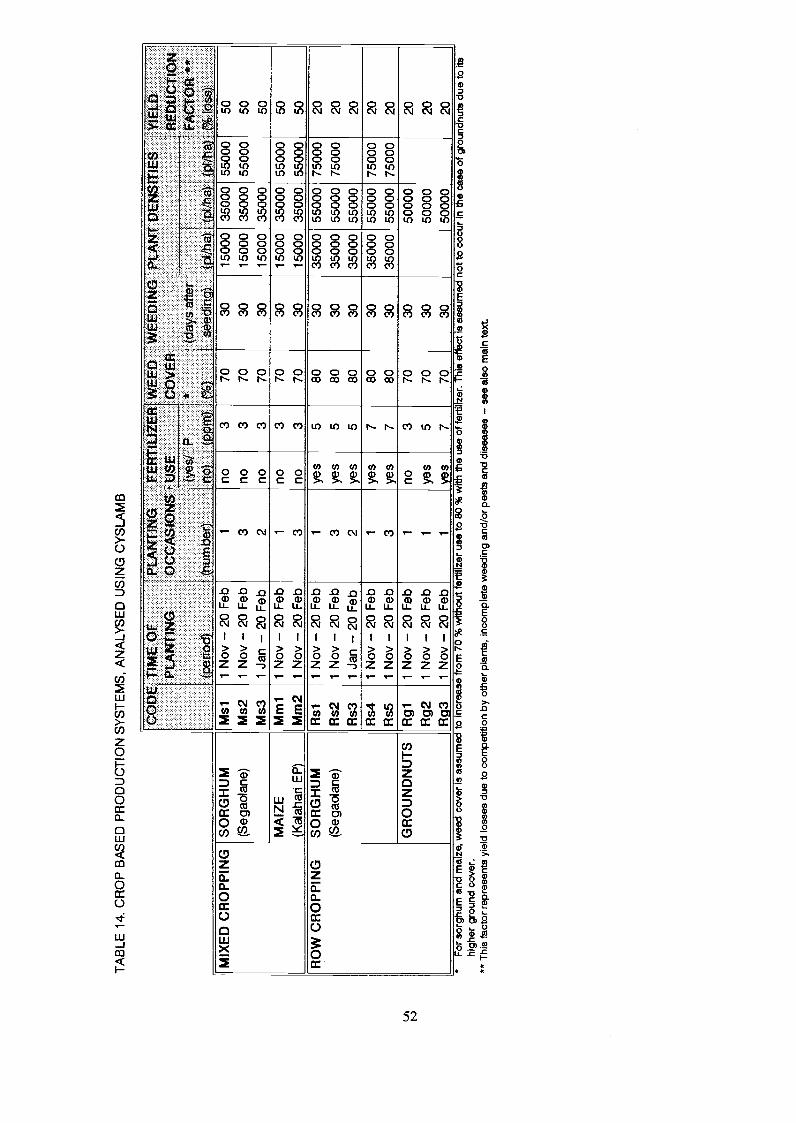
TA
BLE
14.
CR
OP
BA
SE
D P
RO
DU
CT
ION
SY
ST
EM
S, A
NA
LYS
ED
US
ING
CY
SLA
MB
high
er g
roun
d co
ver.
** T
his
fact
or r
epre
sent
s yi
eld
loss
es d
ue to
com
petit
ion
by o
ther
pla
nts,
inco
mpl
ete
wee
ding
and
/or
pest
s ar
vd d
isea
ses
- se
e al
so m
ain
text
.
ot T
ime
OF
PLA
NT
ING
rem
RW
EE
D W
EE
DIN
G P
LAN
T D
EN
SIT
IES
YIE
LDP
LAN
TIN
GO
CC
AS
iON
S -
LAE
-C
OV
ER
RE
DU
CT
ION
Yes
/ P*
(day
s af
ter
fAC
TO
R *
*P
eMX
I)(n
umbe
r)no
m(°
,0)
seed
ing)
The
The
/ha)
tt:T
A lo
w)
MIX
ED
CR
OP
PIN
G S
OR
GH
UM
Ms1
1 N
ov20
Feb
1no
370
3015
000
3500
0 55
000
50
(Seg
aola
ne)
Ms2
1 N
ov20
Feb
3no
370
3015
000
3500
0 55
000
50M
s31
Jan
20 F
eb2
no3
7030
1500
0 35
000
50
MA
IZE
Mm
11
Nov
20 F
eb1
no3
7030
1500
0 35
000
5500
050
(Kal
ahar
i EP
)M
m2
1 N
ov20
Feb
3no
370
3015
000
3500
0 55
000
50R
OW
CR
OP
PIN
GS
OR
GH
UM
Rs1
1 N
ov20
Feb
1ye
s5
8030
3500
0 55
000
7500
020
(Seg
aola
ne)
Rs2
1 N
ov20
Feb
3ye
s5
8030
3500
0 55
000
7500
020
Rs3
1 Ja
n20
Feb
2ye
s5
8030
3500
0 55
000
20
Rs4
1 N
ov20
Feb
1ye
s7
8030
3500
0 55
000
7500
020
Rs5
1 N
ov20
Feb
3ye
s7
8030
3500
0 55
000
7500
020
GR
OU
ND
NU
TS
Rg1
1 N
ov20
Feb
1no
370
3050
000
20
Rg2
1 N
ov20
Feb
1ye
s5
7030
5000
020
Rg3
1 N
ov20
Feb
1ye
s7
7030
5000
020
*F
or s
orah
um a
nd m
aize
, wee
d co
ver
is a
ssum
ed to
incr
ease
from
70
%w
ithou
t fer
tiliz
er u
se to
80
%w
ith th
e us
e of
fert
ilize
r. T
his
effe
ct is
ass
umed
not
to o
ccur
In th
aas
of o
roun
rinut
s du
n to
rtr
t
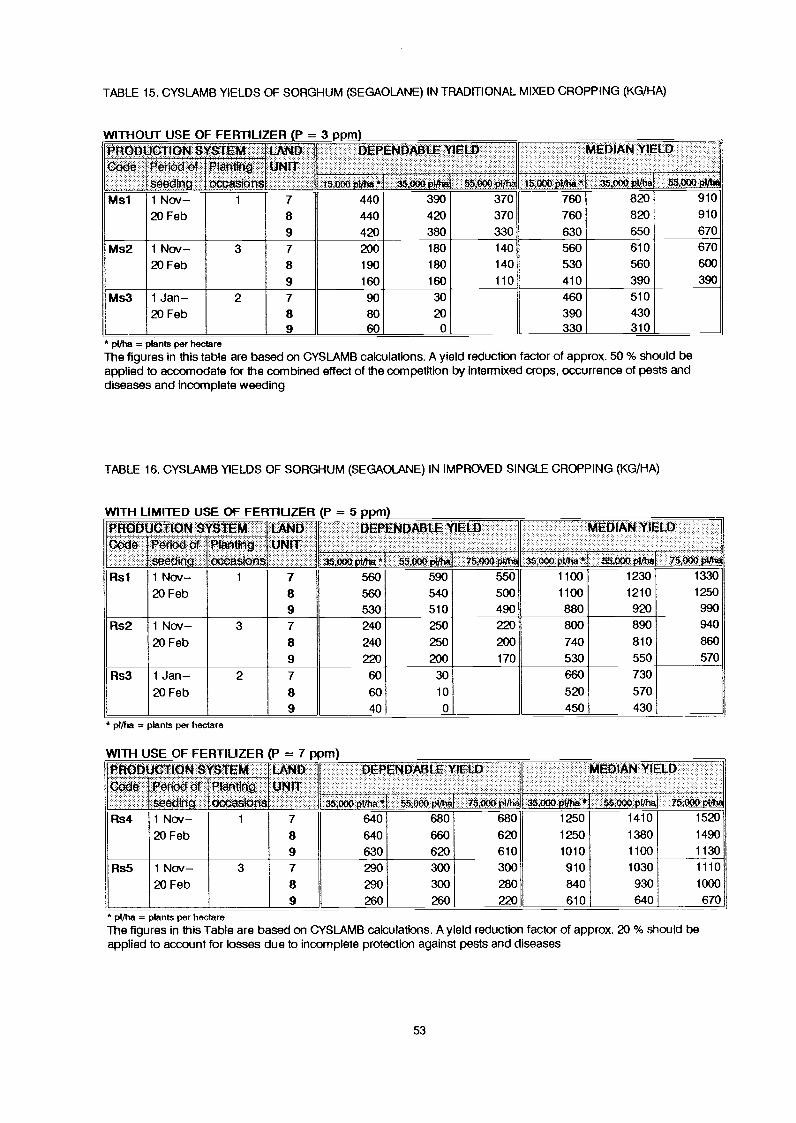
TABLE 15. CYSLAMB YIELDS OF SORGHUM (SEGAOLANE) IN TRADITIONAL MIXED CROPPING (KG/HA)
VVITHOUT USE OF FERTILIZER P = 3 ppm
pl/ha = plants per hectareThe figures in this table are based on CYSLAMB calculations. A yield reduction factor of approx. 50 % should beapplied to accomodate for the combined effect of the competition by intermixed crops, occurrence of pests anddiseases and incomplete weeding
TABLE 16. CYSLAMB YIELDS OF SORGHUM (SEGAOLANE) IN IMPROVED SINGLE CROPPING (KG/HA)
VVITH LIMITED USE OF FEFiTIUZER = 5 ppm
pl/ha = plants per hectare
WITH USE OF FERTILIZER = 7 ppm
* pi/ha = plants per hectareThe figures in this Table are based on CYSLAMB calculations. A yield reduction factor of approx. 20 % should beapplied to account for losses due to incomplete protection against pests and diseases
53
CodePRODUCTION
PeriOd Of
SYSTEM LAND ' DEPENDABLE YIELDPianttng E utirr
MEDIAN YIELD
SeetlIng 000aSiOnS1 1, 15,cto0 pith0 * 35,00 pilhett 55,000 plihN 15,0050.06 -000Ms1 1 Nov 1 7 440 390 370 760 820 910
20 Feb 8 440 420 370 760 820 910
9 420 380 330 630 650 670
Ms2 1 Nov 3 7 200 180 140 560 610 670
20 Feb 8 190 180 140 530 560 600
9 160 160 110 410 390 390
Ms3 1 Jan 2 7 so 30 460 510
20 Feb 8 80 20 390 430
9 so o 330 310
PRODUCTION SYSTEM LAND ' DEPENDABLE YIELDuNrr
i 3$.00Ct ON* 55,000 Oft 7$,000 Plitio4 *
MEDIAN YIELD
$4400 01//* MOWCode =Period
=seeding-of Planttng
cccasionsRs1 1 Nov 1 7 560 590 550 1100 1230 1330
20 Feb 8 560 540 500 1100 1210 1250
9 530 510 490 880 920 990
Rs2 1 Nov 3 7 240 250 220 800 890 940
20 Feb 8 240 250 200 740 810 860
9 220 200 170 530 550 570
Rs3 1 Jan 2 7 60 30 660 730
20 Feb 8 60 10 520 570
9 40 o 450 430
i'064ii .
:PRODUCTION'-:pericfci of 1
SYSTEM-Ptarittng
LANDUNIT
DePENDAME"YitL0 " meDIAN YiELD
.-
'i seeding I QCÇaSktfiti 15,000 WA* 5%000 PIMA 7.000 1)1/1A 35400171 PO& * WOO Plittal , 751300 Ptitgll
Rs4 1 Nov 1 7 640 680 680 1250 1410 1520
20 Feb 8 640 660 620 1250 1380 1490
9 630 620 610 1010 1100 1130
Rs5 1 Nov 3 7 290 300 300 910 1030 1110
20 Feb 8 290 300 280 840 930 1000
9 260 260 220 610 640 670
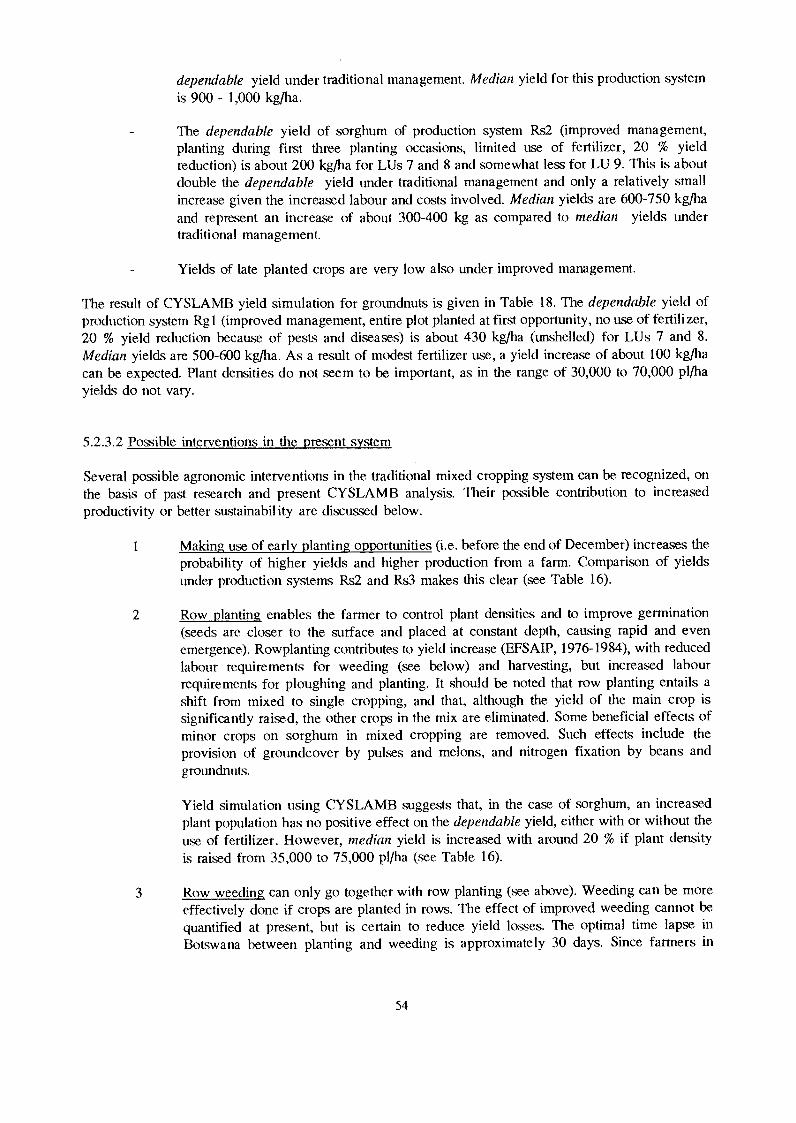
dependable yield under traditional management. Median yield for this production systemis 900 - 1,000 kg/ha.
The dependable yield of sorghum of production system Rs2 (improved management,planting during first three planting occasions, limited use of fertilizer, 20 % yieldreduction) is about 200 kg/ha for LUs 7 and 8 and somewhat less for LU 9. This is aboutdouble the dependable yield under traditional management and only a relatively smallincrease given the increased labour and costs involved. Median yields are 600-750 kg/haand represent an increase of about 300-400 kg as compared to median yields undertraditional management.
Yields of late planted crops are very low also under improved management.
The result of CYSLAMB yield simulation for groundnuts is given in Table 18. The dependable yield ofproduction system Rgl (improved management, entire plot planted at first opportunity, no use of fertilizer,20 % yield reduction because of pests and diseases) is about 430 kg/ha (unshelled) for LUs 7 and 8.Median yields are 500-600 kg/ha. As a result of modest fertilizer use, a yield increase of about 100 kg/hacan be expected. Plant densities do not seem to be important, as in the range of 30,000 to 70,000 p1/hayields do not vary.
5.2.3.2 Possible interventions in the present system
Several possible agronotnic interventions in the traditional mixed cropping system can be recognized, onthe basis of past research and present CYSLAMB analysis. Their possible contribution to increasedproductivity or better sustainability are discussed below.
1 Making use of early planting opportunities (i.e. before the end of December) increases theprobability of higher yields and higher production from a farm. Comparison of yieldsunder production systems Rs2 and Rs3 makes this clear (see Table 16).
2 Row planting enables the farmer to control plant densities and to improve germination(seeds are closer to the surface and placed at constant depth, causing rapid and evenemergence). Rowplanting contributes to yield increase (EFSAIP, 1976-1984), with reducedlabour requiretnents for weeding (see below) and harvesting, but increased labourrequirements for ploughing and planting. It should be noted that row planting entails ashift from mixed to single cropping, and that, although the yield of the main crop issignificantly raised, the other crops in the mix are eliminated. Some beneficial effects ofminor crops on sorghum in mixed cropping are removed. Such effects include theprovision of groundcover by pulses and melons, and nitrogen fixation by beans andgroundnuts.
Yield simulation using CYSLAMB suggests that, in the case of sorghum, an increasedplant population has no positive effect on the dependable yield, either with or without theuse of fertilizer. However, median yield is increased with arotmd 20 % if plant densityis raised from 35,000 to 75,000 pl/ha (see Table 16).
Row weeding can only go together with row planting (see above). Weeding can be moreeffectively done if crops are planted in rows. The effect of improved weeding cannot bequantified at present, but is certain to reduce yield losses. The optimal time lapse inBotswana between planting and weeding is approximately 30 days. Since farmers in
54
TABLE 17. CYSLAMB YIELDS OF MAIZE (KALAHARI EARLY PEARL) IN TRADITIONAL MIXED
CROPPING (KG/HA)
WITHOUT USE OF FERTILIZER = 3 p_prn)
* yield is given for a specific plant density (pl/ha = plants per hectare)The figures in this Table are based on CYSLAMB calculations. A yield reduction factor of approx. 50 % should be
applied to account for the combined effect of competition by intermixed crops, the occurrence of pests and
diseases, and incomplete weeding.
TABLE 18, CYSLAMB YIELDS OF GROUNDNUTS (PODS), IN IMPROVED SINGLECROPPING (KG/HA)
WITH LIMITED USE OF FERTILIZER (P = 5 ppm)MEDIAN YIELD
50,000 pl/ha*
850860
770 _
55
WITH USE OF FERTILIZER (P = 7 ppm_y- MEDIAN YIELD
, .
50,000p1/11a*
940950
J 850
. yield is given for a specific plant density (pl/ha = plants per hectare)The figures in this Table are based on CYSLAMB calculations. A yield reduction factor of approx. 20 '' should be
applied to account for the effect of incomplete control of pests and diseases
diseases, and incomplete weeding.
PRODUCTION SY-TEM LAND DEPEND-ABLE-YIELD- MEDIAN YIELD
Code[
Period of Planting UNITseeding_ occasions 15,000 pl/ha* 35.000 pl/h 15,000 pl/ha ",_ 35,000 pl/h
Mml 1 Nov- 1 7 110 0 790 700
20 Feb 8 110 0 790 700
9 80 0 510 380
-Mm2 i Nov- 3 7 40 0 600 580
20 Feb 8 40j 0 520 470
30- - - 280 180
PRODUCTION SYSTEM LAND DEPENDABLE YIELD
Code Period of Planting UNITseeding occasions 50,000 pl/ha*
1 Nov- 1 7_ _ =
660Rg220 Feb 8 670
9 650
PRODUCTION SYSTEM LAND DEPENDABLE YIELD
Code[
Period of Planting UNIT
seedin occasions rL
50,000p/ha*
Rg3 1 Nov- 1 7 720
20 Feb 8 740
9 720_
WITHOUT USE OF FERTILIZER (P = 3 ppm)
CodePRODUCTION
Period ofSYSTEM LAND
UNITDEPENDABLE YIELD MEDIAN YIELD
Plantingseeding_ OccaSionst 50,000 plaia* 50,000 pl/ha*
_ _ _
Rgl 1 Nov- 1 7 540 700
20 Feb 8 550 710
9 540 630
The technical coefficients used here are again taken from FMS (1988) (top 1/3 of farms) and from fielddata. The mortality rates are set at 6 % for adults and at 8 % for calves (as compared to 10 % and 12 %respectively without improvement). The calving rate is increased to 50 % for small herds and to 55 % formedium sized herds (as compared to 40 % and 43 % without improvements). By how much calving rateswould increase and mortality rates would be reduced as a result of a given improvement in veterinary careand/or supplementary feeding is not lcnown. The production characteristics of cattle herds under improvedherd management are presented in Table 22. Only herds of 5 and 15 cattle are evaluated (typical offarmers of Group 2 and 3). Production figures below are given for groups of hundred herds to avoiddivided numbers and are based on the per farmer data presented in the table. With improvements, hundredsmall cattle herds produce 67 cull animals annually. Hundred medium sized cattle herds produce 223 cullanimals. The increase in total culls is about 100 % for both herd sizes. Even with improvements, the herdtake-off rates are only a modest 11 % for both herd sizes (was 7 % without improvements). The annualmilk production of small herds go up to 160 liters per herd, and to 526 liters for medium sized herds, inboth cases an increase of 60 %.
5.4 POTENTIAL FOR AGROFORESTRY
Agrofore-stry is the productive use of trees and shrubs within the farming system. In this context trees onthe farm are used for many purposes, including soil fertility improvement (mainly leguminous trees),fodder, firewood, fencing, shade, edible fruits and medicine. Agroforestry includes the cultivation ofplanted trees, as well as the protection and use of remaining indigenous trees.
Ratholo AEA, and probably Botswana in general, is not very suitable for most agroforestry practices,particularly if it involves the planting of trees. Most newly planted trees would need watering andprotection from livestock during the first one or two years. This could be done in a well-managed woodlotor around the homestead but is often difficult in the lands area. Also, many agroforestry practices arelabour intensive and most farmers will not have the time or the interest to spend so much time on planting,watering and pruning trees.
If water is available on the lands and the farmer has the time and motivation to develop his/her farm theplanting of leguminous trees on fenced fields could be considered. Trees could be planted either along theperimeter of the field or on permanent contour strips. The main purpose of these trees would be toimprove soil fertility, and to provide fodder, shade, firewood and poles. Some species which may havepotential are given in Table 23. However, more research is needed on this subject to make generalrecommendations.
5.5 POTENTIAL CROPS
This Section lists some of the crops which could possibly be grown under dryland conditions in the landsarea of Rath°lo AEA. The agronomic and economic aspects of the production of most of these cropsvould need further investigation and some of them would have to be tried out before generallyrecominended. Table 23 lists the suitability of the "candidate crops" crops in qualitative and relative terms.A few of the crops listed are already grown in the area (e.g. cowpea), but at a small scale and notnecessarily for the use given.
56
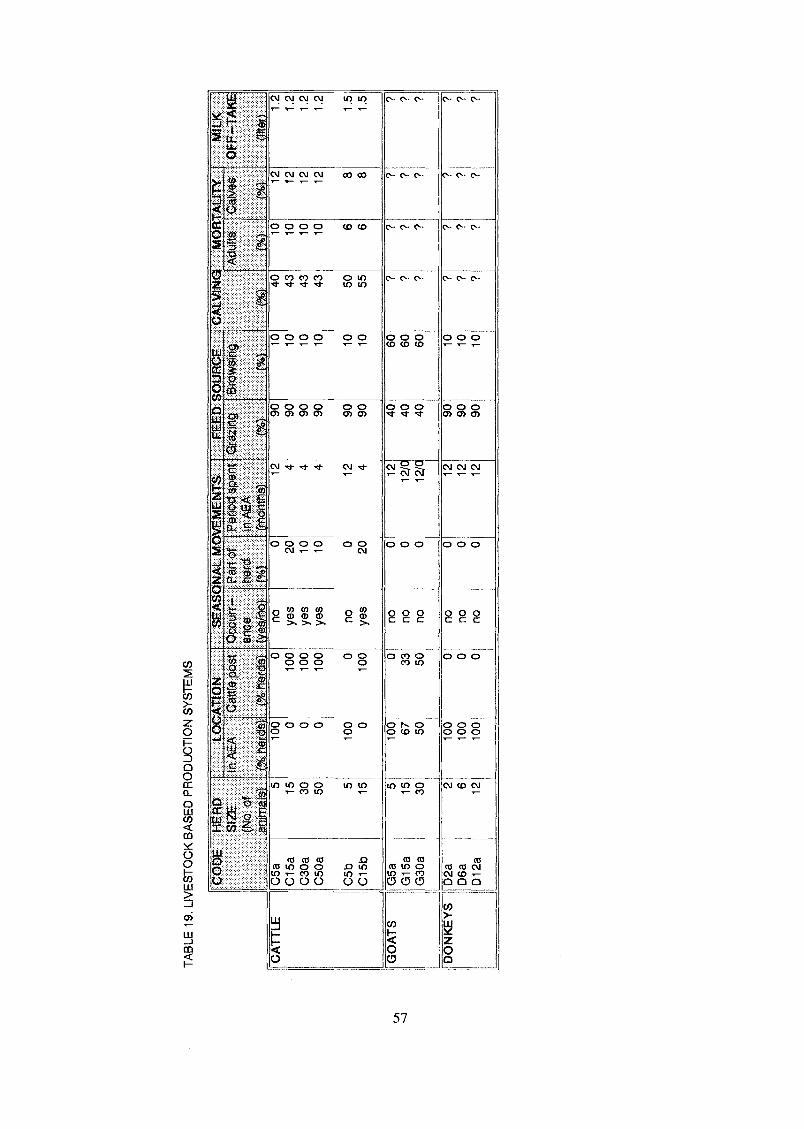
TA
BLE
19.
LIV
ES
TO
CK
BA
SE
D P
RO
DU
CT
ION
SY
ST
EM
S
CO
DE
HE
RD
SIZ
E(N
o. o
fni
is)
LOC
AT
IIn
AE
A
herd
s
NS
EA
SO
NA
LO
cour
rE
nloe
MO
VE
ME
NT
SF
EE
D S
OU
RC
EC
ALV
ING
Bro
wsi
ng
C%
MO
RT
AU
TY
Cal
ves
MIL
KO
FF
TA
KE
_-_-
_,-{
ftj-
Cat
tle p
ost
,(
4 he
rd '
Par
t of
flerd
Per
Iod
spen
t Gra
zing
n A
EA .0
Adu
lts )C
AT
TLE
C5a
510
00
no0
1290
1040
1012
1.2
C15
a15
010
0ye
s20
490
1043
1012
1.2
C30
a30
010
0ye
s10
490
1043
1012
1.2
C50
a50
010
0ye
s10
490
1043
1012
1.2
C5b
510
00
no0
1290
1050
68
1.5
C15
b15
010
0ye
s20
490
1055
68
1.5
GO
AT
SG
5a5
100
0no
012
4060
?
G15
a15
6733
no0
12/0
4060
?
G30
a30
5050
no0
12/0
4060
?
DO
NK
EY
SD
2a2
100
0no
012
9010
D6a
610
00
no0
1290
10
D12
a12
100
0no
012
9010

Livestock/Range Ecology Specialist of the LUPSAD project, in preparation of a more definitive andcomplete mode112.
5.3.1 Present livestock production system
Ratholo AEA is really too small for a balanced evaluation of livestock production under communalgrazing. In the communal grazing system herds move over large distances and are often split into separateentities at different times of the year. The system can best be evaluated in much larger areas, within whicha number of herds are confined without significant movements in or out. Nonetheless, an evaluation forRath°lo AEA is attempted here.
It is estimated that the average livestock population of Ratholo AEA consists of 2,000 cattle, of whichabout 600 are brought in seasonally, 4,296 goats and 1,260 donkeys (see Section 3.4.2 and Table 11). Tomeet the grazing requirement of these animals within Ratholo AEA an average annual grazing capacityfor 2,346 Livestock Units (LSUs) is required. See Table 20. In years when this figure is not met, bothcattle and donkeys will turn to browsing shrubby vegetation after depletion of the herbaceous layer.Dependency of cattle and donkeys on browse therefore varies from one year to the other, and is probablyhigher than 10 % in poor rainfall years.
The carrying capacity of grazing land of Ratholo AEA in the year 1993/94 is estimated at 2,282 LSUs.See Table 21. Grazing in this season falls short for only ten days, and the dependency on browse of cattleand donkeys in this year is therefore a low 3 %. Since 1993/94 was a relatively good rainy season, thegrazing capacity of the area is assumed to be lower in most years. Grazing in Ratholo AEA is adequatein good rainfall years, but in poor rainfall years grazers are forced to turn to browse quite early in the dryseason thus straining their health and requiring flexibility of the system (by sale of animals in time ormovement of animals to elsewhere).
The production characteristics of cattle herds averaging 5 and 15 head, owned at present by farmersresiding in Ratholo AEA, are presented in Table 22. Herds averaging 5 and 15 head are typical for farmsof Groups 2 and 3 respectively (see Section 3.3). The technical coefficients used are indicative figuresbased on FMS (1988) (mid 1/3 of farms), and on data collected in the field. There are no reliable data onthe year to year variation of individual coefficients.
Herd production figures below are given for groups of hundred herds to avoid divided numbers and arebased on the per farmer data presented in Table 22. Hundred small cattle herds based in Rath°lo AEA (5cattle average, 40 % of farmers), produce 34 cull animals annually. Hundred medium sized cattle herds(15 head average), based outside Ratholo AEA, produce 108 cull animals. The herd take-off rate is about7 % for both herd sizes. The annual milk production is estimated at 102 liters per herd for 5-cattle-herds,and at 329 liters per herd for 15-cattle-herds.
For goats and donkeys no production simulation has been carried out.
5.3.2 Potential livestock production system
Interventions which are likely to have a positive impact on the production characteristics of the range arelisted in Chapter 4. The advantages and disadvantages of these and some other options are discussedbelow.
12 The Animal Production System and Resource Assement Model for Botswana (APSRAMB) is expected to he ready in 1995
58
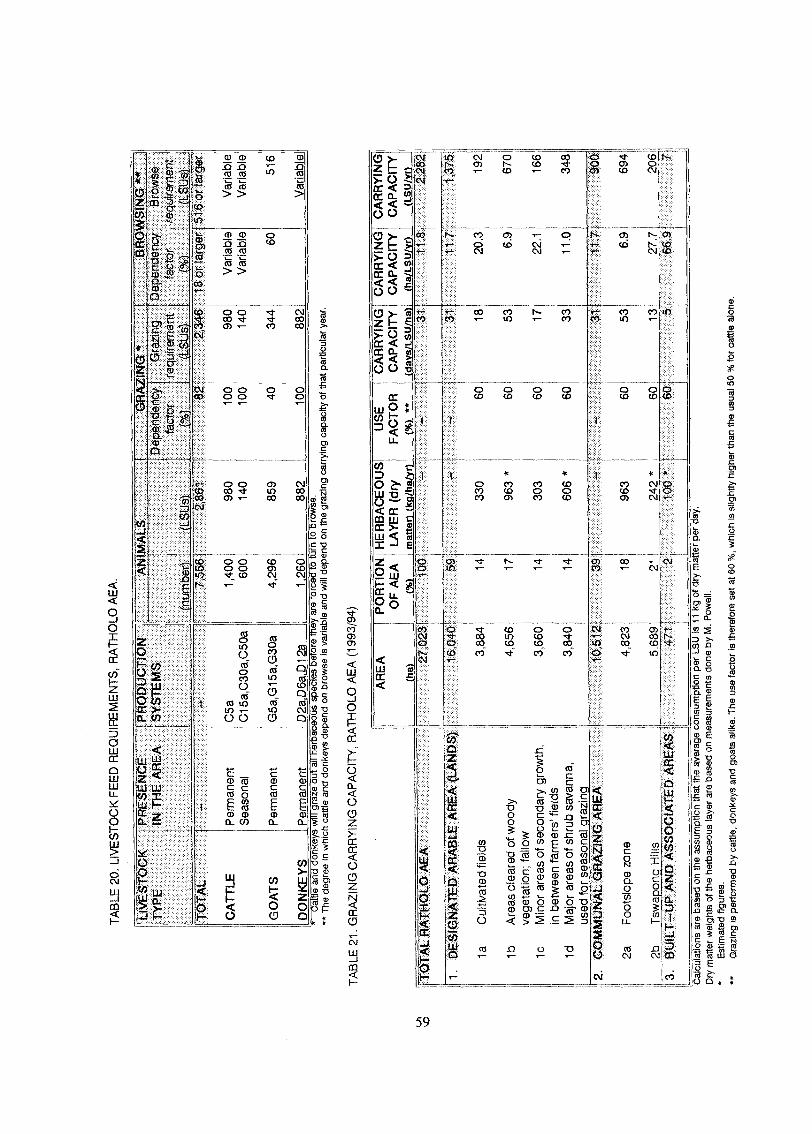
TA
BLE
20.
LIV
ES
TO
CK
FE
ED
RE
QU
IPE
ME
NT
S, R
AT
HO
LO A
EA
.
ILI
VE
ST
OC
K,P
RE
SE
NC
ET
YP
EIN
TH
E A
RE
AP
RO
DU
CT
ION
SY
ST
EM
S
*C
attle
and
don
keys
will
gra
ze o
ut a
ll he
rbac
eous
spe
cies
bef
ore
they
are
torc
ed to
turn
to b
row
se.
** T
he d
egre
e in
whi
ch c
attle
and
don
keys
dep
end
on b
row
se is
var
iabl
e an
d w
ill d
epen
d on
the
graz
ing
carr
ying
cap
acity
of t
hat p
artic
ular
yea
r.
TA
BLE
21,
GR
AZ
ING
CA
RR
YIN
G C
AP
AC
ITY
, RA
TH
OLO
AE
A (
1993
/94)
AR
EA
PO
RT
ION
OF
AE
A
.---
---.2
!-_4
.---
L941
gifv
fLLi
c_ga
Wyc
l414
HE
RB
AC
EO
US
US
ELA
YE
R (
dry
FA
CT
OR
CA
RR
YIN
GC
AP
AC
ITY
icyl
w_L
s um
aL_C
AR
RY
ING
CA
PA
CIT
Y_I
lLaa
su/y
r)1
CA
RR
YIN
GC
AP
AC
ITY
(Ls
u /Y
o
TO
TA
-17F
IAT
HO
LO A
-EA
----
----
----
023
100
--
3111
,82,
282
1.D
ES
IGN
AT
ED
AR
AB
LE A
RE
A (
LAN
DS
)16
,040
5931
11.7
1,ff
5
laC
ultiv
ated
fiel
ds3,
884
1433
060
1820
.319
2
lbA
reas
cle
ared
of w
oody
vege
tatio
n; fa
llow
lcM
inor
are
as o
f sec
onda
ry g
row
th,
in b
etw
een
farm
ers'
fiel
dsid
Maj
or a
reas
of s
hrub
sav
anna
,us
ed fo
r se
ason
al g
razi
ng
4,65
6
3,66
0
3,84
0
17 141
14
963
*
303
606
*
60 60 60
53 17 33
6.9
22.1
11.0
670
166
348
'.
CO
MM
UN
AL
GR
AZ
ING
AF
IEA
10,5
1239
-31
11.7
900
2aF
oots
lope
zon
e4,
823
1896
3i
6053
6.9
694
2bT
swap
onq
Hill
s5,
689
211
242
*60
113
277
206
3. B
UIL
T-U
P A
ND
AS
SO
CIA
TE
D A
RE
AS
471
210
0*
60;
566
.9,
7
I
TO
TA
L7,
556
2,82
:2,
346
8 or
Iarg
16 o
r ar
ger
CA
TT
LEP
erm
anen
tO
sa1,
400
980
100
980
Var
iabl
eV
aria
ble
Sea
sona
lC
l5a,
C30
a,C
50a
600
140
100
140
Var
iabl
eV
aria
ble
GO
AT
SP
errn
anen
tG
5a,G
15a,
G30
a4,
296
859
4034
460
516
DO
NK
EY
SP
erm
anen
tD
2a.D
6a,D
12a
1260
882
100
882
Var
iabl
e
AN
IMA
LSIN
G*
BW
SIN
G**
Dep
ende
ncy
Gra
zing
Dep
ende
ncy
Bro
wse
fact
orre
quire
men
tfa
ctor
requ
trem
ent
num
ber
LSU
sS
usS
Us
Cal
ouia
ticas
are
bas
ed a
n tit
le a
ssum
ptio
n th
at th
e av
erag
e co
nsum
ptio
n pe
r LS
U is
11
kg o
f dry
atte
r pe
r da
yC
ry, m
atte
r w
eigh
ts o
f the
her
bace
ous
laye
r ar
e ba
sed
on m
easu
rem
ents
don
e by
M. P
owel
l."
Est
imat
ed fi
gure
s.*"
Gra
zing
is p
erfo
rmed
by
cattl
e, d
onke
ys a
nd g
oats
alik
e. T
he u
se fa
ctor
is th
eref
ore
set a
t 60
'A, w
hich
is s
light
ly h
ighe
r th
an th
e us
ual
50 %
for
cattl
e al
one.
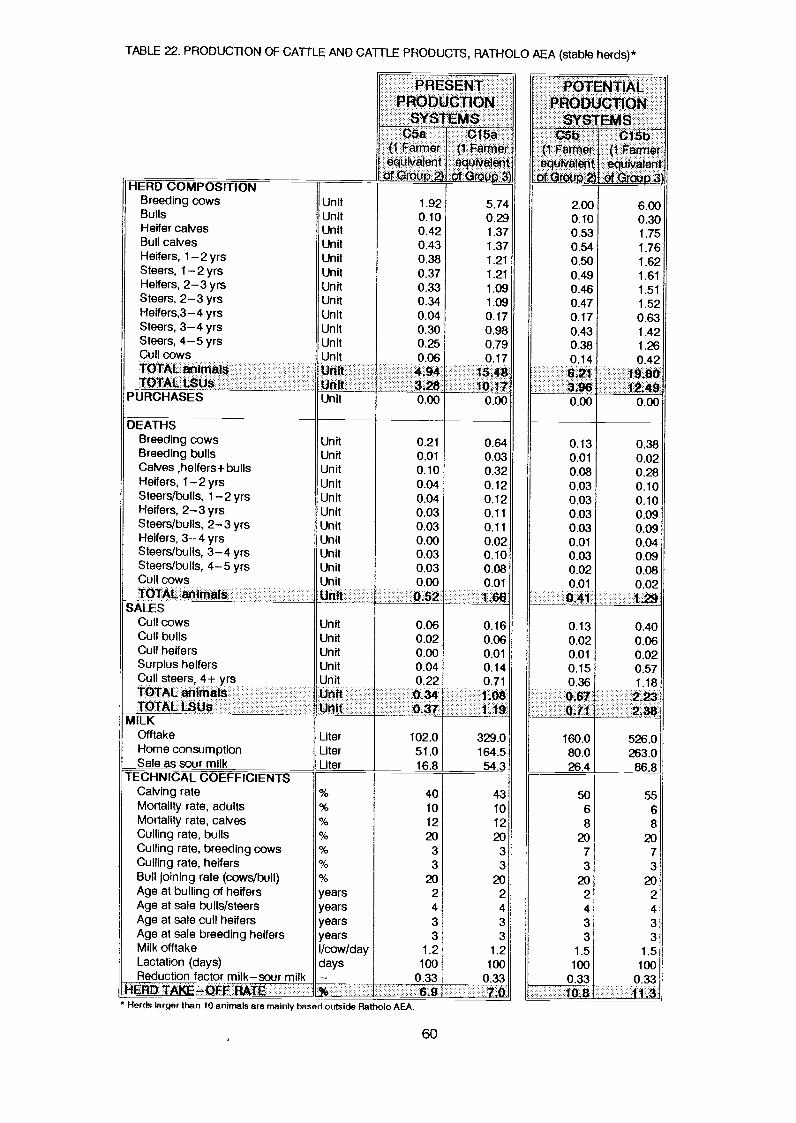
TABLE 22, PRODUCTION OF CA"fTLE AND CATTLE PRODUCTS, RATHOLO AEA (stable herds)*
HERD COMPOSMONBreeding cowsBullsHeifer calvesBull calvesHeifers, 1-2 yrsSteers, 1-2 yrsHeifers, 2-3 yrsSteers, 2-3 yrsHeifers,3-4 yrsSteers, 3-4 yrsSteers, 4-5 yrsCull cowsTOTAL animalsTOTAL 1,9Lis
PURCHASES
DEATHSBreeding cowsBreeding bullsCalves ,heifers+ bullsHeifers, 1-2 yrsSteers/bulls, 1-2 yrsHeifers, 2-3 yrsSteers/bulls, 2-3 yrsHeifers, 3-4 yrsSteers/bulls, 3-4 yrsSteers/bulls, 4-5 yrsCull cowsTOTAL animals
SALESCull cowsCull bullsCull heifersSurplus heifersC,u11 steers, 4+ yrsTOTAL artimataTOTAL 1,,SUa
MILKMakeHome c,onsumptionSale as sour milk
TECHNICAL COEFFICIENTSGehring rateMortality rate, adultsMortality rate, calvesCulling rate, bullsCulling rate, breeding cowsCulling rate, heifersBull joining rate (cows/bull)Age at bulling of heifersAge at sale bulls/steersAge at sale cull heffersAge at sale breeding heifersMilk offtakeLactation (days)Reduction factor milk-sour milk
TAKE-00 RATE
yearsyearsyearsyears1/cow/daydays
* Herds larger than 10 animals are mainly based outside Ratholo AEA.
PRESENTPRODUCTION
SYSTEMSC5a Ci5a
(1 Farmer (1 Farmerequiva1erit equrvalent
oup 2) or Group 3)
5.740.291.371.371.211.211.091.090.170.980.790.17
15.4810,17
0.00
0.640.030.320.120.120.110.110.020.100.080.011 06
0.160.060.010.140.711.081.19
329.0164.5
54.3
4010122033
202433
1.2100
0.336.9
60
43101220
33
202433
1.2100
0.33
SYSTEM05b
(1 Farmeruivalent
POTENTIALPRODUCTION
S015b
r (1 Farmer
equfvelent
- 3
2.00 6.000.10 0.300.53 1.750.54 1.760.50 1.620.49 1.610.46 1.510.47 1.520.17 0.630.43 1.420.38 1.260.14 0.42
6.21 1980.'3.96- 12.490.00 0.00
0.13 0.380.01 0.020.08 0.280.03 0.100.03 0.100.03 0.090.03 0.090.01 0.040.03 0.090.02 0.080.01 0.02
0.41 1.29
0.13 0.400.02 0.060.01 0.020.15 0.570.36 1.180.67: 2.23011 2,38
160.0 526.080.0 263.026.4 86.8
50 556 68 8
20 207 73 3
20 202 24 43 33 3
1.5 1.5100 100
0.33 0.33108 1-1.3
Unit 1.92Unit 0.10Unit 0.42Unit 0.43Unit 0.38Unit 0.37Unit 0.33Unit 0.34Unit 0.04Unit 0.30Unit 0.25Unit 0.06Unit 4,94Unit 3,29Unit 0.00
Unit 0.21Unit 0.01Unit 0.10Unit 0.04Unit 0.04Unit 0.03Unit 0.03Unit 0.00Unit 0.03Unit 0.03Un it 0.00Ufltt 0.62
Unit 0.06Unit 0.02Unit 0.00Un it 0.04Unit 0.22Unit 0.34Unit 0.37
Liter 102.0Liter 51.0Liter 16.8
61
Convert arable land into communal grazing land
Enlargement of the communal range area at the expense of arable land is no option, since the per hectareincome potentially derived from farming is much higher than for raising livestock (see Chapter 6).
Rangeland improvement
Some of the degraded rangelands could be improved through ripping and seeding. Both grasses andlegumes could be introduced. Stylosanthesis guianensis is a promising species in this context (APRRU,1991). However rangeland improvement of this nature is costly and can only be considered in the contextof controlled grazing.
Fodder production
Production of fodder, to provide supplementary feed to cattle, could be an option for farmers withsufficient resources, but would not be easy for small farmers with limited labour and draught power. Itis also doubtful whether the production of fodder crops would show a positive economic return. If foddercrops are considered, they should be integrated into the present farming system, either as a relay crop"with sorghum in years with sufficient rain, or as a rotational crop. A leguminous crop, such as Dohchoslablab, will not only provide fodder but also improve the soil through nitrogen fixation. For such anintensive land use an adequate level of phosphorus in the soil is essential and some modest fertilizerapplication may be needed. Relay cropping, will reduce the yields of individual crops through competitionfor moisture and nutrients, but the overall yield is expected to be higher than for single cropping(Rowland, 1993). If a leguminous fodder crop is grown in rotation with sorghum, most farmers will haveless land available for their traditional crops. It is therefore necessary they crop the land more intensivelyto keep up production levels. Crop rotations including a fodder crops and green manure should go togetherwith improved crop husbandry as described in Section 5.2. Some potential fodder crops are given inSection 5.5.
Increased stocking rates
There is no scope for expansion of existing cattle herds within the confines of Ratholo AEA. Availabilityof grazing is just adequate for the present herds in good years, and already lacking in poor rainfall years(see also Section 5.2.2).
Improved veterinary care and supplementary feeding
Other possible interventions in the livestock management system are a combination of improved veterinarycare, and the provision of supplementary feed to all cattle. Such improved herd management would resultin higher calving rates and lower mortality rates. As a result, without allowing present herds to grow insize or number, both culling rates and milk production would increase. In such a scenario controlledstocking, however, is essential. The total number of grazing animals should not be allowed to grow, andindividual herd sizes should be controlled. This problem, common to communal grazing lands, will befurther discussed in Chapter 7.
13 Relay cropping is the planting of one crop into another at a significant later period
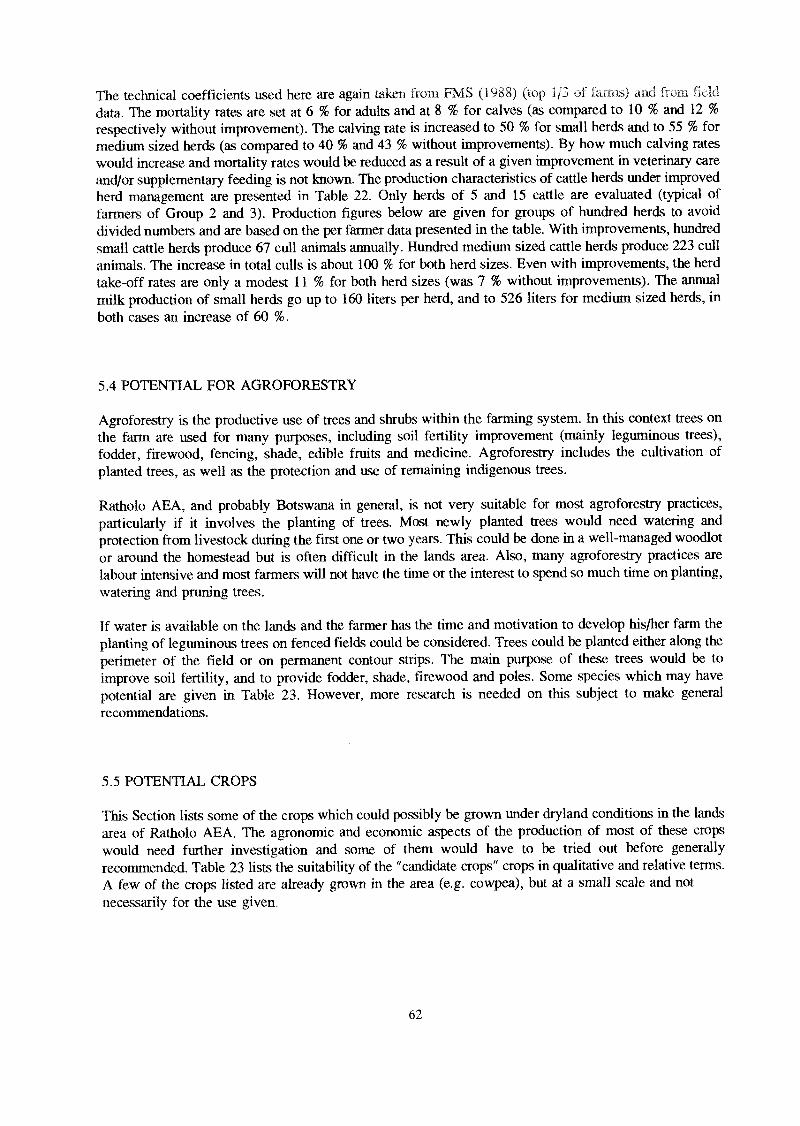
The technical coefficients used here are again taken froni FMS (1988) (icy I/3data. The mortality rates are set at 6 % for adults and at 8 % for calves (as compared to 10 % and 12 %respectively without improvement). The calving rate is increased to 50 % for small herds and to 55 % formedium siz,ed herds (as compared to 40 % and 43 % without improvements). By how much calving rateswould increase and mortality rates would be reduced as a result of a given improvement in veterinary careand/or supplementary feeding is not known. The production characteristics of cattle herds under improvedherd management are presented in Table 22. Only herds of 5 and 15 cattle are evaluated (typical offarmers of Group 2 and 3). Production figures below are given for groups of hundred herds to avoiddivided numbers and are based on the per farmer data presented in the table. With improvements, hundredsniall cattle herds produce 67 cull animals armually. Hundred medium sized cattle herds produce 223 cullanimals. The increase in total culls is about 100 % for both herd sizes. Even with improvements, the herdtake-off rates are only a modest 11 % for both herd sizes (was 7 % without improvements). The annualmilk production of small herds go up to 160 liters per herd, and to 526 liters for medium sized herds, inboth cases an increase of 60 %.
5.4 POTENTIAL FOR AGROFORESTRY
Agroforestry is the productive use of tre,es and shrubs within the fanning system. In this context trees onthe farm are used for many purposes, including soil fertility improvement (mainly leguminous trees),fodder, firewood, fencing, shade, edible fruits and medicine. Agroforestry includes the cultivation ofplanted trees, as well as the protection and use of remaining indigenous trees.
Ratholo AEA, and probably Botswana in general, is not very suitable for most agroforestry practices,particularly if it involves the planting of trees. Most newly planted trees would need watering andprotection ftom livestock during the first one or two years. This could be done in a well-managed woodlotor around the homestead but is often difficult in the lands area. Also, many agroforestry practices arelabour intensive and most farmers will not have the time or the interest to spend so much time on planting,watering and pruning trees.
If water is available on the lands and the farmer has the time and motivation to develop his/her farm theplanting of leguminous trees on fenced fields could be considered. Trees could be planted either along theperimeter of the field or on permanent contour strips. The main purpose of these trees would be toimprove soil fertility, and to provide fodder, shade, firewood and poles. Some species which may havepotential are given in Table 23. However, more research is needed on this subject to make generalrecommendations.
5.5 POTENTIAL CROPS
This Section lists some of the crops which could possibly be grown under dryland conditions in the landsarea of Ratholo AEA. The agronomic and economic aspects of the production of most of these cropswould need further investigation and some of them would have to be tried out before generallyrecommended. Table 23 lists the suitability of the "candidate crops" crops in qualitative and relative tenns.A few of the crops listed are already grown in the area (e.g. cowpea), but at a small scale and notnecessarily for the use given,
62
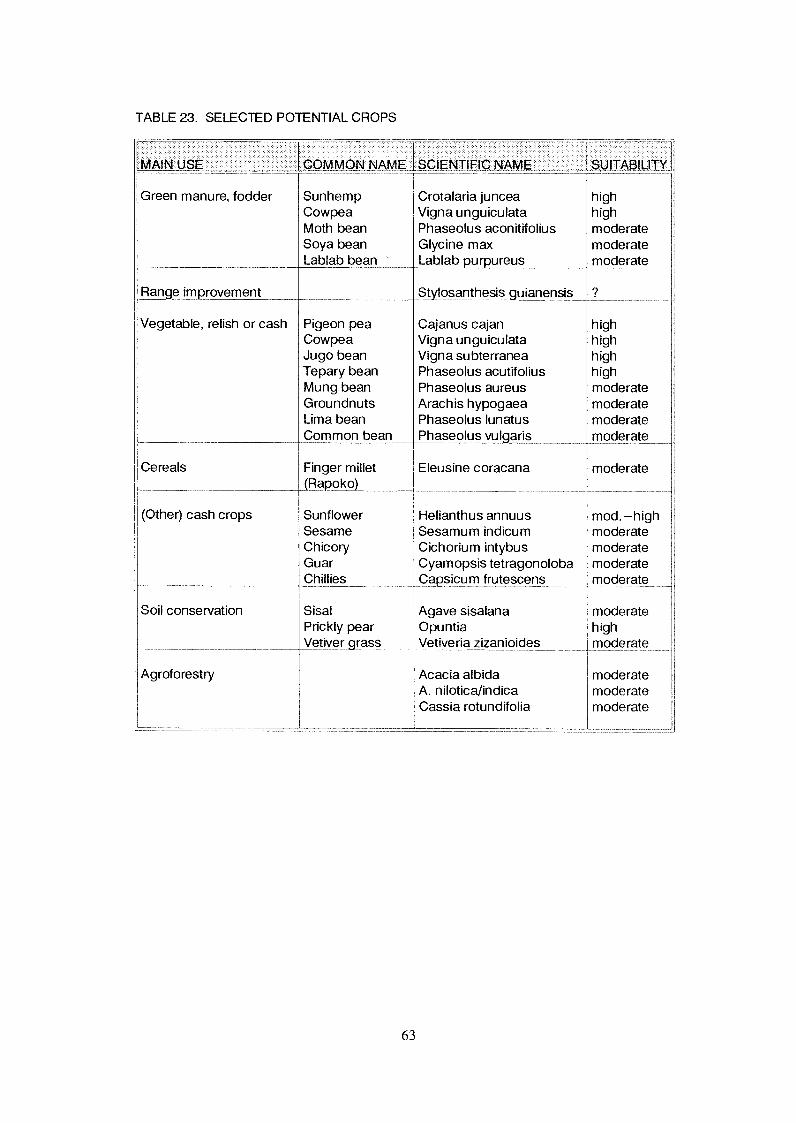
TABLE 23. SELECTED POTENTIAL CROPS
63
[MAIN USE COMMON NAME SCIENTIFIC NAME SUITABILITY
Green manure, fodder Sunhemp Crotalaria juncea highCowpea Vigna unguiculata highMoth bean Phaseolus aconitifolius moderateSoya bean Glycine max moderateLablab bean Lablab_purpureus moderate
Range improvement Stylosanthesis guianensis ?
Vegetable, relish or cash Pigeon pea Cajanus cajan highCowpea Vigna unguiculata highJugo bean Vigna subterranea highTepary bean Phaseolus acutifolius highMung bean Phaseolus aureus moderateGroundnuts Arachis hypogaea moderateLima bean Phaseolus lunatus moderateCommon bean Phaseolus vulgaris moderate
Cereals Finger millet Eleusine coracana moderate(Rapoko)
(Other) cash crops Sunflower Helianthus annuus mod.highSesame Sesamum indicum moderateChicory Cichorium intybus moderateGuar Cyamopsis tetragonoloba moderateChillies Capsicum frutescens moderate
Soil conservation Sisal Agave sisalana moderatePrickly pear Opuntia highVetiver grass Vetiveria zizanioides moderate
Agroforestry Acacia albidaA. nilotica/indicaCassia rotundifolia
moderatemoderatemoderate

5.6 EVALUATION OF IRRIGATED AGRICULTURE
Irrigated cultivation of vegetables and fruit trees is presently practised by two farmers on plots of one ortwo hectares, using water from privately owned boreholes. 'There is no reason why other wealthy farmerscould not set up similar projects, but the profitability of this sort of enterprise has not yet been proven.Certainly, the irrigated plot should be very intensively used and carefully managed to make it productive.Unfortunately, in the area where there are good soils, there is no perennial surface water and there are nosuitable dam sites. Water for irrigation can only be drawn from deep boreholes. Because of the lack ofcheap and abundant water and uncertain markets, irrigated agriculture is not considered in the present landevaluation for Ratholo AEA.
5.7 EVALUATION OF THE PHANE PRODUCTION SYSTEM
Phane production is described in Section 3.4.3. Phane is collected from mopane trees which grow in largenumbers on plains south of the Tswapong Hills. With sufficient rain, hatching takes place in two separatecycles, in December and April. Present yields are given in Table 25 in Chapter 6. The caterpillars arepicked by hand and either boiled and sun-dried, or cured over a fire. The whole process is very labour-intensive. There is little scope for improvement of the system, except maybe in marketing. At present thefarmers receive 110 Pula per bag from local traders who reportedly sell it in South Africa for three to fourtimes this price. Collective arrangement of transport, or the installation of a marketing channel, couldincrease producers' profitability. A negative side effect of phane collection is the fact that peak productionperiods coincide with the peak labour demands for cropping (see Section 3.4) and some farmers may betetnpted to neglect their farms.

CHAPTER 6
ANALYSIS OF PRODUCTION AND FINANCIAL EVALUATION
The results of the evaluation, as described in Chapter 5, receive close examination in the present Chapter.A production analysis and a financial analysis of some aspects of present and potential ("improved")farming situations are presented. The analyses are carried out for three different "pattern farms", whichrepresent the main groups of farmers in Ratholo AEA (see Section 3.3). The pattern farms are coded asFarm I, Farm 2 and Farm 3, and are representative for farmer groups 1, 2 and 3 respectively. The patternfarms are defined in Table 25. In the initial analysis, separate attention was given to the three landmanagement units which are suitable for arable farming: LUs 7, 8 and 9. However it appeared that theresults do not differ significantly between these three LUs, and only the results for LU 7 are given in thisreport.
6.1 PRODUCTION IMPACT
6.1.1 Arable component
Farms I, 2 and 3 are assumed to have a cropped area of 3, 5 and 8 ha respectively. Farm 1 is withoutanimals for traction and crops are planted late (production systems Ms3 and Rs3), while Farms 2 and 3are ploughed and planted earlier on in the season (production systems Ms2 and Rs2). The productionanalysis is carried out for a present situation, in which a mix of traditional crops is grown, and for apotential (itnproved) situation, in which single row cropping of sorghum and groundnuts using fertilizeris practiced. Groundnuts are grown as a cash crop; the crop is selected because of its production potentialand because it is the only cash crop presently included in CYSLAMB. Sunflower would be anotherpotential cash crop (see also Section 5.5.). Yield figures for sorghum and groundnuts result fromCYSLAMB (see Tables 15, 16 and 18) with a reduction factor of 50 or 20% as explained inSection 5.2.1.2). Yield figures for crops not yet incorporated in CYSLAMB, are based on data from thefarm survey.
The yield and production characteristics of Farms 1, 2 and 3, for LU 7 are presented in Table 26 (fordependable yields) and in Table 27 (for median yields). If the full extent of the farms is planted in atraditional way (present situation), dependable yields fall short of subsistence requirements for sorghum,even on the largest farm (Farm 3). If the whole farm is used for improved cropping of sorghum,dependable yields are adequate to cover subsistence requirements on middle sized and larger farms(Farms 2 and 3), but not on small farms (Farm I).
A potential situation is evaluated, for which it is assumed that the farms are split into three sub-units: 2 haplanted to single-row sorghum, 0.25 ha planted to broadcasted mixed crops, and the retnainder of thefarms (respectively 0.75, 2.75 and 5.75 for Farms 1, 2 and 3) allocated to single-row groundnuts. In thissituation, food production does not cover subsistence requirements (as a result of the lower hectarageallocated to sorghum), but a considerable amount of valuable cash crop (groundnuts) replaces subsistencecrops, even on the smallest farm (Farm I). In good years (based on median yields) subsistencerequirements are covered by farm production and all surplus produced is valuable cash crop.
65
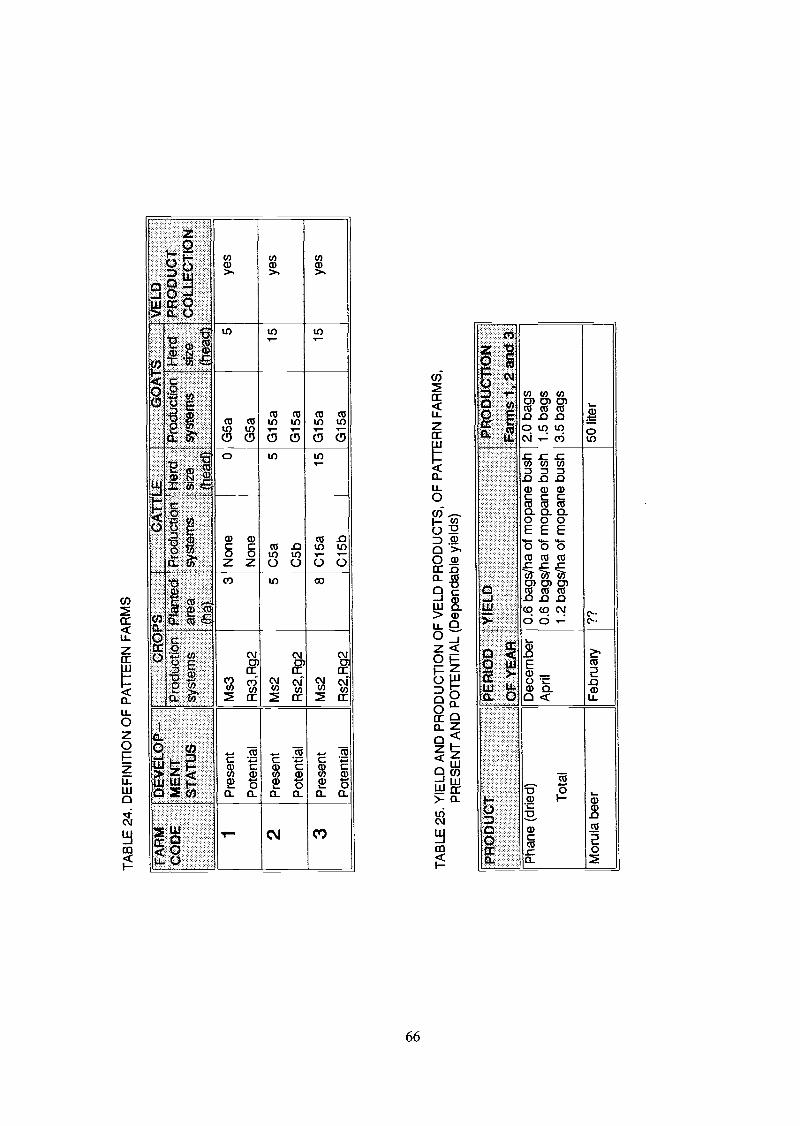
TA
BLE
24.
DE
FIN
ITIO
N O
F P
AT
TE
RN
FA
RM
S
TA
BLE
25,
YIE
LD A
ND
PR
OD
UC
TIO
N O
F V
ELD
PR
OD
UC
TS
, OF
PA
TT
ER
N F
AR
MS
,P
RE
SE
NT
AN
D P
OT
EN
TIA
L (D
epen
dabl
e yi
elds
)
FA
RM
CO
DE
DE
VE
LOP
ME
NT
ST
AT
US
CR
OP
SP
rodu
ctio
nsy
stem
s
CA
TT
LE Her
dsi
ze
GO
AT
SV
ELD
Her
dP
RO
DU
CT
size
CO
LLE
CT
ION
a
Pla
nted
area a
Pro
duct
ion
syst
ems
Pro
duct
ion
syst
ems
1P
rese
ntM
s33
Non
e0
G5a
5ye
s
Pot
entia
lR
s3,R
g2N
one
G5a
2P
rese
ntM
s25
C5a
5 G
15a
15ye
s
Pot
entia
lR
s2,R
g2C
5bG
15a
3P
rese
ntM
s28
C15
a15
G15
a15
yes
Pot
entia
l_R
s2,R
o2C
15b
G15
a
PR
OD
U T
PE
RIO
DY
IELD
PR
OD
UC
TIO
N
Of Y
EA
RF
arm
s 1,
, 2 a
nd 3
Pha
ne (
drie
d) Tot
al
Dec
embe
rA
pril
0.6
bags
/ha
of m
opan
e bu
sh0.
6 ba
gs/h
a of
mop
ane
bush
1.2
bags
/ha
of m
opan
e bu
sh
2.0
bags
1.5
bags
3.5
bags
Mor
ula
beer
Feb
ruar
y??
50 li
ter
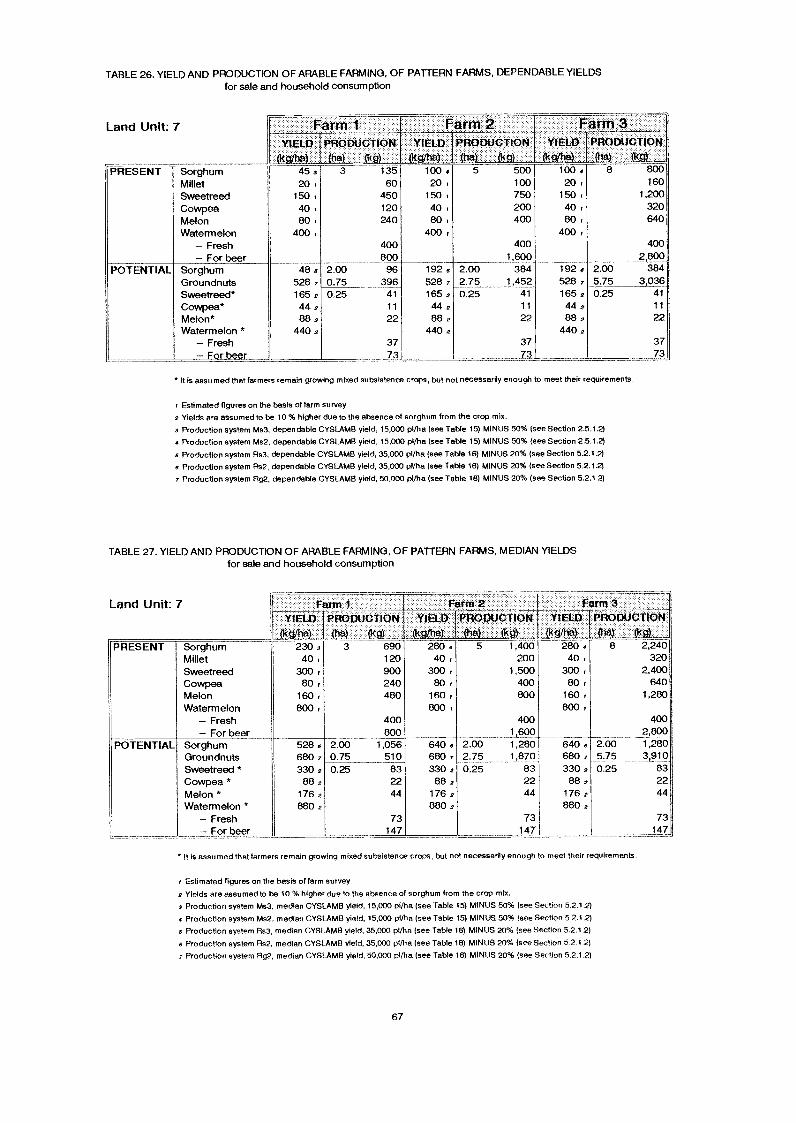
TABLE 26. YIELD AND PRODUCTION OF ARABLE FARMING, OF PATTERN FARMS, DEPENDABLE YIELDSfor sale and household consumption
Land Unit: 7
SorghumMilletSweetreedCowpeaMelonWatermelon
Fresh- For beer
SorghumGroundnutsSweetreed*Cowpea*Melon*Watermelon *
- FreshFor beer
PRESENT
POTENTIAL
Land Unit: 7
PRESENT SorghumMilletSweetreedCowpeaMelonWatermelon
FreshFor beer
POTENTIAL SorghumGroundnutsSweetreed *Cowpea *Melon *Watermelon *
Fresh- For bee
FarmYIELD PRODUCTION YIELD
Owl/.44, ha _0445 2 3 135 100 420, 60 20
150 450 150,40 120 40,
240 80,400 400
400800
2.00 960.75 3960.25 41
11
22
48 6528 7165244 288 2
440 2
Farm 3PFIODUCTION YIELD PRODUCTION
Farm
192e 2.00528 7 2.75165a 0.2544 2
882 22440
37 3773 7
L__LAgTh 011»500 100 4 8100750200 40400
4001,600
3841,452
41
400 y
192 e528165 244 288 2
440 2
2.005.750.25
It Is assumed that farmers remain growing mixed subsistence crops, but not necessarly enough to meet their requirements.
r Estimated figures on the basis of farm survey2 Yields are assumed to be 10 % higher due to the absence of sorghum from the crop mix.
s Production system Ms3, dependable CYSLAMB yield, 15,000 pl/ha (see Table 15) MINUS 50% (see Section 2.5.1.2)
Production system Ms2, dependable CYSLAMB yield, 15,000 pl/ha (see Table 151 MINUS 50% (see Section 2.5.1.2)
s Production system Rs3, dependable CYSLAMB yield, 35,000 pi/ha (see Table 16) MINUS 20% (see Sechon 5.2.1.2)
e Production system Rs2, dependable CYSLAMB yield, 35,000 pVha (see Table 16) MINUS 20% (see Section 5.2.1.2)
7 Production system Rg2, dependable CYSLAMB yield, 50,000 pi/ha (see Table 18) MINUS 20% (see Section 52.1.2)
TABLE 27. YIELD AND PRODUCTION OF ARABLE FAFiMING, OF PATTERN FARMS, MEDIAN YIELDSfor sale and household consumpt(on
Farm IYIELD -PRODUCTION
/ha) (ha), (41230 3 3 69040, 120
300 y 90080 I 240
160 y 480800 I
528 5680 7330
88 2176 2880 2
2.000.750.25
It is assumed that farmers remain growing mixed subsistence crops, but not necessarly enough to meet their requirements.
I Estimated figures on the basis of farm survey
Yields are assumed to be 10% higher due to the absence of sorghum from the crop mix.3 Production system Ms3, median CYSLAMB yield, 15,000 pl/ha (see Table 15) MINUS 50% (see Section 5.2.1.2)
4 Production system Ms2, median CYSLAMB yield, 15,000 pi/ha (see Table 15) MINUS 50% (see Section 5.2.1.2)
s Production system Rs3, median CYSLAMB yield, 35,000 pi/ha (see Table 16) MINUS 20% (see Section 5,2.1.2)
Production system Rs2, median CYSLAMB yield, 35,000 pi/ha (see Table 16) MINUS 20% (see Section 5.2.1.2)
7 Production system Rg2, median CYSLAMB yield, 50,000 pi/ha (see Table 18) MINUS 20% (see Section 5.2.1.2)
280 440m
300 y80,
160,800 y
640 e680 7330 288 2
176 2880 2
400800
1,056510
832244
7
147
67
Farm 3TION YIELD PRODUCTION
a M..,1,400 280 4 8 2,
200 40 t 3201,500 300 r 2,400
400 80, 640800 160m 1,280
800 y400 400
1,600 2,8002.00 1,280 640 5 2.00 1,2802.75 1,870 680 7 5.75 3,9100.25 83 330 2 0.25 83
22 88u 2244 176 2 44
88073 7
147 147
3o
4002,800 i
3843,036
41
22
77
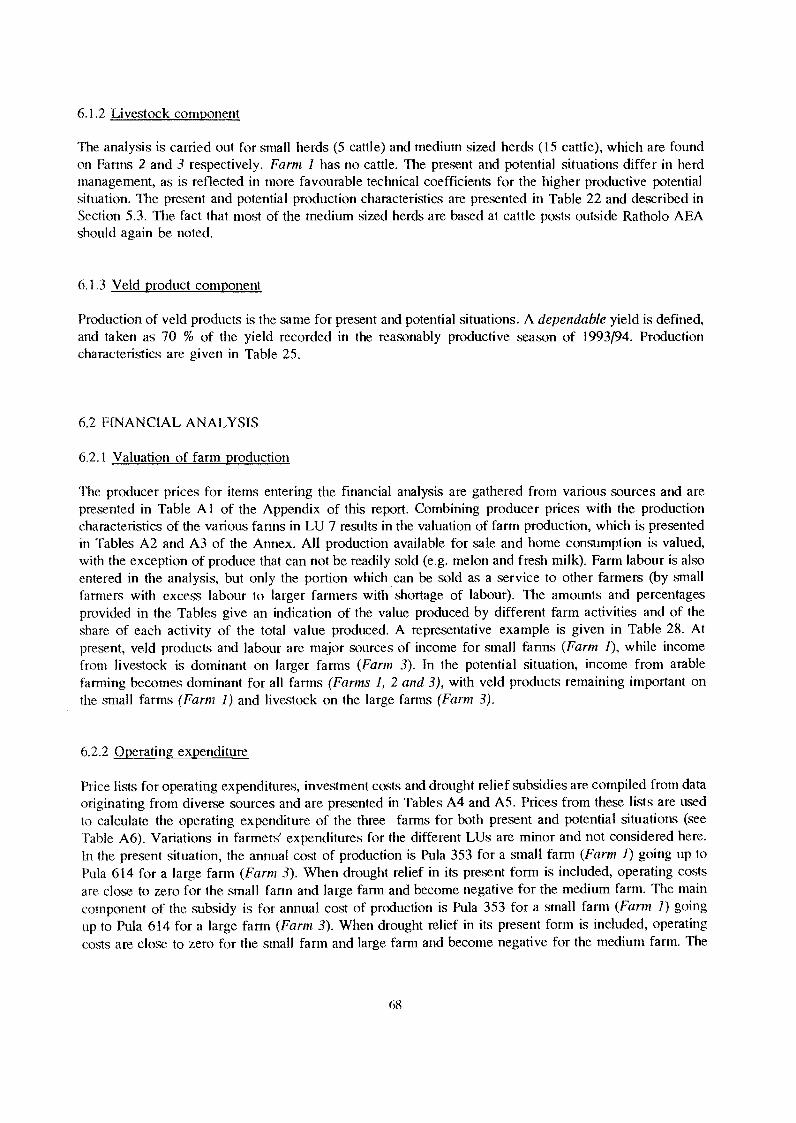
6.1.2 Livestock component
The analysis is carried out for small herds (5 cattle) and medium sized herds (15 cattle), which are foundon Fartns 2 and 3 respectively. Farm I has no cattle. The present and potential situations differ in herdmanagement, as is reflected in more favourable technical coefficients for the higher productive potentialsituation. The present and potential production characteristics are presented in Table 22 and described inSection 5.3. The fact that most of the medium sized herds are based at cattle posts outside Ratholo AEAshould again be noted.
6,1.3 Veld product component
Production of veld products is the satne for present and potential situations. A dependable yield is defined,and taken as 70 % of the yield recorded in the reasonably productive season of 1993/94. Productioncharacteristics are given in Table 25.
6.2 FINANCIAL ANALYSIS
6.2.1 Valuation of farm production
The producer prices for items entering the financial analysis are gathered from various sources and arepresented in Table A 1 of the Appendix of this report. Combining producer prices with the productioncharacteristics of the various farms in LU 7 results in the valuation of farm production, which is presentedin Tables A2 and A3 of the Annex. All production available for sale and home consumption is valued,with the exception of produce that can not be readily sold (e.g. melon and fresh tnilk). Farm labour is alsoentered in the analysis, but only the portion which can be sold as a service to other farmers (by smallfarmers with excess labour to larger farmers with shortage of labour). The amounts and percentagesptovided in the Tables give an indication of the value produced by different farm activities and of the,:hare of each activity of the total value produced. A representative example is given in Table 28. Atple,,ent, veld products and labour are major sources of income for small fartns (Farm I), while incomefrom livestock is dominant on larger farms (Farm 3). In the potential situation, income from arablefarming becomes dominant for all farms (Farms I, 2 and 3), with veld products remaining important onthe small farms (Farm I) and livestock on the large farms (Farm 3).
6.2.2 Operating expenditure
Price lists for operating expenditures, investment costs and drought relief subsidies are compiled from dataoriginating from diverse sources and are presented in Tables A4 and A5. Prices from these lists are usedto calculate the operating expenditure of the three farms for both present and potential situations (seeTable A6). Variations in farmers' expenditures for the different LUs are minor and not considered here.In the present situation, the annual cost of production is Pula 353 for a stnall farm (Farm 1) going up toPula 614 for a large farm (Farm 3). When drought relief in its present form is included, operating costsare close to zero for the small farm and large farm and become negative for the medium farm. The maincomponent of the subsidy is for annual cost of production is Pula 353 for a small farm (Farm I) going
up to Pula 614 for a large farm (Farm 3). When drought relief in its present form is included, operatingcosts are close to zero for the small farm and large fann and become negative for the medium farm. The
68
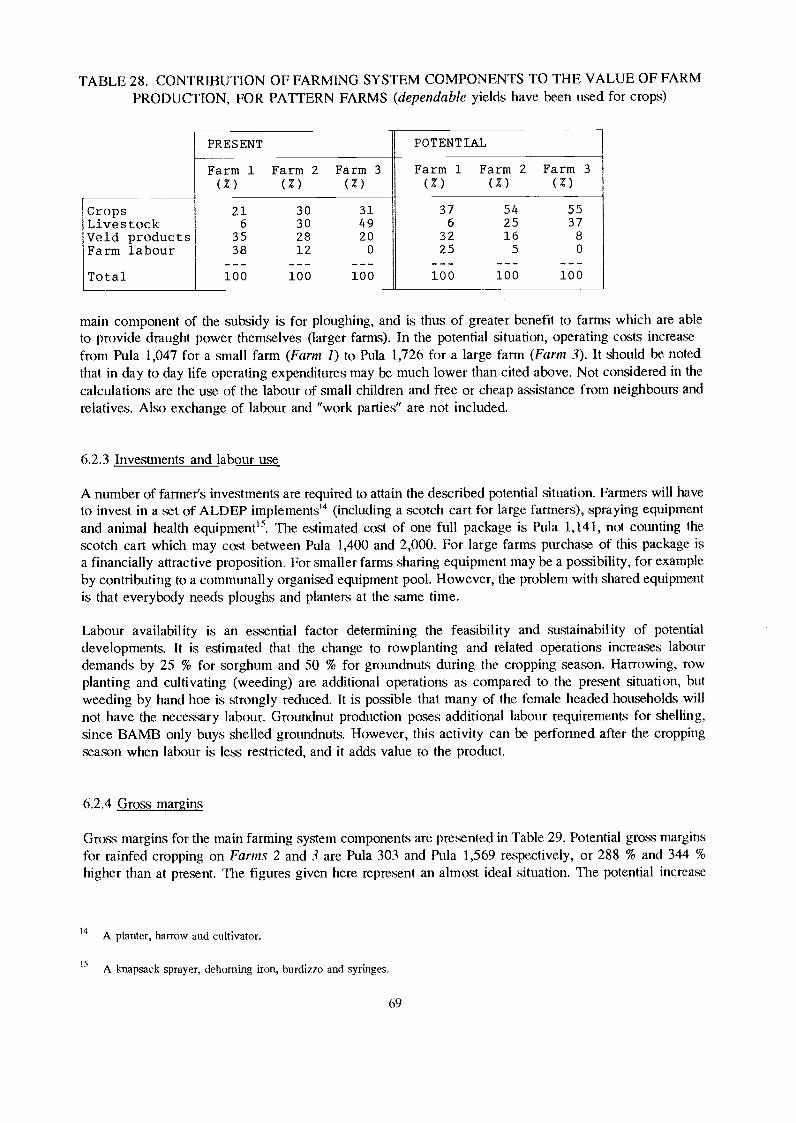
TABLE 28. CONTRIBUTION OF FARMING SYSTEM COMPONENTS TO THE VALUE OF FARMPRODUCTION, FOR PATTERN FARMS (dependable yields have been used for crops)
main component of the subsidy is for ploughing, and is thus of greater benefit to farms which are ableto provide draught power themselves (larger farms). In the potential situation, operating costs increasefrom Pula 1,047 for a small farm (Farm I) to Pula 1,726 for a large farm (Farm 3). It should be notedthat in day to day life operating expenditures may be much lower than cited above. Not considered in thecalculations are the use of the labour of small children and free or cheap assistance from neighbours andrelatives. Also exchange of labour and "work parties" are not included.
6.2.3 Investments and labour use
A number of farmer's investments are required to attain the described potential situation. Farmers will haveto invest in a set of ALDEP implements" (including a scotch cart for large farmers), spraying equipmentand animal health equipment15. The estimated cost of one full package is Pula 1,141, not counting thescotch cart which may cost between Pula 1,400 and 2,000. For large farms purchase of this package isa financially attractive proposition. For smaller farms sharing equipment may be a possibility, for exampleby contributing to a communally organised equipment pool. However, the problem with shared equipmentis that everybody needs ploughs and planters at the same time.
Labour availability is an essential factor determining the feasibility and sustainability of potentialdevelopments. It is estimated that the change to rowplanting and related operations increases labourdemands by 25 % for sorghum and 50 % for groundnuts during the cropping season. Harrowing, rowplanting and cultivating (weeding) are additional operations as compared to the present situation, butweeding by hand hoe is strongly reduced. It is possible that many of the female headed households willnot have the necessary labour. Groundnut production poses additional labour requirements for shelling,since BAMB only buys shelled groundnuts. However, this activity can be performed after the croppingseason when labour is less restricted, and it adds value to the product.
6.2.4 Gross margins
Gross margins for the main farming system components are presented in Table 29. Potential gross marginsfor rainfed cropping on Farms 2 and 3 are Pula 303 and Pula 1,569 respectively, or 288 % and 344 %higher than at present. The figures given here represent an almost ideal situation. The potential increase
14 A planter, harrow and cultivator.
15 A knapsack sprayer, dehoming iron, burdizzo and syringes.
69
PRESENT POTENTIAL
Farm 1 Farm 2 Farm 3 Farm 1 Farm 2 Farm 3(Z) (Z) (Z) (Z) (Z) ( Z )
Crops 21 30 31 37 54 55
Livestock 6 30 49 6 25 37
Veld products 35 28 20 32 16 8
Farm labour 38 12 0 25 5 0
--- --- --- --- --- ---Total 100 100 100 100 100 100
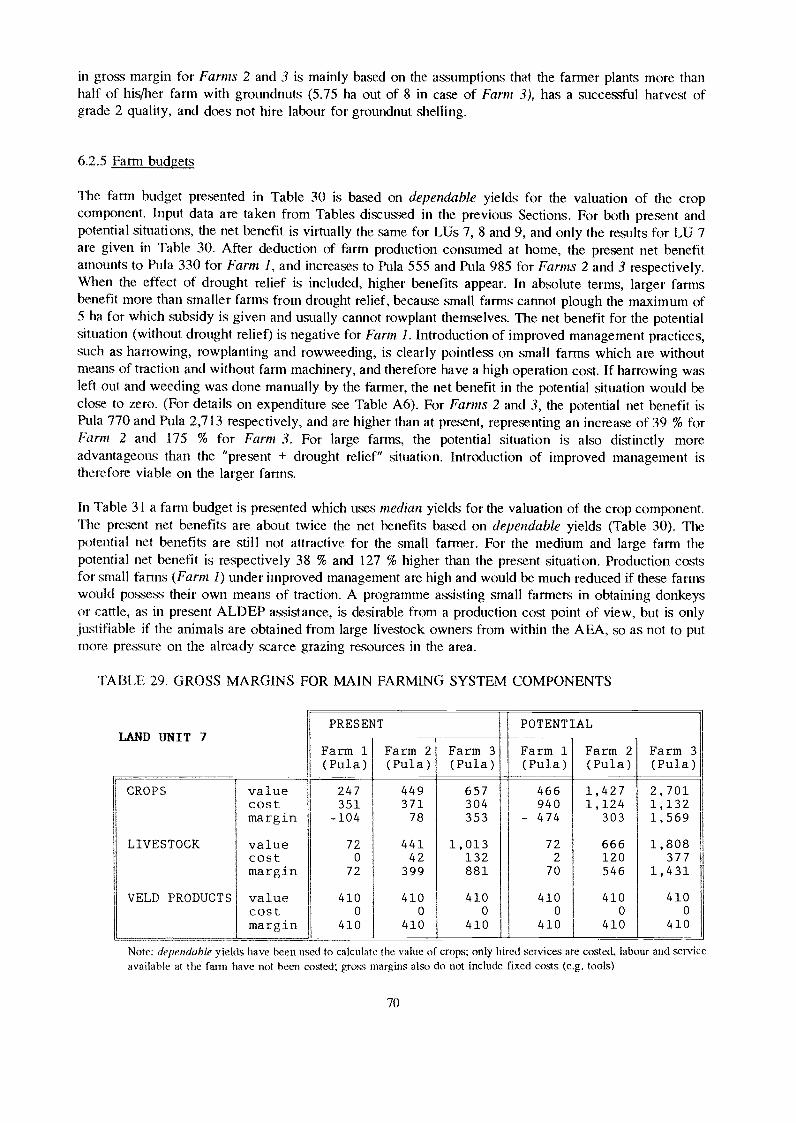
in gross margin for Farms 2 and 3 is mainly based on the assumptions that the farmer plants more thanhalf of his/her farm with groundnuts (5.75 ha out of 8 in case of Farm 3), has a successful harvest ofgrade 2 quality, and does not hire labour for groundnut shelling.
6.2.5 Farm budgets
The farm budget presented in Table 30 is based on dependable yields for the valuation of the cropcomponent. Input data are taken from Tables discussed in the previous Sections. For both present andpotential situations, the net benefit is virtually the same for LUs 7, 8 and 9, and only the results for LU 7are given in Table 30. After deduction of farm production consumed at home, the present net benefitamounts to Pula 330 for Farm I, and increases to Pula 555 and Pula 985 for Farms 2 and 3 respectively.When the effect of drought relief is included, higher benefits appear. In absolute terms, larger farmsbenefit more than smaller farms from drought relief, because small farms cannot plough the maximum of5 ha for which subsidy is given and usually cannot rowplant themselves. The net benefit for the potentialsituation (without drought relief) is negative for Farm I. Introduction of improved management practices,such as harrowing, rowplanting and rowweeding, is clearly pointless on small farms which are withoutmeans of traction and without farm machinery, and therefore have a high operation cost. If harrowing wasleft out and weeding was done manually by the farmer, the net benefit in the potential situation would beclose to zero. (For details on expenditure see Table A6). For Farms 2 and 3, the potential net benefit isPula 770 and Pula 2,713 respectively, and are higher than at present, representing an increase of 39 % forFarm 2 and 175 % for Farm 3. For large farms, the potential situation is also distinctly moreadvantageous than the "present + drought relief" situation. Introduction of improved management istherefore viable on the larger farms.
In Table 31 a farm budget is presented which uses median yields for the valuation of the crop component.The present net benefits are about twice the net benefits based on dependable yields (Table 30). Thepotential net benefits are still not attractive for the small farmer. For the medium and large farm thepotential net benefit is respectively 38 % and 127 % higher than the present situation. Production costsfor stnall farms (Farm 1) under improved management are high and would be much reduced if these fartnswould possess their own means of traction. A programme assisting small farmers in obtaining donkeysor cattle, as in present ALDEP assistance, is desirable from a production cost point of view, but is onlyjustifiable if the animals are obtained from large livestock owners from within the AEA, so as not to putmole pressure on the already scarce grazing re,sources in the area.
TABLE 29. GROSS MARGINS FOR MAIN FARMING SYSTEM COMPONENTS
Note: dependable yields have been used to calculate the value of crops; only I ired services are costed, labour and serviceavailable at the farm have not been costed; gross margins also do not include fixed costs (e.g. tools)
70
LAND UNIT 7PRESENT POTENTIAL
Farm 1(Pula)
CROPS value 247 449 657 466 1,427 2,701cost 351 371 304 940 1,124 1,132margin -104 78 353 - 474 303 1,569
IVESTOCK value 72 441 1,013 72 666 1,808cost 0 42 132 2 120 377margin 72 399 881 70 546 1,431
VELD PRODUCTS value 410 410 410 410 410 410cost 0 0 0 0 0 0
margin 410 410 410 410 410 410
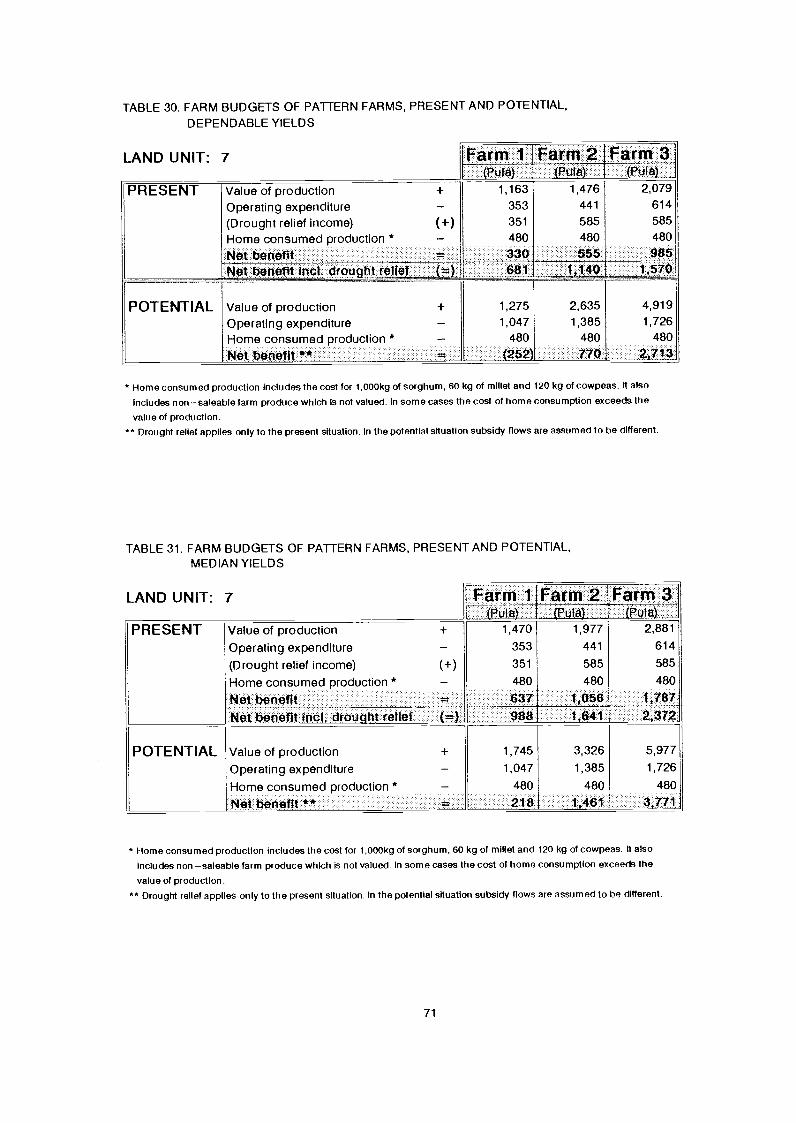
TABLE 30. FARM BUDGETS OF PATTERN FARMS, PRESENT AND POTENTIAL,DEPENDABLE YIELDS
* Home consumed production Includes the cost for 1,000kg of sorghum, 60 kg of millet and 120 kg of cowpeas. tt also
includes nonsaleable farm produce which is not valued. In some cases the cost of home consumption exceeds the
value of production.** Drought relief applies only to the present situation. In the potential situation subsidy flows are assumed to be different.
TABLE 31. FARM BUDGETS OF PATTERN FARMS, PRESENT AND POTENTIAL,MEDIAN YIELDS
* Home consumed production includes the cost for 1,000kg of sorghum, 60 kg of millet and 120 kg of cowpeas. It also
includes nonsaleable farm produce which is not valued. In some cases the cost of home consumption exceeds the
value of production.
** Drought relief applies only to the present situation. In the potential situation subsidy flows are assumed to be different.
71
LAND UNIT: 7 Farm 'I Farm 2 Farm 3(Pula) (Pula) (Pula)
PRESENT Value of production 1,163 1,476 2,079
Operating expenditure 353 441 614
(Drought relief income) (+) 351 585 585
Home consumed production * 480 480 480
Net benefit 330 565 986et benfit inot drought fei etN e . ._. 681 1 140 i 570
POTENTIAL Value of production + 1,275 2,635 4,919
Operating expenditure 1,047 1,385 1,726
Home consumed production * 480 480 480
Net benefit (252) 770 271.3
LAND UNIT: 7 Farm 1(Puiti)
Farm 2 Farm 3(puta)
.
(Pula)PRESENT Value of production 1,470 1,977 2,881
Operating expenditure 353 441 614
(Drought relief income) (+) 351 585 585
Home consumed production * 480 480 480
Net benefit 637 1,056 1,781
Net benefit tool drou ht re i 980 1,641 2,372
POTE NTIAL Value of production + 1,745 3,326 5,977
Operating expenditure 1,047 1,385 1,726
Home consumed production * 480 480 480
Net benefit ** 218 1,461 3 771Lj
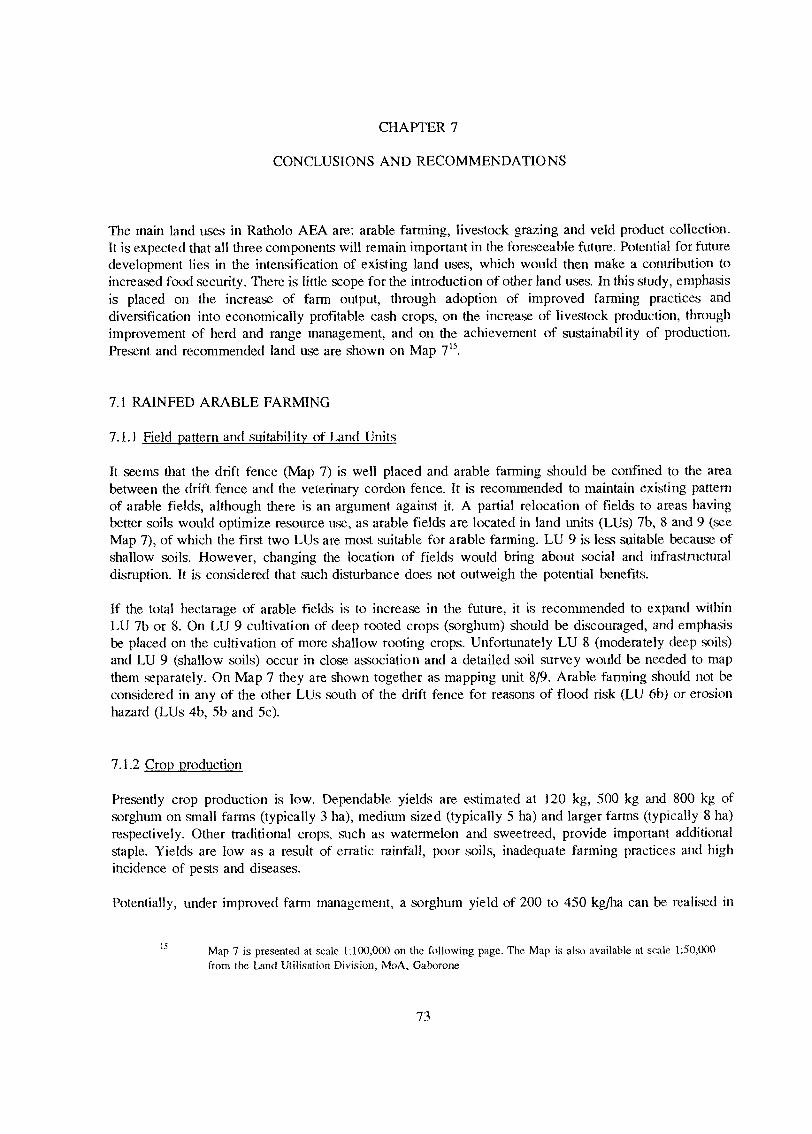
73
CHAPTER 7
CONCLUSIONS AND RECOMMENDATIONS
The main land uses in Ratholo AEA are: arable farming, livestock grazing and veld product collection.It is expected that all three components will remain important in the foreseeable future. Potential for futuredevelopment lies in the intensification of existing land uses, which would then make a contribution toincreased food security. There is little scope for the introduction of other land uses. In this study, emphasisis placed on the increase of farm output, through adoption of improved farming practices anddiversification into economically profitable cash crops, on the increase of lives-tock production, throughimprovement of herd and range management, and on the achievement of sustainability of production.Present and recommended land use are shown on Map 7'5.
7.1 RAINFED ARABLE FARMING
7.1.1 Field pattern and suitability of Land Units
It seems that the drift fence (Map 7) is well placed and arable farming should be confined to the areabetween the drift fence and the veterinary cordon fence. It is recommended to maintain existing pattemof arable fields, although there is an argument against it. A partial relocation of fields to areas havingbetter soils would optimize resource use, as arable fields are located in land units (LUs) 7b, 8 and 9 (seeMap 7), of which the first two LUs are most suitable for arable farming. LU 9 is less suitable becaust. ofshallow soils. However, changing the location of fields would bring about social and infrastructuraldisruption. It is considered that such disturbance does not outweigh the potential benefits.
If the total hectarage of arable fields is to increase in the future, it is recommended to expand withinLU 7b or 8. On LU 9 cultivation of deep rooted crops (sorghum) should be discouraged, and emphasisbe placed on the cultivation of more shallow rooting crops. Unfortunately LU 8 (moderately deep soils)and LU 9 (shallow soils) occur in close association and a detailed soil survey would be needed to mapthem separately. On Map 7 they are shown together as mapping unit 8/9. Arable fanning should not beconsidered in any of the other LUs south of the drift fence for reasons of flood risk (LU 6b) or erosionhazard (LUs 4b, 5b and 5c).
7.1.2 Crop production
Presently crop production is low. Dependable yields are estimated at 120 kg, 500 kg and 800 kg ofsorghum on small farms (typically 3 ha), medium sized (typically 5 ha) and larger fartns (typically 8 ha)respectively. Other traditional crops, such as watermelon and sweetreed, provide important additionalstaple. Yields are low as a result of erratic rainfall, poor soils, inadequate farming practices and highincidence of pests and diseases.
Potentially, under improved farm management, a sorghum yield of 200 to 450 kg/ha can be realised in
15 Map 7 is presented at scale 1:100,000 on the following page. The Map is also available at scale 1:50,000from the Land Utilisation Division, MoA, Gaborone
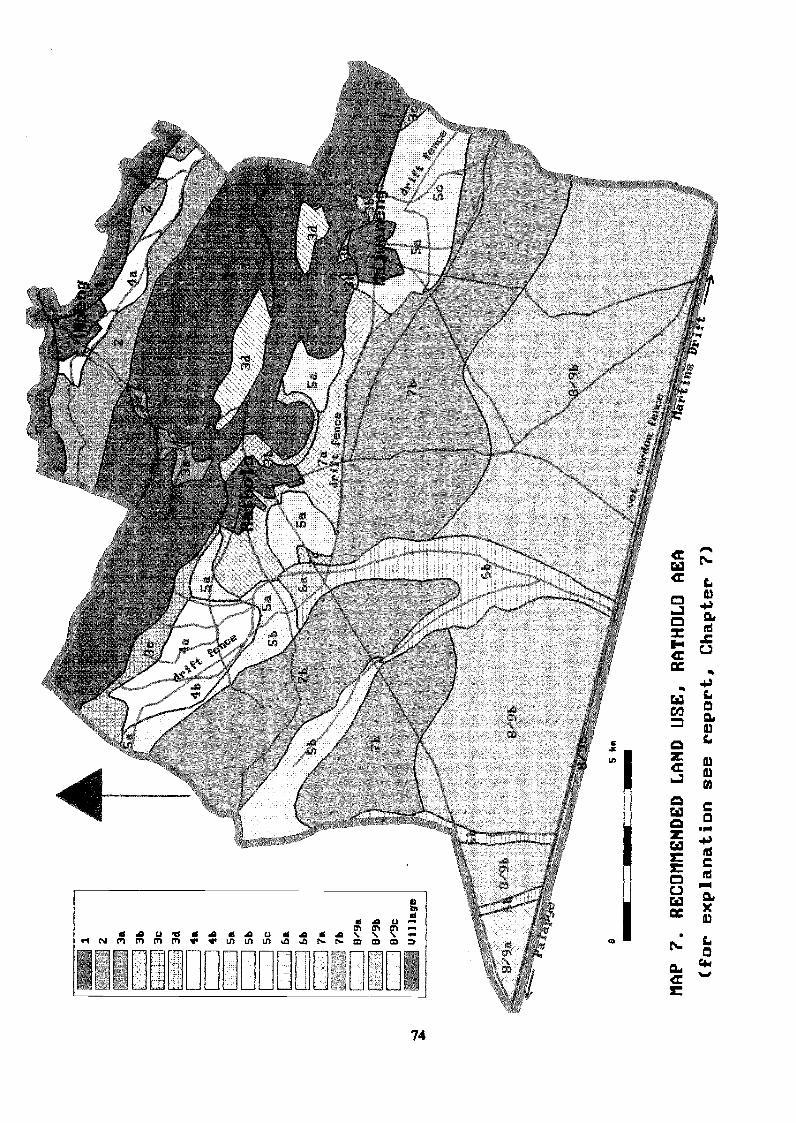
74.7
777-
7-7-
77w
*
1 3a 3b 3c 3d 4a 4b 5a 5b Sc
6a 6b 7a 7b 8/9a
13/9
b
13/9
c
1J1
I lag
s
e
Sb
74=
'at 4a
4b1,
..1
7b
-
NAP 7. RECUMENDED LAND USE, RATHULD AEA
(for explanation see report, Chapter 7)
1:7,
5
N
k7a
drfe
ri e
A
Sa
3d
47¡7
.3
4'7
7b4
r4,
*"v
Sc 73
7
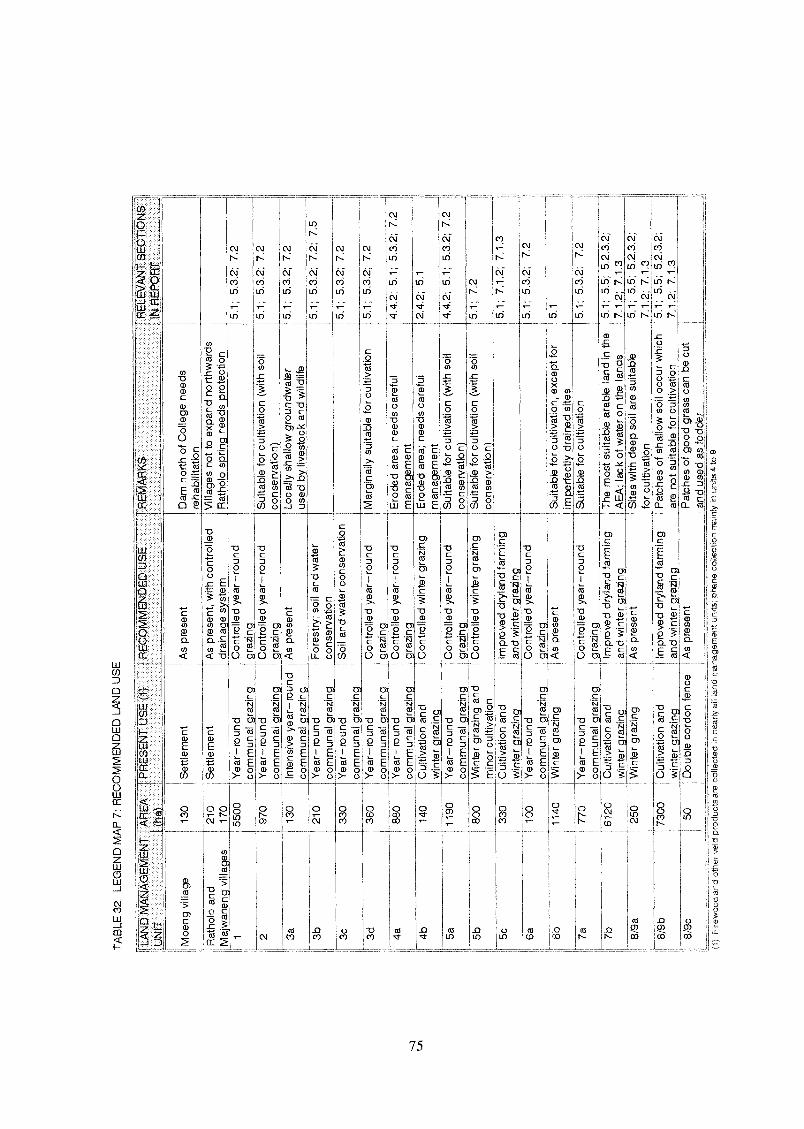
TA
BLE
32.
LE
GE
ND
MA
P 7
: RE
CO
MM
EN
DE
D L
AN
D U
SE
8,9c
50! D
oubl
e co
rdon
fanc
eI A
s pr
esen
t1F
!3--
--'n
es o
f goo
d gr
ass
can
be c
utI
:'r.,1
',:s
ed.1
. 3 fo
dder
,i)-
'::',7
-7 :1
and
ner
veld
pro
duct
sare
cec
ted
- ne
ar..
cfla
;nan
agem
ent u
nits
; pha
ne o
con'
,:_:-
-a.
.'-.
'S U
n 9
1FLA
ND
MA
NA
GE
ME
NT
I UN
IT.
AR
EA
PR
ES
EN
T U
SE
(1}
(ha)
RE
CO
MM
E\J
DE
D U
SE
RE
MA
RK
S'.
RE
LEV
AN
T S
EC
TIO
NS
IN R
EP
OR
T
oM e
ng v
illa
130
Set
tlem
ent
1 ' As
pres
ent
I
Dam
nor
th o
f Col
lege
nee
dsre
habi
litat
ion
1
Rat
holo
and
210
Set
tlem
ent
Maj
wan
eng
villa
ges
117
0
1
As
pres
ent,
with
con
trol
led
Vill
ages
not
to e
xpan
d no
rthw
ards
I ; dra
inag
e sy
stem
Rat
holo
spr
ing
need
s pr
otec
tion
!!1
' 550
0; Y
earr
ound
, , com
mun
al g
razi
ngI C
ontr
olle
d ye
arro
und
5,1;
5.3
.2; 7
.2gr
azin
g; C
ontr
olle
d ye
arro
und
Sui
tabl
e fo
r cu
ltiva
tion
(with
soi
l5.
1; 5
.3.2
; 7.2
azin
.co
nser
vatio
n)2
i!
970
! Yea
rrou
nd!c
omm
unal
sra
z n
1
3ai
130
I Int
ensi
ve y
earr
ound
icom
mun
al g
razi
ngA
s pr
esen
Loca
lly s
hallo
w g
roun
dwat
er5.
1; 5
.3.2
; 7.2
used
by
lives
tock
and
wild
life
3b21
0I Y
earr
ound
! ico
mm
unal
gra
zing
For
estr
y; s
oil a
nd w
ater
j 5.1
; 5.3
.2; 7
.2; 7
.5! c
onse
rvat
ion
330
Yea
rrou
ndco
mm
unal
gra
zing
! Soi
l and
wat
er c
onse
rva
n5.
1; 5
.3,2
; 7.2
!
d36
0
880
1Yea
rrou
nd
Yea
rrou
ndco
mm
unal
gra
zing
; com
mun
al g
razi
ng
I ! Con
trol
led
year
roun
dI
Mar
gina
lly s
uita
ble
for
culti
vatio
n' g
razi
ngI C
ontr
olle
d ye
arro
und
Ero
ded
area
; nee
ds c
aref
ul! g
razi
ngm
anag
emen
ti
5.1;
5.3
.2; 7
.2
4.4.
2; 5
.1; 5
.3.2
; 7.2
1
4e1 ,
4b14
0C
ultiv
atio
n an
dw
inte
r gr
azin
gI C
ontr
olle
d w
inte
r gr
azin
gE
rode
d ar
ea; n
eeds
car
eful
1
man
agem
ent
2.4.
2; 5
.11 I, 1
5a11
90Y
earr
ound
com
mun
al g
razi
ngC
ontr
olle
d ye
arro
und
Sui
tabl
e fo
r cu
ltiva
tion
(with
soi
lgr
azin
gco
nser
vatio
n)4.
4.2;
5.1
; 5.3
.2; 7
,2
5b80
0
1
330
VV
inte
r gr
azin
g an
dm
inor
cul
tivat
ion
Cul
tivat
ion
and
'nr
eraz
in
Con
trol
led
win
ter
graz
ing
1Sui
tabl
e fo
r cu
ltiva
tion
(with
soi
lic
onse
rvat
ion)
! Im
prov
ed d
ryla
nd fa
rmin
g!
! and
win
ter
azin
5.1;
7.2
5.1;
7.1
.2; 7
.1,3
!5c 6e
100
1
! Yea
rrou
nd
!Icom
mun
al g
razi
ng! W
inte
r gr
azin
g
I Con
trol
led
year
roun
dj 5
.1; 5
.3.2
;7.
21
,gr
ang
! As
pres
ent
I Sui
tabl
e fo
r cu
ltiva
tion,
exc
ept f
or5.
1
I im
perf
ectly
dra
ined
site
s6b
1140
r,i
I!7a
770
I Yea
r ro
und
I com
mun
al g
razi
ng! C
ontr
olle
d ye
arro
und
1Sui
tabl
e fo
r cu
ltiva
tion
5,1;
5.3
,2;
7.2
: gra
zing
¡
'7b
6120
: Cul
tivat
ion
and
1 w
inte
r .r
azin
.! I
mpr
oved
dry
land
farm
ing
r' T
he m
ost s
uita
ble
arab
le la
nd in
the
5.1;
5.5
; 5.2
.3.2
;! a
nd w
inte
'raz
in.
!AE
A; l
ack
of w
ater
on
the
land
sI7.
1,2;
7.
8/9a
250
; Wnt
er g
razi
ng,
!1 ;
! As
pres
ent
! Site
s w
ith d
eep
soil
are
suita
ble
'5,
1; 5
.5; 5
.2.3
.2;
! for
cul
tivat
ion
! i17.1
.2; 7
.1.3
8/9b
1 1730
0iC
ultiv
atio
n an
d! 1
win
ter
graz
ing
I Im
prov
ed d
ryla
nd fa
rmin
g; P
atch
es o
f sha
llow
soi
l occ
ur w
hich
I 5.1
; 5.5
; 5.2
.3.2
;I a
nd w
inte
r gr
azin
g1
an.i
not s
uita
ble
for
culti
vatio
nI 7
.1.2
; 7.1
.3
at least 75 % of years (see Section 5.2.3.1). If farms would then be planted to sorghum only, subsistencestaple requirements would be met on farms of 5 ha and more. Although in exceptional years good maizeyields can be achieved, dependable maize yields are very low (around 50 kg/ha). It is thereforerecommended to keep sorghum as the main cereal crop.
Potentially, assuming the adoption of improved farm practices, a groundnut yield (unshelled) of 430 kg/ha(unfertilized) to 580 kg/ha (fertilized) can be realised in at least 75 % of years (see Section 5.2.3.1). Toreach this yield level, farmers would be required to plough and plant their entire groundnut field at thefirst planting opportunity after November lst.
Adoption of improved farm practices is essential in order to raise dependable yields to the levels statedabove for sorghum and groundnuts. These recommended practices include:
Rowplanting and row weeding; this requires investment in farm implements and trainingof farmers
Making use of early planting opportunities occurring after November 1st
Careful planting, thinning and in-filling to achieve an uniform plant density of 35,000 to55,000 plants per hectare
Timely weeding (about 30 days after seeding)
Use of fertilizer at a rate of at least 50 kg/ha (2:3:2 compound or superphosphate)
More effective spraying against pests and diseases; this requires investment in equipmentand training of farmers
The scope for groundnut production in the area is considerable. It is therefore recotrunended that farmersare urged to grow groundnuts and increase their market orientation. Both improved extension andimproved market infrastructure will be instrumental in achieving this, and are further detailed inSection 7.7. Other legumes, such as cowpea, jugo bean and tepary bean are also recommended.
It is assumed that even those farmers interested in cash crop production want to retain part of their farmsfor subsistence food crops. A subdivision of fartns is proposed, in which the production of food crops islimited to an area of about 2 ha and the remainder of the farm is planted to cash crops. Production ofpartly unsaleable traditional crops would then be replaced by high value saleable produce.
For large farms, whose owners have their own means of traction, the production of sorghum andgroundnuts under improved fanning methods would provide modest financial returns. Table 29 shows apotential gross margin for crop production of Pula 1,569 for farms of 8 ha. For small farms, which arewithout means of traction, the value of increased production does not outweigh the increased costs:Table 29 shows a gross margin of minus Pula 474 for farms of 3 ha. Improved farming methods whichneed additional draught power can therefore only be recommended for small farms if well targetedsubsidies are provided.
Drought relief, used in its present form, benefits all farmers. However, large farmers are likely to benefitmore than small farmers, mainly because owners of larger fartns usually have their own means of tractionand will cash the money themselves rather than hand it over to a contractor. It is recommended that asubsidy is introduced which is directed to the needs of small farmers interested in intensification offanning and cash crop production. This subsidy should cover the rental of traction for field operations asin present drought relief, but conditions of good farm management should be attached to it. Presently,
76
under ALDEP, farmers can get loans for the purchase of donkeys or oxen for ploughing. This form ofassistance is somewhat problematic in Rath°lo AEA, because of limited availability of grazing and fodder.
7.1.3 Soil degradation and conservation in farmers' fields
Topsoils in farmers fields are often degraded. Organic matter and nutrients are reduced as a result ofpresent farming methods and surface crusts are widespread. Maintenance of soil fertility is not practiced,except for some manure deposited by animals grazing crop residues in winter.
It is strongly recommended that farmers practice soil and water conservation in their fields to protect theresource base of fanning. Fertility maintenance can be realised by the applic,ation of kraal manure,ploughing-in of crop residues and/or green manure, crop rotation, and the application of chemical fertilizer.Mixed cropping in the form of alternate rows of sorghum and legumes will also enhance soil fertility. Theinstallation of tied bunds may be considered in the future to conserve water and curb overland flow onland with a slope of more than 1%. Both soil fertility improvement a.nd soil conservation can be achievedthrough the planting of permanent contour strips with leguminous trees.
7.2 ANIMAL PRODUCTION
7.2.1 General
Ratholo AEA presently supports an estimated 2,000 cattle, 4,300 goats and 1,300 donkeys. Although thepresent cull and milk production are modest, livestock is an important source of income for about 30 %of households. Livestock is an essential pan of most large farms, but is insignificant on small farms.
The herbage requirements of cattle, donkeys and goats can be met by natural range production in yearswith good rainfall. However, in years with poor rainfall grazers are forced to turn to browse quite earlyin the dry season because of lack of grass. In spite of insufficient natural grazing, adoption of improvedherd management would bring about an important increase in cattle production. Improved managementincludes improved veterinary care and the provision of supplementary fee,d to all cattle, as detailed in thenext Paragraphs. Total culls could increase with 100 %, and milk production with 60 %. Even with theimprovements, the herd take-off rates would be a modest 11 % as compared to 7 % withoutimprovements.
It is recomnriended, that the DAHP makes a serious effort to vaccinate more cattle during their vaccinationcampaigns than at present. It is also recommended that more farmers introduce vaccination againstEnterotoxemia, Ltunpy Skin, and Calf paratyphoid for immature stock, and provide supplementary feedin the form of maintenance licks and bonemeal to all cattle. The SI should conduct training courses forfarmers to this effect.
It will be essential to control stocking rates. The total number of grazing animals should not be allowedto grow, and individual herd sizes should be controlled. This may be difficult to realise without a meansof enforcement endorsed by Government.
Shortage of drinking water for livestock occurs during the dry season. There is limited scope for theconstruction of small heifer dams in streams in the footslope zones west of Ratholo and near Moeng.Development of this potential mu.st be considered, but the tight schedule of the Regional Dam Unit islikely to prevent swift execution. Protection of the spring above Ratholo village and the dam above MoengCollege will improve water quality and animal health.
77
7.2.2 Grazine patterns and range conservation
Al present livestock roams freely in the communal grazing areas, and is allowed into the lands area afterthe crop harvest. Degradation of both soils and vegetation are widespread in grazing areas due tooverstocking and overgrazing. Serious sheet and rill erosion is found in LUs 4 and 5; some gullies alsooccur in these units. Crusting of topsoils is widespread. As a result of overgrazing and deterioration oftopsoils, the herbaceous layer is dominated by undesirable species in many areas.
It is recommended that the grazing of livestock is controlled. At present, the communal grazing areas arecontinuously grazed and certain desirable grass and forb species have no chance to recover and propagate.Control of grazing can be achieved by herding or by fencing. Livestock numbers, grazing patterns andcontrol measures should be worked out in co-operation with the cornmunity of Ratholo AEA andsurrounding communities. The introduction of rotational gazing may not be enough to restore theproductivity of seriously degraded land. Land unit 4a, for example, will need prolonged protection fromlivestock, a mechanical break-up of the compacted topsoil and the introduction of desirable grasses andshrubs by seeding and planting. Sheet and rill erosion should also be brought under control before limitedgrazing is allowed.
Seasonal or perrnanent stall feeding of animals of high value is another option to be considered. Protectedgrazing areas, if well managed, could become a source of fodder, to be cut and carried to penned-inanimals. Fodder crops could also be introduced for this purpose. Although labour intensive, stall feedingof animals for beef production or draught power may prove productive and will have the additionaladvantages of easy veterinary care, manure production and possibly milk production.
Winter grazing in the lands area should be continued in order to make full use of the herbage available.
7.3 PHANE PRODUCTION
Mopane worm is collected in the plain and footslope areas, where Colophospermum mopane is often adominant shrub or tree. Mopane worm constitutes an important source of income for the majority ofhouseholds, and is often the main source of cash for small farmers. Production is limited by labouravailability during short periods of the rainy season when the worm can be collecte,d. There is no scopefor increase of production.
7.4 IRRIGATED AGRICULTURE
Scope for irrigated farming is very litnited due to the absence of surface water. Irrigation from boreholesis possible, but will only be productive if the land and irrigation water is very intensively used. Forexample, in a citrus orchard the area between the trees should be planted with vegetables and/or foddercrops. The area immediately surrounding the fruit trees should be mulched. Multipurpose trees and shrubsshould be planted along the perimeter of the irrigated plot and the land should be protected from erosion.Beekeeping should be considered in conjunction with fruit production. Stall feeding of a few selectedanimals should also be considered. Irrigated agriculture is only recommended for determined farmers whohave access to a starting capital, managerial skills and sufficient labour.
78
7.5 FORESTRY
It is desirable to establish woodlots in the vicinity of the villages for the production of firewood and poles,in order to prevent further depletion of natural woody vegetation which is taking place around villages.Such woodlots could be established in eroded areas near villages and near a source of water. Unit 3b(Map 7), north and east of Ratholo is such an area. The villages of Ratholo and Majwaneng are dissectedby gullies and tree planting should be considered in the catchment area of the gullies as well as along thegullies themselves. Tree planting could also be considered in combination with range rehabilitation andsoil conservation in unit 4a, a few km west of Ratholo village (Map 7). Eucalyptus camaldulensis or otherspecies could be considered for planting. Although the climate is too dry for easy establishment of youngtrees, additional subsoil moisture in this relatively low lying area makes it a better site than most. Acommittee at village level should then be installed to establish and maintain the woodlot.
Some residents have already planted trees in their compounds, usually as the result of free seedlingdistribution. This practice should be encouraged. Farmers should be educated as to the specific uses ofvarious trees, including indigenous species. The placing of mulch (cut grasses, weeds, crop residues)around young trees will help to preserve soil moisture.
7.6 SMALL SCALE AGRO-INDUSTRIES
Specialised production of small stock, such as pigs or poultry, is not feasible as markets are either distantor saturated. Substantial production of groundnut in the area as envisaged by the land use plan could resultin the installation of a local groundnut shelling industry providing employment during the dry season. Incase groundnut production has become a success in the area, the fabrication of peanut butter could beconsidered. Phane could also be processed and sold in small quantities out of season.
7.7 INSTITUTIONAL SUPPORT
The proposed land use changes can only find a wide adoption among farmers, if farmers are motivatedto accept them. Motivation for change does not come automatically due to ingrained attitudes andmechanisms (see Section 4.5). Change will only come if farmers perceive there is a problem and areconvinced that the proposed changes in land use and management will help to solve that problem. Forexample, if residents of Ratholo do not think there is a shortage of wood, there is no point in starting awoodlot. Land use changes which are known to be productive and appropriate, can be introduced throughfield demonstrations, training for farmers, well-targeted subsidies and credits, and the creation of marketincentives. Other suggested improvements in land use, which have not yet been properly researched, haveto be tested through on-farm field trials.
7.7.1 Extension
Advice given to farmers must be improved both in content and effort. The AD and SI must be providedwith clear instructions and manuals to assist them in getting messages across to farmers. It is
recommended that special training courses be organised to update the knowledge of ADs and Sls. The ADand SI must be made full time available to conduct extension work, for which it will be required toliberate the AD of drought relief administration and the SI of participation in vaccination catnpaignselsewhere. Additional extension staff may be required in the future.
79
The activities on which the AD and SI should concentrate are listed below. Some of these activities arealready carried out, others are not. In these activities the AD and SI will be supported by District andRegional extension staff and specialists.
The AD will have to conduct, more intensively than at present, on-farm demonstrations of farmoperations including rowplanting, row weeding, application of fertilizer and spraying against pestsand diseases.
The AD will have to conduct a demonstration programme on the fertility maintenance of farmers'fielcLs, including the use of kraal manure, ploughing in of crop residues, crop rotation and the useof various tree species. A demonstration programme concerning the construction of tied bunds onsloping land with permeable soil may be considered in the future.
Through the Farmers Committee, and other appropriate institutions, the AD and SI together willhave to start a dialogue with the farmers and discuss problems related to land use and possiblesolutions.
The AD will have to vitalise the Farmers Committee to help organise farmers and to helpsupervise sale and distribution of implements, fencing materials, etc.
The AD will have to run training courses for farmers in fence construction.
The AD will have to form a woodlot Committee, responsible for establishment and maintenanceof woodlots, and gully control in and around villages.
The SI will have to conduct training courses for livestock owners in the vaccination of cattle,donkeys and small stock.
The SI will have to conduct a demonstration programme on the advantages of supplementary feedfor livestock.
The SI will have to advise farmers on the recommended size of herds. The SI will have tosupervise stocking rates, and form a Committee of livestock owners, able to assist him in the task.
Generally, advice given should be specific for the various groups of farmers in the AEA (see alsoChapter 3.3). The gender and age of the majority of farmers should also be taken into account.
7.7.2 Financial assistance and infrastructure
Government will have to provide the back-up system which will enable the anticipated agriculturaldevelopment. It has two components: subsidies and credit facilities on the input side and infrastructure andmarketing channels on the output side.
7.7.2.1 Subsidies and credit facilities
Input subsidies covering farm implements and veterinary implements are required. A special rate shouldbe employed for implements purchased by small farmers who have organised themselves in poolinggroups. Other inputs including seed, fertilizer, pesticides and vaccines should also be offered to the farmeral a subsidised rate. BAMB, BCLJ and LAC should make an effort to make these inputs readily availableto farmers in the area. The availability of good quality seed for promising crops (groundnut, cowpea and
80
other leg,umes), in addition to sorghum, should have special attention.
A ploughing subsidy should be available but it is only indispensable for small farmers. Performance shouldbe verified under guidance of the AD.
7.7.2.2 Marketing infrastructure
For cash crops, the BAMB will have to install a local depot, which can both serve as a selling point forfarm inputs and as an intake point of farm produce. Transport to and from farmers' fields will have to beprovided against a cost.
For livestock, the BMC will have to create a local livestock buying point, where livestock owners can selltheir surplus animals. The facility should be large enough to absorb a large number of animals at once intimes that farmers are compelled to sell (as a result of drought, feed shortage or disease).
For phane, the installation of a marketing channel should be considered, preferably organised by theBAMB, to let farmers take better advantage from high market prices in S-Africa.
7.7.2.3 Fencing
If farmers in Ratholo AEA jointly decide on controlled grazing and/or projects such as range rehabilitation,gully control, protection of waterpoints and woodlots, perimeter fencing will be required in many cases.Financial assistance may be required to purchase the necessary materials.
81
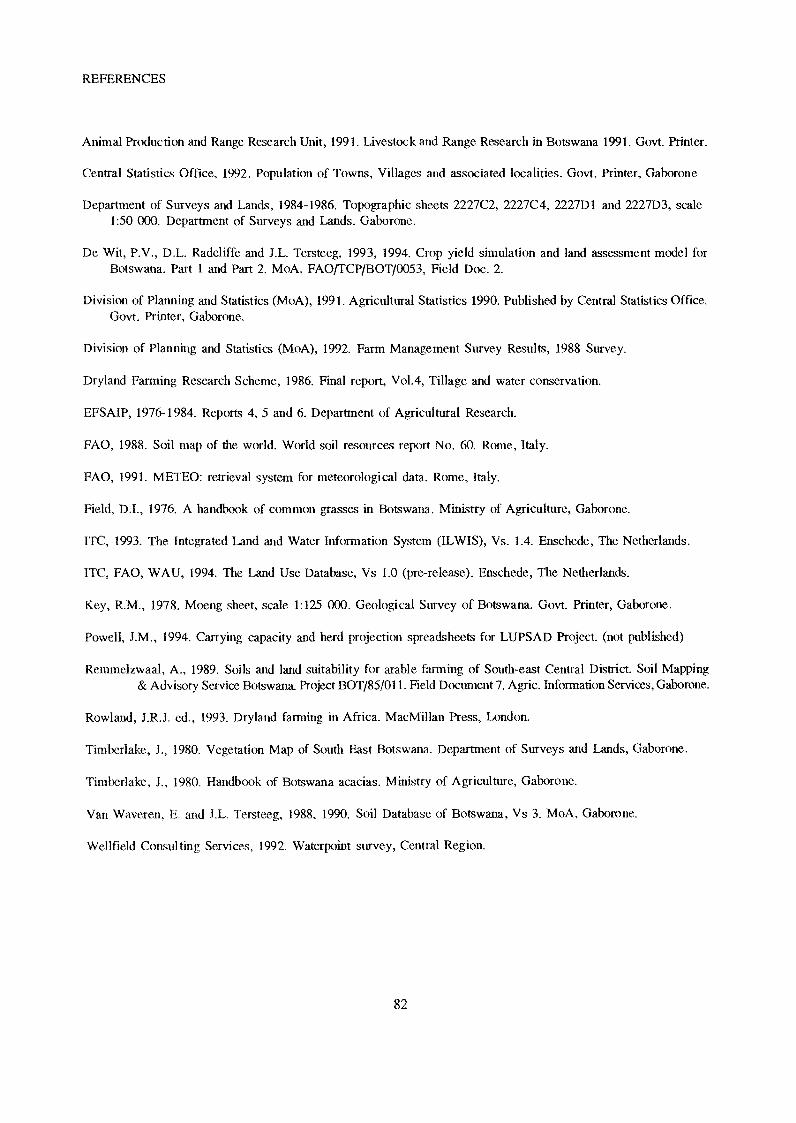
REFERENCES
Animal Production and Range Research Unit, 1991. Livestock and Range Research in Botswana 1991. Govt. Printer.
Central Statistics Office, 1992. Population of Towns, Villages and associated localities. Govt. Printer, Gaborone
Department of Surveys and Lands, 1984-1986. Topographic sheets 2227C2, 2227C4, 2227D1 and 2227D3, scale1:50 000, Department of Surveys and Lands. Gaborone.
De Wit, P.V., D.L. Radcliffe and J.L. Tersteeg, 1993, 1994. Crop yield simulation and land assessment model forBotswana. Part 1 and Part 2. MoA, FAO/TCP/BOT/0053, Field Doc. 2.
Division of Planning and Statistics (MoA), 1991. Agricultural Statistics 1990. Published by Central Statistics Office.Govt. Printer, Gaborone,
Division of Planning and Statistics (MoA), 1992. Farm Management Survey Results, 1988 Survey.
Dryland Farming Research Scheme, 1986. Final report, Vol.4, Tillage and water conservation.
EFSAIP, 1976-1984. Reports 4, 5 and 6. Department of Agricultural Research.
FAO, 1988, Soil map of the world. World soil resources report No. 60. Rome, Italy.
FAO, 1991. METEO: retrieval systcm for meteorological data. Rome, Italy.
Field, D.I., 1976. A handbook of common grasses in Botswana Ministry of Agriculture, Gaborone.
ITC, 1993. The Integrated Land iutd Water Information System (ILWIS), Vs. 1.4. Enschede, The Netherlands.
ITC, FAO, WAU, 1994, Thc Land Use Database, Vs 1.0 (pre-release). Enschede, The Netherlands.
Key, R.M., 1978. Moeng sheet, scale 1:125 000. Geological Survey of Botswana. Govt. Printer, Gaborone.
Powell, J.M., 1994. Carrying capacity and herd projection spreadsheets for LUPSAD Project. (not published)
Reminelzwaal, A., 1989. Soils and land suitability for arable fanning of South-east Central District. Soil Mapping& Advisory Service Botswana. Project BOT/85/011. Field Document 7. Agrie. Information Services, Gaborone.
Rowland, J.R.J. ed., 1993. Dryland farming in Africa. MacMillan Pre,ss, London.
Timberlake, J., 1980. Vegetation Map of South East Botswana. Department of Surveys and Lands, Gaborone.
Tinilierlake, J., 1980. Handbook of Botswana acacias. Ministry of Agriculture, Gaborone.
Van Waveren, E. and J.L. Tersteeg, 1988, 1990. Soil Database of Botswana, Vs 3. MoA, Gaborone.
Wellfield Consulting Services, 1992. Waterpoint survey, Central Region.
82

ANNEX
TABLES SUPPORTING FINANCIAL ANALYSIS
83
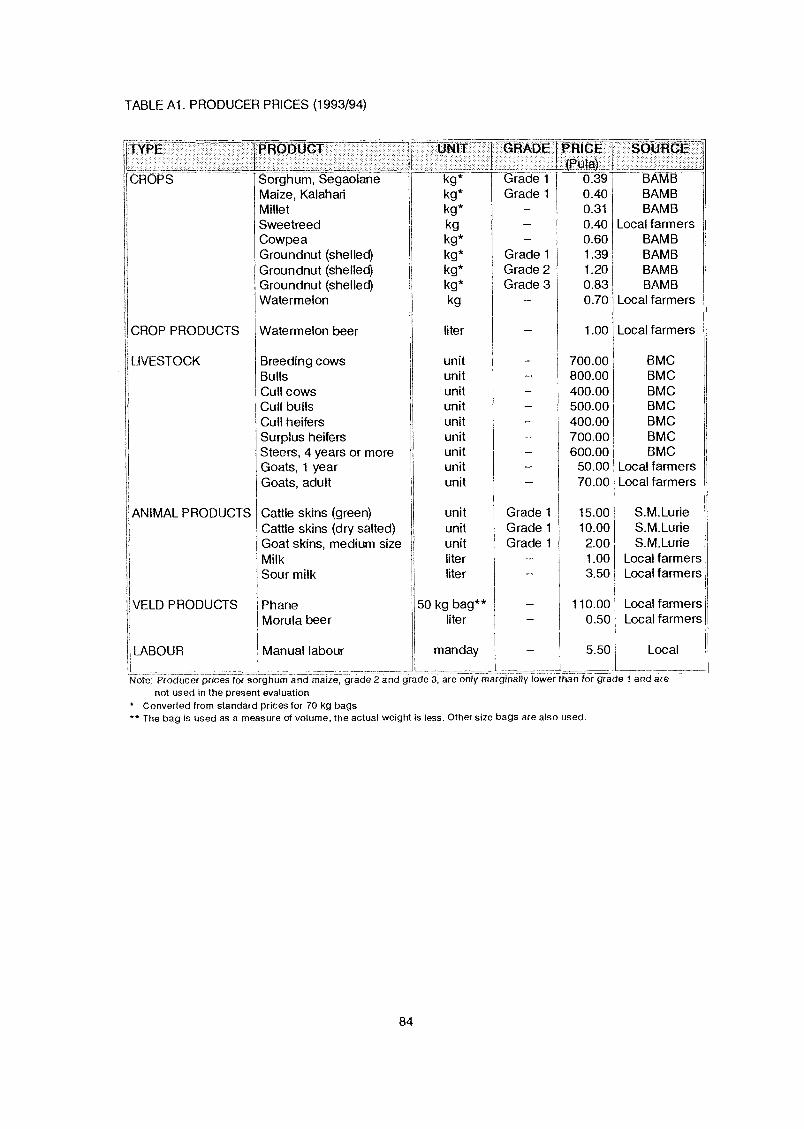
TABLE Al PRODUCER PRICES (1993/94)
TYPE IPRODU
CROPS ----
CROP PRODUCTS Waterm
LIVESTOCK
SorghuMaize,MilletSweetreCowpeGroundGroundGroundWaterm
BreedinBullsCull costCull bulCull heiSurplusSteers,Goats, 1Goats,
ANIMAL PRODUCTS Cattle sCattle sGoat skMilkSour mi
VELD PRODUCTS PhaneMorula
LABOUR Manual
_
Note: Producer-Prices for sorghum and maize, grade 2 and grade d, are only marginaVy lower-tVan for gradenot used In the present evaluation
Converted from standard prices for 70 kg bags* The bag is used as a measure of volume, the actual weight is less. Other size bags are also used.
84
and are
CT ir UNIT GRADE PIAICEPula)._
SOURCE
-1, Segaolane kg* Grade 1 0.39 ' BA-MB
.alahari kg* Grade 1 0.40 BAMBkg* 0.31 BAMB
ed kg 0.40 Local farmerskg* 0.60 BAMB
ILA (shelled) kg* Grade 1 1.39 BAMBlut (shelled) kg* Grade 2 1.20 BAMBnit (shelled) kg* Grade 3 0.83 BAMB.Ion kg 0.70 Local farmers
.lon beer liter 1.00 Local farmers
g COWS unit 700.00 BMCunit 800.00 BMC
/S unit 400.00 BMCs unit 500.00 BMCers unit 400.00 BMCheifers unit 700.00 BMC1 years or more unit 600.00 BMCyear unit 50.00 Local farmers
dult unit 70.00 Local farmers
¡ins (green) unit Grade 1 15.00 S.M.LurieKins (dry salted) unit Grade 1 10.00 S.M.Lurieins, medium size unit Grade 1 2.00 S.M.Lurie
liter 1.00 Local farmerslk liter 3.50 Local farmers
50 kg bag** 110.00 Local farmersbeer liter 0.50 Local farmers
labour 1 manday 5.50 LocalL

TABLE A2. VALUE OF ANNUAL AGRICULTURAL PRODUCE AND LABOUR OF PATTERN FARMSDEPENDABLE YIELDS, LAND UNIT 7
POTENTIAL
CROPS
LIVEc'TOCK
VELD PRODUCTS
'FARM LABOUR' "
TOTALCrops I-Subtotal
SorghumGroundnuts**Sweetreed*CowpeaWatermelon*
Product-, SubtotalWatermelon beer*
TOTALAnimals Subtotal
Cull cowsCull bullsCull heifersSurplus heifersCull steers****Cull goats
Products Sub--totalSour milkCattle skinsGoat skinsTOTALPhaneMorula beerDaily labour
1r Farm 1(Pula)_
46!J4391
37318
307
4727277270
o
070
410385
23325
85
ALL PRODUCE TOTAL 1,275* The market for sweetreed, watermelon and watermelon beer Is limited; not saleable produce is not valued** Grade 2 and a shelling coefficient of 0.67 are assumed
*** Labour available after deduction of labour spent on own farm
**** Four years old, or more
48 7
197
00
100
PRESENT Farm 1(Pula) --1- (%)
Farm 2(Pula %)
1 Farm(Pula) I
CROPS - TOTAL-
247 1 21 2 449 _30,4 657_ops Subtotal 220 422 630
Sorghum 53 195 311Millet 19 31 50Sweetreed* 30 30 30Cowpea 72 120 192
I-Products
Watermelon*Subtotal
4727
4727
4727
jWatermelon beer* 27 27 27LIVESTOCK TOTAL 72 6,2, 441
36929-9 1,013
793Animals Subtotal 70Cull cows o 24 64Cull bulls o 10 30Surplus heifers o 28 98Cull steers**** o 132 426Cull goats 70 175 175
Products Sub--total 2 72 220Sour milk o 59 190Cattle skins o 8 2Goat skins 2
VELO PRODUCTS TOTAL 410 35 3 410 278 416Phane 385 385 385Morula beer 25 25 2
FARM LABOUR*** Daily labour 435 374 176 11.9 0
,_ALL PRODUCE TOTAL 1 1.j63 100 1,476 2,079t 100
rl Farm Farm 32-_(Pula) I (0A,)
540(Pula)
,2,701
_
_(%)55 01370[ j427
1,400 2,674; 149 149
1,167 2,44130 30
7 7
47 4727 2727 27! I5.666 5,01_ ,1,E3p.p 36 8
1,48052 16010 304 8
105 399216 708175 175104 328
92 3046 195 5
32 01 - 4-10 1551 -410 831_
385 38525
255 132 5.0 001
100 2,635 100 4,919 1001'
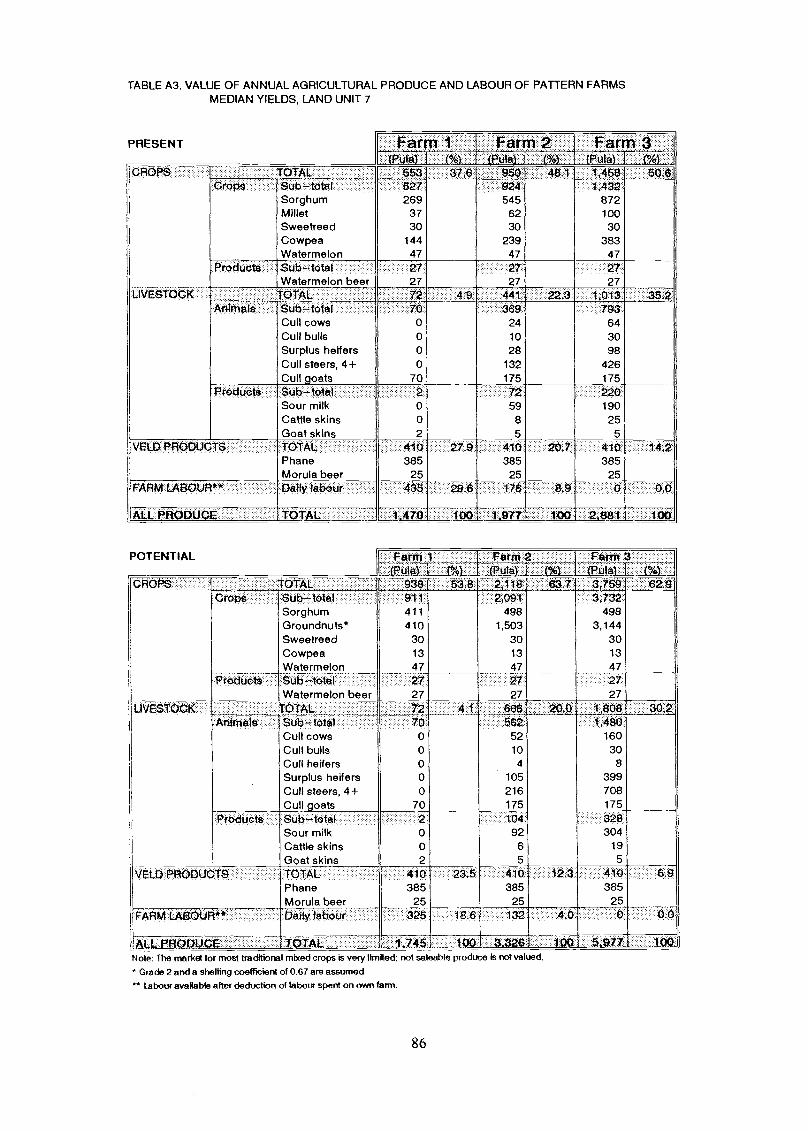
TABLE A3. VALUE OF ANNUAL AGRICULTURAL PRODUCE AND LABOUR OF PATTERN FARMSMEDIAN YIELDS, LAND UNIT 7
Note: The market for most traditional mbred crops is very limited; not saleable produce is not valued.
Grade 2 and a shelling coefficient of 0.67 are assumed
Labour avaKabie after deduction of tabour spent on own farm.
86
PRESENT Farm I farm 2 Farm 3P : % IN%) (%) (Pula) 4
CROPS TOTAL 55$ 376 950 481 1,458- 504Crcips Subtotal 527 924 1,452
Sorghum 269 545 872Millet 37 62 100Sweetreed 30 30 30Cowpea 144 239 383Watermelon 47 47 47
Products Subtotal 27 27 27Watermelon beer 27 27 27
LIVESTOCK TOTAL 72 49 441 22.3 1,013 352Animal-a Subtotal 70 369 793
Cull cows o 24 64Cull bulls o 10 30Surplus heifers 0 28 98Cull steers, 4+ o 132 426Cullgoats 70 175 175
Prcducta Subtotal 2 72 220Sour milk o 59 190Cattle skins o 8 25Goat skins 2 5 5
VELD PRODUCTS TOTAL 410 27.9 410 201 410 14,2Phane 385 385 385Morula beer 25 25 25
FARM LABOUR** Daffy labour 435 29.6 176 8.9 0 my
1ALL PRODUCE TOTAL 1,470 100 1.977 100 2j ...... .1100
POTENTIAL Farm 1 . ..Farm 2 FEITM
Pula) 11f3), (Pula) I (141 {Pula011OPt TO-TAL 938 53,8 2,118 63 3,759 62.9
Cropka Sub--total 911 2,091 3,732Sorghum 411 498 498Groundnuts* 410 1,503 3,144Sweetreed 30 30 30Cowpea 13 13 13
Watermelon 47 47 47Products Subtotal 27 27 27
Watermelon beer 27 27 27LIVESTOCK TOTAL 72 4. 666- 20.0 1808 30.2
, Animata Subtotal 70 562 1,480Cull cows o 52 160Cull bulls 0 10 30Cull heffers o 4 8Surplus heifers 0 105 399Cull steers, 4+ o 216 708Cull_goats 70 175 175
Products Subtotal 2 104 328Sour milk o 92 304Cattle skins o 6 19Goat skins 2 5 5
VELD PRODUCTS TOTAL 410 23.5 410 12.3 1 410 6.9Phane 385 385 385Morula beer 25 25 25
FARIv1 LA-SOUR** Daily labour 325 18.6 132 4.0 0 0.6
ALL PRODUCtE _ _10_1A1.,_ 1.745 MO 3.326 100 5.977
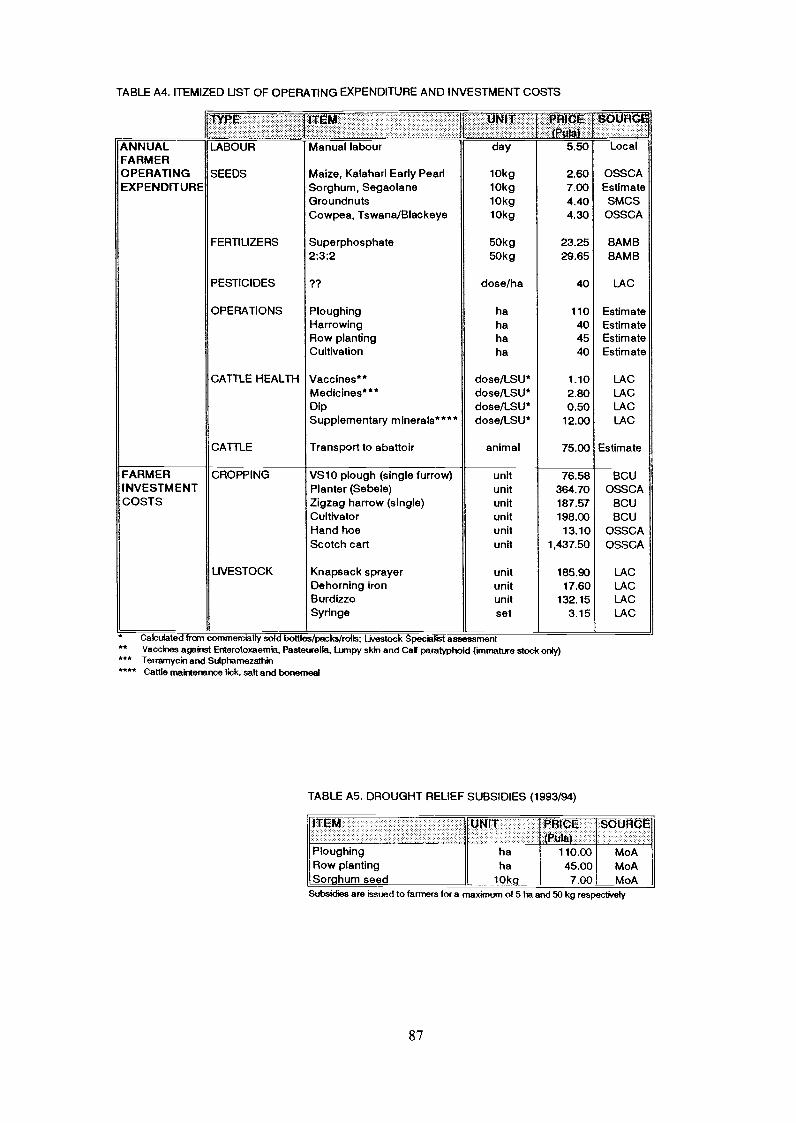
TABLE A4. ITEMIZED UST OF OPERATING EXPENDITURE AND INVESTMENT COSTS
ted from commercially sol r:.../rr oc Ist assessment** Vaccines against Enterotoxaemia, Pasteurella, Lumpy skin artd Calf paratyphoid (immature stock only)*** Terramycin and Sulphamezathin**** Cattle maintenance lick, salt and bonemeal
TABLE A5. DROUGHT RELIEF SUBSIDIES (1993/94)
Subsidies are issued to farmers for a maximum of 5 ha and 50 kg respectively
87
TYPE ITLrn. I
PiPtila)
ANNUAL LABOUR Manual labour day 5.50 LocalFARMEROPERATING SEEDS Maize, Kalahari Early Pearl 10kg 2.60 OSSCAEXPENDITURE Sorghum, Segaolane 10kg 7.00 Estimate
Groundnuts 10kg 4.40 SMCSCowpea, Tswana/Blackeye 10kg 4.30 OSSCA
FERTILIZERS Superphosphate 50kg 23.25 BAMB2:3:2 50kg 29.65 BAMB
PESTICIDES ?? dose/ha 40 LAC
OPERATIONS Ploughing ha 110 EstimateHarrowing ha 40 EstimateRow planting ha 45 EstimateCultivation ha 40 Estimate
CATTLE HEALTH Vaccines** dose/LSU* 1.10 LACMedicines*** dose/LSU* 2.80 LACDip dose/LSU* 0.50 LACSupplementary minerals**** dose/LSU* 12.00 LAC
CATTLE Transport to abattoir animal 75.00 Estimate
FARMER CROPPING VS10 plough (single furrow) unit 76.58 BCUINVESTMENT Planter (Sebele) unit 364.70 OSSCACOSTS Zigzag harrow (single) unit 187.57 BCU
Cultivator unit 198.00 BCUHand hoe unit 13.10 OSSCAScotch cart unit 1,437.50 OSSCA
LIVESTOCK Knapsack sprayer unit 185.90 LACDehoming iron unit 17.60 LACBurdizzo unit 132.15 LACSyringe set 3.15 LAC
ITEM UNIT PRICE SOURCE(NW
Ploughing ha 110.00 MoARow planting ha 45.00 MoASorghum seed 10kg 7.00 MoA
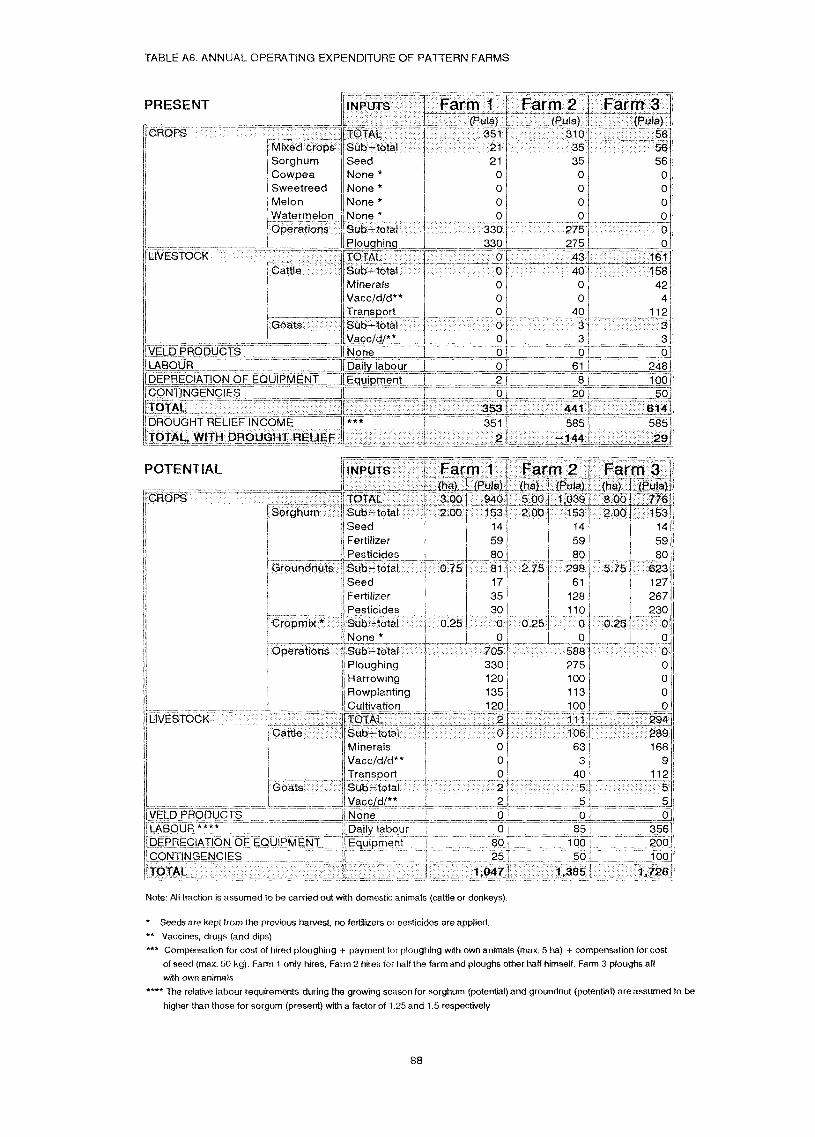
TABLE A6, ANNUAL OPERATING EXPENDITURE OF PATTERN FARMS
PRESENT
CROPS
- - - -INPUTS Farm I Farm 2
iL L___,(-Pula)_ : _1 (Pula)__
TOTAL 351 310
Watermelon None *Operations Sub-total
tEloughingIVESTOCK TOTAL ---
rOattlo Sub-totalMineralsVacc/d/d**Transport
Goats Sub-totalVacc/d/**
VELD PRODUCTS LNoneLABOUR labourDEPRECIATION OF EOUIPIVIENT HrEgu-iprrientCONTINGENCIESTOTALDROUGHT RELIEF INCOMETOTAL WITH pnoupvg
_ _ _
***
TOTAL
88
330
Farm(ha)1 1Pula)300J.. 9402.001 153
14
5980
0.75 81
0.25
3301_ 275- 43
40
0
_2
011
353 441351
2 -144
17
705330120135120
ooo
Note: All traction is assumed to be carried out with domestic animals (cattle or donkeys).
2.75
275
40
61
14
9
80298
51
128110
2
Farm
56ooo
o161
15424
1233
248
20 50
61458529
Farm 24 Farm 3Lha_)-11 (Pula" _Thal-__ThrPula)5.00 1,039 8,00 7762,00 153 200 153
5.75
145980
623127267230
0 0.25 001
588275100113 0100 0
1111 _ 294_ _ .
0o
_
80 i
25Lt047'
Mixed crops Sub-total 21 35Sorghum Seed 21 35Cowpea None * 0 0Sweetreed None * 0 0Melon None * 0 0
0
* Seeds are kept from the previous harvest, no fertilizers or pesticides are applied.
** Vaccines, drugs (and dips)
*** CompeAlsation for cost of hired ploughing + payment for ploughing with own animals (max. 5 ha) + compensation for costof seed (roas . 50 kg). Farm 1 only hires, Farm 2 hires for half the farm and ploughs other half himself, Farm 3 ploughs all
with own animals
**** The relative labour requirements during the growing season for sorghum (potential) and groundnut (potential) are assumed to be
higher than those for sorgum (present) with a factor of 1.25 and 1.5 respectively
106 28963 168
3 94o 112
5
85 356100 200501 1301
1 385 -1 i26
POTENTIAL INPUTS
CROPS - TOT-AL,I Sorghum Sub-total
SeedFertilizer
II PesticidesG'roundnuts liSub- total
SeedFertilizerPesticides
Cropmix* Sub --totalNone *
Operations Sub-- totalPloughingHarrowingRowplantingCultivation
LIVESTOCK -1 TOTALCattle Sub-total
MineralsVacc/d/d**Transport
Goats liSub --totalAVacc/d/**
VELD PRODUC1S 11None
LABOUR JIbaiiy labourDEPRECIATION OF EQUIPMENT J1EgutpmentCONTINGENCIES
- - - -a
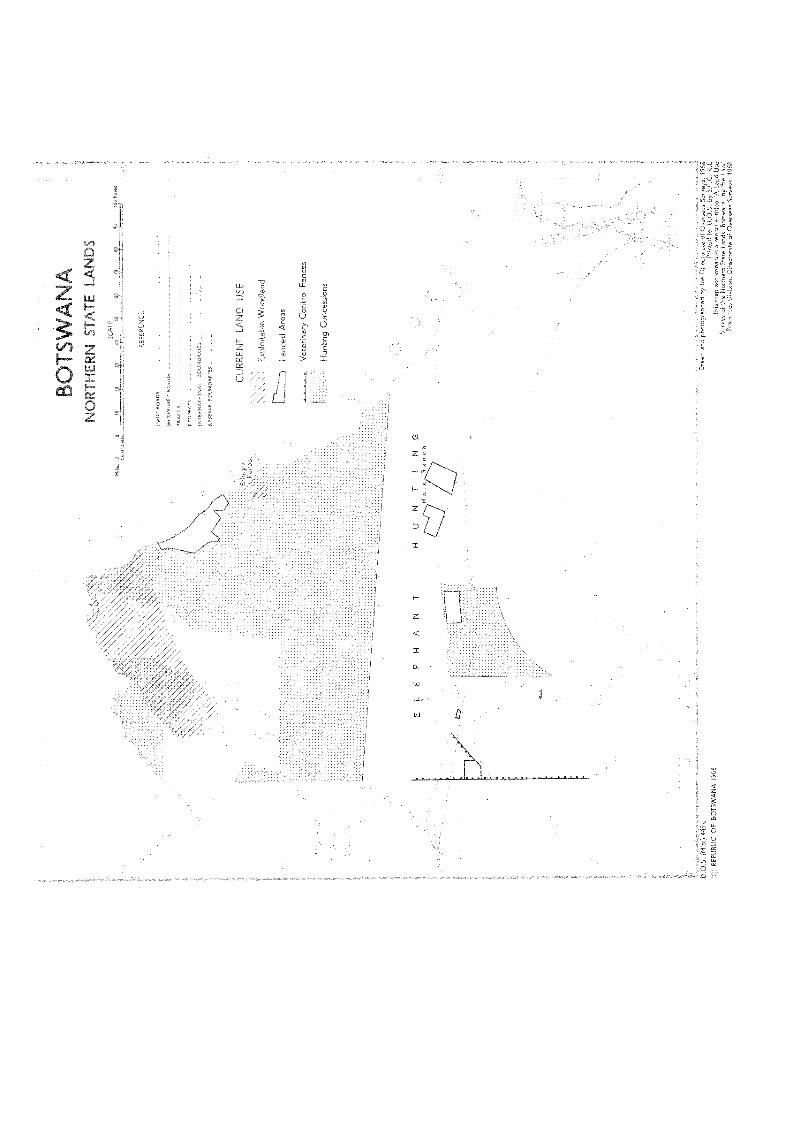
DS
t_P
tPU
BL'
_17
..F
EL
E P
H A
NT
HU
NT
IN
GN
atF
i
N(
Vet
erin
ary
Con
trol
Fen
ces
Hun
ting
Con
cen

BO
TSW
AN
AN
OR
TH
ER
N S
TA
TE
LA
ND
S
OF
1S
E 1
3F H
«-,L
,EN
\i,L1
MO
PS
:1-4
N::
;
Infe
sted
Are
as
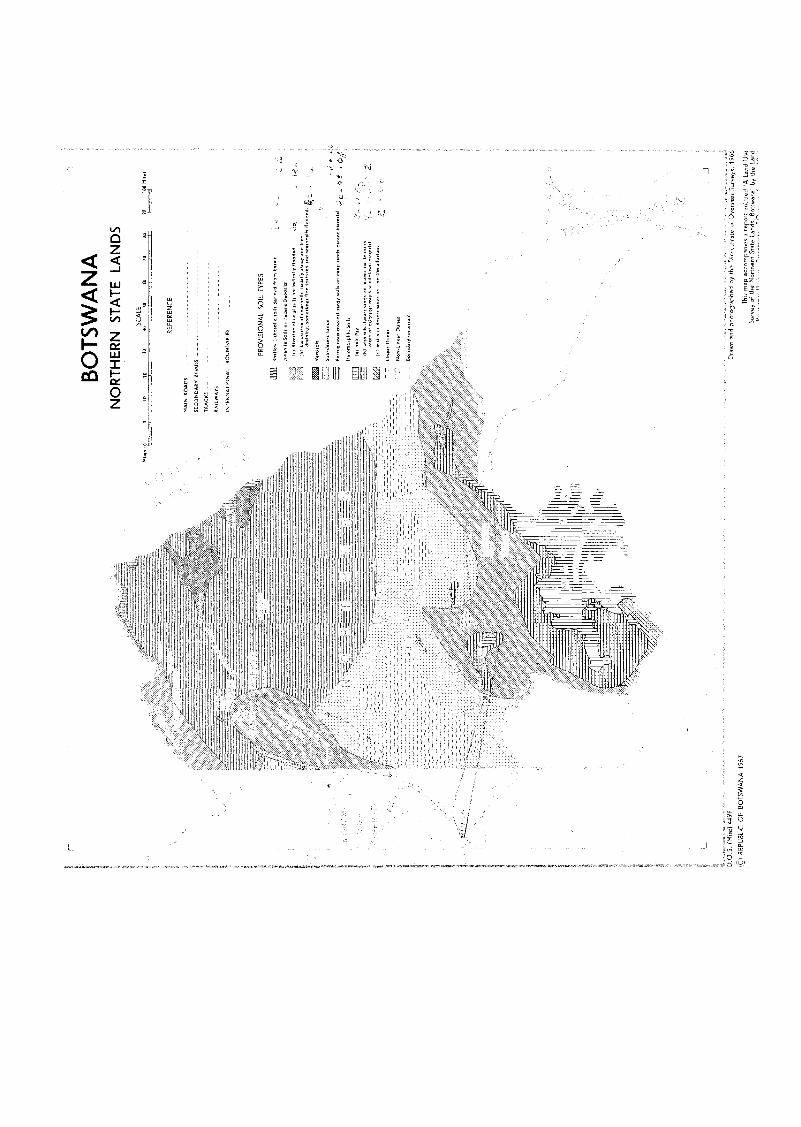
ZA
,11) I
BO
TS
WA
NA
NO
RT
HE
RN
ST
AT
E L
AN
DS
MA
IN R
OA
DS
SE
CO
ND
AR
Y R
OA
DS
TR
AC
ES
RA
ILW
AY
S_
__
_ _
__
INT
ER
NA
TIO
NA
L B
OU
ND
AR
IES
_
PR
OV
ISIO
NA
L S
OIL
TY
PE
S
II1IIL
ahal
law
Oth
er.,
toils
der
lved
from
bas
alt
RE
FE
RE
NC
E
_ r
LMea
r O
unat
s
mi7
Non
LIn
ear
Diu
nts
_B
ound
ary
unce
rtal
n
SC
ALE
3040
5060
708/
390
100
t113
.120
mit.
,10
010
EC
U
tow
n., S
oils
on
reca
nt D
rum
."i
friv
erIn
e at
koria
l tol
ls p
erlo
dyai
ty B
oodm
dol
t0M
01 L
arat
udr.
alh
mla
r se
llsus
ually
ren
d). a
nd B
eedr
aInI
ng, s
omet
imes
fine
text
ured
and
rea
rona
l/y fl
oode
d,,
31E
arrly
ram
San
dy
ferr
usM
our
['ord
eal s
andy
soI
lsrim
, slio
rIY
I.997
RU
RI
1101
00-1
0,10
10 S
Olis
fa 1
Sal
t Pen
151
arIc
h 50
5,5,
5 50
1105
0 la
cuat
rIna
der
mal
lof
ten
of c
alcr
ett-
muc
h w
Indh
low
n m
ater
nal
lc M
th r
ub-d
eser
t san
ds n
et r
Iver
ine
Dia
n an
d ph
otor
gra;
ioi b
y th
e 51
P5,
_,S
SR
L IO
vers
eas
Sur
veys
, 196
6
Thi
s m
ap a
ccom
pani
es a
rep
ort e
ntitl
ed 'A
Lan
d U
seS
urve
y of
the
Nor
ther
n S
tate
Lan
ds, B
otsw
ana'
by
the
Land
(Mis
c) 4
49f
CO
RE
PU
BLI
C O
F B
OT
SW
AN
A 1
967
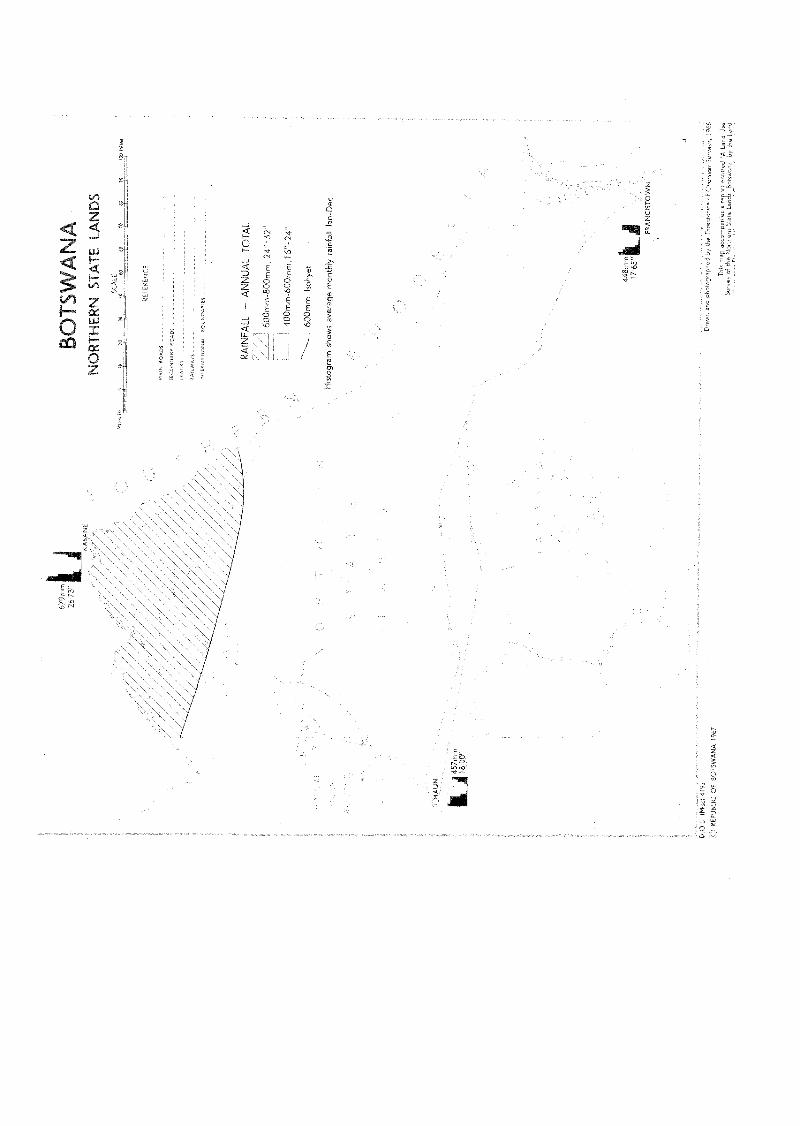
0"-:
BC
BO
TS'
WA
Nk,
NO
RT
HE
R1
RA
INF
ALL
AN
NU
AL
TO
TA
L
600m
m-8
00m
m, 2
4"-3
2"
400m
m-6
00m
16'-2
4"
----
----
-- 6
00m
m ls
ohye
t
His
togr
am s
how
s av
erag
e m
onth
ly r
ainf
all J
an-D
ec
FR
AN
CIS
TO
WN
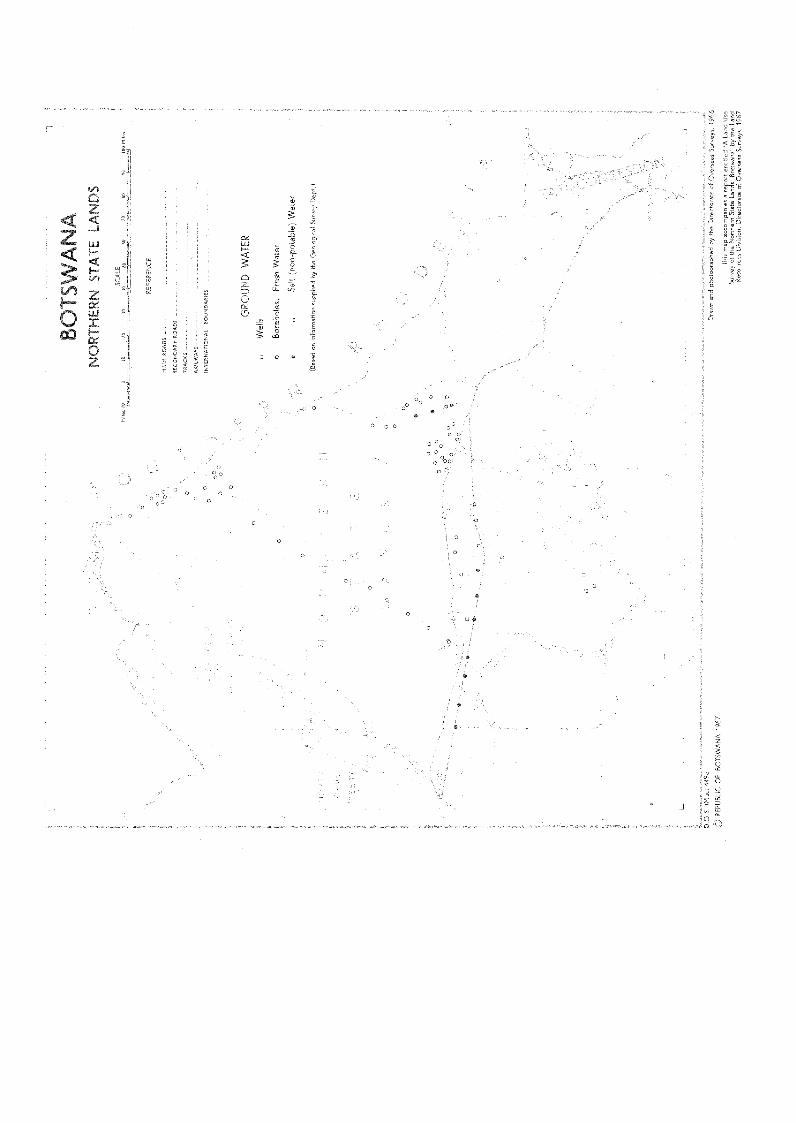
'619
F,
(10
RE
PU
BLI
C O
F E
o
BO
TS
WA
NA
NO
RT
HE
RN
ST
AT
E L
AN
DS
GR
OU
ND
WA
TE
R
Wel
ls
Ber
ehol
es,
Fr
6D
ept
Land
Use
y th
e La
ndR
eso,
of O
vers
eas
Sur
1Fey
s 19
67
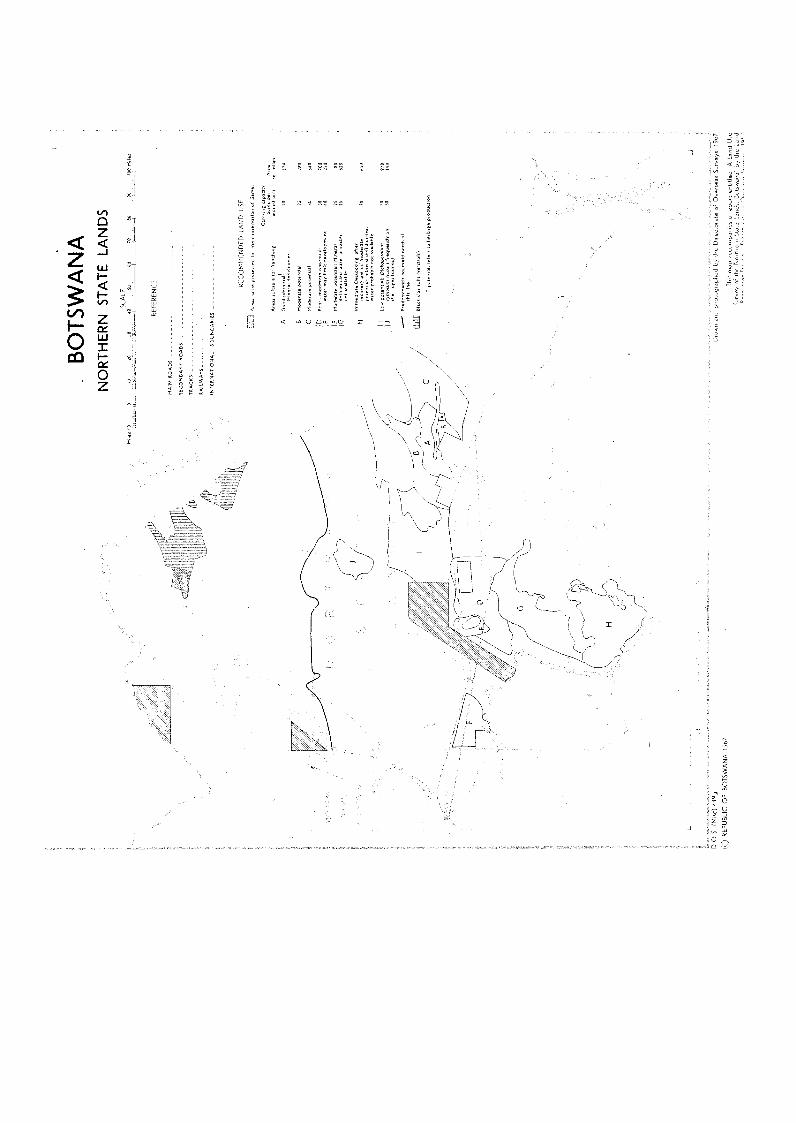
BO
TS
WA
NA
NO
RT
HE
RN
ST
AT
E L
AN
DS
SC
ALE
2030
40S
O00
7060
00Ir
Mila
s
RE
FE
RE
NC
E
MA
IN R
OA
DS
SE
CO
ND
AR
Y R
OA
DS
TR
AC
KS
RA
,WA
YS
INT
ER
NA
NO
NA
L B
OU
ND
AR
IES
RE
CO
MM
EN
DE
D L
AN
D U
SE
Car
tyin
g ca
paci
ty
Are
. sui
t.. fo
rlary
biog
anci
rrr!
:1°,
*ir"
it5:
7111
e,
A0o
44 p
oten
tial'
2020
4M
iner
ai d
efic
ienc
lea
BM
oder
ate
pote
ntia
l20
280
CM
oder
ate
pote
ntia
i30
690
IDP
oor
, mod
erat
e 44
4044
04k
3070
0,E
wat
er m
ay Il
tn9
tlave
lcat
tnen
t40
230
IFM
Ode
r.ite
pot
antla
l. M
iner
al5'
Gde
ll0le
ncie
r tw
at.-
pro
babi
y61
S'
not a
vaila
ble
H,=
,-,r
°7=
',f,.`
:7;..
3066
0po
tent
, rw
Iner
all d
etic
ten,
wa.
wat
, pro
babl
y no
t ava
ilabl
e
,iI
Low
pot
ent..
DI c
ha
peta
I um
004,
7,0,
t 3F
:T71
70,4
4(0,
1'-u
'r4,::
" 1"
'"'"
444
----
- ,,,
,o,T
s r,
,,.,,V
Y to
urve
ld n
orth
of
DIM
Bla
ck c
lay
toils
(ye
rtis
oitt
-, p
oten
t,. r
efer
s to
her
bage
pro
duct
ion
DO
S(1
,115
c) 4
-49g
tYra
wn
anu
phot
ogra
phed
by
the
Dee
LL,L
tei_
NR
.Ras
uur
veys
,96
7
RE
PU
BU
C O
R B
OT
SW
AN
A 1
967
Thr
t rea
p ac
cere
pan,
s e
repo
rt e
nhtle
dLa
nd ti
t,S
urve
y of
the
Nor
ther
n S
tate
land
s, B
otsw
ana
by th
e La
nd
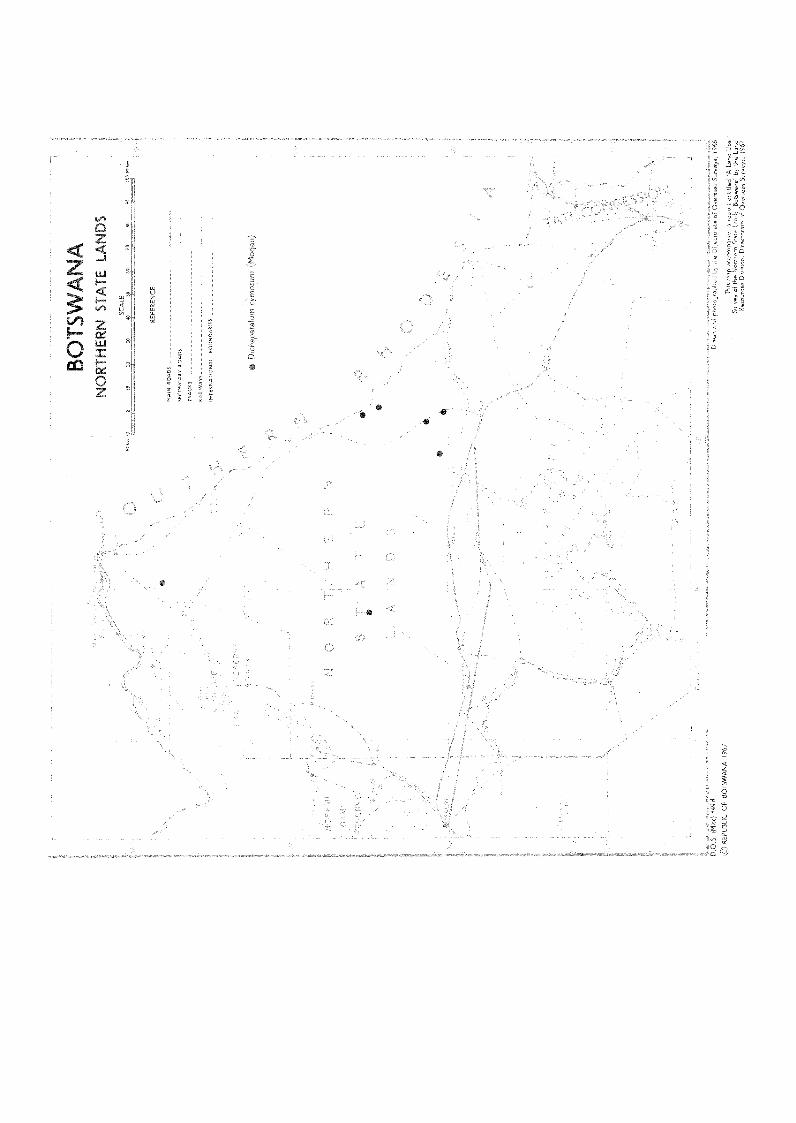
SU
INi V
ItIL,)1i
JC14.n..13
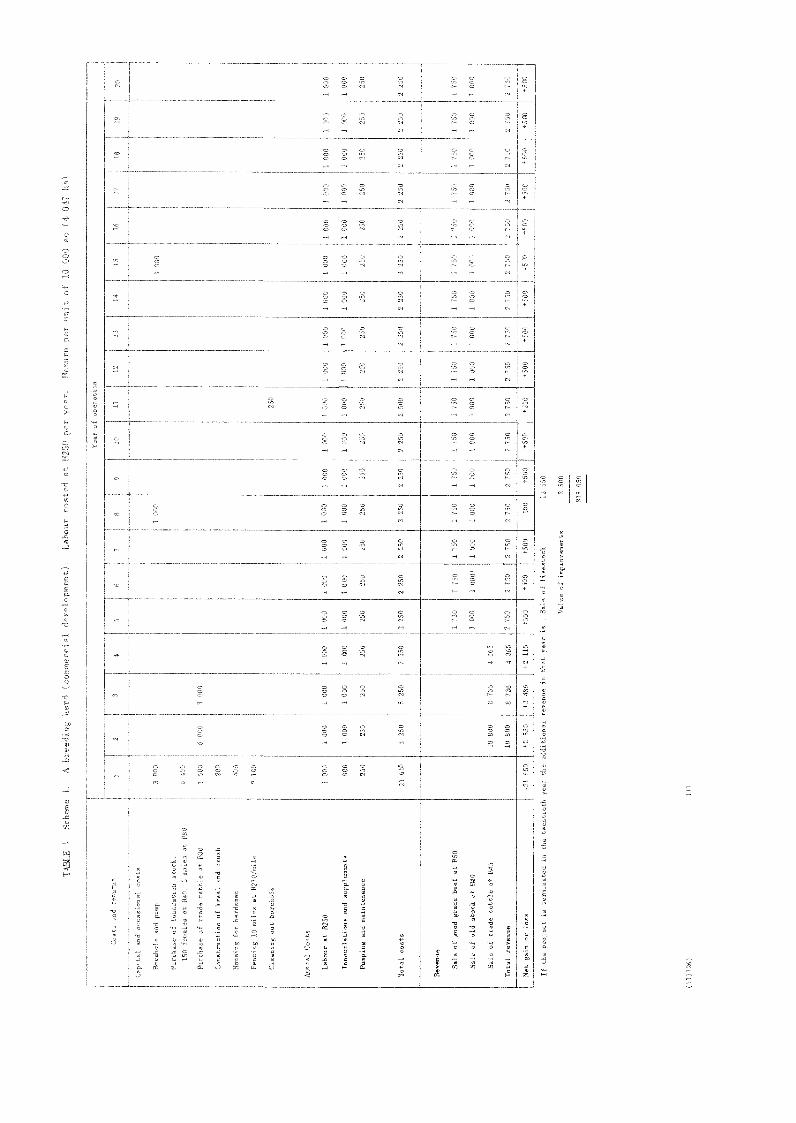
livestock
'tu
rn p
er u
nit o
f.
4 04
7 ha
)
16
1 000
0 000
250
2 250
1 700
1 000
2 750
1 000
1 000
2.50
250
2 750
1
250
1000
1000
000
1 000
1000
1 000
1 000
1 000
1 000
000
1 000
I.
000
000
1 000
250
250
1250
250
252
250
250
250
250
2250
2 250
250
2 250
2 250
2 500
250
2 250
2 250
750
750
1 750
1 755
1750
1 750
1 750
i 750
1 750
1 750
1750
1 750
000
000)
1 000
1 000
1 000
1 000
i 000
000
000
0 000
750
22 750
2 750
2 750
275U
2 700
2 750
27
-So
2750
+500
-500
+500
+500
+250
00
-5107
+7
I)
Labour at 11250
000
i-1000
1000
Innoculations and supplements
200
107
61
000
1030
Pumping and maintenance
250
250
250
250
Total costs
21 P50
8250
5 250
2 250
:Sale of
12 550
Value of improvements
2 500
1115 050
Sale of good grade beef at 1150
Sale of old stock at 1140
Sale of trade cattle at 1845
19 830
8 736
4 365
Total revenue
10 800
736
4 365
Net gain or loso
-21 550
2 550
42 115
If the project is te
ed in the twentieth year the add
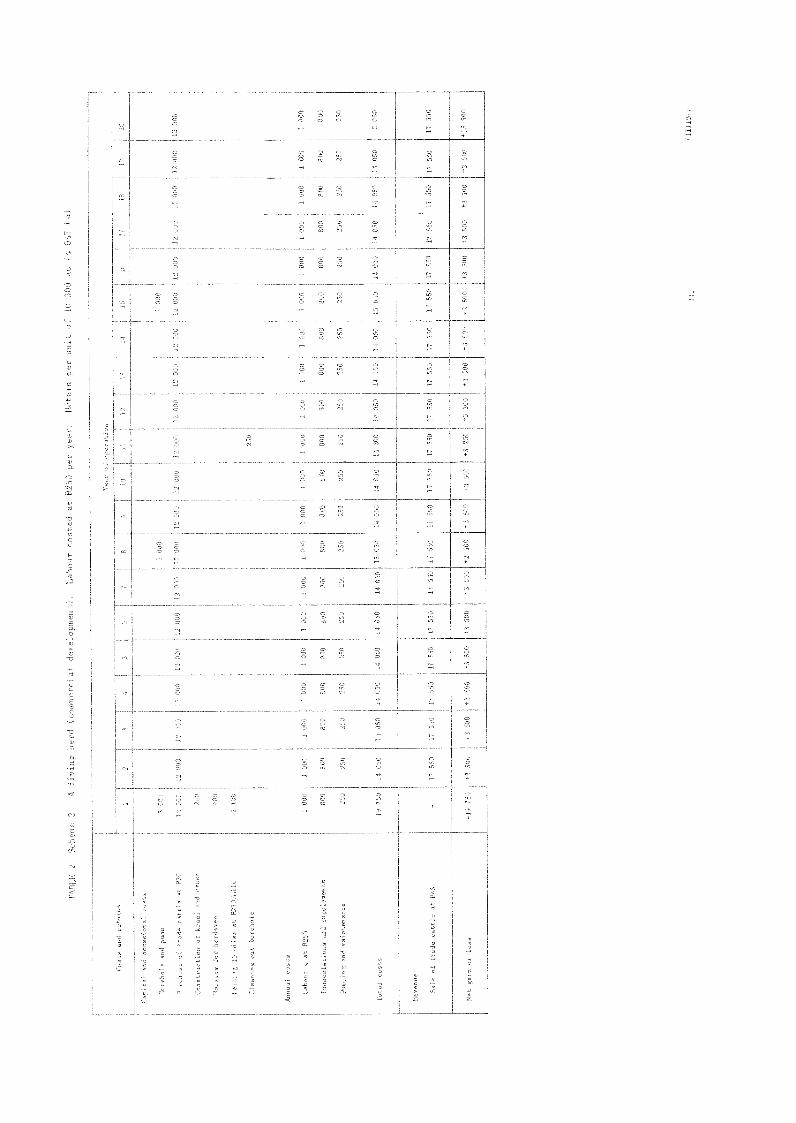
aal a
nd c
runn
trad
e ca
ttle
at B
45
-19
750
1 00
01
000
800
250
125
020
0
14 0
5014
050
10 0
50
(111
126)
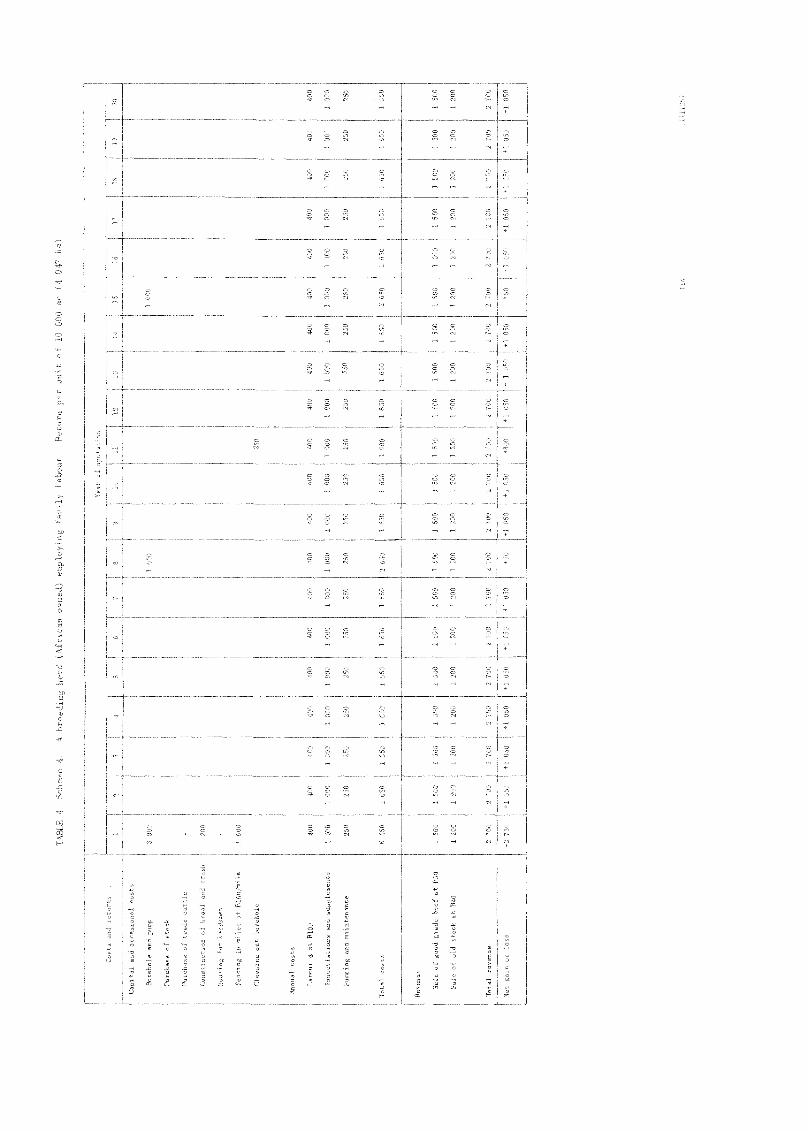
Total costs
Total revenue
No t gain or loss
ITout borehole
oats
Annual costs
Laa
6:'
.0100
T'
.r
supplements
Revenne
Sale of good grade heed it R30
Sale of old stock at 1340
rash
3 455
20°
1600
6 450
1500
1200
2 700
-3 750
+I 000
1
400
1000
250
1650
1 500
I 500
1 500
1 200
1 200
11 200
2 700
40
100
65.
i 2 700
2 700
22 700
--51757-18+1 050
1+1700
050
101
050
400
1 000
250
1500
1200
250
400
400
1 000
I 000
25S)
225
1 650
1 900
1200
1500
1 200
1200
2 705
+800
400
400
450
1400
400
1 000
1000
1 000
1000
1 000
250
250
250
250
250
1 650
1650
1 650
2 650
650
1 650
1 500
1 500
1.500
1500
1500
1500
1 200
1.
200
1 200
12150
1200
1 200
2 700
2 700
2 750
2 700
2 700
2 755
+1 050
01050
fl 050
+50
1+1 050
+1 050
400
DO
1 000
'1
DO
250
250
1 650
1 650
1650
1 650
1, 500
1 200
1500
1500
1 200
I 200
I 200
1.200
2 700
2 700
2 700
400
450
400
1 000
1000
1.050
250
250
250
650
1 650
1 655
1 500
1500
500
I
1200
1200
1200
2 700
2 700
+1 050
I+I
oSn
+1 050
TA
BLE
.A
bre
edin
g he
rd (
Afr
iR
etur
n00
00 t
of
8
-a-
+1 050
+1 050
vi 050
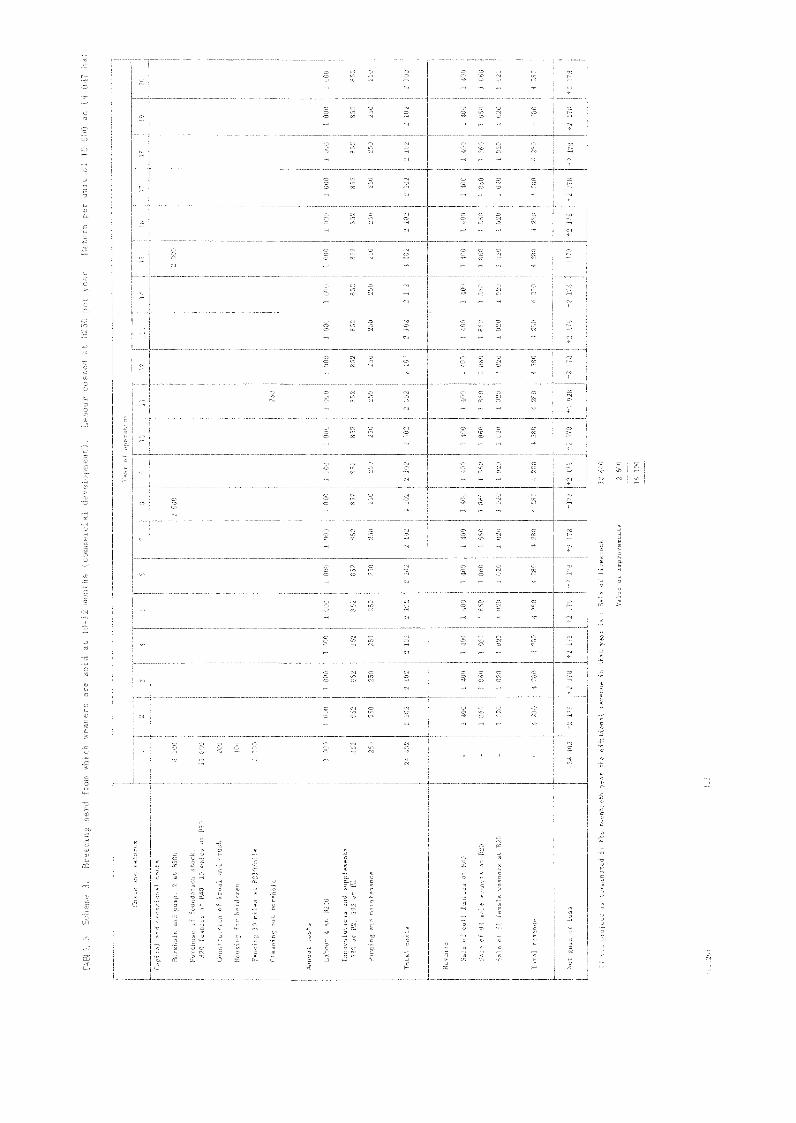
001 91
1)1)0 0191,211
81002
009 ST
000
000 I
0900
001,T
OT
O 9
0E0 I
0981
002 1
Et 82
Rgt
200 2+801+
I1
000 I
1
i10001
í
906 It02.0
001 gt_1
081 09LT
000
002
000 1
ON
29
000
2021T
81080 TS
1°
E6 j.
9188020
T.
090 T
080 T000 0
000 01 080 I
0001
0900
o0100 H000
íí
_íí
1Ii
1
Ii
202 1)
000I
020
00001
001't
080
000 T
0901
000 I
000
000
090T
0010 T
090
OfjT
000 10
000 1
090
008 T
0.1101
000
090
901)
1000
T
090 0
000
000
090 0
001, T
020 0
000 T
090 I
0021
0,0
i
00i
000
0898
000000
[
001
000
000
000 T
ZO
T O
000
000
0001
:I
íí'T
OT
0'
;013g
0102
;000 1
001 0
OS
Z
0,08
000 T
(TO
Tg_
ZO
T
0011000
090008
000 T
E;S
E:
009
1
000 1,
000
008
000 T
gOT
000
1008
000
001T
0910
000
000
Z01,
T.
00000
000
ZO
T. g
0:00 0
000000
0900,00
000T000 T
110
000
000'
000 I
2 2
O 0110.00
P1,30