property tax caps: background and trends - osc.state.ny.us · highlights • new york’s local...
TRANSCRIPT
Highlights
• New York’s local governments collect nearly $40 billion in property tax revenue. Third highest in the nation per capita in 2005, New York’s property taxes have grown more than twice as fast as inflation in recent years. Taxes per household are highest downstate while tax rates are highest upstate.
• Assessment practices are in need of reform. The State’s 1,128 assessing units are not required to assess properties on any schedule, by any set standard, or even by a given percentage of full market value. Twenty percent do not meet a minimal test of assessment uniformity.
• New York’s biggest tax relief program, STAR, cost State taxpayers nearly $5 billion in 2007-08, yet its long-term effect has not been to reduce local property tax growth.
• The State is considering significant property tax reforms. The Commission on Property Tax Relief has called for a tax levy cap of the lower of 4 percent or 120 percent of the national consumer price index (CPI), a circuit breaker to replace some of STAR,1 mandate relief, and assessment reform. The Governor has advanced legislation capping tax levies as well. Meanwhile, the Legislature is considering several other bills, ranging from a major circuit breaker to assessment and rate caps to abolishing the property tax in favor of an income tax surcharge.
• Using the data collected from local governments, the purpose of this report is to analyze some of the options proposed:
• For most of the past decade, 120 percent of CPI would have been less than 4 percent, averaging 3.1 percent from 1997 to 2007; the cap would have been as low as 1.9 percent in one year.
• School districts would have foregone up to $12.3 billion in property taxes from 2001 to 2007 under a 120 percent of CPI / 4 percent levy cap. By 2007, collections could have been up to $3.5 billion (21 percent) lower than the actual levy in that year, assuming no overrides. Almost all districts would have been potentially affected by the cap, with the biggest impact being felt in downstate and suburban areas
• A levy cap would likely constrain wealthier suburban downstate districts, which tend to have high levy increases, but could also adversely impact high-need districts in years when State aid growth slows.
• A school rate cap would mostly constrain upstate districts, where rates are high, but would further complicate the State’s overlapping constitutional tax limit structure
• An assessment cap would further complicate New York’s already complex property tax laws and would not reduce tax liability unless paired with a rate or levy cap.
• Property tax caps would limit districts’ ability to offset temporary dips in more volatile revenue sources such as State aid. This could force them to address budget problems primarily through spending cuts, leading to difficult decisions about educational programs.
• The ability of the State to meet the demand for increased State aid, particularly in times of State fiscal stress, is a critical issue for policymakers to consider. Similarly, the Property Commission pointed out the need for the State to reduce unfunded mandates, an area that will need significant attention if school districts are to be able to contain costs and increase efficiencies without adversely impacting student performance.
Property Tax Caps: Background and TrendsProperty Tax Caps: Background and Trends
A RESEARCH SERIES FROM THE
OFFICE OF THE NEW YORK STATE COMPTROLLER
LOCAL GOVERNMENT ISSUES IN FOCUS
CONTENTS (VOL. 4 NO. 2 AUGUST 2008) Pg. #
Introduction ................................................................................... 2 Property Tax Trends ..................................................................... 3Property Tax Administration ...................................................... 5Tax Caps ......................................................................................... 9Levy Caps in New York ............................................................. 13Rate Caps in New York .............................................................. 16Conclusion ................................................................................... 19
RMD40
DIVISION OF LOCAL GOVERNMENT AND SCHOOL ACCOUNTABILITYThomas P. DiNapoli
State Comptroller

Property Tax Caps: Backgrounds and Trend OFFICE OF THE STATE COMPTROLLER2
Introduction
In 2006, New York State’s local governments collected nearly $40 billion in property tax revenues. The $27 billion raised outside of New York City accounted for 44 percent of local government revenue in that year. By far the largest single source of local government revenue, the property tax is economically stable, relatively easy to administer, under local control (with some restrictions), and holds local officials politically accountable. It also helps buffer local governments from fluctuations in more economically-sensitive revenues, such as the sales tax.
New York State Local Revenues, 2006, All Major Classes of Local Government
Sales Tax6%
Federal Aid11%
State Aid16%
Real Property Taxes19%
Other Taxes23%
Other Non-Tax Revenue
25%
Other Non-Tax Revenue
14%
Real Property Taxes44%
State Aid24%
Federal Aid7%
Sales Tax11%
Other Taxes1%
Outside New York City New York City
Property Tax Caps: Background and Trends 3 DIVISION OF LOCAL GOVERNMENT AND SCHOOL ACCOUNTABILITY
Property Tax Trends
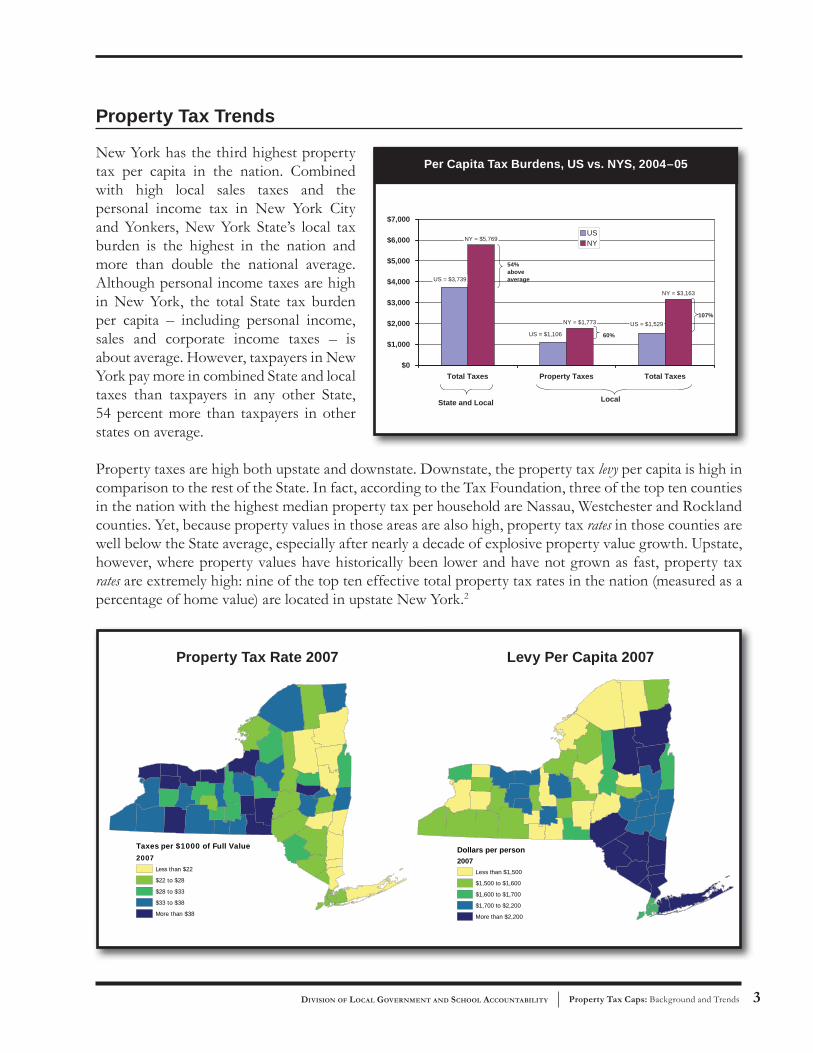
New York has the third highest property tax per capita in the nation. Combined with high local sales taxes and the personal income tax in New York City and Yonkers, New York State’s local tax burden is the highest in the nation and more than double the national average. Although personal income taxes are high in New York, the total State tax burden per capita – including personal income, sales and corporate income taxes – is about average. However, taxpayers in New York pay more in combined State and local taxes than taxpayers in any other State, 54 percent more than taxpayers in other states on average.
Property taxes are high both upstate and downstate. Downstate, the property tax levy per capita is high in comparison to the rest of the State. In fact, according to the Tax Foundation, three of the top ten counties in the nation with the highest median property tax per household are Nassau, Westchester and Rockland counties. Yet, because property values in those areas are also high, property tax rates in those counties are well below the State average, especially after nearly a decade of explosive property value growth. Upstate, however, where property values have historically been lower and have not grown as fast, property tax rates are extremely high: nine of the top ten effective total property tax rates in the nation (measured as a percentage of home value) are located in upstate New York.2
US = $1,529
US = $1,106
US = $3,739
NY = $3,163
NY = $1,773
NY = $5,769
$0
$1,000
$2,000
$3,000
$4,000
$5,000
$6,000
$7,000
Total Taxes Property Taxes Total Taxes
USNY
State and Local Local
54%aboveaverage
60%
107%
Per Capita Tax Burdens, US vs. NYS, 2004–05
Dollars per person2007
Less than $1,500
$1,500 to $1,600
$1,600 to $1,700
$1,700 to $2,200
More than $2,200
Taxes per $1000 of Full Value2007
Less than $22
$22 to $28
$28 to $33
$33 to $38
More than $38
Property Tax Rate 2007 Levy Per Capita 2007

Property Tax Caps: Backgrounds and Trend OFFICE OF THE STATE COMPTROLLER4
Twelve New York State counties – both upstate and downstate – ranked in the top 25 percent in terms of taxes as a percent of income, showing that property taxes are high throughout New York as compared to homeowners’ ability to pay. Downstate, high tax bills contribute to the overall high cost of living. According to the Bureau of the Census, about half of all homeowners with mortgages in Long Island have housing costs over 30 percent of household income. Property taxes constitute a significant portion of that cost.
The property tax is growing faster than most other local government revenues, averaging 7 percent growth per year over the past five years, more than double the inflation rate of 2.6 percent over that period.3 This growth outpaces that of all other major sources of local revenue except the sales tax.4
School districts were responsible for nearly half of all local government expenditures outside New York City in 2007 but accounted for 63 percent of all property taxes levied, and their levies have been growing faster than other local government levies as well. This is because school districts depend on property taxes for a much larger share of their total revenue base. They are almost entirely dependent on property taxes and State aid, while most general purpose local governments have greater access to other sources of revenue, such as sales taxes, fines, and fees.5
County State Taxes as % of Home Value
1. Wayne County NY 2.94%
2. Niagara County NY 2.91%
3. Monroe County NY 2.83%
4. Erie County NY 2.54%
5. Fort Bend County TX 2.53%
6. Chautauqua County NY 2.52%
7. Onondaga County NY 2.50%
8. Cayuga County NY 2.42%
9. Chemung County NY 2.41%
10. Schenectady County NY 2.39%
Effective Tax Rate by County
County State Tax per HH
1. Hunterdon County NJ $7,999
2. Nassau County NY $7,706
3. Westchester County NY $7,626
4. Somerset County NJ $7,318
5. Bergen County NJ $7,237
6. Essex County NJ $7,148
7. Rockland County NY $7,041
8. Morris County NJ $6,852
9. Union County NJ $6,703
10. Passaic County NJ $6,663
Median Household Tax by County
AlbanyCounty
ErieCounty
NassauCounty
SuffolkCounty
WestchesterCounty New York State United States
With a Mortgage 32% 29% 50% 53% 43% 41% 37%
Without a Mortgage 11% 19% 32% 29% 31% 23% 16%
Percentage of Households Paying More than 30 Percent of Household Income on Housing Cost
7.0%7.7%
3.4%
2.6% 2.6%
0.0%
1.0%
2.0%
3.0%
4.0%
5.0%
6.0%
7.0%
8.0%
Real PropertyTax
Sales andOther Taxes
State Aid Other Non-TaxRevenue
Inflation
Average Annual Growth in Revenue Sources, 2001–2006(Excluding NYC)

Property Tax Caps: Background and Trends 5 DIVISION OF LOCAL GOVERNMENT AND SCHOOL ACCOUNTABILITY
Property Tax Administration
According to the Office of Real Property Services (ORPS), New York has the most complex property tax system in the nation. Most states have fewer than 100 assessing units; only seven have over 500. New York has 1,128 assessing units, 80 percent of which are responsible for fewer than 5,000 parcels each. Although 983 of these are exclusive town and city units, 145 villages also assess property within their borders – creating a second assessment on each property within the village, since it is already assessed by the town (or towns) in which the village lies.
To this complexity is added the element of non-uniformity. New York does not require its assessing units to assess properties on any schedule, by any set standard, or even by a given percentage of full market value. The only requirement is that the assessed value of each property within an assessing unit be assessed at the same percentage of full market value as every other property. However, since there is no penalty for not assessing at a uniform rate, even this requirement is not implemented in many assessing units. ORPS estimates that 224 assessing units (20 percent) do not meet a minimal test of assessment uniformity. Widely varying assessments increase the success rates of assessment challenges (known as tax certiorari), which can destabilize a municipality’s tax base.
Since many school districts overlap municipal boundaries, they must levy taxes over multiple assessing units, each of which potentially assess at different percentages of full market value. In order to avoid unfair distribution of those taxes, ORPS must create an equalization rate for each city and town assessing unit in the State. However, since units do not always assess regularly or uniformly, and since smaller units only see a few property sales per year, this is an imprecise solution to the problem. Occasionally, major adjustments to these rates can have a destabilizing impact on the year-to-year property tax bills in areas that do not reassess frequently at full market value. For example, homeowners in Yonkers saw their 2008 county property tax bills increase by 24 percent, simply due to adjustments in the equalization rate. These adjustments are particularly common in Westchester County, where very few of the towns, villages, or cities reassess regularly and where assessments are often at less than 3 percent of full market value.
State Policy Options
One characteristic of the property tax is its visibility. Economists would argue that it is precisely this characteristic that should keep property taxes from getting too high for the preferences of local taxpayers. If property owners get upset enough about rising tax bills, they can vote against school budgets and for local leaders who want to keep taxes lower. However, it is often unclear how much of any property tax increase goes toward paying for items under local control and how much is due to State or federal mandates. This makes it harder for voters to determine “who’s to blame” for property tax increases. In addition, some taxpayers will always find taxes unaffordable even when the majority of voters have determined that the mix of services and the corresponding price tag is one they are willing to bear.
For these reasons, local officials and taxpayers often petition State policymakers for help in restraining local tax bills, and State policymakers have tried to oblige them. Recommendations frequently include abolishing the property tax altogether, providing relief to all or certain classes of taxpayers, or capping the tax in some way. Mandate relief and increased State aid can also be used to reduce the need for property tax increases.

Property Tax Caps: Backgrounds and Trend OFFICE OF THE STATE COMPTROLLER6
The most recent example of State property tax reform is the Commission on Property Tax Relief. Established in January of 2008, the Commission has a broad mandate to “uncover the root causes of high property taxes, with particular examination of unfunded mandates on both school districts and municipalities,” with a particular focus on controlling school property taxes. In its preliminary report, issued June 3, 2008, the Commission recommended:
• Implementing a property tax cap to limit the growth of school property taxes, set at 120 percent of CPI or 4 percent increase, whichever is lower.6 Under this scenario, the limit would be adjusted for new construction, unused levy cap could be “banked,” and capital items authorized by public vote would not be included within the cap. The cap could be overridden by a supermajority (55 percent or 60 percent, depending on State aid growth), and no vote would be required to pass a budget that does not exceed the cap.7 Voters could also place on the ballot an “underride” vote to keep the levy growth to a level beneath the calculated levy cap.
• Creating a significant circuit breaker to target individuals with high residential property tax bills but low incomes, using some funds from the existing STAR program.
• Providing relief from existing and future State mandates, by amending certain labor law provisions, centralizing school district reporting and requiring a complete accounting of the fiscal impact on local governments of all new legislative and regulatory mandates.
The Governor’s Program Bill: Implementing a Tax Cap
After the Commission issued its tax cap recommendations, the Governor advanced a program bill to implement a tax cap, modeled mainly on the Commission’s work. However, it differs from the recommendations in several ways:• In general, it does not address mandate relief to relieve spending pressures on school districts.• It does not establish a circuit-breaker or make any change to STAR funding.• It requires a vote on school levy every year, rather than only when a district attempts to exceed
its tax limit. A supermajority would be required to pass any proposed tax limit override; a simple majority would be required to pass the levy of a district remaining within its tax levy base but proposing to use some of its carry-over. A vote would be required even if a district proposed to levy within its limit, but the vote would have no impact on the levy. This is similar in some ways to the current budget votes, which occur in all districts each year, even when the alternative contingency budget would be at least as large. Residents overwhelmingly pass budgets, often by supermajorities. In 2008-09, 92 percent of district budgets passed, and 88 percent passed by more than 55 percent.
• It allows districts to pass overrides with a simple majority in years when the budget director has not certified State general purpose aid to districts by the May levy vote, a situation the Commission’s recommendations had not addressed.
• It imposes fewer constraints on districts that do not meet the State’s local expected contribution. These low-effort districts would be allowed to increase levies by the lower of 5 percent or 150 percent of the CPI. The bill would also make it easier for them to override the cap and more difficult to underride it.

Property Tax Caps: Background and Trends 7 DIVISION OF LOCAL GOVERNMENT AND SCHOOL ACCOUNTABILITY
Abolish the Property Tax
Over the years there have been calls for replacing the property tax, generally with a State or local personal income tax, as recommended in Senate bill S6119. However, New York’s local property tax generated over $36 billion in 2006 (including NYC) even after subtracting the State’s STAR exemption, slightly more than the $35 billion generated by the State’s personal income tax. In order to raise the revenue that currently comes from the property tax, therefore, the State would have to roughly double the State personal income tax, which is already the second-highest in the nation.8 The other option would be to increase the sales tax, but at an 8.25 percent combined State and local rate in much of New York, it is already higher than that of its neighbors, and it is significantly more regressive than the property tax. Either alternative tax would potentially make local government revenue systems much less stable and could make it more difficult for municipalities to issue general obligation bonds, which are currently backed by expected real property tax revenue. In addition, New York City and Yonkers already have local income taxes, which could make replacing their property taxes even more difficult. The Commission on Property Tax Reform did not recommend repealing the property tax.
Tax Relief: Circuit Breakers and Homestead Exemptions
The State can make property taxes more affordable to some classes of taxpayer, either through a circuit breaker, which reduces or eliminates taxes for residential taxpayers whose taxes represent more that a certain percentage of their incomes, or through a homestead exemption, which exempts a certain amount of the value of a residence from taxation, shifting that burden either on to the remaining local property tax base or the State tax base.
New York has both programs. Its current circuit breaker, however, has such low income thresholds ($18,000) and so small a benefit ($375 for seniors/$75 for non-seniors), as to make it irrelevant for most taxpayers.
STAR per Pupil2006
Less than $900$900 to $1,100$1,100 to $1,200$1,200 to $1,500More than $1,500
STAR Per Pupil, 2006

Property Tax Caps: Backgrounds and Trend OFFICE OF THE STATE COMPTROLLER8
New York’s biggest existing tax relief program, School Tax Relief (STAR), is a homestead exemption. Enacted in 1997, STAR was phased in over several years. Once fully implemented in 2002, it exempted the first $30,000 of the full value of each primary residence from school taxes ($50,000 for lower income seniors). The 2006-07 budget increased the senior exemption, and the past three State fiscal year budgets (2006-07 through 2008-09) provided additional property tax rebates, worth over $1 billion per year, that are sent directly to taxpayers rather than sent to school districts as reimbursement for exempted tax revenue. Yet, with a 2007-08 price tag of almost $5 billion, STAR may provide property tax relief but has little impact on the rate of property tax growth. (See text box.)
Both the Commission on Property Tax Relief’s interim report and legislative proposals (S1053/ A1575) recommend redirecting State tax relief resources from the broad-spectrum homestead exemption to a more directed circuit breaker.
Does STAR help reduce the property tax burden?
STAR partially shifted the burden of locally-determined school funding from homeowners, particularly low-income seniors in areas with low property values and high rates (for instance, Western New York) to State income and sales taxpayers. In 2007-08, STAR cost State taxpayers nearly $5 billion. However, once STAR was fully phased in, levies on homeowners began to rise again even faster than before. Tax levy growth not reimbursed by STAR has grown more than 7 percent per year since 2002. Researchers have noted that, contrary to its goal of providing tax relief, the STAR shift of tax burden from local taxpayers to State taxpayers may cause most New Yorkers to pay a greater overall State and local burden. This is because STAR changes school budget voting incentives, transferring the cost of those local decisions onto Statewide taxpayers. As a result, local taxpayers – especially low-income seniors – may be less inclined to reject school budgets that propose large levy increases because they no longer feel the impact as much.*It was partly in order to counteract the incentive to vote for larger budgets that the most recent STAR expansions have taken the form of a rebate rather than an exemption. Thus, taxpayers still see the full impact of increases on their tax bills, but get some relief later in the year.
* More STAR in New York’s Future?, E.J. McMahon, Manhattan Institute for Policy Research, 2006; The Unintended Consequences of Property Tax Relief: New York’s STAR Program, Tae Ho Eom, William Duncombe and John Yinger, 2007; and Community Heterogeneity and Local Response to Fiscal Incentives, Jonah E. Rockoff, 2003
$0
$5
$10
$15
$20
1990
1991
1992
1993
1994
1995
1996
1997
1998
1999
2000
2001
2002
2003
2004
2005
2006
2007
Levies Deductiing STAR Overall Levies
School Property Tax Levies(Excluding NYC)
Bill
ions
Property Tax Caps: Background and Trends 9 DIVISION OF LOCAL GOVERNMENT AND SCHOOL ACCOUNTABILITY
Tax Caps
As property taxes continue to grow, pressure on State lawmakers to address the problem of high property taxes, particularly school taxes, grows as well. The Commission on Property Tax Relief was established in part to investigate whether any type of school tax cap could control growth in property taxes without impacting the quality of education.
Its recommendation in June to establish one type of cap, however, is not the only such proposal currently under consideration by the Legislature. Thus, it makes sense to discuss briefly the various types of cap available to lawmakers.
Property tax caps can take several forms:
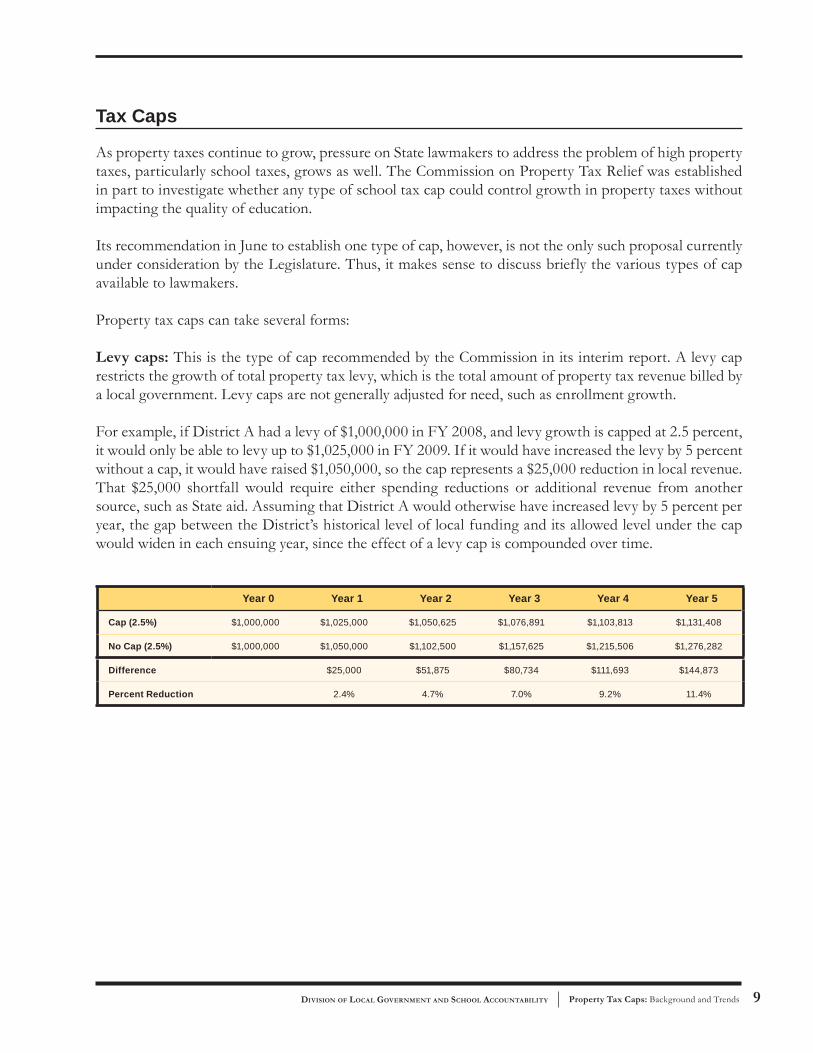
Levy caps: This is the type of cap recommended by the Commission in its interim report. A levy cap restricts the growth of total property tax levy, which is the total amount of property tax revenue billed by a local government. Levy caps are not generally adjusted for need, such as enrollment growth.
For example, if District A had a levy of $1,000,000 in FY 2008, and levy growth is capped at 2.5 percent, it would only be able to levy up to $1,025,000 in FY 2009. If it would have increased the levy by 5 percent without a cap, it would have raised $1,050,000, so the cap represents a $25,000 reduction in local revenue. That $25,000 shortfall would require either spending reductions or additional revenue from another source, such as State aid. Assuming that District A would otherwise have increased levy by 5 percent per year, the gap between the District’s historical level of local funding and its allowed level under the cap would widen in each ensuing year, since the effect of a levy cap is compounded over time.
Year 0 Year 1 Year 2 Year 3 Year 4 Year 5
Cap (2.5%) $1,000,000 $1,025,000 $1,050,625 $1,076,891 $1,103,813 $1,131,408
No Cap (2.5%) $1,000,000 $1,050,000 $1,102,500 $1,157,625 $1,215,506 $1,276,282
Difference $25,000 $51,875 $80,734 $111,693 $144,873
Percent Reduction 2.4% 4.7% 7.0% 9.2% 11.4%
Property Tax Caps: Backgrounds and Trend OFFICE OF THE STATE COMPTROLLER10
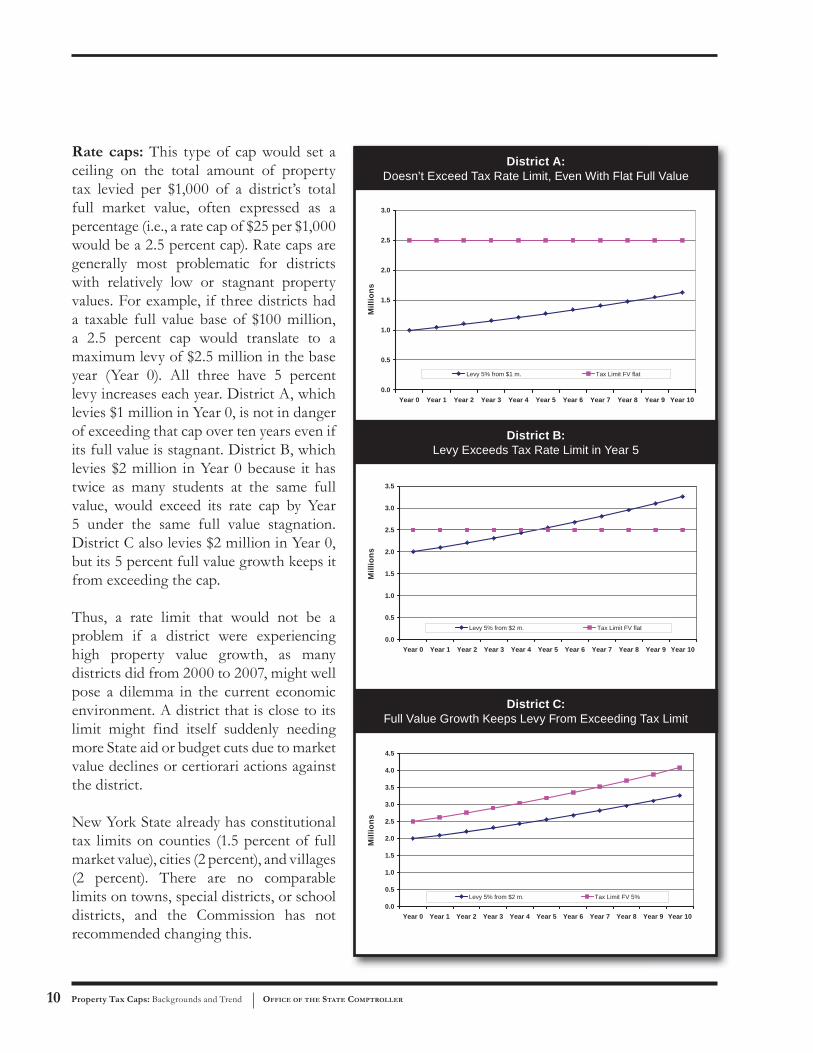
Rate caps: This type of cap would set a ceiling on the total amount of property tax levied per $1,000 of a district’s total full market value, often expressed as a percentage (i.e., a rate cap of $25 per $1,000 would be a 2.5 percent cap). Rate caps are generally most problematic for districts with relatively low or stagnant property values. For example, if three districts had a taxable full value base of $100 million, a 2.5 percent cap would translate to a maximum levy of $2.5 million in the base year (Year 0). All three have 5 percent levy increases each year. District A, which levies $1 million in Year 0, is not in danger of exceeding that cap over ten years even if its full value is stagnant. District B, which levies $2 million in Year 0 because it has twice as many students at the same full value, would exceed its rate cap by Year 5 under the same full value stagnation. District C also levies $2 million in Year 0, but its 5 percent full value growth keeps it from exceeding the cap.
Thus, a rate limit that would not be a problem if a district were experiencing high property value growth, as many districts did from 2000 to 2007, might well pose a dilemma in the current economic environment. A district that is close to its limit might find itself suddenly needing more State aid or budget cuts due to market value declines or certiorari actions against the district.
New York State already has constitutional tax limits on counties (1.5 percent of full market value), cities (2 percent), and villages (2 percent). There are no comparable limits on towns, special districts, or school districts, and the Commission has not recommended changing this.
0.0
0.5
1.0
1.5
2.0
2.5
3.0
Year 0 Year 1 Year 2 Year 3 Year 4 Year 5 Year 6 Year 7 Year 8 Year 9 Year 10
Levy 5% from $1 m. Tax Limit FV flat
District A: Doesn’t Exceed Tax Rate Limit, Even With Flat Full Value
0.0
0.5
1.0
1.5
2.0
2.5
3.0
3.5
Year 0 Year 1 Year 2 Year 3 Year 4 Year 5 Year 6 Year 7 Year 8 Year 9 Year 10
Levy 5% from $2 m. Tax Limit FV flat
0.0
0.5
1.0
1.5
2.0
2.5
3.0
3.5
4.0
4.5
Year 0 Year 1 Year 2 Year 3 Year 4 Year 5 Year 6 Year 7 Year 8 Year 9 Year 10
Levy 5% from $2 m. Tax Limit FV 5%
District B: Levy Exceeds Tax Rate Limit in Year 5
District C: Full Value Growth Keeps Levy From Exceeding Tax Limit
Mill
ions
Mill
ions
Mill
ions
Property Tax Caps: Background and Trends 11 DIVISION OF LOCAL GOVERNMENT AND SCHOOL ACCOUNTABILITY
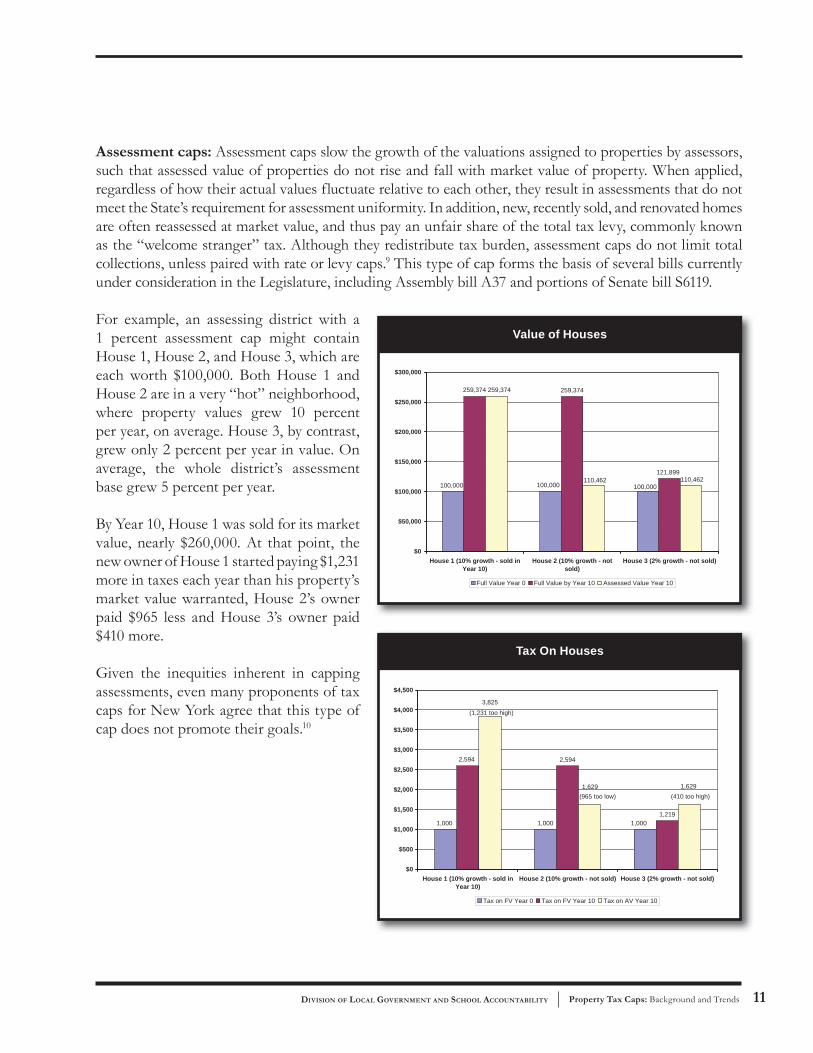
Assessment caps: Assessment caps slow the growth of the valuations assigned to properties by assessors, such that assessed value of properties do not rise and fall with market value of property. When applied, regardless of how their actual values fluctuate relative to each other, they result in assessments that do not meet the State’s requirement for assessment uniformity. In addition, new, recently sold, and renovated homes are often reassessed at market value, and thus pay an unfair share of the total tax levy, commonly known as the “welcome stranger” tax. Although they redistribute tax burden, assessment caps do not limit total collections, unless paired with rate or levy caps.9 This type of cap forms the basis of several bills currently under consideration in the Legislature, including Assembly bill A37 and portions of Senate bill S6119.
For example, an assessing district with a 1 percent assessment cap might contain House 1, House 2, and House 3, which are each worth $100,000. Both House 1 and House 2 are in a very “hot” neighborhood, where property values grew 10 percent per year, on average. House 3, by contrast, grew only 2 percent per year in value. On average, the whole district’s assessment base grew 5 percent per year.
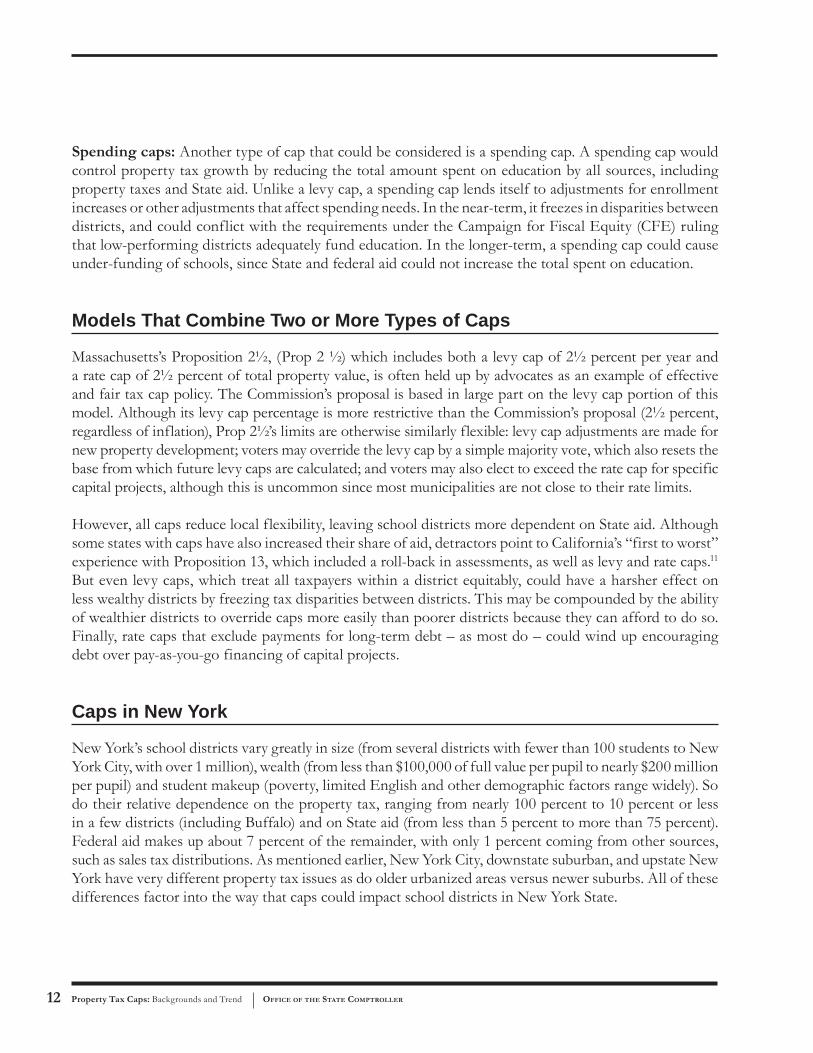
By Year 10, House 1 was sold for its market value, nearly $260,000. At that point, the new owner of House 1 started paying $1,231 more in taxes each year than his property’s market value warranted, House 2’s owner paid $965 less and House 3’s owner paid $410 more.
Given the inequities inherent in capping assessments, even many proponents of tax caps for New York agree that this type of cap does not promote their goals.10
1,0001,219
1,0001,000
2,5942,594
1,629 1,629
3,825
$0
$500
$1,000
$1,500
$2,000
$2,500
$3,000
$3,500
$4,000
$4,500
House 1 (10% growth - sold inYear 10)
House 2 (10% growth - not sold) House 3 (2% growth - not sold)
Tax on FV Year 0 Tax on FV Year 10 Tax on AV Year 10
(1,231 too high)
(965 too low) (410 too high)
Tax On Houses
100,000100,000 100,000
259,374259,374
121,899110,462
259,374
110,462
$0
$50,000
$100,000
$150,000
$200,000
$250,000
$300,000
House 1 (10% growth - sold inYear 10)
House 2 (10% growth - notsold)
House 3 (2% growth - not sold)
Full Value Year 0 Full Value by Year 10 Assessed Value Year 10
Value of Houses
Property Tax Caps: Backgrounds and Trend OFFICE OF THE STATE COMPTROLLER12
Spending caps: Another type of cap that could be considered is a spending cap. A spending cap would control property tax growth by reducing the total amount spent on education by all sources, including property taxes and State aid. Unlike a levy cap, a spending cap lends itself to adjustments for enrollment increases or other adjustments that affect spending needs. In the near-term, it freezes in disparities between districts, and could conflict with the requirements under the Campaign for Fiscal Equity (CFE) ruling that low-performing districts adequately fund education. In the longer-term, a spending cap could cause under-funding of schools, since State and federal aid could not increase the total spent on education.
Models That Combine Two or More Types of Caps
Massachusetts’s Proposition 2½, (Prop 2 ½) which includes both a levy cap of 2½ percent per year and a rate cap of 2½ percent of total property value, is often held up by advocates as an example of effective and fair tax cap policy. The Commission’s proposal is based in large part on the levy cap portion of this model. Although its levy cap percentage is more restrictive than the Commission’s proposal (2½ percent, regardless of inflation), Prop 2½’s limits are otherwise similarly flexible: levy cap adjustments are made for new property development; voters may override the levy cap by a simple majority vote, which also resets the base from which future levy caps are calculated; and voters may also elect to exceed the rate cap for specific capital projects, although this is uncommon since most municipalities are not close to their rate limits.
However, all caps reduce local flexibility, leaving school districts more dependent on State aid. Although some states with caps have also increased their share of aid, detractors point to California’s “first to worst” experience with Proposition 13, which included a roll-back in assessments, as well as levy and rate caps.11 But even levy caps, which treat all taxpayers within a district equitably, could have a harsher effect on less wealthy districts by freezing tax disparities between districts. This may be compounded by the ability of wealthier districts to override caps more easily than poorer districts because they can afford to do so. Finally, rate caps that exclude payments for long-term debt – as most do – could wind up encouraging debt over pay-as-you-go financing of capital projects.
Caps in New York
New York’s school districts vary greatly in size (from several districts with fewer than 100 students to New York City, with over 1 million), wealth (from less than $100,000 of full value per pupil to nearly $200 million per pupil) and student makeup (poverty, limited English and other demographic factors range widely). So do their relative dependence on the property tax, ranging from nearly 100 percent to 10 percent or less in a few districts (including Buffalo) and on State aid (from less than 5 percent to more than 75 percent). Federal aid makes up about 7 percent of the remainder, with only 1 percent coming from other sources, such as sales tax distributions. As mentioned earlier, New York City, downstate suburban, and upstate New York have very different property tax issues as do older urbanized areas versus newer suburbs. All of these differences factor into the way that caps could impact school districts in New York State.

Property Tax Caps: Background and Trends 13 DIVISION OF LOCAL GOVERNMENT AND SCHOOL ACCOUNTABILITY
Levy Caps in New York
The Commission’s interim report recommended a levy cap that would allow districts to:
• Increase levies by 120 percent of the inflation rate or 4 percent, whichever is lower.
• “Bank” foregone revenue for 10 years, and draw on foregone revenue to increase levy by up to another 1.5 percent in any given year without an override vote. This would provide an incentive for districts not to increase levies more than required in any given year, in case it is needed for future budgets.
• Hold a vote to override the cap (by a supermajority) or to underride it.
• Adjust the cap for growth in the tax base or for the amount of capital investment already approved by a public bond vote.
Determining an Inflation–Based Cap
A cap based on the lower of 120 percent of inflation or 4 percent would not entitle districts to 4 percent growth in every year. From 1997 to 2007, for example, annual inflation ran between 1.6 (cap=1.9) and 3.4 percent (cap=4.0). Of course, there is no way to determine the inflation rate for a year that is being budgeted, so district levy caps would be set based on recent history (for example, the 2008-09 school year levy cap would be set based on the annual inflation rate of the 2007 calendar year). This could lead to constricted budgets in years when high inflation follows a period of low inflation. The following chart shows inflation rates (national consumer price index, or CPI) and resulting caps for school years 1996-97 through 2006-07, given these assumptions, against actual levy growth during the same period. Another question is which measure of inflation would be used. The Governor’s bill uses the national consumer price index, but the CPI is also measured regionally (Northeastern states together) and by major metropolitan area (New York City and its surrounding area). Interestingly, the New York City metropolitan area CPI has occasionally been as much as a full percentage point different than the national index over the past decade.
0123456789
1997
1998
1999
2000
2001
2002
2003
2004
2005
2006
2007
Per
cent
Gro
wth
CPI for Calendar Year Cap for School Year Actual Levy Growth
CPI vs. Levy Cap School Years 1997–2007
Property Tax Caps: Backgrounds and Trend OFFICE OF THE STATE COMPTROLLER14
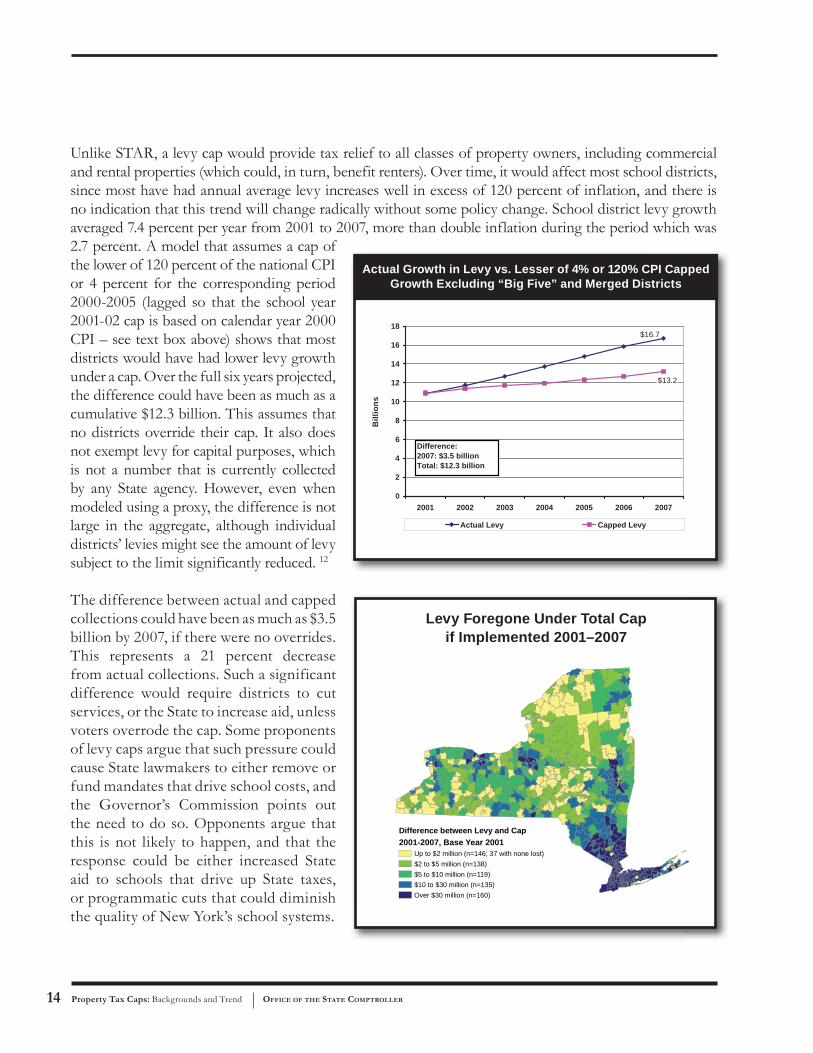
Unlike STAR, a levy cap would provide tax relief to all classes of property owners, including commercial and rental properties (which could, in turn, benefit renters). Over time, it would affect most school districts, since most have had annual average levy increases well in excess of 120 percent of inflation, and there is no indication that this trend will change radically without some policy change. School district levy growth averaged 7.4 percent per year from 2001 to 2007, more than double inflation during the period which was 2.7 percent. A model that assumes a cap of the lower of 120 percent of the national CPI or 4 percent for the corresponding period 2000-2005 (lagged so that the school year 2001-02 cap is based on calendar year 2000 CPI – see text box above) shows that most districts would have had lower levy growth under a cap. Over the full six years projected, the difference could have been as much as a cumulative $12.3 billion. This assumes that no districts override their cap. It also does not exempt levy for capital purposes, which is not a number that is currently collected by any State agency. However, even when modeled using a proxy, the difference is not large in the aggregate, although individual districts’ levies might see the amount of levy subject to the limit significantly reduced. 12
The difference between actual and capped collections could have been as much as $3.5 billion by 2007, if there were no overrides. This represents a 21 percent decrease from actual collections. Such a significant difference would require districts to cut services, or the State to increase aid, unless voters overrode the cap. Some proponents of levy caps argue that such pressure could cause State lawmakers to either remove or fund mandates that drive school costs, and the Governor’s Commission points out the need to do so. Opponents argue that this is not likely to happen, and that the response could be either increased State aid to schools that drive up State taxes, or programmatic cuts that could diminish the quality of New York’s school systems.
$16.7
$13.2
0
2
4
6
8
10
12
14
16
18
2001 2002 2003 2004 2005 2006 2007
Actual Levy Capped Levy
Difference:2007: $3.5 billionTotal: $12.3 billion
Actual Growth in Levy vs. Lesser of 4% or 120% CPI Capped Growth Excluding “Big Five” and Merged Districts
Bill
ions
Difference between Levy and Cap2001-2007, Base Year 2001
Up to $2 million (n=146; 37 with none lost)$2 to $5 million (n=138)$5 to $10 million (n=119)$10 to $30 million (n=135)Over $30 million (n=160)
Levy Foregone Under Total Cap if Implemented 2001–2007

Property Tax Caps: Background and Trends 15 DIVISION OF LOCAL GOVERNMENT AND SCHOOL ACCOUNTABILITY
If the State were to increase aid to cover a disparity of this magnitude, it would almost certainly have to increase some other tax, such as the personal income tax. To give a sense of the magnitude of a personal income tax increase that would cover that amount, one can look at the State’s temporary personal income tax surcharge imposed to generate revenue in the wake of the economic downturn and the 9-11 terrorist attacks. Beginning with the 2003 tax year, the State created two temporary new brackets with higher tax rates. The higher of the two temporary rates (7.7 percent up from 6.85 percent) remained in effect for three years while the lower rate was phased down over three years (7.5 percent in 2003, 7.375 percent in 2004 and 7.25 percent in 2005). In State Fiscal Year Ending 2005, the State generated about $1.5 billion from this surcharge or about 60 percent of the $2.5 billion funding gap generated by the model for that school year.
If the State did not increase aid to compensate for lost revenue, districts that would otherwise have had larger levy increases would face the greatest relative constraint. Since downstate levies have grown faster than those upstate in recent years, partly due to increases in enrollment and higher regional inflation rates, a levy cap might be expected to constrain downstate districts most.13 When modeled for the period 2001-2007, Long Island and Mid Hudson Valley districts would be most constrained by a cap such as the one proposed by the Commission and the Governor’s bill.
However, in addition to regional differences, there is the question of how caps would affect the State’s high need districts. Districts designated “high need urban/suburban” by the State Education Department (SED) had lower average annual levy growth than their “low need” counterparts over the period. However, that does not necessarily mean that these districts would face less pressure as a result of the levy cap. In fact, high-need districts typically depend on State aid for a much greater share of their budgets than low-need districts. When State aid falls short, they are left with larger budget gaps than their counterparts, which they then must
-4%
-2%
0%
2%
4%
6%
8%
10%
01to02 02to03 03to04 04to05 05to06
Operating Levy Operating Aid
-2%
0%
2%
4%
6%
8%
10%
12%
01to02 02to03 03to04 04to05 05to06
Operating Levy Operating Aid
Operating Levy vs. Operating Aid, High Need Urban/Suburban Districts, 2001-2006
Operating Levy vs. Operating Aid, Low Need Districts, 2001-2006
Property Tax Caps: Backgrounds and Trend OFFICE OF THE STATE COMPTROLLER16
fill with sharp levy increases or expenditure cuts. Recent history bears this out: although low-need districts have increased levies at a fairly constant rate from 2000 to 2006, the levies in high-need districts grew more quickly in years when State aid growth slowed (2003 and 2004). In the event of a levy cap, high-need districts might well find themselves faced with making difficult budget decisions in years when State aid falls short.
Rate Caps in New York
Part of Massachusetts’s Proposition 2½ is a tax rate limit of 2½ percent overall. Thus, the total levy in any given city or township cannot be greater than 2½ percent of total taxable value. Some bills currently under consideration in New York include school district rate caps. New York State already imposes a constitutional property tax rate limit on some of its local governments. Counties must keep real property tax levies below 1½ percent of the five-year average of taxable full value, while cities and villages must keep spending below 2 percent.14 Towns and special districts are not subject to the same limits. Neither are school districts, although “Big Five” dependent schools must operate under their cities’ caps.
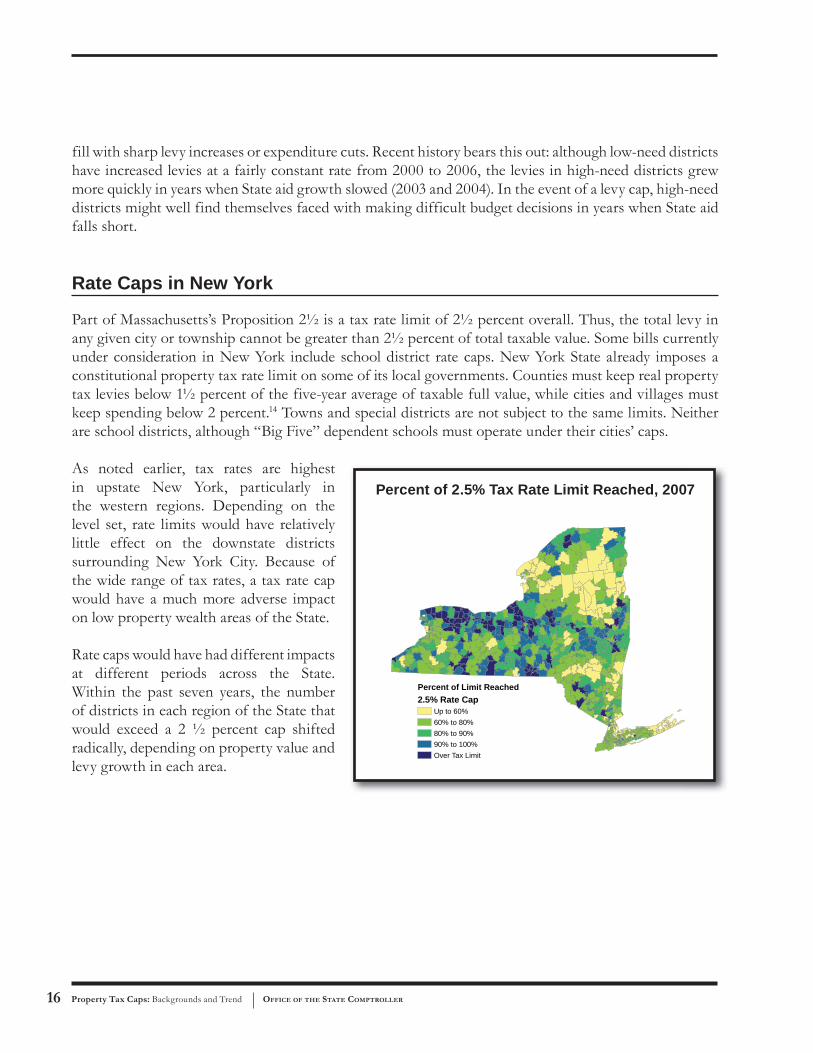
As noted earlier, tax rates are highest in upstate New York, particularly in the western regions. Depending on the level set, rate limits would have relatively little effect on the downstate districts surrounding New York City. Because of the wide range of tax rates, a tax rate cap would have a much more adverse impact on low property wealth areas of the State.
Rate caps would have had different impacts at different periods across the State. Within the past seven years, the number of districts in each region of the State that would exceed a 2 ½ percent cap shifted radically, depending on property value and levy growth in each area.
Percent of Limit Reached2.5% Rate Cap
Up to 60%60% to 80%80% to 90%90% to 100%Over Tax Limit
Percent of 2.5% Tax Rate Limit Reached, 2007
Property Tax Caps: Background and Trends 17 DIVISION OF LOCAL GOVERNMENT AND SCHOOL ACCOUNTABILITY
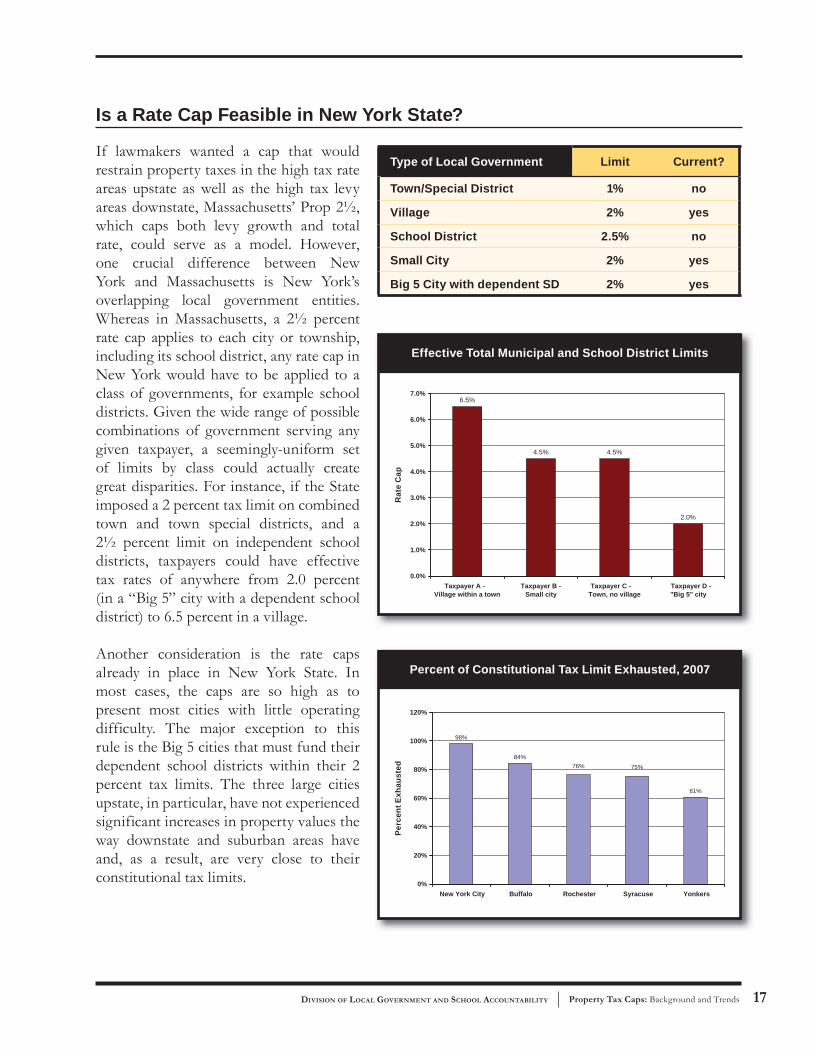
Is a Rate Cap Feasible in New York State?
If lawmakers wanted a cap that would restrain property taxes in the high tax rate areas upstate as well as the high tax levy areas downstate, Massachusetts’ Prop 2½, which caps both levy growth and total rate, could serve as a model. However, one crucial difference between New York and Massachusetts is New York’s overlapping local government entities. Whereas in Massachusetts, a 2½ percent rate cap applies to each city or township, including its school district, any rate cap in New York would have to be applied to a class of governments, for example school districts. Given the wide range of possible combinations of government serving any given taxpayer, a seemingly-uniform set of limits by class could actually create great disparities. For instance, if the State imposed a 2 percent tax limit on combined town and town special districts, and a 2½ percent limit on independent school districts, taxpayers could have effective tax rates of anywhere from 2.0 percent (in a “Big 5” city with a dependent school district) to 6.5 percent in a village.
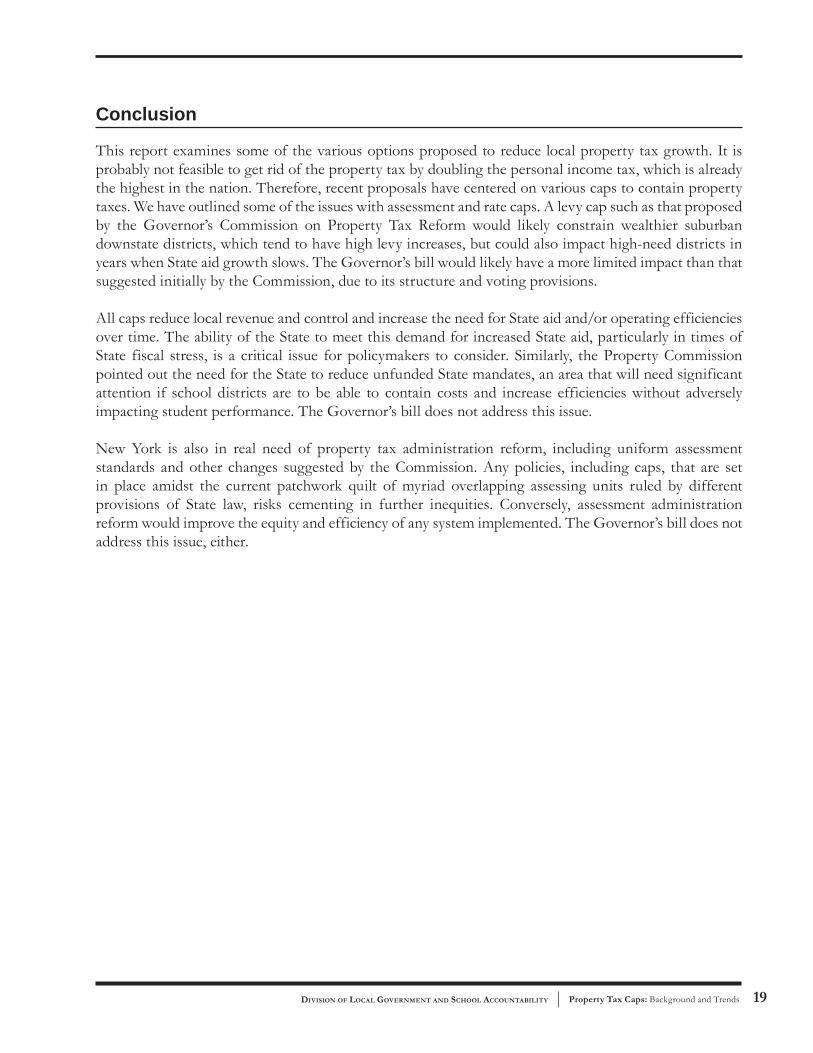
Another consideration is the rate caps already in place in New York State. In most cases, the caps are so high as to present most cities with little operating difficulty. The major exception to this rule is the Big 5 cities that must fund their dependent school districts within their 2 percent tax limits. The three large cities upstate, in particular, have not experienced significant increases in property values the way downstate and suburban areas have and, as a result, are very close to their constitutional tax limits.
Type of Local Government Limit Current?
Town/Special District 1% no
Village 2% yes
School District 2.5% no
Small City 2% yes
Big 5 City with dependent SD 2% yes
6.5%
4.5% 4.5%
2.0%
0.0%
1.0%
2.0%
3.0%
4.0%
5.0%
6.0%
7.0%
Taxpayer A -Village within a town
Taxpayer B -Small city
Taxpayer C -Town, no village
Taxpayer D -"Big 5" city
Effective Total Municipal and School District Limits
Rat
e C
ap
98%
84%
61%
75%76%
0%
20%
40%
60%
80%
100%
120%
New York City Buffalo Rochester Syracuse Yonkers
Percent of Constitutional Tax Limit Exhausted, 2007
Perc
ent E
xhau
sted

Property Tax Caps: Backgrounds and Trend OFFICE OF THE STATE COMPTROLLER18
The effect of rate caps where they are low enough to have any effect, therefore, has been to keep dependent school district levies nearly flat during a time when most levies rose faster than inflation. The result was ever-increasing need for State aid and operational efficiencies to increase spending in accordance with No Child Left Behind and other requirements. (The contrast between local contribution and State aid is even starker when STAR is counted as State aid.)
0.0%
1.0%
2.0%
3.0%
4.0%
5.0%
6.0%
7.0%
Buffalo Rochester Syracuse
Levy State Aid
Levy vs. State Aid Growth, 1998-2006, Big 3 Upstate School Districts (STAR in Levy)
-4.0%
-2.0%
0.0%
2.0%
4.0%
6.0%
8.0%
Buffalo Rochester Syracuse
Levy State Aid
Levy vs. State Aid Growth, 1998-2006, Big 3 Upstate School Districts (STAR in State Aid)
Property Tax Caps: Background and Trends 19 DIVISION OF LOCAL GOVERNMENT AND SCHOOL ACCOUNTABILITY
Conclusion
This report examines some of the various options proposed to reduce local property tax growth. It is probably not feasible to get rid of the property tax by doubling the personal income tax, which is already the highest in the nation. Therefore, recent proposals have centered on various caps to contain property taxes. We have outlined some of the issues with assessment and rate caps. A levy cap such as that proposed by the Governor’s Commission on Property Tax Reform would likely constrain wealthier suburban downstate districts, which tend to have high levy increases, but could also impact high-need districts in years when State aid growth slows. The Governor’s bill would likely have a more limited impact than that suggested initially by the Commission, due to its structure and voting provisions.
All caps reduce local revenue and control and increase the need for State aid and/or operating efficiencies over time. The ability of the State to meet this demand for increased State aid, particularly in times of State fiscal stress, is a critical issue for policymakers to consider. Similarly, the Property Commission pointed out the need for the State to reduce unfunded State mandates, an area that will need significant attention if school districts are to be able to contain costs and increase efficiencies without adversely impacting student performance. The Governor’s bill does not address this issue.
New York is also in real need of property tax administration reform, including uniform assessment standards and other changes suggested by the Commission. Any policies, including caps, that are set in place amidst the current patchwork quilt of myriad overlapping assessing units ruled by different provisions of State law, risks cementing in further inequities. Conversely, assessment administration reform would improve the equity and efficiency of any system implemented. The Governor’s bill does not address this issue, either.

Property Tax Caps: Backgrounds and Trend OFFICE OF THE STATE COMPTROLLER20
Endnotes
1 A “circuit breaker” provides some amount of property tax relief to taxpayers earning below a certain income level when their property taxes exceed a certain percentage of their income. Usually, circuit breakers are only available below a certain income level and may only apply to elderly homeowners.
2 Tax Foundation, Property Taxes on Owner Occupied Housing by County, 2006, September 12, 2007. Includes data from counties with populations greater than 65,000. Data from Census Bureau.
3 STAR is included in all measures of school real property tax revenue or levy throughout this report, except where noted, because it is distributed as a taxpayer reimbursement, either to school districts on behalf of their eligible taxpayers or directly to taxpayers as a rebate. STAR, particularly the exemption portion, is sometimes reported as State aid by other sources, since it represents a tax shift from local to State sources.
4 Sales tax growth during the period includes a number of rate increases as well as economic growth.
5 A small number of school districts receive revenue from sales tax distributions, but most do not.
6 Dependent Districts: The Commission notes that the Big Five cities (New York City, Buffalo, Rochester, Syracuse and Yonkers) with “dependent” school districts would have to be treated differently.
7 This recommendation did not become part of Governor Paterson’s bill (see text box on page 6).
8 New York’s State and local personal income taxes, including New York City and Yonkers, are the highest in the nation.
9 Property taxes are set by determining property tax revenue needed, then dividing that tax bill by the total amount of assessed value in the district (multiplied by an equalization rate, if a district crosses multiple assessing units) to determine the rate, and then applying the rate to the assessed value of each property to determine individual tax bills. Thus, low assessed value would just lead to higher tax rates.
10 Enough is Enough: Why and How to Cap New York’s School Property Taxes (Draft), Submitted to New York State Commission on Property Tax Relief by E.J. McMahon, Senior Fellow, Manhattan Institute for Policy Research, Director, Empire Center for New York State.
11 In that case, the state did not replace lost local revenue, causing previously generous school districts to cut programs, and a supermajority requirement for bonding made it very difficult to accommodate population growth. According to the U.S. Education Department, students in California test near the bottom of the 50 states on reading, math, and writing.
12 The model also makes no effort to adjust for districts that would have higher thresholds (such as those not meeting their expected local contribution, or those who had base growth due to development) or for PILOT (payments in lieu of taxes) payments.
13 These districts might have had less restrictive caps, due to new development.
14 All levy not being used to pay for major capital items (usually through long-term debt service) is subject to this limit.


New York StateOffi ce of the State Comptroller
Division of Local Government and School Accountability
For additional copies of this report contact:
New York State Offi ce of the State ComptrollerDivision of Local Government and School Accountability110 State Street, 12th fl oorAlbany, New York 12236 (518) 474- 6975
Email address: [email protected]