property tax administration annual report 2004 · property tax digests between and within counties...
TRANSCRIPT

STATE OF GEORGIA
2004 ANNUAL REPORT REGARDING
PROPERTY TAX ADMINISTRATION
GEORGIA DEPARTMENT
OF REVENUE
January 20, 2005
BART L. GRAHAM
Revenue Commissioner
2
Commissioner’s Report to the General Assembly
Regarding Property Tax Administration
Georgia Department of Revenue
January 20, 2005
3
TABLE OF CONTENTS
Page
Letter from Commissioner Graham .................................................................................................... 4 Highlights of Annual Report ................................................................................................................ 5 Reporting Requirements ...................................................................................................................... 7 Digest Review Procedures................................................................................................................... 8
Table 1 – Additional State Tax & Penalties Assessed 2003 Review Year Counties.................. 9 Table 2 – Additional State Tax Assessed 2003 Non-Review Year Counties.............................. 9 Figure 1 – Average Level of Assessment ................................................................................. 10 Figure 2 – Average Level of Uniformity .................................................................................... 10 Figure 3 – Average Level of Assessment Bias ......................................................................... 11 Value and Revenue……………………………………………………………………………………. ........ 12 Figure 4 – Total Assessed Value............................................................................................. 12
Figure 5 – Average Millage Rate ............................................................................................. 12 Figure 6 – Percentage of 2003 Values To Total Value by Property Class .............................. 13 Figure 7 – Comparison of Total Revenue................................................................................ 13 Figure 8 – 2003 Percentage of Total Revenue by Tax Type .................................................. 14 Figure 9 – 2003 County Tax Revenue By Property Class ....................................................... 14 Figure 10 – 5 Year Comparison of County Tax Revenue........................................................ 15 Figure 11 – 2003 School Tax Revenue by Property Class...................................................... 15
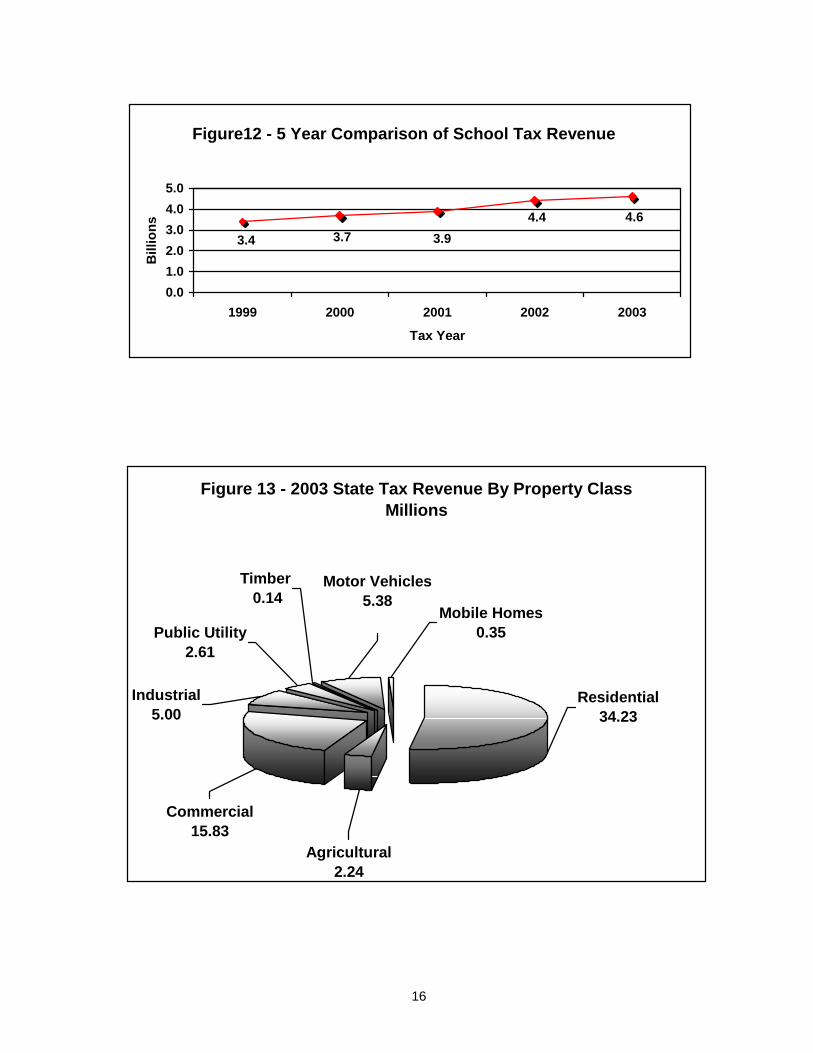
Figure 12 – 5 Year Comparison of School Tax Revenue ........................................................ 16 Figure 13 – 2003 State Tax Revenue by Property Class ........................................................ 16 Public Utilities ..................................................................................................................................... 17 Table 3 – 2004 Public Utility Equalization Ratios .................................................................... 18 Figure 14 – Trend of Average Proposed Public Utility Equalization Ratio............................... 19 Preferential Agricultural Assessment............................................................................................... 20 Table 4– Preferential Agricultural Assessment Fiscal Impact.................................................. 20 Table 5 – Preferential Agricultural Assessment for 2003......................................................... 21 Figure 15 – Preferential Agricultural Assessment Revenue .................................................... 23 Figure 16 – Preferential Agricultural Assessed Value Eliminated............................................ 23 Conservation Use Valuation .............................................................................................................. 24 Table 6– Conservation Use Fiscal Impact ............................................................................... 24 Table 7 – Conservation Use Valuation Assessment for 2003 ................................................. 25 Figure 17 – Conservation Use Revenue Loss ......................................................................... 28 Figure 18 – Conservation Use Assessed Value Eliminated .................................................... 28 Timber .................................................................................................................................................. 29 Table 8 – 2002 Timber Revenue Reported on 2003 Tax Digests ........................................... 29 Figure 19 – State Wide Timber Values.................................................................................... 30 Figure 20 – County and School Revenue from Timber ........................................................... 30
4
Department of Revenue 1800 Century Center Boulevard
Suite 15300 Atlanta, Georgia 30345
Telephone 404-417-2100
January 20, 2005
Members of the General Assembly and Others: This report has been developed by the Department of Revenue for the purpose of fulfilling the Commissioner’s responsibility of continuing to provide the General Assembly with the effect of property tax administration and the continued enactment of laws created by legislation and administered by the Department of Revenue. The information contained in this report is made pursuant to the requirements of O.C.G.A. §§ 48-5-349.5, 48-5-7.1 and 48-5-7.4. It is hoped this report can be a tool for further understanding the state of Property Tax Administration in Georgia. The staff of the Local Government Services Division and I are available to provide more information or clarification of information upon request. We look forward to working with you during the 2005 session and during the year. Respectfully Submitted, Bart L. Graham Revenue Commissioner
Bart L. Graham Revenue Commissioner
5
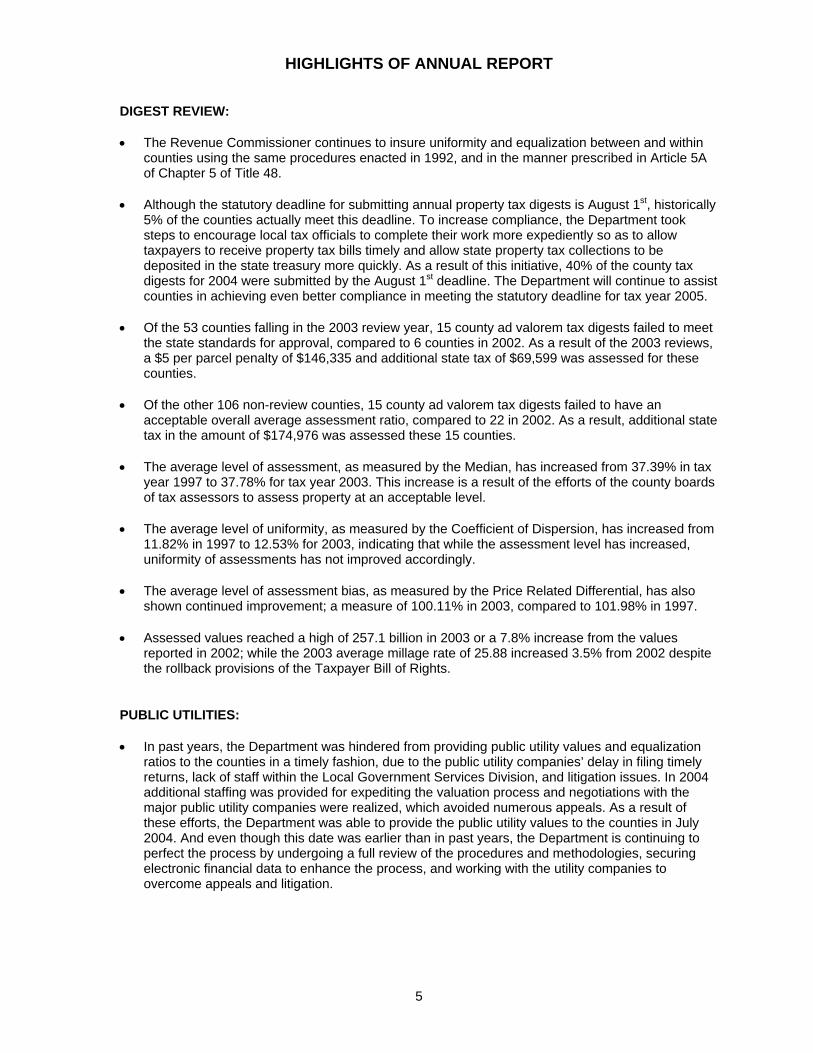
HIGHLIGHTS OF ANNUAL REPORT
DIGEST REVIEW: • The Revenue Commissioner continues to insure uniformity and equalization between and within
counties using the same procedures enacted in 1992, and in the manner prescribed in Article 5A of Chapter 5 of Title 48.
• Although the statutory deadline for submitting annual property tax digests is August 1st, historically 5% of the counties actually meet this deadline. To increase compliance, the Department took steps to encourage local tax officials to complete their work more expediently so as to allow taxpayers to receive property tax bills timely and allow state property tax collections to be deposited in the state treasury more quickly. As a result of this initiative, 40% of the county tax digests for 2004 were submitted by the August 1st deadline. The Department will continue to assist counties in achieving even better compliance in meeting the statutory deadline for tax year 2005.
• Of the 53 counties falling in the 2003 review year, 15 county ad valorem tax digests failed to meet
the state standards for approval, compared to 6 counties in 2002. As a result of the 2003 reviews, a $5 per parcel penalty of $146,335 and additional state tax of $69,599 was assessed for these counties.
• Of the other 106 non-review counties, 15 county ad valorem tax digests failed to have an acceptable overall average assessment ratio, compared to 22 in 2002. As a result, additional state tax in the amount of $174,976 was assessed these 15 counties.
• The average level of assessment, as measured by the Median, has increased from 37.39% in tax year 1997 to 37.78% for tax year 2003. This increase is a result of the efforts of the county boards of tax assessors to assess property at an acceptable level.
• The average level of uniformity, as measured by the Coefficient of Dispersion, has increased from
11.82% in 1997 to 12.53% for 2003, indicating that while the assessment level has increased, uniformity of assessments has not improved accordingly.
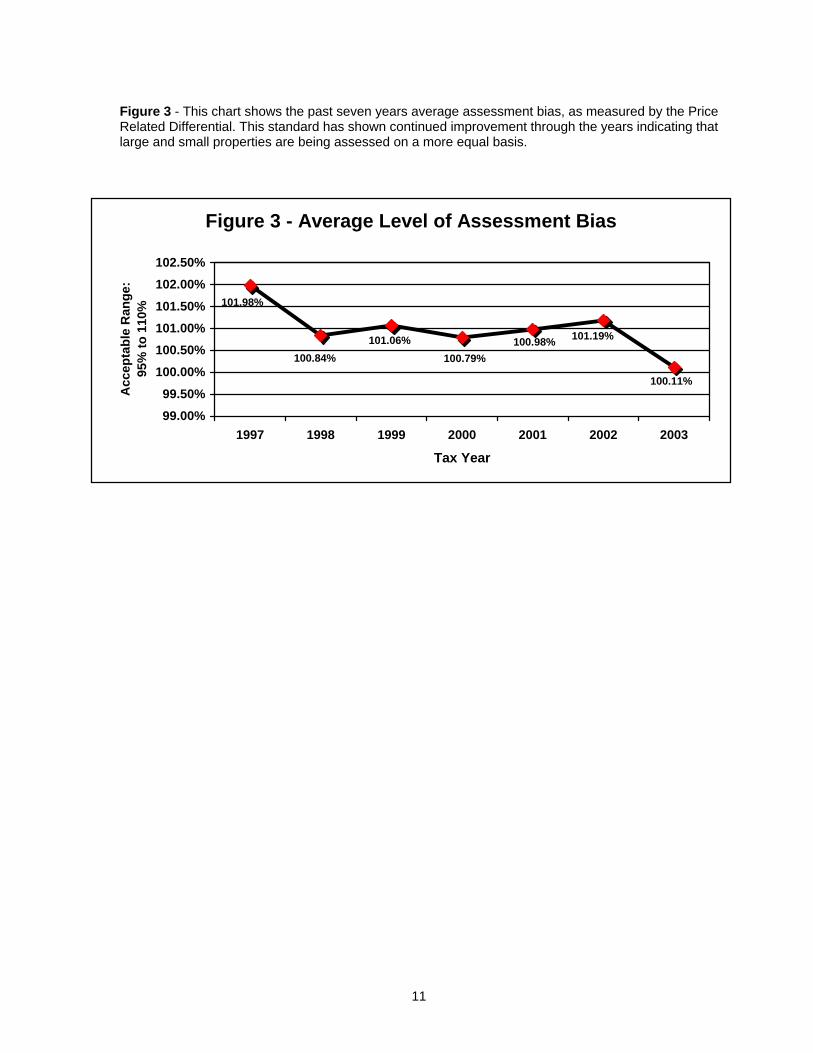
• The average level of assessment bias, as measured by the Price Related Differential, has also shown continued improvement; a measure of 100.11% in 2003, compared to 101.98% in 1997.
• Assessed values reached a high of 257.1 billion in 2003 or a 7.8% increase from the values
reported in 2002; while the 2003 average millage rate of 25.88 increased 3.5% from 2002 despite the rollback provisions of the Taxpayer Bill of Rights.
PUBLIC UTILITIES: • In past years, the Department was hindered from providing public utility values and equalization
ratios to the counties in a timely fashion, due to the public utility companies’ delay in filing timely returns, lack of staff within the Local Government Services Division, and litigation issues. In 2004 additional staffing was provided for expediting the valuation process and negotiations with the major public utility companies were realized, which avoided numerous appeals. As a result of these efforts, the Department was able to provide the public utility values to the counties in July 2004. And even though this date was earlier than in past years, the Department is continuing to perfect the process by undergoing a full review of the procedures and methodologies, securing electronic financial data to enhance the process, and working with the utility companies to overcome appeals and litigation.
6
• The statewide average equalization ratio for public utility property increased from 37.55% in 2003 to 37.90% for tax year 2004.
• Equalization ratios for 69 of the 159 counties were proposed at a ratio less than 40%. This was a decrease from the 90 counties whose proposed ratio was less than 40% in 2003, further indicating the county’s efforts of valuing property at an acceptable level. PREFERENTIAL AGRICULTURAL ASSESSMENT: Since the implementation of Preferential Agricultural Assessment in 1984, the number of parcels
in this program has risen from approximately 10,000 to approximately 18,000; the amount of value eliminated from the digests has increased from 86.9 million to 182 million; and the total tax dollars lost by the state and local governments has increased from 1.6 million to approximately 4.8 million. While this is typically thought to be a tax loss, the actual affect is that of a shift of the tax burden from taxpayers within this property class to other property class taxpayers. Even so, we are beginning to see a slight decline in this program caused by the increase in fair market values at the local level and the advantages in Conservation Use Valuation.
CONSERVATION USE VALUATION: • Since the implementation of Conservation Use Valuation in 1992, the number of parcels in this
program has risen from approximately 16,000 to more than 84,000; the amount of value eliminated from the digests has increased from 86.98 million to approximately 3.6 billion; and the total tax dollars lost by local government has increased from 8.9 million to more than 90 million. While this is typically thought to be a tax loss, the actual affect is that of a shift of the tax burden from taxpayers within this property class to other property class taxpayers.These dramatic increases are expected to continue to grow as property valuations increase.
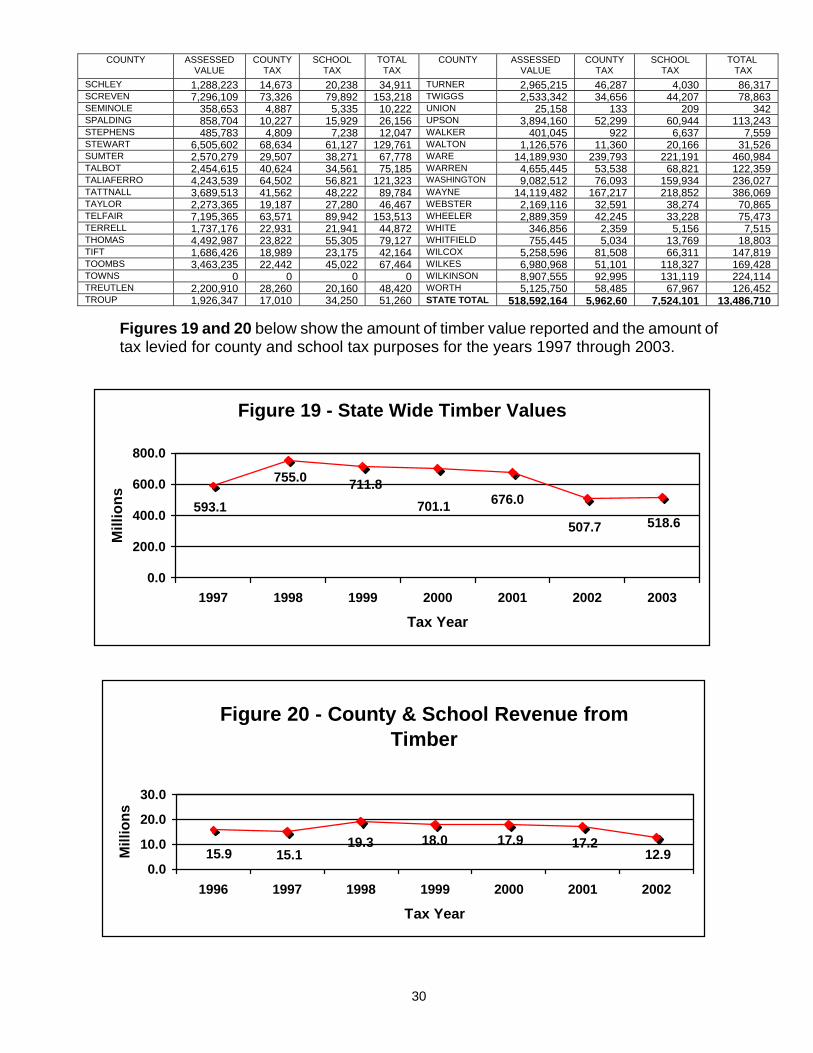
TIMBER TAXATION: • From 1992 to 1998, values reported for timber sales and harvests increased steadily, however, since 1998, values have shown a downward trend and took a sharp down turn in 2002; an indication of the depressed timber market. County and School revenues also declined from 17.2 million in 2001 to 12.9 million in 2002, a 33% decrease.
SUMMARY: • The Department desires to provide the legislature with all information necessary for the proper evaluation of legislative impact and implementation of property tax policies and fully supports the initiatives of the General Assembly in providing tax relief to the elderly, authorizing special assessment programs and exemptions for certain categories of property, homeowner tax relief grants, and increased homestead exemptions that provide financial assistance to the citizens of Georgia during these hard economic times.
7
Reporting Requirements
The Commissioner’s responsibility for continuing to provide the General Assembly with the effect of property tax administration and the continued enactment of laws created by legislation and administered by the Department of Revenue, Local Government Services Division are as follows: • O.C.G.A. Section 48-5-349.5 requires the examination of the digest of each county to ensure that all
property valuations are reasonably uniform and equalized among the counties and within the counties. This code section provides for a status report on this review process along with the Commissioner’s observations regarding the progress of the counties in ad valorem tax administration.
• O.C.G.A. Section 48-5-7.1 requires the submission of a report showing the fiscal impact of the
law providing for the preferential assessment of tangible real property devoted to agricultural use. Qualified farm property is assessed at 75% of the value under this program and this report analyzes the effect of this program on taxpayers and levying authorities.
• O.C.G.A. Section 48-5-7.4 requires a report showing the fiscal impact of the law providing for conservation use assessment of certain agricultural properties attendant with this code section. Qualified farm property is assessed at its current use value using a table of values established by the Commissioner following specific legal procedures. This report analyzes the adverse fiscal impact, if any, on other taxpayers and levying authorities.
8
Digest Review Procedures The Commissioner, through the Local Government Services Division, has been given the statutory duty of reviewing county tax digests to determine if the digests meet the criteria mandated in statute case laws and regulation for level of assessment1, uniformity2, and equalization3. Article 5A of Chapter 5 of Title 48 establishes the procedure for the Commissioner to equalize county property tax digests between and within counties and compel county boards of tax assessors to make adjustments in property valuations so as to insure uniformity and equity. As directed by the legislature, the Commissioner has adopted a three-year digest review cycle in which each county’s tax digest is reviewed extensively to determine the level of assessment, uniformity and equalization in each property class. In any given year, one third of the county tax digests are subject to extensive statistical testing. Counties, which do not meet the criteria, set forth in the statute and regulations are allowed an opportunity during the three-year cycle to correct any deficiencies by the next review year. The other counties that are not being extensively reviewed are examined for level of assessment to equalize the state levy and public utility assessments. The Commissioner approves any county’s digest as being reasonably uniform and equalized if the digest meets certain standards: For those digests submitted by counties in their digest review year, the Commissioner completes his review on or before August 1 of the following tax year or within 30 days of the date the ratio study results are provided by the State Auditor. Based upon this review, the Commissioner will approve any digest when it is found to be reasonably uniform and equalized by having met the following state established standards:
• the average level of assessment for each class of property meets the state standards of 36% to 44%;
• the average measure of overall equalization, the coefficient of dispersion4, meets the state
standard of 15% or less for residential properties and 20% or less for all other property classes; and
• the bias ratio, or statistical measure of price related differentiall5, meets the state standard of 95%
to 110%. The Commissioner conditionally approves the digest and assesses a penalty of $5.00 per taxable parcel of real property if a county’s review year digest contains the same or similar deficiencies as the previous review year digest. If the overall average assessment level does not meet state standards, the county is assessed additional state tax in the amount equal to the difference between the state's one-quarter of a mill that would have been produced if the digest had been at the proper assessment level and the amount the digest actually produces for collection purposes. 1 The comparison of an individual property’s actual sales price versus its assessed value is a measure of the level of assessment. The ratio required by state statute is 40%. 2 The measurement of quality of the results produced by a county’s valuation program will determine if properties are valued in a uniform manner. 3 Equalization is the measure of equality of assessment. In order to possess good equalization, a county tax digest should value all properties at about the same level of assessment. 4 The coefficient of dispersion is the statistical representation of equalization. 5 The price-related differential is the statistical measure of assessment bias. This demonstrates whether lower or higher priced properties are more accurately assessed.
D I G E S T
R E V I E W
P R O C E D U R E S
9
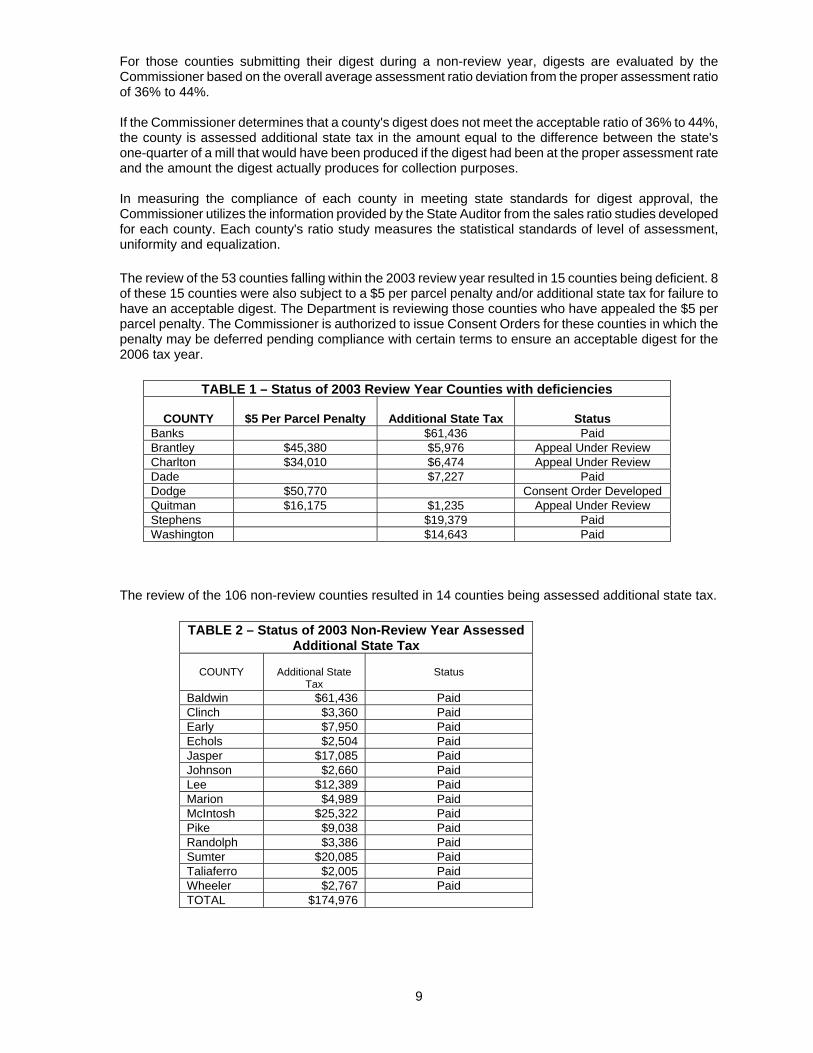
For those counties submitting their digest during a non-review year, digests are evaluated by the Commissioner based on the overall average assessment ratio deviation from the proper assessment ratio of 36% to 44%. If the Commissioner determines that a county's digest does not meet the acceptable ratio of 36% to 44%, the county is assessed additional state tax in the amount equal to the difference between the state's one-quarter of a mill that would have been produced if the digest had been at the proper assessment rate and the amount the digest actually produces for collection purposes. In measuring the compliance of each county in meeting state standards for digest approval, the Commissioner utilizes the information provided by the State Auditor from the sales ratio studies developed for each county. Each county's ratio study measures the statistical standards of level of assessment, uniformity and equalization. The review of the 53 counties falling within the 2003 review year resulted in 15 counties being deficient. 8 of these 15 counties were also subject to a $5 per parcel penalty and/or additional state tax for failure to have an acceptable digest. The Department is reviewing those counties who have appealed the $5 per parcel penalty. The Commissioner is authorized to issue Consent Orders for these counties in which the penalty may be deferred pending compliance with certain terms to ensure an acceptable digest for the 2006 tax year.
TABLE 1 – Status of 2003 Review Year Counties with deficiencies
COUNTY
$5 Per Parcel Penalty
Additional State Tax
Status Banks $61,436 Paid Brantley $45,380 $5,976 Appeal Under Review Charlton $34,010 $6,474 Appeal Under Review Dade $7,227 Paid Dodge $50,770 Consent Order Developed Quitman $16,175 $1,235 Appeal Under Review Stephens $19,379 Paid Washington $14,643 Paid
The review of the 106 non-review counties resulted in 14 counties being assessed additional state tax.
TABLE 2 – Status of 2003 Non-Review Year Assessed Additional State Tax
COUNTY
Additional State
Tax
Status
Baldwin $61,436 Paid Clinch $3,360 Paid Early $7,950 Paid Echols $2,504 Paid Jasper $17,085 Paid Johnson $2,660 Paid Lee $12,389 Paid Marion $4,989 Paid McIntosh $25,322 Paid Pike $9,038 Paid Randolph $3,386 Paid Sumter $20,085 Paid Taliaferro $2,005 Paid Wheeler $2,767 Paid TOTAL $174,976

10
Several graphs are being included to provide a visual indication of the various measurable statistical standards since 1997: • Figure 1 - This graph shows the steady increase in the average Median Ratio since tax year 2000.
Georgia law requires taxes to be assessed at 40% of the fair market value of the property; therefore, the median ratio for 2003 is a measure of the effectiveness of the county’s valuation efforts.
• Figure 2 – This graph shows the average level of uniformity, as measured by the Coefficient of Dispersion, and indicates the equality of assessments between individual properties. Case law indicates that this is the most important measure of fairness within a taxing jurisdiction. The increase in the 2003 indicates that assessments are not quite as uniform as past years.
Figure 1 - Average Level of Assessment
37.78%
37.42%
36.99%36.68%
37.33%
36.95%
37.39%
36.00%36.20%36.40%36.60%36.80%37.00%37.20%37.40%37.60%37.80%38.00%
1997 1998 1999 2000 2001 2002 2003
Tax Year
Acc
epta
ble
Ran
ge:
36%
to 4
4%
Figure 2 - Average Level of Uniformity
12.53%
12.02%
11.71%
12.52%
11.49%
12.12%11.82%
0.11
0.11
0.12
0.12
0.13
0.13
1997 1998 1999 2000 2001 2002 2003
Tax Year
Acc
epta
ble
Ran
ge:
15%
or L
ess
11
Figure 3 - This chart shows the past seven years average assessment bias, as measured by the Price Related Differential. This standard has shown continued improvement through the years indicating that large and small properties are being assessed on a more equal basis.
Figure 3 - Average Level of Assessment Bias
101.98%
100.84%101.06%
100.79%100.98% 101.19%
100.11%
99.00%
99.50%
100.00%
100.50%
101.00%
101.50%
102.00%
102.50%
1997 1998 1999 2000 2001 2002 2003
Tax Year
Acc
epta
ble
Ran
ge:
95%
to 1
10%
12
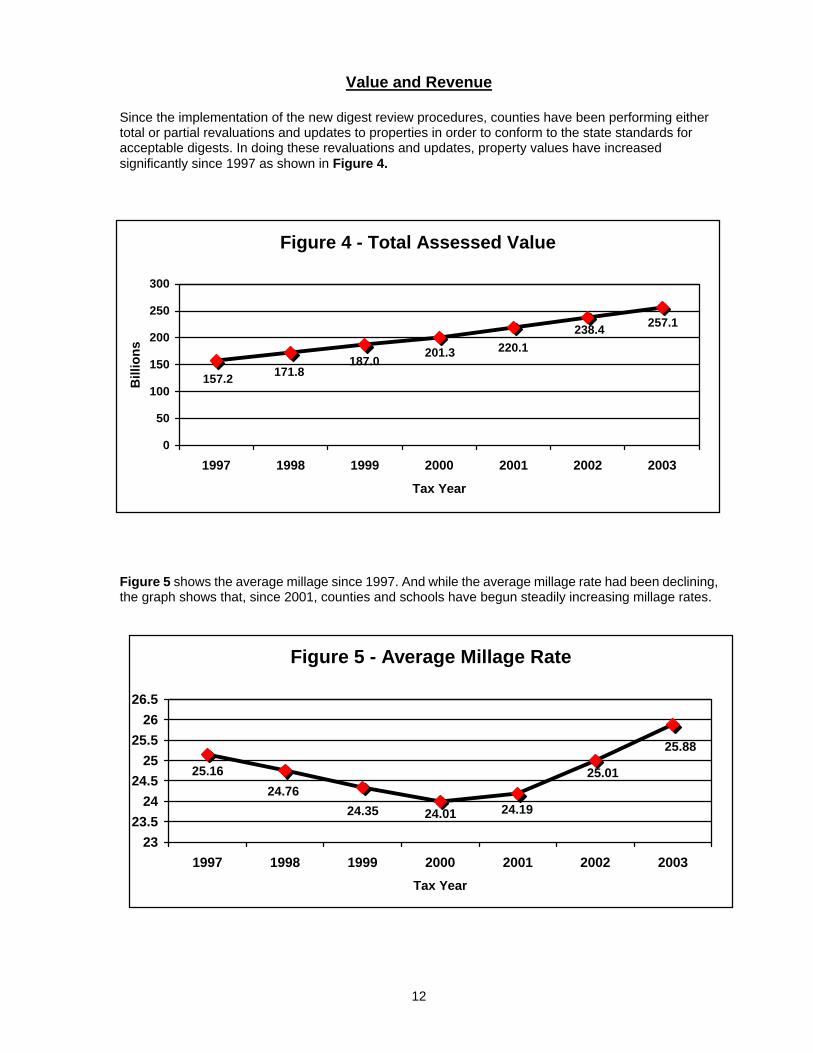
Value and Revenue
Since the implementation of the new digest review procedures, counties have been performing either total or partial revaluations and updates to properties in order to conform to the state standards for acceptable digests. In doing these revaluations and updates, property values have increased significantly since 1997 as shown in Figure 4.
Figure 5 shows the average millage since 1997. And while the average millage rate had been declining, the graph shows that, since 2001, counties and schools have begun steadily increasing millage rates.
Figure 4 - Total Assessed Value
257.1238.4220.1201.3
187.0171.8157.2
0
50
100
150
200
250
300
1997 1998 1999 2000 2001 2002 2003
Tax Year
Bill
ions
Figure 5 - Average Millage Rate
25.88
25.01
24.1924.0124.3524.76
25.16
2323.5
2424.5
2525.5
2626.5
1997 1998 1999 2000 2001 2002 2003Tax Year
13
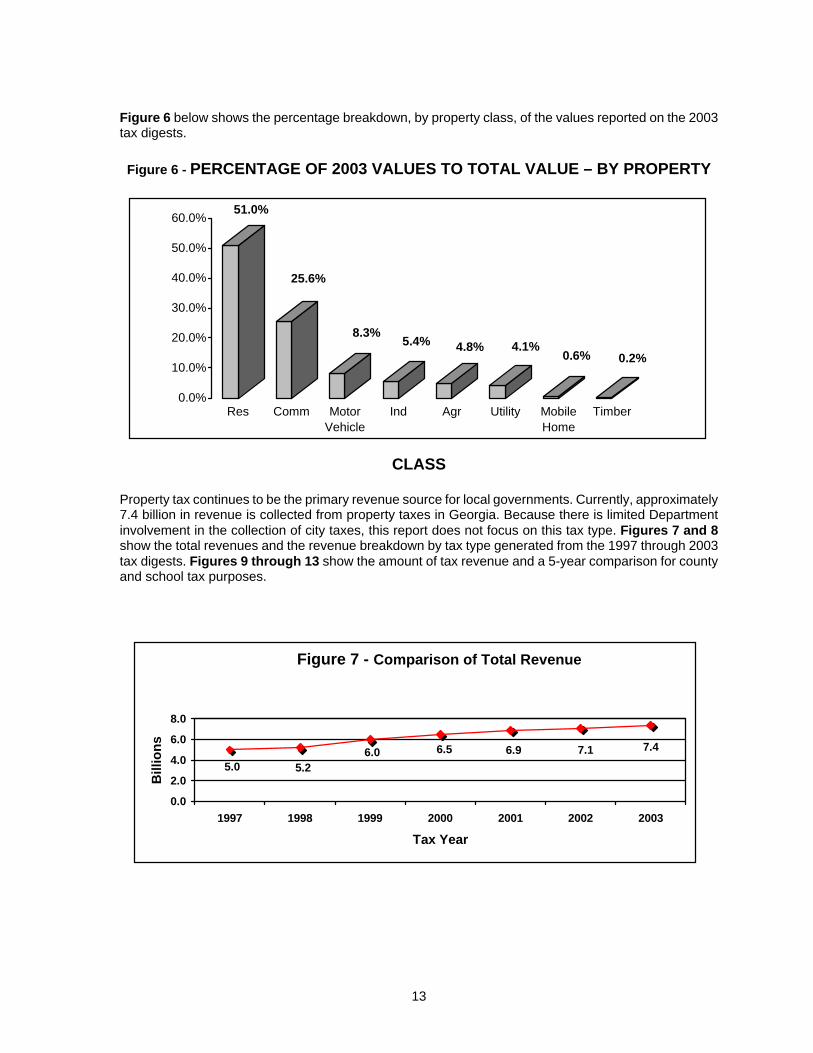
Figure 6 below shows the percentage breakdown, by property class, of the values reported on the 2003 tax digests. Figure 6 - PERCENTAGE OF 2003 VALUES TO TOTAL VALUE – BY PROPERTY
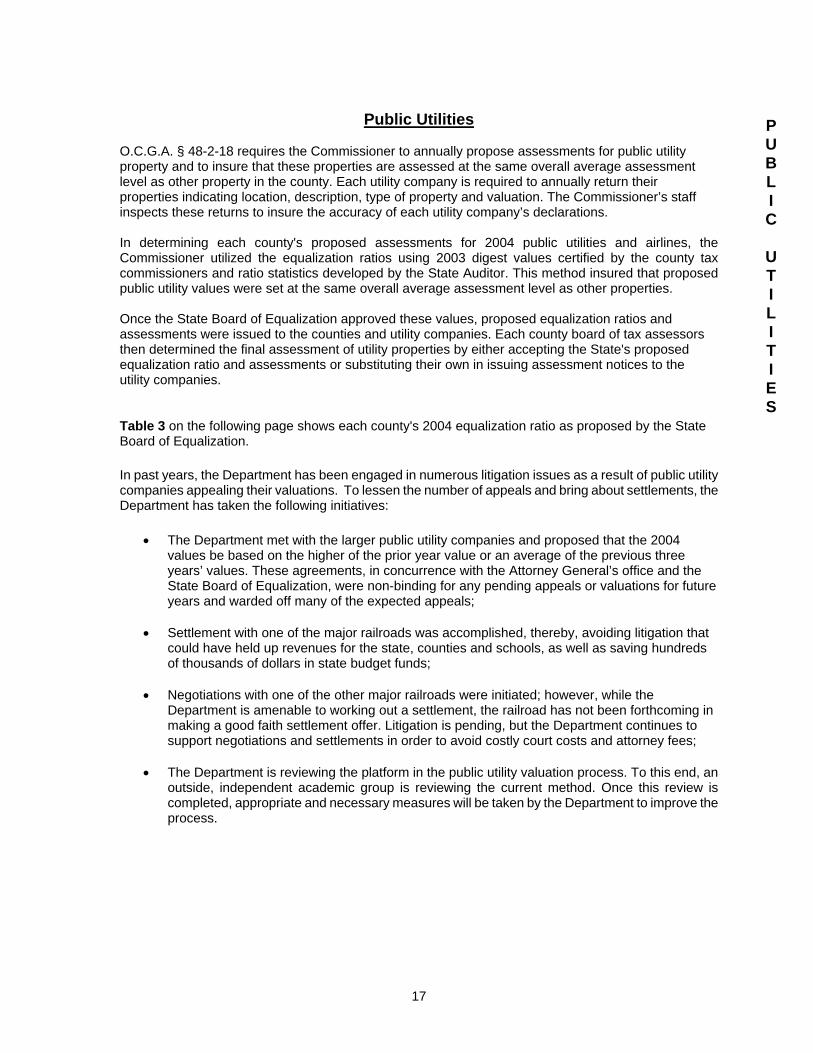
CLASS Property tax continues to be the primary revenue source for local governments. Currently, approximately 7.4 billion in revenue is collected from property taxes in Georgia. Because there is limited Department involvement in the collection of city taxes, this report does not focus on this tax type. Figures 7 and 8 show the total revenues and the revenue breakdown by tax type generated from the 1997 through 2003 tax digests. Figures 9 through 13 show the amount of tax revenue and a 5-year comparison for county and school tax purposes.
Figure 7 - Comparison of Total Revenue
7.47.16.96.56.05.25.0
0.0
2.0
4.0
6.0
8.0
1997 1998 1999 2000 2001 2002 2003
Tax Year
Bill
ions
51.0%
25.6%
8.3%5.4% 4.8% 4.1%
0.6% 0.2%
0.0%
10.0%
20.0%
30.0%
40.0%
50.0%
60.0%
Res Comm MotorVehicle
Ind Agr Utility MobileHome
Timber

14
Figure 8 - 2003 Percentage of Total Revenue By Tax Type - In Billions
State - .8%
County - 37.1%
School - 62.1%
Figure 9 2003 County Tax Revenue By Property Class - Millions
Agricultural 92.9
Residential 1,338.9
Motor Vehicle 232.6 Mobile Homes 14.7
Public Utility 108.3
Industrial 215.9
Commercial 742.8
Timber 6.9
15
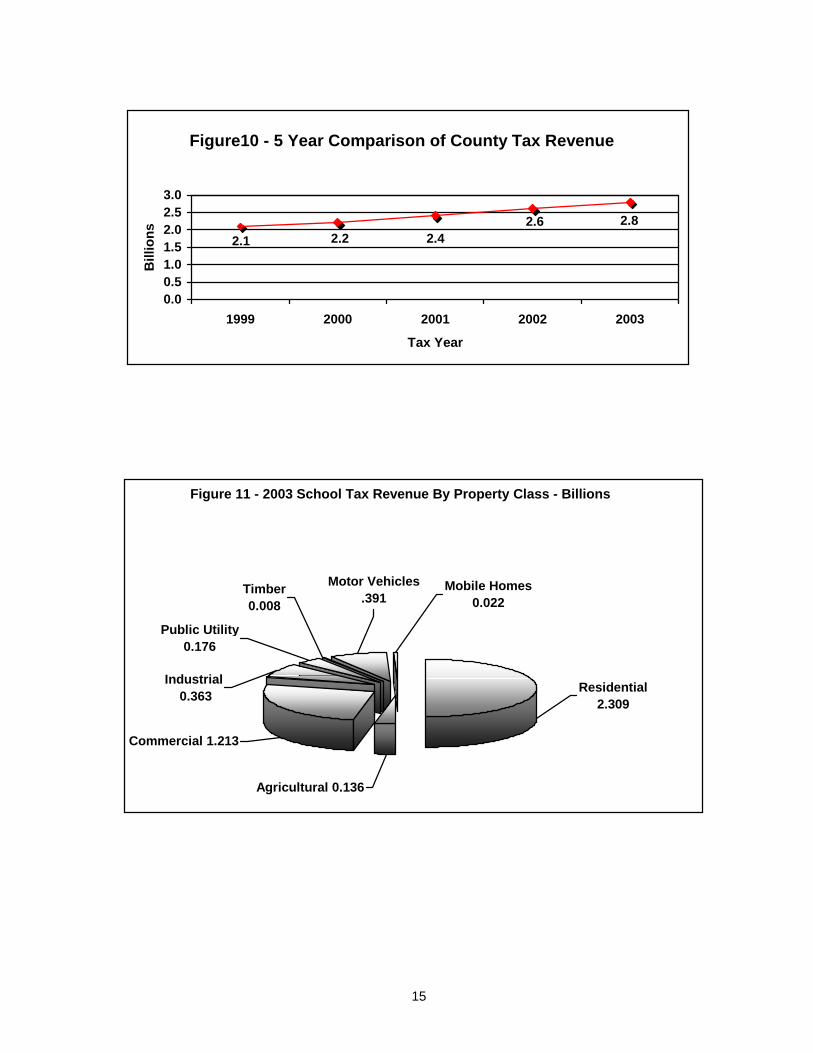
Figure 11 - 2003 School Tax Revenue By Property Class - Billions
Industrial 0.363 Residential
2.309
Agricultural 0.136
Commercial 1.213
Mobile Homes 0.022
Motor Vehicles .391
Timber0.008
Public Utility 0.176
Figure10 - 5 Year Comparison of County Tax Revenue
2.82.62.42.22.1
0.00.51.01.52.02.53.0
1999 2000 2001 2002 2003
Tax Year
Bill
ions
16
Figure 13 - 2003 State Tax Revenue By Property Class Millions
Public Utility 2.61
Timber 0.14
Motor Vehicles5.38
Mobile Homes0.35
Commercial 15.83
Agricultural 2.24
Residential 34.23
Industrial5.00
Figure12 - 5 Year Comparison of School Tax Revenue
4.64.43.93.73.4
0.01.02.03.04.05.0
1999 2000 2001 2002 2003
Tax Year
Bill
ions
17
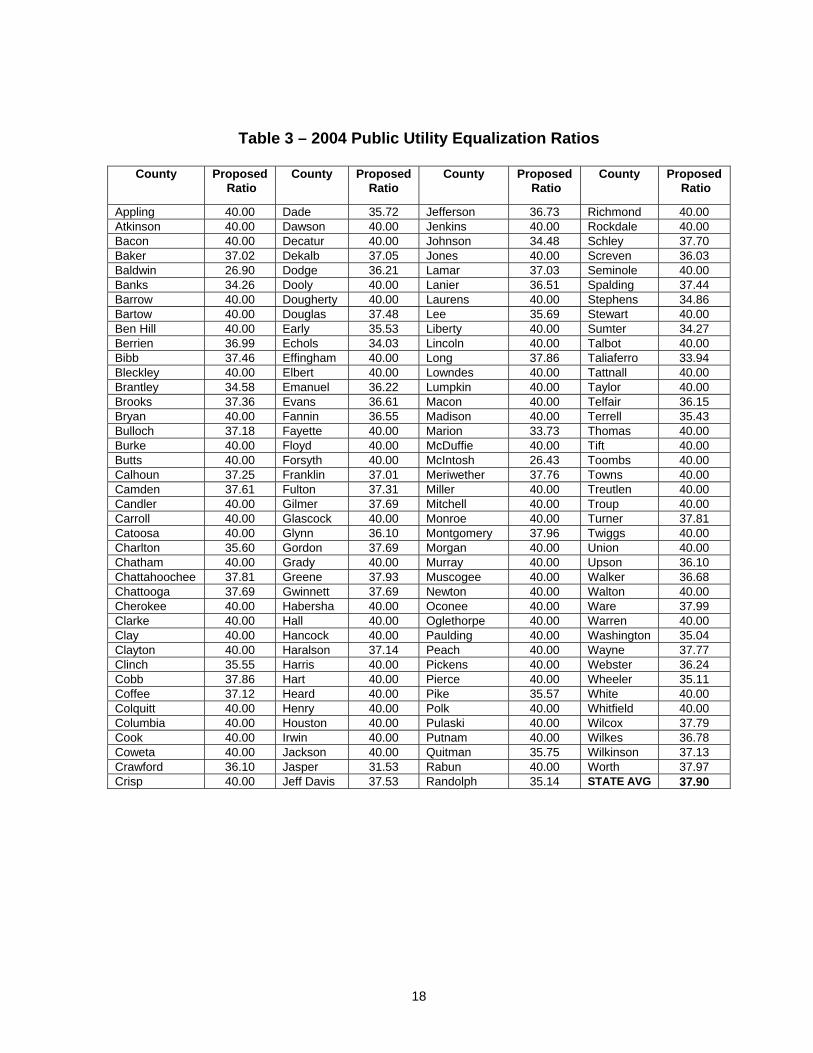
Public Utilities O.C.G.A. § 48-2-18 requires the Commissioner to annually propose assessments for public utility property and to insure that these properties are assessed at the same overall average assessment level as other property in the county. Each utility company is required to annually return their properties indicating location, description, type of property and valuation. The Commissioner’s staff inspects these returns to insure the accuracy of each utility company’s declarations. In determining each county's proposed assessments for 2004 public utilities and airlines, the Commissioner utilized the equalization ratios using 2003 digest values certified by the county tax commissioners and ratio statistics developed by the State Auditor. This method insured that proposed public utility values were set at the same overall average assessment level as other properties. Once the State Board of Equalization approved these values, proposed equalization ratios and assessments were issued to the counties and utility companies. Each county board of tax assessors then determined the final assessment of utility properties by either accepting the State's proposed equalization ratio and assessments or substituting their own in issuing assessment notices to the utility companies. Table 3 on the following page shows each county's 2004 equalization ratio as proposed by the State Board of Equalization. In past years, the Department has been engaged in numerous litigation issues as a result of public utility companies appealing their valuations. To lessen the number of appeals and bring about settlements, the Department has taken the following initiatives:
• The Department met with the larger public utility companies and proposed that the 2004 values be based on the higher of the prior year value or an average of the previous three years’ values. These agreements, in concurrence with the Attorney General’s office and the State Board of Equalization, were non-binding for any pending appeals or valuations for future years and warded off many of the expected appeals;
• Settlement with one of the major railroads was accomplished, thereby, avoiding litigation that could have held up revenues for the state, counties and schools, as well as saving hundreds of thousands of dollars in state budget funds;
• Negotiations with one of the other major railroads were initiated; however, while the Department is amenable to working out a settlement, the railroad has not been forthcoming in making a good faith settlement offer. Litigation is pending, but the Department continues to support negotiations and settlements in order to avoid costly court costs and attorney fees;
• The Department is reviewing the platform in the public utility valuation process. To this end, an outside, independent academic group is reviewing the current method. Once this review is completed, appropriate and necessary measures will be taken by the Department to improve the process.
P U B L I C
U T I L I T I E S
18
Table 3 – 2004 Public Utility Equalization Ratios
County Proposed Ratio
County Proposed Ratio
County Proposed Ratio
County Proposed Ratio
Appling 40.00 Dade 35.72 Jefferson 36.73 Richmond 40.00 Atkinson 40.00 Dawson 40.00 Jenkins 40.00 Rockdale 40.00 Bacon 40.00 Decatur 40.00 Johnson 34.48 Schley 37.70 Baker 37.02 Dekalb 37.05 Jones 40.00 Screven 36.03 Baldwin 26.90 Dodge 36.21 Lamar 37.03 Seminole 40.00 Banks 34.26 Dooly 40.00 Lanier 36.51 Spalding 37.44 Barrow 40.00 Dougherty 40.00 Laurens 40.00 Stephens 34.86 Bartow 40.00 Douglas 37.48 Lee 35.69 Stewart 40.00 Ben Hill 40.00 Early 35.53 Liberty 40.00 Sumter 34.27 Berrien 36.99 Echols 34.03 Lincoln 40.00 Talbot 40.00 Bibb 37.46 Effingham 40.00 Long 37.86 Taliaferro 33.94 Bleckley 40.00 Elbert 40.00 Lowndes 40.00 Tattnall 40.00 Brantley 34.58 Emanuel 36.22 Lumpkin 40.00 Taylor 40.00 Brooks 37.36 Evans 36.61 Macon 40.00 Telfair 36.15 Bryan 40.00 Fannin 36.55 Madison 40.00 Terrell 35.43 Bulloch 37.18 Fayette 40.00 Marion 33.73 Thomas 40.00 Burke 40.00 Floyd 40.00 McDuffie 40.00 Tift 40.00 Butts 40.00 Forsyth 40.00 McIntosh 26.43 Toombs 40.00 Calhoun 37.25 Franklin 37.01 Meriwether 37.76 Towns 40.00 Camden 37.61 Fulton 37.31 Miller 40.00 Treutlen 40.00 Candler 40.00 Gilmer 37.69 Mitchell 40.00 Troup 40.00 Carroll 40.00 Glascock 40.00 Monroe 40.00 Turner 37.81 Catoosa 40.00 Glynn 36.10 Montgomery 37.96 Twiggs 40.00 Charlton 35.60 Gordon 37.69 Morgan 40.00 Union 40.00 Chatham 40.00 Grady 40.00 Murray 40.00 Upson 36.10 Chattahoochee 37.81 Greene 37.93 Muscogee 40.00 Walker 36.68 Chattooga 37.69 Gwinnett 37.69 Newton 40.00 Walton 40.00 Cherokee 40.00 Habersha 40.00 Oconee 40.00 Ware 37.99 Clarke 40.00 Hall 40.00 Oglethorpe 40.00 Warren 40.00 Clay 40.00 Hancock 40.00 Paulding 40.00 Washington 35.04 Clayton 40.00 Haralson 37.14 Peach 40.00 Wayne 37.77 Clinch 35.55 Harris 40.00 Pickens 40.00 Webster 36.24 Cobb 37.86 Hart 40.00 Pierce 40.00 Wheeler 35.11 Coffee 37.12 Heard 40.00 Pike 35.57 White 40.00 Colquitt 40.00 Henry 40.00 Polk 40.00 Whitfield 40.00 Columbia 40.00 Houston 40.00 Pulaski 40.00 Wilcox 37.79 Cook 40.00 Irwin 40.00 Putnam 40.00 Wilkes 36.78 Coweta 40.00 Jackson 40.00 Quitman 35.75 Wilkinson 37.13 Crawford 36.10 Jasper 31.53 Rabun 40.00 Worth 37.97 Crisp 40.00 Jeff Davis 37.53 Randolph 35.14 STATE AVG 37.90
19
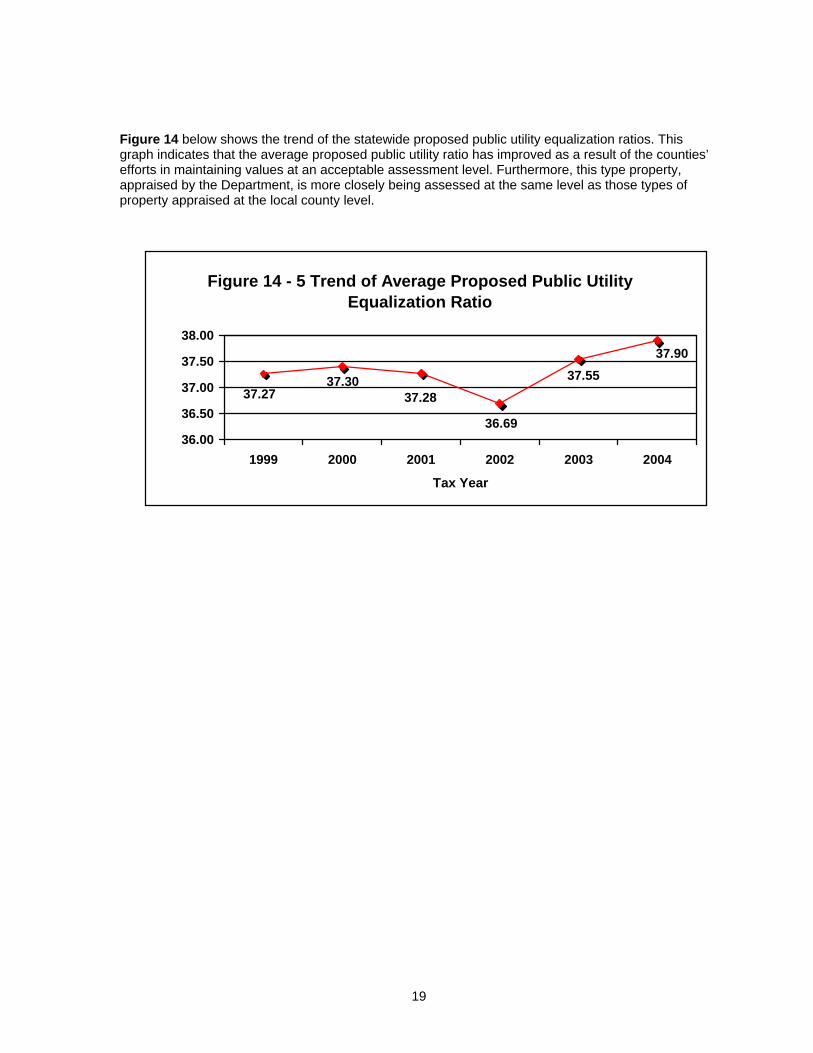
Figure 14 below shows the trend of the statewide proposed public utility equalization ratios. This graph indicates that the average proposed public utility ratio has improved as a result of the counties’ efforts in maintaining values at an acceptable assessment level. Furthermore, this type property, appraised by the Department, is more closely being assessed at the same level as those types of property appraised at the local county level.
Figure 14 - 5 Trend of Average Proposed Public Utility Equalization Ratio
37.9037.55
36.69
37.2837.30
37.27
36.00
36.50
37.00
37.50
38.00
1999 2000 2001 2002 2003 2004
Tax Year
20
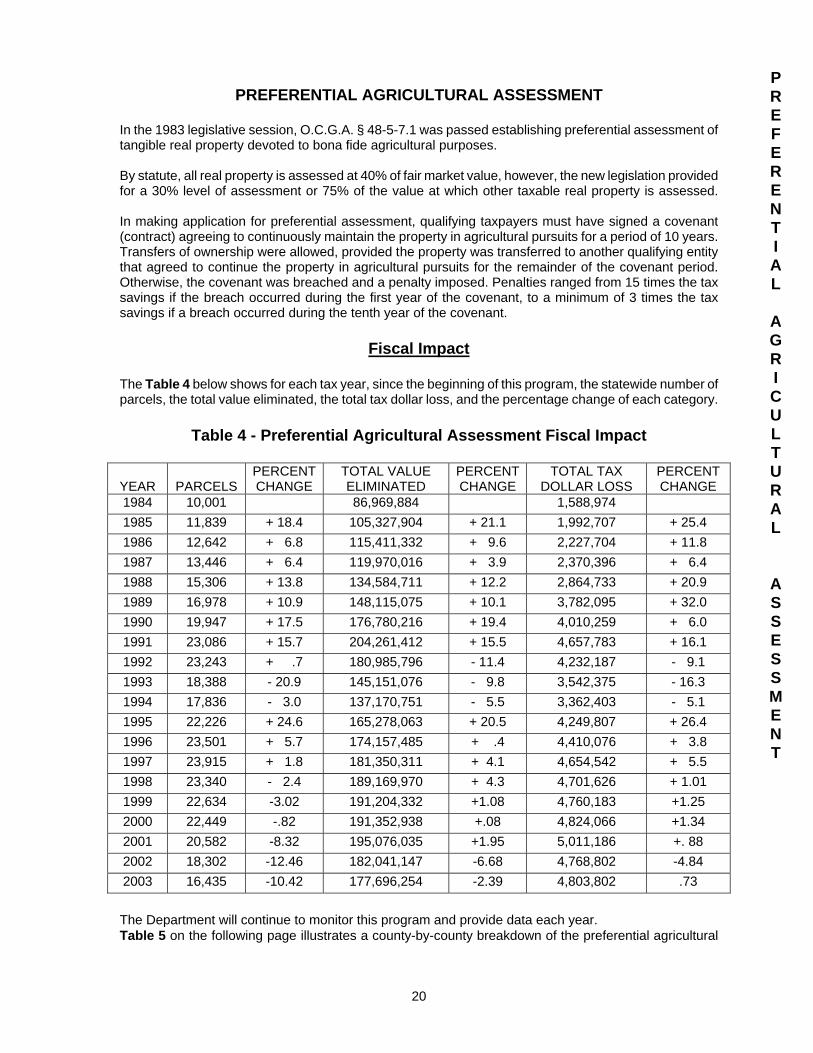
PREFERENTIAL AGRICULTURAL ASSESSMENT In the 1983 legislative session, O.C.G.A. § 48-5-7.1 was passed establishing preferential assessment of tangible real property devoted to bona fide agricultural purposes. By statute, all real property is assessed at 40% of fair market value, however, the new legislation provided for a 30% level of assessment or 75% of the value at which other taxable real property is assessed. In making application for preferential assessment, qualifying taxpayers must have signed a covenant (contract) agreeing to continuously maintain the property in agricultural pursuits for a period of 10 years. Transfers of ownership were allowed, provided the property was transferred to another qualifying entity that agreed to continue the property in agricultural pursuits for the remainder of the covenant period. Otherwise, the covenant was breached and a penalty imposed. Penalties ranged from 15 times the tax savings if the breach occurred during the first year of the covenant, to a minimum of 3 times the tax savings if a breach occurred during the tenth year of the covenant.
Fiscal Impact The Table 4 below shows for each tax year, since the beginning of this program, the statewide number of parcels, the total value eliminated, the total tax dollar loss, and the percentage change of each category.
Table 4 - Preferential Agricultural Assessment Fiscal Impact
YEAR
PARCELS
PERCENT CHANGE
TOTAL VALUE ELIMINATED
PERCENTCHANGE
TOTAL TAX DOLLAR LOSS
PERCENT CHANGE
1984 10,001 86,969,884 1,588,974 1985 11,839 + 18.4 105,327,904 + 21.1 1,992,707 + 25.4 1986 12,642 + 6.8 115,411,332 + 9.6 2,227,704 + 11.8 1987 13,446 + 6.4 119,970,016 + 3.9 2,370,396 + 6.4 1988 15,306 + 13.8 134,584,711 + 12.2 2,864,733 + 20.9 1989 16,978 + 10.9 148,115,075 + 10.1 3,782,095 + 32.0 1990 19,947 + 17.5 176,780,216 + 19.4 4,010,259 + 6.0 1991 23,086 + 15.7 204,261,412 + 15.5 4,657,783 + 16.1 1992 23,243 + .7 180,985,796 - 11.4 4,232,187 - 9.1 1993 18,388 - 20.9 145,151,076 - 9.8 3,542,375 - 16.3 1994 17,836 - 3.0 137,170,751 - 5.5 3,362,403 - 5.1 1995 22,226 + 24.6 165,278,063 + 20.5 4,249,807 + 26.4 1996 23,501 + 5.7 174,157,485 + .4 4,410,076 + 3.8 1997 23,915 + 1.8 181,350,311 + 4.1 4,654,542 + 5.5 1998 23,340 - 2.4 189,169,970 + 4.3 4,701,626 + 1.01 1999 22,634 -3.02 191,204,332 +1.08 4,760,183 +1.25 2000 22,449 -.82 191,352,938 +.08 4,824,066 +1.34 2001 20,582 -8.32 195,076,035 +1.95 5,011,186 +. 88 2002 18,302 -12.46 182,041,147 -6.68 4,768,802 -4.84 2003 16,435 -10.42 177,696,254 -2.39 4,803,802 .73
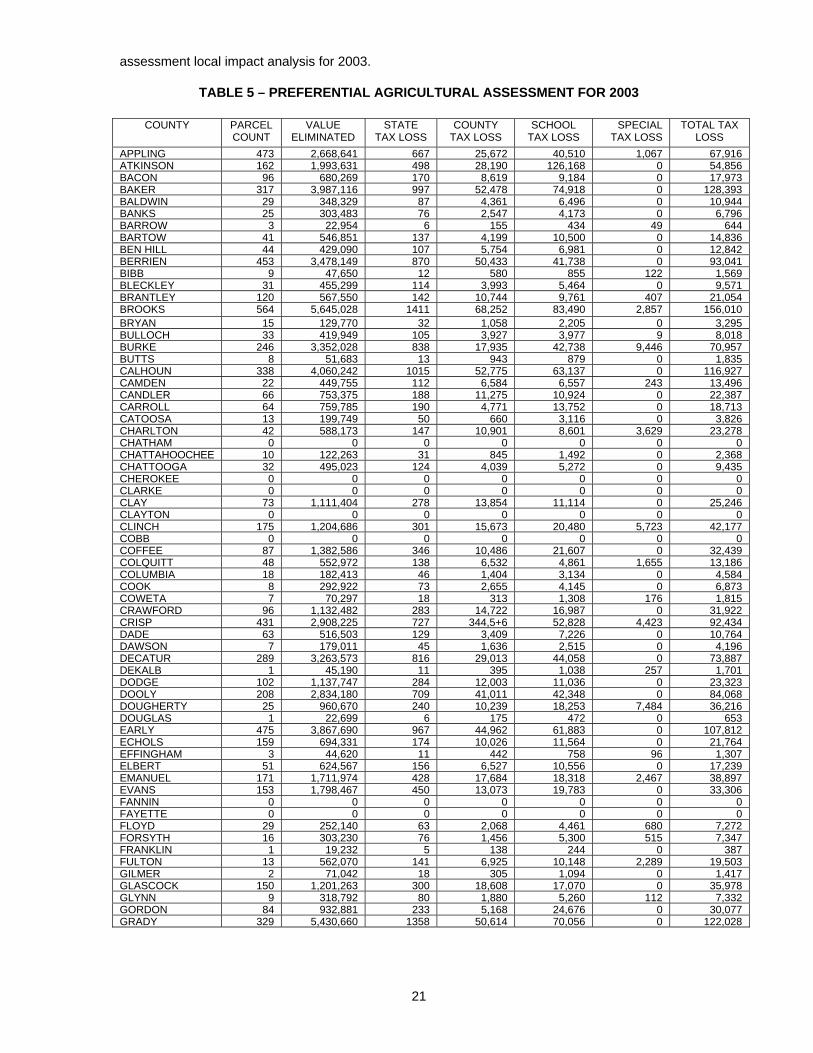
The Department will continue to monitor this program and provide data each year. Table 5 on the following page illustrates a county-by-county breakdown of the preferential agricultural
PREF ERENT I AL
AGR I C ULTURAL
ASSESSMENT
21
assessment local impact analysis for 2003.
TABLE 5 – PREFERENTIAL AGRICULTURAL ASSESSMENT FOR 2003
COUNTY PARCEL COUNT
VALUE ELIMINATED
STATE TAX LOSS
COUNTY TAX LOSS
SCHOOL TAX LOSS
SPECIAL TAX LOSS
TOTAL TAX LOSS
APPLING 473 2,668,641 667 25,672 40,510 1,067 67,916ATKINSON 162 1,993,631 498 28,190 126,168 0 54,856BACON 96 680,269 170 8,619 9,184 0 17,973BAKER 317 3,987,116 997 52,478 74,918 0 128,393BALDWIN 29 348,329 87 4,361 6,496 0 10,944BANKS 25 303,483 76 2,547 4,173 0 6,796BARROW 3 22,954 6 155 434 49 644BARTOW 41 546,851 137 4,199 10,500 0 14,836BEN HILL 44 429,090 107 5,754 6,981 0 12,842BERRIEN 453 3,478,149 870 50,433 41,738 0 93,041BIBB 9 47,650 12 580 855 122 1,569BLECKLEY 31 455,299 114 3,993 5,464 0 9,571BRANTLEY 120 567,550 142 10,744 9,761 407 21,054BROOKS 564 5,645,028 1411 68,252 83,490 2,857 156,010 BRYAN 15 129,770 32 1,058 2,205 0 3,295BULLOCH 33 419,949 105 3,927 3,977 9 8,018BURKE 246 3,352,028 838 17,935 42,738 9,446 70,957BUTTS 8 51,683 13 943 879 0 1,835CALHOUN 338 4,060,242 1015 52,775 63,137 0 116,927CAMDEN 22 449,755 112 6,584 6,557 243 13,496CANDLER 66 753,375 188 11,275 10,924 0 22,387CARROLL 64 759,785 190 4,771 13,752 0 18,713CATOOSA 13 199,749 50 660 3,116 0 3,826CHARLTON 42 588,173 147 10,901 8,601 3,629 23,278CHATHAM 0 0 0 0 0 0 0CHATTAHOOCHEE 10 122,263 31 845 1,492 0 2,368CHATTOOGA 32 495,023 124 4,039 5,272 0 9,435CHEROKEE 0 0 0 0 0 0 0CLARKE 0 0 0 0 0 0 0CLAY 73 1,111,404 278 13,854 11,114 0 25,246CLAYTON 0 0 0 0 0 0 0CLINCH 175 1,204,686 301 15,673 20,480 5,723 42,177COBB 0 0 0 0 0 0 0COFFEE 87 1,382,586 346 10,486 21,607 0 32,439COLQUITT 48 552,972 138 6,532 4,861 1,655 13,186COLUMBIA 18 182,413 46 1,404 3,134 0 4,584COOK 8 292,922 73 2,655 4,145 0 6,873COWETA 7 70,297 18 313 1,308 176 1,815CRAWFORD 96 1,132,482 283 14,722 16,987 0 31,922CRISP 431 2,908,225 727 344,5+6 52,828 4,423 92,434DADE 63 516,503 129 3,409 7,226 0 10,764DAWSON 7 179,011 45 1,636 2,515 0 4,196DECATUR 289 3,263,573 816 29,013 44,058 0 73,887DEKALB 1 45,190 11 395 1,038 257 1,701DODGE 102 1,137,747 284 12,003 11,036 0 23,323DOOLY 208 2,834,180 709 41,011 42,348 0 84,068DOUGHERTY 25 960,670 240 10,239 18,253 7,484 36,216DOUGLAS 1 22,699 6 175 472 0 653EARLY 475 3,867,690 967 44,962 61,883 0 107,812ECHOLS 159 694,331 174 10,026 11,564 0 21,764EFFINGHAM 3 44,620 11 442 758 96 1,307ELBERT 51 624,567 156 6,527 10,556 0 17,239EMANUEL 171 1,711,974 428 17,684 18,318 2,467 38,897EVANS 153 1,798,467 450 13,073 19,783 0 33,306FANNIN 0 0 0 0 0 0 0FAYETTE 0 0 0 0 0 0 0FLOYD 29 252,140 63 2,068 4,461 680 7,272FORSYTH 16 303,230 76 1,456 5,300 515 7,347FRANKLIN 1 19,232 5 138 244 0 387FULTON 13 562,070 141 6,925 10,148 2,289 19,503GILMER 2 71,042 18 305 1,094 0 1,417GLASCOCK 150 1,201,263 300 18,608 17,070 0 35,978GLYNN 9 318,792 80 1,880 5,260 112 7,332GORDON 84 932,881 233 5,168 24,676 0 30,077GRADY 329 5,430,660 1358 50,614 70,056 0 122,028

22
COUNTY
PARCEL COUNT
VALUE ELIMINATED
STATE TAX LOSS
COUNTY TAX LOSS
SCHOOL TAX LOSS
SPECIAL TAX LOSS
TOTAL TAX LOSS
GREENE 29 1,094,745 274 8,569 12,042 0 20,885GWINNETT 0 0 0 0 0 0 0HABERSHAM 54 1,027,470 257 9,264 12,843 616 22,980HALL 0 0 0 0 0 0 0HANCOCK 342 4,408,010 1102 109,010 56,334 0 166,446HARALSON 49 858,883 215 8,955 10,994 0 20,164HARRIS 80 978,620 245 7,731 16,206 0 24,182HART 17 341,071 85 1,675 4,567 0 6,327HEARD 37 662,797 166 5,256 8,895 0 14,317HENRY 4 79,830 20 897 1,753 240 2,910HOUSTON 24 860,380 215 8,010 11,761 0 19,986IRWIN 468 4,657,258 1,164 60,032 77,730 4,424 143,350JACKSON 31 493,724 123 4,319 9,134 1,110 14,686JASPER 33 981,084 245 17,135 19,318 0 36,698JEFF DAVIS 79 1,167,859 292 9,510 14,890 0 24,692JEFFERSON 67 1,254,567 314 15,920 17,413 0 33,647JENKINS 279 1,651,580 413 30,507 22,875 0 53,795JOHNSON 22 231,960 58 3,556 2,726 0 6,340JONES 10 106,919 27 1,153 1,554 0 2,734LAMAR 17 242,249 61 2,178 3,924 0 6,163LANIER 163 1,170,702 293 17,244 20,089 0 37,626LAURENS 137 1,340,557 335 8,978 17,474 0 26,787LEE 63 1,804,538 451 25,174 28,945 0 54,570LIBERTY 38 528,700 132 7,727 8,459 2,114 18,432LINCOLN 13 257,911 64 2,298 3,095 286 5,743LONG 88 968,609 242 17,086 15,207 0 32,535LOWNDES 0 0 0 0 0 0 0LUMPKIN 1 2,078 1 15 28 0 44MACON 149 3,035,865 759 35,920 51,670 0 88,349MADISON 147 1,968,723 492 19,757 32,917 1,969 55,135MARION 181 1,462,445 366 11,656 21,571 0 33,593MCDUFFIE 55 1,189,432 297 9,278 18,198 0 27,773MCINTOSH 21 93,345 23 1,201 1,418 70 2,712MERIWETHER 82 768,899 192 6,666 12,538 0 19,396MILLER 66 1,278,869 320 13,821 18,236 0 32,377MITCHELL 112 1,921,598 480 31,905 20,736 0 53,121MONROE 12 248,746 62 2,264 3,060 0 5,386MONTGOMERY 118 890,202 223 9,111 12,328 0 21,662MORGAN 12 287,326 72 2,727 4,454 0 7,253MURRAY 8 85,917 21 411 1,332 0 1,764MUSCOGEE 17 146,368 37 2,121 3,421 0 5,579NEWTON 0 0 0 0 0 0 0OCONEE 1 9,219 2 78 151 0 231OGLETHORPE 154 2,503,262 626 18,589 33,797 0 53,009PAULDING 5 214,742 54 1,525 3,765 0 5,344PEACH 14 134,455 34 2,017 2,319 0 4,370PICKENS 27 322,558 81 1,919 4,803 0 6,803PIERCE 269 2,553,193 638 15,891 40,519 0 57,048PIKE 0 0 0 0 0 0 0POLK 20 190,233 48 1,764 2,573 0 4,385PULASKI 66 878,838 220 10,265 10,230 659 21,374PUTNAM 12 268,108 67 2,145 3,923 0 6,135QUITMAN 24 115,447 29 1,491 1,686 0 3,206RABUN 2 44,881 11 389 336 0 736RANDOLPH 110 857,250 214 9,834 13,845 0 23,893RICHMOND 8 63,614 16 436 1,321 134 1,907ROCKDALE 38 468,535 11 6,391 10,214 0 16,722SCHLEY 123 1,431,525 358 15,690 27,586 0 43,634SCREVEN 567 8,570,534 2,143 86,134 110,988 0 199,265SEMINOLE 206 2,772,917 693 34,911 38,380 2,121 76,105SPALDING 30 464,973 116 6,291 9,911 1,437 16,655STEPHENS 2 14,370 4 153 243 0 400STEWART 105 1,240,607 310 15,185 11,513 0 27,008SUMTER 572 5,111,770 1,278 58,683 76,114 4,008 140,083TALBOT 34 492,802 123 8,156 6,837 0 15,116TALIAFERRO 201 1,558,181 390 29,829 23,373 0 53,592TATTNALL 334 3,512,801 878 43,390 45,912 1,159 91,339TAYLOR 92 1,119,525 280 9,494 13,434 0 23,208TELFAIR 478 3,302,149 826 34,547 47,881 0 83,254TERRELL 75 808,877 202 11,648 11,834 0 23,684THOMAS 46 3,454,627 864 17,930 42,392 12,865 74,051
23
COUNTY PARCEL COUNT
VALUE ELIMINATED
STATE TAX LOSS
COUNTY TAX LOSS
SCHOOL TAX LOSS
SPECIAL TAX LOSS
TOTAL TAX LOSS
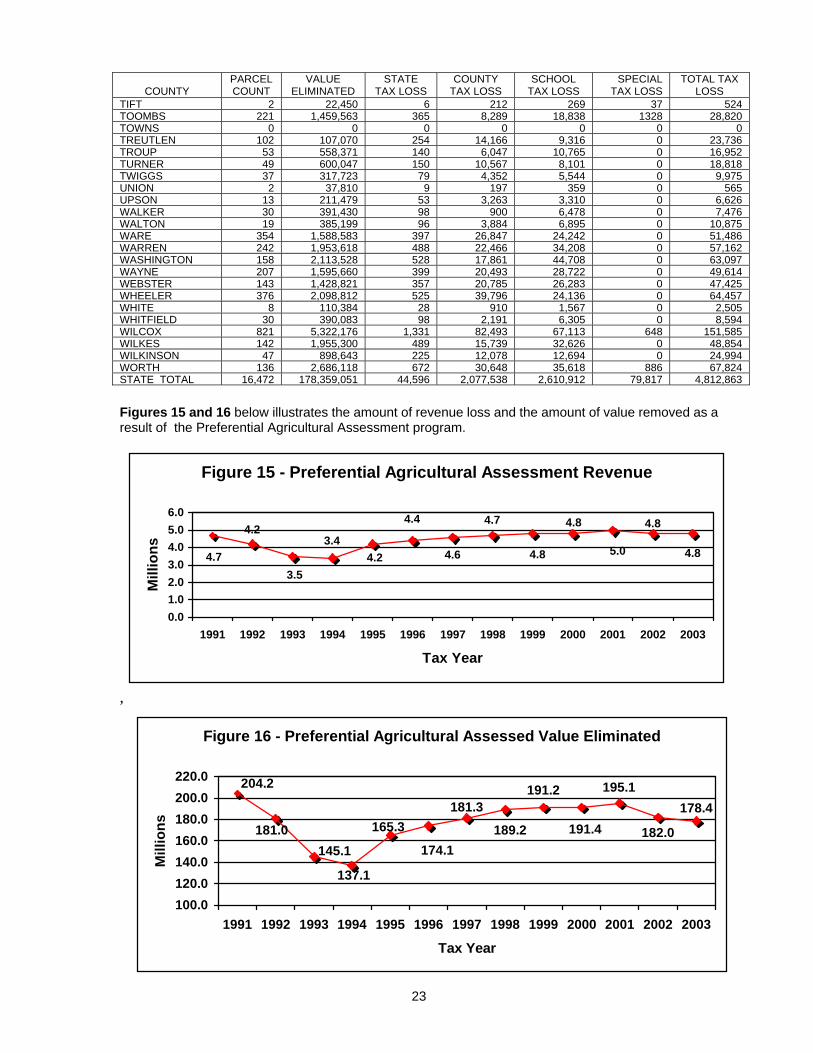
TIFT 2 22,450 6 212 269 37 524TOOMBS 221 1,459,563 365 8,289 18,838 1328 28,820TOWNS 0 0 0 0 0 0 0TREUTLEN 102 107,070 254 14,166 9,316 0 23,736TROUP 53 558,371 140 6,047 10,765 0 16,952TURNER 49 600,047 150 10,567 8,101 0 18,818TWIGGS 37 317,723 79 4,352 5,544 0 9,975UNION 2 37,810 9 197 359 0 565UPSON 13 211,479 53 3,263 3,310 0 6,626WALKER 30 391,430 98 900 6,478 0 7,476WALTON 19 385,199 96 3,884 6,895 0 10,875WARE 354 1,588,583 397 26,847 24,242 0 51,486WARREN 242 1,953,618 488 22,466 34,208 0 57,162WASHINGTON 158 2,113,528 528 17,861 44,708 0 63,097WAYNE 207 1,595,660 399 20,493 28,722 0 49,614WEBSTER 143 1,428,821 357 20,785 26,283 0 47,425WHEELER 376 2,098,812 525 39,796 24,136 0 64,457WHITE 8 110,384 28 910 1,567 0 2,505WHITFIELD 30 390,083 98 2,191 6,305 0 8,594WILCOX 821 5,322,176 1,331 82,493 67,113 648 151,585WILKES 142 1,955,300 489 15,739 32,626 0 48,854WILKINSON 47 898,643 225 12,078 12,694 0 24,994WORTH 136 2,686,118 672 30,648 35,618 886 67,824STATE TOTAL 16,472 178,359,051 44,596 2,077,538 2,610,912 79,817 4,812,863 Figures 15 and 16 below illustrates the amount of revenue loss and the amount of value removed as a result of the Preferential Agricultural Assessment program.
,
Figure 15 - Preferential Agricultural Assessment Revenue
4.8
4.8
5.0
4.8
4.8
4.7
4.6
4.4
4.23.4
3.5
4.2
4.7
0.01.02.03.04.05.06.0
1991 1992 1993 1994 1995 1996 1997 1998 1999 2000 2001 2002 2003
Tax Year
Mill
ions
Figure 16 - Preferential Agricultural Assessed Value Eliminated
178.4
182.0
195.1
191.4
191.2
189.2
181.3
174.1
165.3
137.1
145.1181.0
204.2
100.0120.0140.0160.0180.0200.0220.0
1991 1992 1993 1994 1995 1996 1997 1998 1999 2000 2001 2002 2003
Tax Year
Mill
ions
24
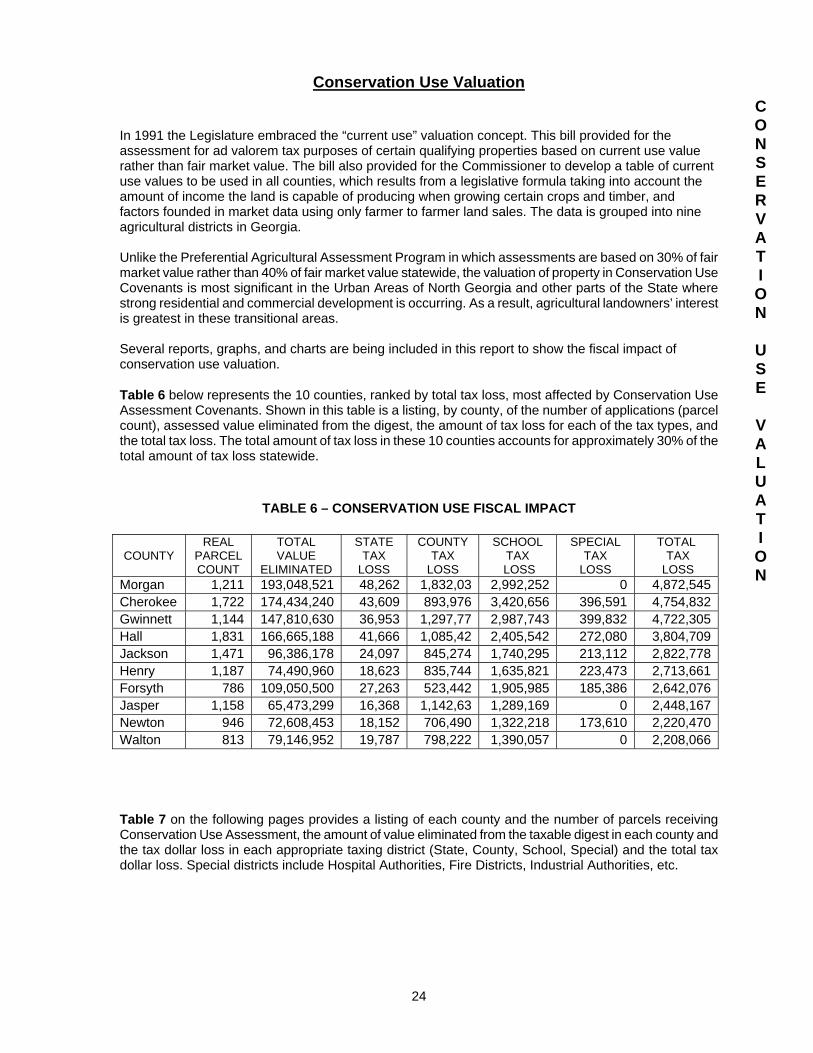
Conservation Use Valuation
In 1991 the Legislature embraced the “current use” valuation concept. This bill provided for the assessment for ad valorem tax purposes of certain qualifying properties based on current use value rather than fair market value. The bill also provided for the Commissioner to develop a table of current use values to be used in all counties, which results from a legislative formula taking into account the amount of income the land is capable of producing when growing certain crops and timber, and factors founded in market data using only farmer to farmer land sales. The data is grouped into nine agricultural districts in Georgia. Unlike the Preferential Agricultural Assessment Program in which assessments are based on 30% of fair market value rather than 40% of fair market value statewide, the valuation of property in Conservation Use Covenants is most significant in the Urban Areas of North Georgia and other parts of the State where strong residential and commercial development is occurring. As a result, agricultural landowners’ interest is greatest in these transitional areas. Several reports, graphs, and charts are being included in this report to show the fiscal impact of conservation use valuation. Table 6 below represents the 10 counties, ranked by total tax loss, most affected by Conservation Use Assessment Covenants. Shown in this table is a listing, by county, of the number of applications (parcel count), assessed value eliminated from the digest, the amount of tax loss for each of the tax types, and the total tax loss. The total amount of tax loss in these 10 counties accounts for approximately 30% of the total amount of tax loss statewide.
TABLE 6 – CONSERVATION USE FISCAL IMPACT
COUNTY
REAL PARCEL COUNT
TOTAL VALUE
ELIMINATED
STATE TAX
LOSS
COUNTY TAX
LOSS
SCHOOL TAX
LOSS
SPECIAL TAX
LOSS
TOTAL TAX
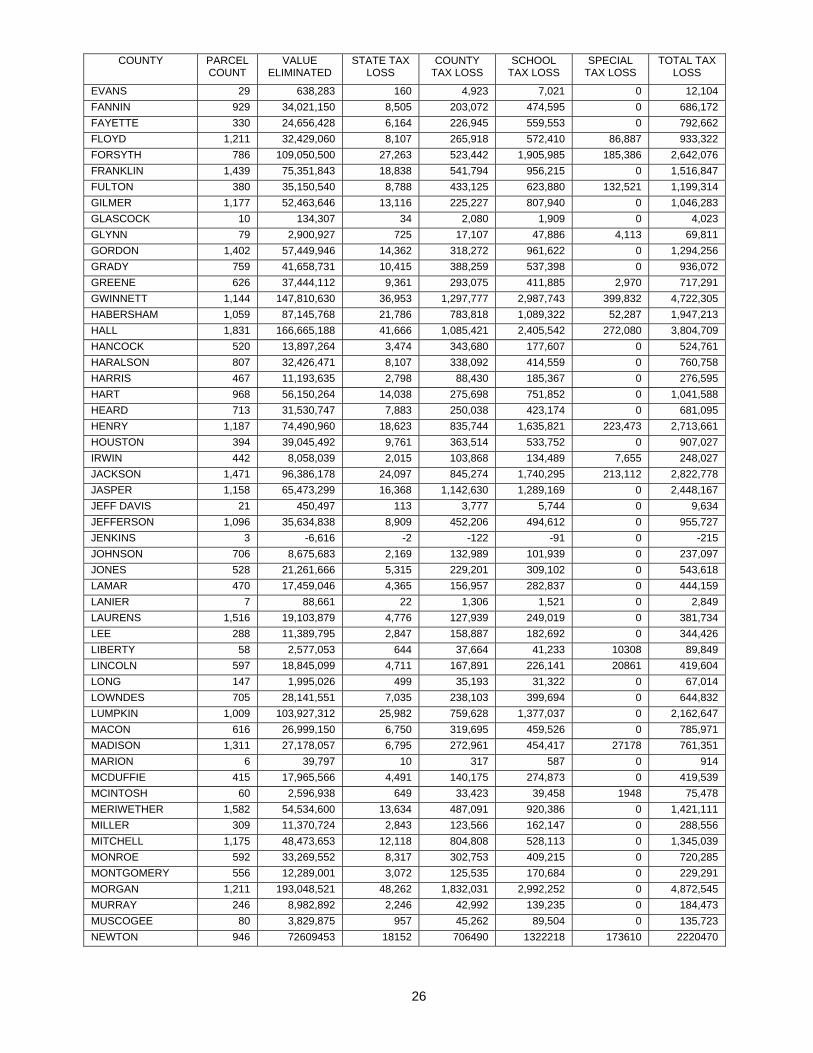
LOSS Morgan 1,211 193,048,521 48,262 1,832,03 2,992,252 0 4,872,545Cherokee 1,722 174,434,240 43,609 893,976 3,420,656 396,591 4,754,832Gwinnett 1,144 147,810,630 36,953 1,297,77 2,987,743 399,832 4,722,305Hall 1,831 166,665,188 41,666 1,085,42 2,405,542 272,080 3,804,709Jackson 1,471 96,386,178 24,097 845,274 1,740,295 213,112 2,822,778Henry 1,187 74,490,960 18,623 835,744 1,635,821 223,473 2,713,661Forsyth 786 109,050,500 27,263 523,442 1,905,985 185,386 2,642,076Jasper 1,158 65,473,299 16,368 1,142,63 1,289,169 0 2,448,167Newton 946 72,608,453 18,152 706,490 1,322,218 173,610 2,220,470Walton 813 79,146,952 19,787 798,222 1,390,057 0 2,208,066 Table 7 on the following pages provides a listing of each county and the number of parcels receiving Conservation Use Assessment, the amount of value eliminated from the taxable digest in each county and the tax dollar loss in each appropriate taxing district (State, County, School, Special) and the total tax dollar loss. Special districts include Hospital Authorities, Fire Districts, Industrial Authorities, etc.
C O N S E R V A T I O N
U S E
V A L U A T I O N
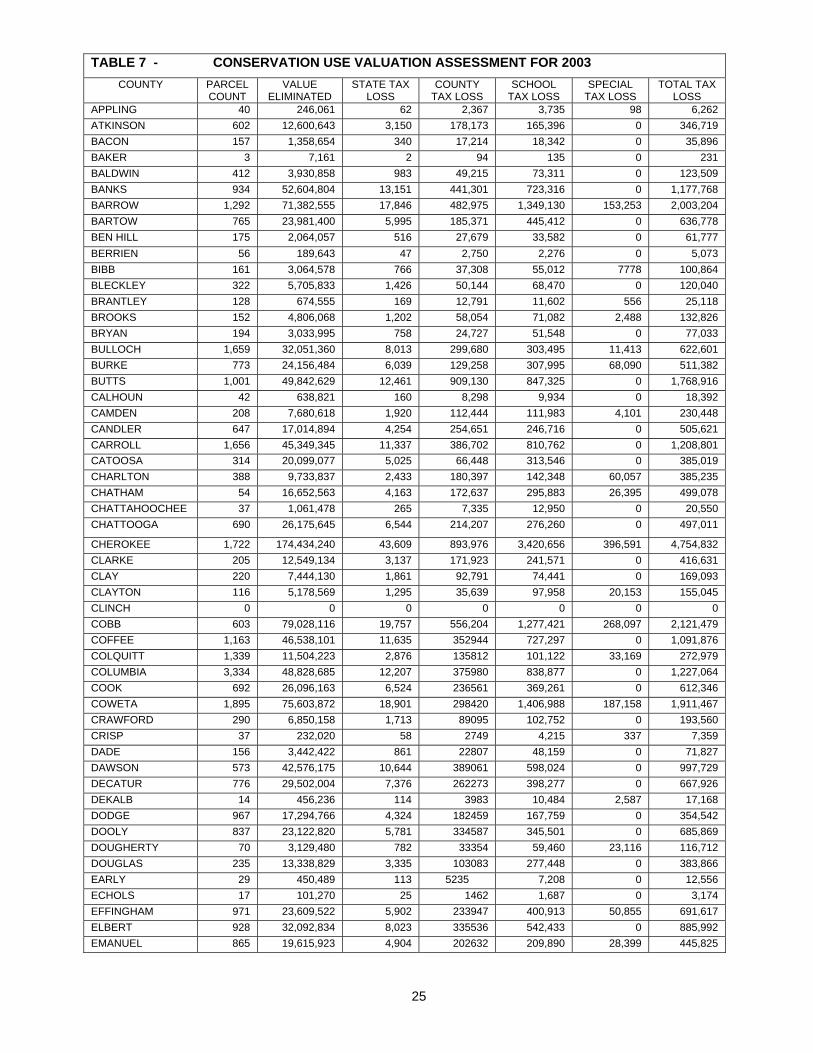
25
TABLE 7 - CONSERVATION USE VALUATION ASSESSMENT FOR 2003 COUNTY PARCEL
COUNT VALUE
ELIMINATED STATE TAX
LOSS COUNTY
TAX LOSS SCHOOL
TAX LOSS SPECIAL
TAX LOSS TOTAL TAX
LOSS APPLING 40 246,061 62 2,367 3,735 98 6,262 ATKINSON 602 12,600,643 3,150 178,173 165,396 0 346,719 BACON 157 1,358,654 340 17,214 18,342 0 35,896 BAKER 3 7,161 2 94 135 0 231 BALDWIN 412 3,930,858 983 49,215 73,311 0 123,509 BANKS 934 52,604,804 13,151 441,301 723,316 0 1,177,768 BARROW 1,292 71,382,555 17,846 482,975 1,349,130 153,253 2,003,204 BARTOW 765 23,981,400 5,995 185,371 445,412 0 636,778 BEN HILL 175 2,064,057 516 27,679 33,582 0 61,777 BERRIEN 56 189,643 47 2,750 2,276 0 5,073 BIBB 161 3,064,578 766 37,308 55,012 7778 100,864 BLECKLEY 322 5,705,833 1,426 50,144 68,470 0 120,040 BRANTLEY 128 674,555 169 12,791 11,602 556 25,118 BROOKS 152 4,806,068 1,202 58,054 71,082 2,488 132,826 BRYAN 194 3,033,995 758 24,727 51,548 0 77,033 BULLOCH 1,659 32,051,360 8,013 299,680 303,495 11,413 622,601 BURKE 773 24,156,484 6,039 129,258 307,995 68,090 511,382 BUTTS 1,001 49,842,629 12,461 909,130 847,325 0 1,768,916 CALHOUN 42 638,821 160 8,298 9,934 0 18,392 CAMDEN 208 7,680,618 1,920 112,444 111,983 4,101 230,448 CANDLER 647 17,014,894 4,254 254,651 246,716 0 505,621 CARROLL 1,656 45,349,345 11,337 386,702 810,762 0 1,208,801 CATOOSA 314 20,099,077 5,025 66,448 313,546 0 385,019 CHARLTON 388 9,733,837 2,433 180,397 142,348 60,057 385,235 CHATHAM 54 16,652,563 4,163 172,637 295,883 26,395 499,078 CHATTAHOOCHEE 37 1,061,478 265 7,335 12,950 0 20,550 CHATTOOGA 690 26,175,645 6,544 214,207 276,260 0 497,011
CHEROKEE 1,722 174,434,240 43,609 893,976 3,420,656 396,591 4,754,832 CLARKE 205 12,549,134 3,137 171,923 241,571 0 416,631 CLAY 220 7,444,130 1,861 92,791 74,441 0 169,093 CLAYTON 116 5,178,569 1,295 35,639 97,958 20,153 155,045 CLINCH 0 0 0 0 0 0 0 COBB 603 79,028,116 19,757 556,204 1,277,421 268,097 2,121,479 COFFEE 1,163 46,538,101 11,635 352944 727,297 0 1,091,876 COLQUITT 1,339 11,504,223 2,876 135812 101,122 33,169 272,979 COLUMBIA 3,334 48,828,685 12,207 375980 838,877 0 1,227,064 COOK 692 26,096,163 6,524 236561 369,261 0 612,346 COWETA 1,895 75,603,872 18,901 298420 1,406,988 187,158 1,911,467 CRAWFORD 290 6,850,158 1,713 89095 102,752 0 193,560 CRISP 37 232,020 58 2749 4,215 337 7,359 DADE 156 3,442,422 861 22807 48,159 0 71,827 DAWSON 573 42,576,175 10,644 389061 598,024 0 997,729 DECATUR 776 29,502,004 7,376 262273 398,277 0 667,926 DEKALB 14 456,236 114 3983 10,484 2,587 17,168 DODGE 967 17,294,766 4,324 182459 167,759 0 354,542 DOOLY 837 23,122,820 5,781 334587 345,501 0 685,869 DOUGHERTY 70 3,129,480 782 33354 59,460 23,116 116,712 DOUGLAS 235 13,338,829 3,335 103083 277,448 0 383,866 EARLY 29 450,489 113 5235 7,208 0 12,556 ECHOLS 17 101,270 25 1462 1,687 0 3,174 EFFINGHAM 971 23,609,522 5,902 233947 400,913 50,855 691,617 ELBERT 928 32,092,834 8,023 335536 542,433 0 885,992 EMANUEL 865 19,615,923 4,904 202632 209,890 28,399 445,825
26
COUNTY PARCEL COUNT
VALUE ELIMINATED
STATE TAX LOSS
COUNTY TAX LOSS
SCHOOL TAX LOSS
SPECIAL TAX LOSS
TOTAL TAX LOSS
EVANS 29 638,283 160 4,923 7,021 0 12,104 FANNIN 929 34,021,150 8,505 203,072 474,595 0 686,172 FAYETTE 330 24,656,428 6,164 226,945 559,553 0 792,662 FLOYD 1,211 32,429,060 8,107 265,918 572,410 86,887 933,322 FORSYTH 786 109,050,500 27,263 523,442 1,905,985 185,386 2,642,076 FRANKLIN 1,439 75,351,843 18,838 541,794 956,215 0 1,516,847 FULTON 380 35,150,540 8,788 433,125 623,880 132,521 1,199,314 GILMER 1,177 52,463,646 13,116 225,227 807,940 0 1,046,283 GLASCOCK 10 134,307 34 2,080 1,909 0 4,023 GLYNN 79 2,900,927 725 17,107 47,886 4,113 69,811 GORDON 1,402 57,449,946 14,362 318,272 961,622 0 1,294,256 GRADY 759 41,658,731 10,415 388,259 537,398 0 936,072 GREENE 626 37,444,112 9,361 293,075 411,885 2,970 717,291 GWINNETT 1,144 147,810,630 36,953 1,297,777 2,987,743 399,832 4,722,305 HABERSHAM 1,059 87,145,768 21,786 783,818 1,089,322 52,287 1,947,213 HALL 1,831 166,665,188 41,666 1,085,421 2,405,542 272,080 3,804,709 HANCOCK 520 13,897,264 3,474 343,680 177,607 0 524,761 HARALSON 807 32,426,471 8,107 338,092 414,559 0 760,758 HARRIS 467 11,193,635 2,798 88,430 185,367 0 276,595 HART 968 56,150,264 14,038 275,698 751,852 0 1,041,588 HEARD 713 31,530,747 7,883 250,038 423,174 0 681,095 HENRY 1,187 74,490,960 18,623 835,744 1,635,821 223,473 2,713,661 HOUSTON 394 39,045,492 9,761 363,514 533,752 0 907,027 IRWIN 442 8,058,039 2,015 103,868 134,489 7,655 248,027 JACKSON 1,471 96,386,178 24,097 845,274 1,740,295 213,112 2,822,778 JASPER 1,158 65,473,299 16,368 1,142,630 1,289,169 0 2,448,167 JEFF DAVIS 21 450,497 113 3,777 5,744 0 9,634 JEFFERSON 1,096 35,634,838 8,909 452,206 494,612 0 955,727 JENKINS 3 -6,616 -2 -122 -91 0 -215 JOHNSON 706 8,675,683 2,169 132,989 101,939 0 237,097 JONES 528 21,261,666 5,315 229,201 309,102 0 543,618 LAMAR 470 17,459,046 4,365 156,957 282,837 0 444,159 LANIER 7 88,661 22 1,306 1,521 0 2,849 LAURENS 1,516 19,103,879 4,776 127,939 249,019 0 381,734 LEE 288 11,389,795 2,847 158,887 182,692 0 344,426 LIBERTY 58 2,577,053 644 37,664 41,233 10308 89,849 LINCOLN 597 18,845,099 4,711 167,891 226,141 20861 419,604 LONG 147 1,995,026 499 35,193 31,322 0 67,014 LOWNDES 705 28,141,551 7,035 238,103 399,694 0 644,832 LUMPKIN 1,009 103,927,312 25,982 759,628 1,377,037 0 2,162,647 MACON 616 26,999,150 6,750 319,695 459,526 0 785,971 MADISON 1,311 27,178,057 6,795 272,961 454,417 27178 761,351 MARION 6 39,797 10 317 587 0 914 MCDUFFIE 415 17,965,566 4,491 140,175 274,873 0 419,539 MCINTOSH 60 2,596,938 649 33,423 39,458 1948 75,478 MERIWETHER 1,582 54,534,600 13,634 487,091 920,386 0 1,421,111 MILLER 309 11,370,724 2,843 123,566 162,147 0 288,556 MITCHELL 1,175 48,473,653 12,118 804,808 528,113 0 1,345,039 MONROE 592 33,269,552 8,317 302,753 409,215 0 720,285 MONTGOMERY 556 12,289,001 3,072 125,535 170,684 0 229,291 MORGAN 1,211 193,048,521 48,262 1,832,031 2,992,252 0 4,872,545 MURRAY 246 8,982,892 2,246 42,992 139,235 0 184,473 MUSCOGEE 80 3,829,875 957 45,262 89,504 0 135,723 NEWTON 946 72609453 18152 706490 1322218 173610 2220470

27
COUNTY PARCEL COUNT
VALUE ELIMINATED
STATE TAX LOSS
COUNTY TAX LOSS
SCHOOL TAX LOSS
SPECIAL TAX LOSS
TOTAL TAX LOSS
OCONEE 1,428 83,801,138 20,950 713,495 1365,959 0 2,100,404 OGLETHORPE 696 20,968,044 5,242 155,642 283,069 0 443,953 PAULDING 1,058 76,046,556 19,012 539,931 1333,096 0 1,892,039 PEACH 202 6,149,439 1,537 92,241 106,078 0 199,856 PICKENS 411 32,861,081 8,215 195,523 489,301 0 693,039 PIERCE 417 7,982,097 1,996 49,649 126,676 0 178,321 PIKE 929 52,545,756 13,136 589,038 717,775 0 1,319,949 POLK 699 25,204,556 6,301 233,784 340,917 0 581,002 PULASKI 331 6,285,952 1,571 73,420 73,168 4,714 152,873 PUTNAM 335 19,502,190 4,876 156,018 285,337 0 446,231 QUITMAN 146 3,212,916 803 41,511 46,925 0 89,239 RABUN 468 32,887,272 8,222 285,452 246,194 0 539,868 RANDOLPH 534 6,845,641 1,711 78,527 110,557 0 190,795 RICHMOND 100 3,231,555 808 22,165 67,106 5,984 96,063 ROCKDALE 159 10,147,638 2,537 138,414 221,219 0 362,170 SCHLEY 38 524,345 131 5,747 10,104 0 15,982 SCREVEN 36 1,023,550 256 10,286 13,255 0 23,797 SEMINOLE 94 3,519,929 880 44,316 48,719 2,693 96,608 SPALDING 647 39,633,264 9,908 536,238 751,050 121,121 1,418,317 STEPHENS 317 9,584,148 2,396 101,784 161,972 0 266,152 STEWART 155 5,218,208 1,305 63,871 48,245 0 113,601 SUMTER 38 469,427 117 5,388 6,990 596 13,091 TALBOT 1,164 20,384,468 5,096 337,363 282,835 0 625,294 TALIAFERRO 52 1,044,376 261 19,973 15,666 0 35,900 TATTNALL 490 12,657,370 3,164 156,344 165,432 4,177 329,117 TAYLOR 739 17,998,603 4,500 152,687 215,983 0 373,170 TELFAIR 15 281,684 70 2,947 4,084 0 7,101 TERRELL 885 24,691,761 6,173 355,562 361,240 0 722,975 THOMAS 791 6,231,090 15,575 323,836 764,170 224,584 1,328,168 TIFT 807 59,838,280 14,960 564,275 715,905 98,733 1,393,873 TOOMBS 3 25,435 6 155 227 23 411 TOWNS 242 9,899,634 2,475 63,992 51,973 0 118,440 TREUTLEN 188 2,288,118 572 31,857 20,959 0 53,388 TROUP 783 19,985,412 4,996 216,442 385,319 0 606,757 TURNER 953 14,288,577 3,572 251,622 192,896 0 448,090 TWIGGS 611 8,970,500 2,243 122,879 156,535 0 281,657 UNION 829 42,614,004 10,654 221,593 404,833 0 637,080 UPSON 464 5,314,275 1,329 82,000 83,168 0 166,497 WALKER 558 17,226,003 4,307 39,620 285,090 0 329,017 WALTON 813 79,146,952 19,787 798,222 1,390,057 0 2,208,066 WARE 22 82,382 21 107,650 1,257 0 108,928 WARREN 120 1,365,249 341 15,700 23,905 0 39,946 WASHINGTON 574 9,141,735 2,285 77,257 193,375 0 272,917 WAYNE 662 6,912,330 1,728 88,775 124,422 0 214,925 WEBSTER 64 976,135 244 14,199 17,956 0 32,399 WHEELER 0 0 0 0 0 0 0 WHITE 784 55,836,512 13,959 460,093 792,879 0 1,266,931 WHITFIELD 275 10,345,830 2,586 58,102 167,209 0 227,897 WILCOX 6 49,253 12 763 621 9 1,405 WILKES 984 21,823,489 5,456 175,900 364,147 0 545,503 WILKINSON 437 7,972,510 1,993 107,151 112,620 0 221,764 WORTH 1,434 73,781,501 18,445 841,847 978,343 24,348 1,862,983
TOTAL 93,477 4,290,380,463 1,072,595 38,421,050 66,911,734 3,645,894 110,051,273
28
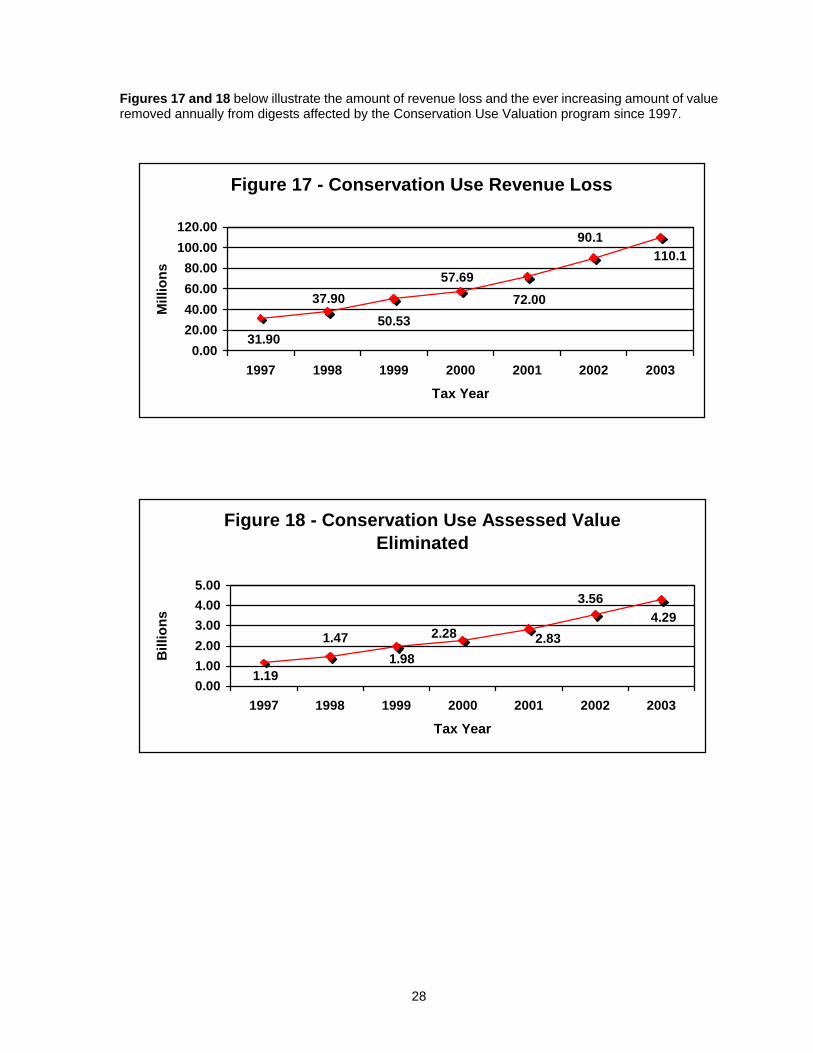
Figures 17 and 18 below illustrate the amount of revenue loss and the ever increasing amount of value removed annually from digests affected by the Conservation Use Valuation program since 1997.
Figure 17 - Conservation Use Revenue Loss
110.190.1
72.0057.69
50.5337.90
31.900.00
20.0040.0060.0080.00
100.00120.00
1997 1998 1999 2000 2001 2002 2003
Tax Year
Mill
ions
Figure 18 - Conservation Use Assessed ValueEliminated
4.293.56
2.832.28
1.981.47
1.190.001.002.003.004.005.00
1997 1998 1999 2000 2001 2002 2003
Tax Year
Bill
ions
29
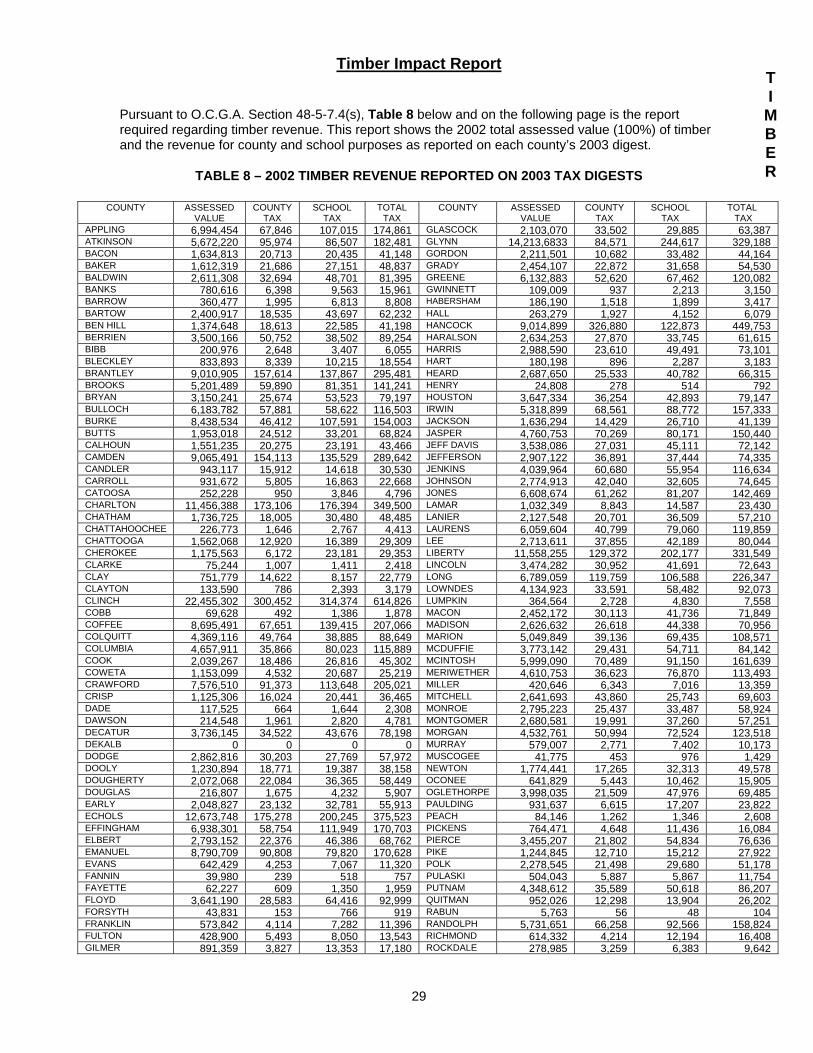
Timber Impact Report Pursuant to O.C.G.A. Section 48-5-7.4(s), Table 8 below and on the following page is the report required regarding timber revenue. This report shows the 2002 total assessed value (100%) of timber and the revenue for county and school purposes as reported on each county’s 2003 digest.
TABLE 8 – 2002 TIMBER REVENUE REPORTED ON 2003 TAX DIGESTS
COUNTY ASSESSED VALUE
COUNTY TAX
SCHOOL TAX
TOTAL TAX
COUNTY ASSESSED VALUE
COUNTY TAX
SCHOOL TAX
TOTAL TAX
APPLING 6,994,454 67,846 107,015 174,861 GLASCOCK 2,103,070 33,502 29,885 63,387ATKINSON 5,672,220 95,974 86,507 182,481 GLYNN 14,213,6833 84,571 244,617 329,188BACON 1,634,813 20,713 20,435 41,148 GORDON 2,211,501 10,682 33,482 44,164BAKER 1,612,319 21,686 27,151 48,837 GRADY 2,454,107 22,872 31,658 54,530BALDWIN 2,611,308 32,694 48,701 81,395 GREENE 6,132,883 52,620 67,462 120,082BANKS 780,616 6,398 9,563 15,961 GWINNETT 109,009 937 2,213 3,150BARROW 360,477 1,995 6,813 8,808 HABERSHAM 186,190 1,518 1,899 3,417BARTOW 2,400,917 18,535 43,697 62,232 HALL 263,279 1,927 4,152 6,079BEN HILL 1,374,648 18,613 22,585 41,198 HANCOCK 9,014,899 326,880 122,873 449,753BERRIEN 3,500,166 50,752 38,502 89,254 HARALSON 2,634,253 27,870 33,745 61,615BIBB 200,976 2,648 3,407 6,055 HARRIS 2,988,590 23,610 49,491 73,101BLECKLEY 833,893 8,339 10,215 18,554 HART 180,198 896 2,287 3,183BRANTLEY 9,010,905 157,614 137,867 295,481 HEARD 2,687,650 25,533 40,782 66,315BROOKS 5,201,489 59,890 81,351 141,241 HENRY 24,808 278 514 792BRYAN 3,150,241 25,674 53,523 79,197 HOUSTON 3,647,334 36,254 42,893 79,147BULLOCH 6,183,782 57,881 58,622 116,503 IRWIN 5,318,899 68,561 88,772 157,333BURKE 8,438,534 46,412 107,591 154,003 JACKSON 1,636,294 14,429 26,710 41,139BUTTS 1,953,018 24,512 33,201 68,824 JASPER 4,760,753 70,269 80,171 150,440CALHOUN 1,551,235 20,275 23,191 43,466 JEFF DAVIS 3,538,086 27,031 45,111 72,142CAMDEN 9,065,491 154,113 135,529 289,642 JEFFERSON 2,907,122 36,891 37,444 74,335CANDLER 943,117 15,912 14,618 30,530 JENKINS 4,039,964 60,680 55,954 116,634CARROLL 931,672 5,805 16,863 22,668 JOHNSON 2,774,913 42,040 32,605 74,645CATOOSA 252,228 950 3,846 4,796 JONES 6,608,674 61,262 81,207 142,469CHARLTON 11,456,388 173,106 176,394 349,500 LAMAR 1,032,349 8,843 14,587 23,430CHATHAM 1,736,725 18,005 30,480 48,485 LANIER 2,127,548 20,701 36,509 57,210CHATTAHOOCHEE 226,773 1,646 2,767 4,413 LAURENS 6,059,604 40,799 79,060 119,859CHATTOOGA 1,562,068 12,920 16,389 29,309 LEE 2,713,611 37,855 42,189 80,044CHEROKEE 1,175,563 6,172 23,181 29,353 LIBERTY 11,558,255 129,372 202,177 331,549CLARKE 75,244 1,007 1,411 2,418 LINCOLN 3,474,282 30,952 41,691 72,643CLAY 751,779 14,622 8,157 22,779 LONG 6,789,059 119,759 106,588 226,347CLAYTON 133,590 786 2,393 3,179 LOWNDES 4,134,923 33,591 58,482 92,073CLINCH 22,455,302 300,452 314,374 614,826 LUMPKIN 364,564 2,728 4,830 7,558COBB 69,628 492 1,386 1,878 MACON 2,452,172 30,113 41,736 71,849COFFEE 8,695,491 67,651 139,415 207,066 MADISON 2,626,632 26,618 44,338 70,956COLQUITT 4,369,116 49,764 38,885 88,649 MARION 5,049,849 39,136 69,435 108,571COLUMBIA 4,657,911 35,866 80,023 115,889 MCDUFFIE 3,773,142 29,431 54,711 84,142COOK 2,039,267 18,486 26,816 45,302 MCINTOSH 5,999,090 70,489 91,150 161,639COWETA 1,153,099 4,532 20,687 25,219 MERIWETHER 4,610,753 36,623 76,870 113,493CRAWFORD 7,576,510 91,373 113,648 205,021 MILLER 420,646 6,343 7,016 13,359CRISP 1,125,306 16,024 20,441 36,465 MITCHELL 2,641,693 43,860 25,743 69,603DADE 117,525 664 1,644 2,308 MONROE 2,795,223 25,437 33,487 58,924DAWSON 214,548 1,961 2,820 4,781 MONTGOMER 2,680,581 19,991 37,260 57,251DECATUR 3,736,145 34,522 43,676 78,198 MORGAN 4,532,761 50,994 72,524 123,518DEKALB 0 0 0 0 MURRAY 579,007 2,771 7,402 10,173DODGE 2,862,816 30,203 27,769 57,972 MUSCOGEE 41,775 453 976 1,429DOOLY 1,230,894 18,771 19,387 38,158 NEWTON 1,774,441 17,265 32,313 49,578DOUGHERTY 2,072,068 22,084 36,365 58,449 OCONEE 641,829 5,443 10,462 15,905DOUGLAS 216,807 1,675 4,232 5,907 OGLETHORPE 3,998,035 21,509 47,976 69,485EARLY 2,048,827 23,132 32,781 55,913 PAULDING 931,637 6,615 17,207 23,822ECHOLS 12,673,748 175,278 200,245 375,523 PEACH 84,146 1,262 1,346 2,608EFFINGHAM 6,938,301 58,754 111,949 170,703 PICKENS 764,471 4,648 11,436 16,084ELBERT 2,793,152 22,376 46,386 68,762 PIERCE 3,455,207 21,802 54,834 76,636EMANUEL 8,790,709 90,808 79,820 170,628 PIKE 1,244,845 12,710 15,212 27,922EVANS 642,429 4,253 7,067 11,320 POLK 2,278,545 21,498 29,680 51,178FANNIN 39,980 239 518 757 PULASKI 504,043 5,887 5,867 11,754FAYETTE 62,227 609 1,350 1,959 PUTNAM 4,348,612 35,589 50,618 86,207FLOYD 3,641,190 28,583 64,416 92,999 QUITMAN 952,026 12,298 13,904 26,202FORSYTH 43,831 153 766 919 RABUN 5,763 56 48 104FRANKLIN 573,842 4,114 7,282 11,396 RANDOLPH 5,731,651 66,258 92,566 158,824FULTON 428,900 5,493 8,050 13,543 RICHMOND 614,332 4,214 12,194 16,408GILMER 891,359 3,827 13,353 17,180 ROCKDALE 278,985 3,259 6,383 9,642
T I M B E R
30
COUNTY ASSESSED VALUE
COUNTY TAX
SCHOOL TAX
TOTAL TAX
COUNTY ASSESSED VALUE
COUNTY TAX
SCHOOL TAX
TOTAL TAX
SCHLEY 1,288,223 14,673 20,238 34,911 TURNER 2,965,215 46,287 4,030 86,317SCREVEN 7,296,109 73,326 79,892 153,218 TWIGGS 2,533,342 34,656 44,207 78,863SEMINOLE 358,653 4,887 5,335 10,222 UNION 25,158 133 209 342SPALDING 858,704 10,227 15,929 26,156 UPSON 3,894,160 52,299 60,944 113,243STEPHENS 485,783 4,809 7,238 12,047 WALKER 401,045 922 6,637 7,559STEWART 6,505,602 68,634 61,127 129,761 WALTON 1,126,576 11,360 20,166 31,526SUMTER 2,570,279 29,507 38,271 67,778 WARE 14,189,930 239,793 221,191 460,984TALBOT 2,454,615 40,624 34,561 75,185 WARREN 4,655,445 53,538 68,821 122,359TALIAFERRO 4,243,539 64,502 56,821 121,323 WASHINGTON 9,082,512 76,093 159,934 236,027TATTNALL 3,689,513 41,562 48,222 89,784 WAYNE 14,119,482 167,217 218,852 386,069TAYLOR 2,273,365 19,187 27,280 46,467 WEBSTER 2,169,116 32,591 38,274 70,865TELFAIR 7,195,365 63,571 89,942 153,513 WHEELER 2,889,359 42,245 33,228 75,473TERRELL 1,737,176 22,931 21,941 44,872 WHITE 346,856 2,359 5,156 7,515THOMAS 4,492,987 23,822 55,305 79,127 WHITFIELD 755,445 5,034 13,769 18,803TIFT 1,686,426 18,989 23,175 42,164 WILCOX 5,258,596 81,508 66,311 147,819TOOMBS 3,463,235 22,442 45,022 67,464 WILKES 6,980,968 51,101 118,327 169,428TOWNS 0 0 0 0 WILKINSON 8,907,555 92,995 131,119 224,114TREUTLEN 2,200,910 28,260 20,160 48,420 WORTH 5,125,750 58,485 67,967 126,452TROUP 1,926,347 17,010 34,250 51,260 STATE TOTAL 518,592,164 5,962,60 7,524,101 13,486,710
Figures 19 and 20 below show the amount of timber value reported and the amount of tax levied for county and school tax purposes for the years 1997 through 2003.
Figure 19 - State Wide Timber Values
593.1
755.0 711.8701.1 676.0
507.7 518.6
0.0
200.0
400.0
600.0
800.0
1997 1998 1999 2000 2001 2002 2003
Tax Year
Mill
ions
Figure 20 - County & School Revenue from Timber
12.917.217.918.019.3
15.115.90.0
10.0
20.0
30.0
1996 1997 1998 1999 2000 2001 2002
Tax Year
Mill
ions