property assessment and taxation in south dakota assessment and taxation in south dakota presented...
TRANSCRIPT
Property Assessment and Taxation in South Dakota
Presented by Michael Houdyshell
Director, Property and Special Taxes
SD Dept. of Revenue
What is the Property Tax?
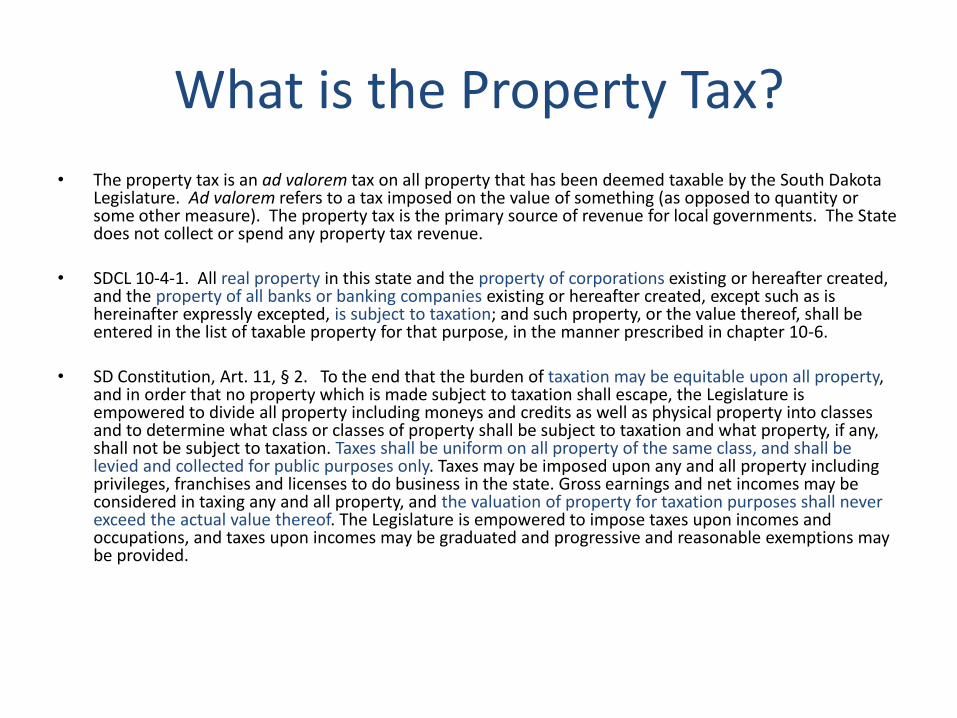
• The property tax is an ad valorem tax on all property that has been deemed taxable by the South Dakota Legislature. Ad valorem refers to a tax imposed on the value of something (as opposed to quantity or some other measure). The property tax is the primary source of revenue for local governments. The State does not collect or spend any property tax revenue.
• SDCL 10-4-1. All real property in this state and the property of corporations existing or hereafter created, and the property of all banks or banking companies existing or hereafter created, except such as is hereinafter expressly excepted, is subject to taxation; and such property, or the value thereof, shall be entered in the list of taxable property for that purpose, in the manner prescribed in chapter 10-6.
• SD Constitution, Art. 11, § 2. To the end that the burden of taxation may be equitable upon all property, and in order that no property which is made subject to taxation shall escape, the Legislature is empowered to divide all property including moneys and credits as well as physical property into classes and to determine what class or classes of property shall be subject to taxation and what property, if any, shall not be subject to taxation. Taxes shall be uniform on all property of the same class, and shall be levied and collected for public purposes only. Taxes may be imposed upon any and all property including privileges, franchises and licenses to do business in the state. Gross earnings and net incomes may be considered in taxing any and all property, and the valuation of property for taxation purposes shall never exceed the actual value thereof. The Legislature is empowered to impose taxes upon incomes and occupations, and taxes upon incomes may be graduated and progressive and reasonable exemptions may be provided.

History of Property Taxes in South Dakota: A Brief Timeline of Events
• Pre-1977: Counties were to assess at market value, but in practice assessed at various levels depending on the type of property.
• 1977: Legislation was passed to require assessment at market value, but counties were given the authority to set taxable percentages (not to exceed 60% of assessed value). It was common for a much lower taxable value to be assigned to agricultural land.
• 1989: Major rewrite of the property tax laws through SB 12 and SB 15. Some of the changes included:
– Removed the counties ability to set taxable percentages
– Adjusted statutory levy limits
– Established minimum assessment standards, such as all property must be assessed at 85% of its market value and coefficient of dispersion (COD) of less than 30.
– Also, Governor Mickelson brought property tax freeze legislation that froze individual property tax bills for 2 years (pay ‘90 and pay ‘91). The legislation also required a 2-year study of the property tax system to find a “fix.”
• 1992: The tax freeze expired without a “fix” for the property tax system. Property values were raised to at least 85% of market and state monies were withheld from counties that did not achieve this statutory requirement or failed to have a COD of less than 30.
• 1994: Initiated Measure 1 on the general election ballot. This measure would have limited assessment increases to a max of 1% annually or 1.25% annually if improved or transferred ownership. Failed by a narrow margin.
• 1995: Governor Janklow’s Property Tax Reduction Act and revised State aid to education formula
– Created “owner-occupied” classification which, along with agricultural property, received a 30% tax reduction phased in over pay ‘97, pay ’99, and pay ‘01 taxes.
• 2008: HB 1005 passed, creating the Agricultural Productivity Methodology for assessing agricultural land.
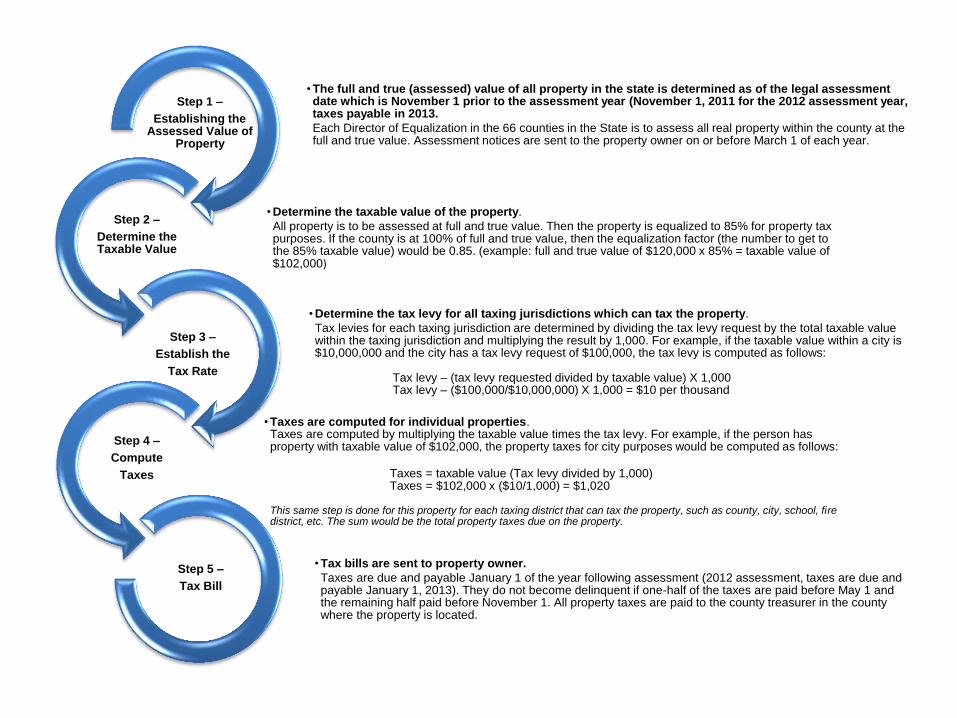
•The full and true (assessed) value of all property in the state is determined as of the legal assessment date which is November 1 prior to the assessment year (November 1, 2011 for the 2012 assessment year, taxes payable in 2013.
Each Director of Equalization in the 66 counties in the State is to assess all real property within the county at the full and true value. Assessment notices are sent to the property owner on or before March 1 of each year.
Step 1 –
Establishing the Assessed Value of
Property
•Determine the taxable value of the property.
All property is to be assessed at full and true value. Then the property is equalized to 85% for property tax purposes. If the county is at 100% of full and true value, then the equalization factor (the number to get to the 85% taxable value) would be 0.85. (example: full and true value of $120,000 x 85% = taxable value of $102,000)
Step 2 –
Determine the Taxable Value
•Determine the tax levy for all taxing jurisdictions which can tax the property.
Tax levies for each taxing jurisdiction are determined by dividing the tax levy request by the total taxable value within the taxing jurisdiction and multiplying the result by 1,000. For example, if the taxable value within a city is $10,000,000 and the city has a tax levy request of $100,000, the tax levy is computed as follows: Tax levy – (tax levy requested divided by taxable value) X 1,000 Tax levy – ($100,000/$10,000,000) X 1,000 = $10 per thousand
Step 3 –
Establish the
Tax Rate
•Taxes are computed for individual properties. Taxes are computed by multiplying the taxable value times the tax levy. For example, if the person has property with taxable value of $102,000, the property taxes for city purposes would be computed as follows:
Taxes = taxable value (Tax levy divided by 1,000) Taxes = $102,000 x ($10/1,000) = $1,020
This same step is done for this property for each taxing district that can tax the property, such as county, city, school, fire district, etc. The sum would be the total property taxes due on the property.
Step 4 –
Compute
Taxes
•Tax bills are sent to property owner.
Taxes are due and payable January 1 of the year following assessment (2012 assessment, taxes are due and payable January 1, 2013). They do not become delinquent if one-half of the taxes are paid before May 1 and the remaining half paid before November 1. All property taxes are paid to the county treasurer in the county where the property is located.
Step 5 –
Tax Bill
Step 1 – Establishing the Assessed Value of Property
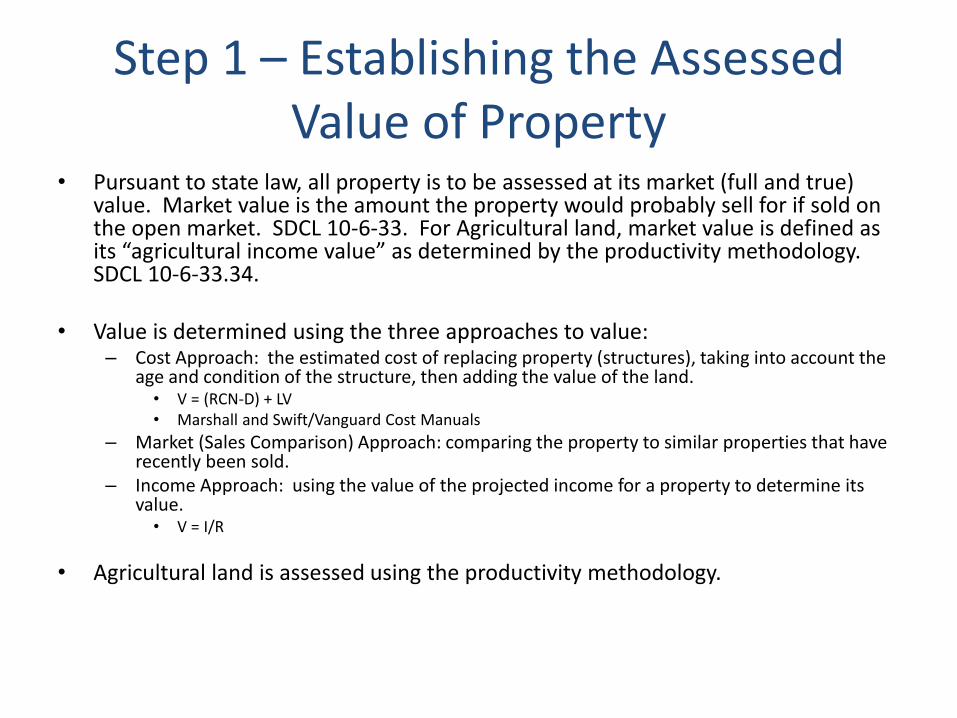
• Pursuant to state law, all property is to be assessed at its market (full and true) value. Market value is the amount the property would probably sell for if sold on the open market. SDCL 10-6-33. For Agricultural land, market value is defined as its “agricultural income value” as determined by the productivity methodology. SDCL 10-6-33.34.
• Value is determined using the three approaches to value:
– Cost Approach: the estimated cost of replacing property (structures), taking into account the age and condition of the structure, then adding the value of the land. • V = (RCN-D) + LV • Marshall and Swift/Vanguard Cost Manuals
– Market (Sales Comparison) Approach: comparing the property to similar properties that have recently been sold.
– Income Approach: using the value of the projected income for a property to determine its value. • V = I/R
• Agricultural land is assessed using the productivity methodology.
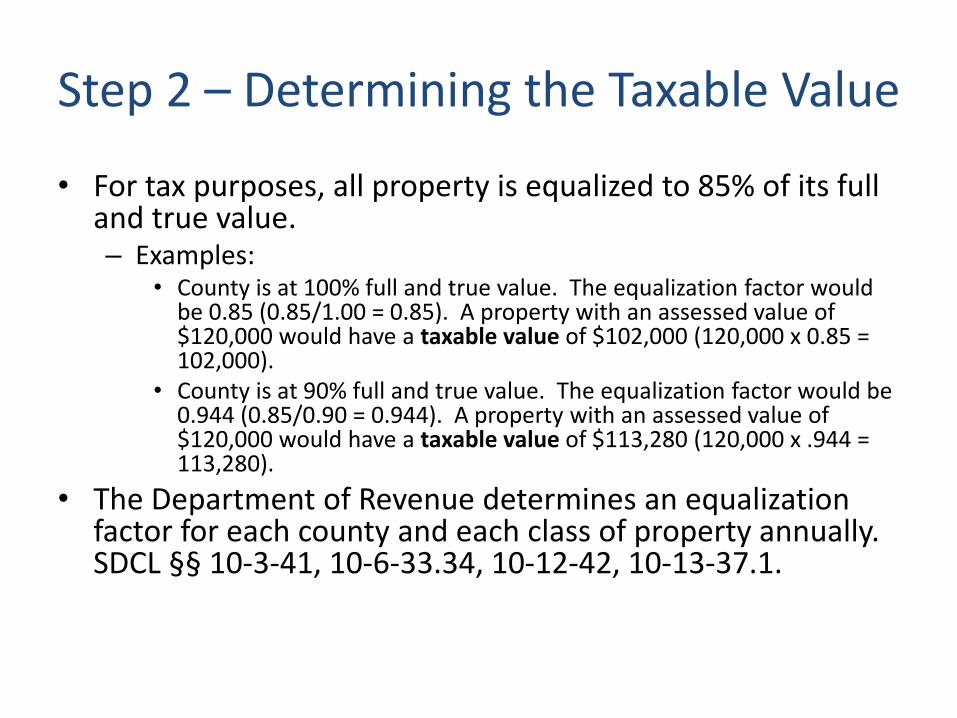
Step 2 – Determining the Taxable Value
• For tax purposes, all property is equalized to 85% of its full and true value. – Examples:
• County is at 100% full and true value. The equalization factor would be 0.85 (0.85/1.00 = 0.85). A property with an assessed value of $120,000 would have a taxable value of $102,000 (120,000 x 0.85 = 102,000).
• County is at 90% full and true value. The equalization factor would be 0.944 (0.85/0.90 = 0.944). A property with an assessed value of $120,000 would have a taxable value of $113,280 (120,000 x .944 = 113,280).
• The Department of Revenue determines an equalization factor for each county and each class of property annually. SDCL §§ 10-3-41, 10-6-33.34, 10-12-42, 10-13-37.1.
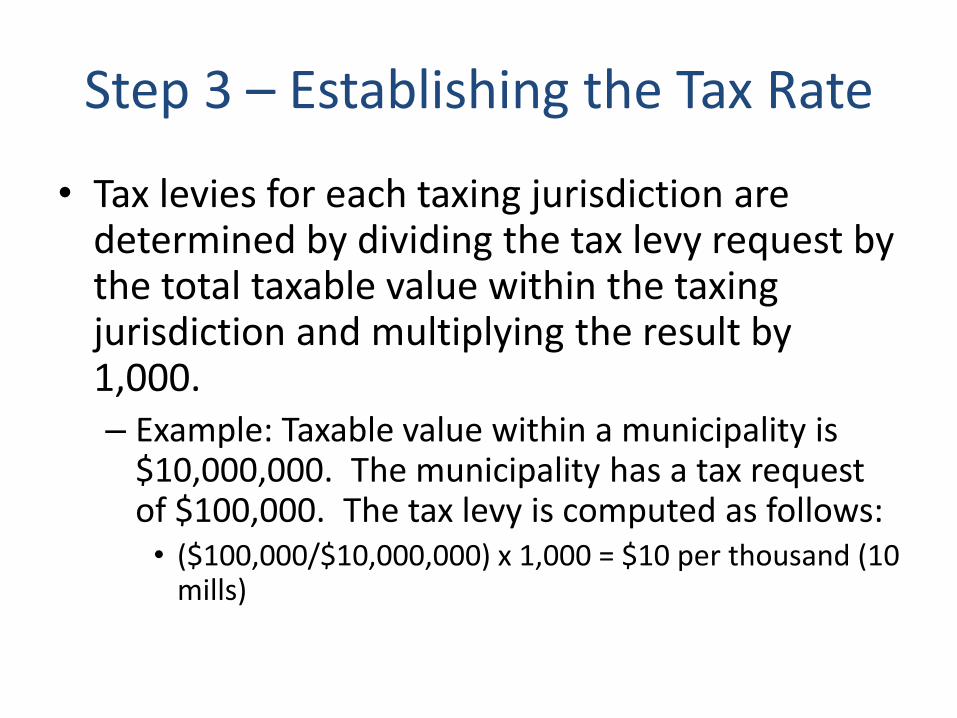
Step 3 – Establishing the Tax Rate
• Tax levies for each taxing jurisdiction are determined by dividing the tax levy request by the total taxable value within the taxing jurisdiction and multiplying the result by 1,000. – Example: Taxable value within a municipality is
$10,000,000. The municipality has a tax request of $100,000. The tax levy is computed as follows: • ($100,000/$10,000,000) x 1,000 = $10 per thousand (10
mills)
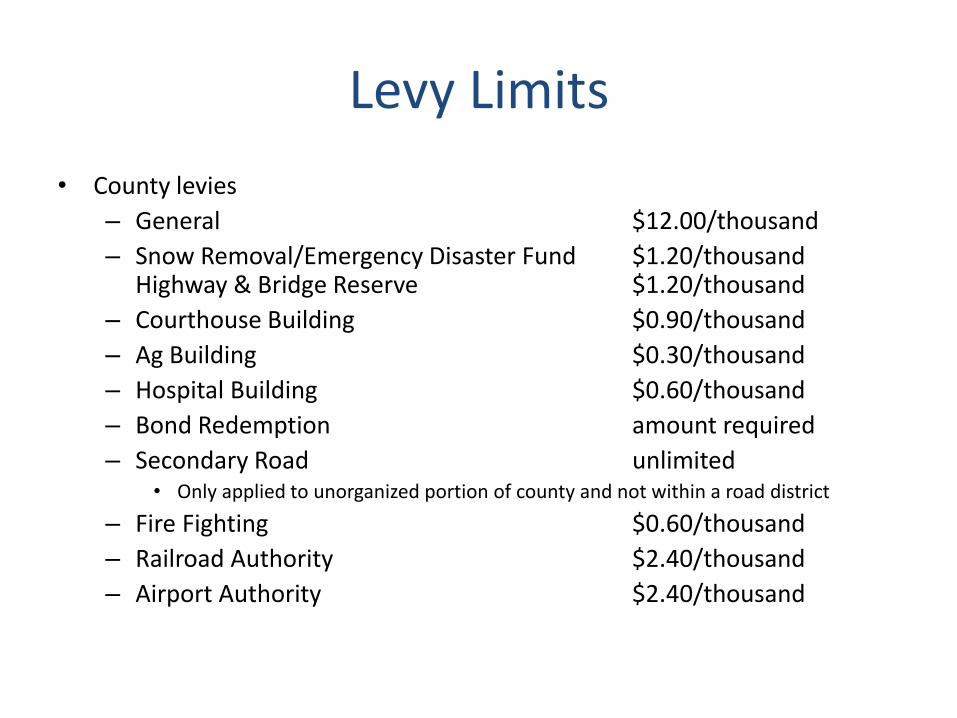
Levy Limits
• County levies
– General $12.00/thousand
– Snow Removal/Emergency Disaster Fund $1.20/thousand Highway & Bridge Reserve $1.20/thousand
– Courthouse Building $0.90/thousand
– Ag Building $0.30/thousand
– Hospital Building $0.60/thousand
– Bond Redemption amount required
– Secondary Road unlimited • Only applied to unorganized portion of county and not within a road district
– Fire Fighting $0.60/thousand
– Railroad Authority $2.40/thousand
– Airport Authority $2.40/thousand
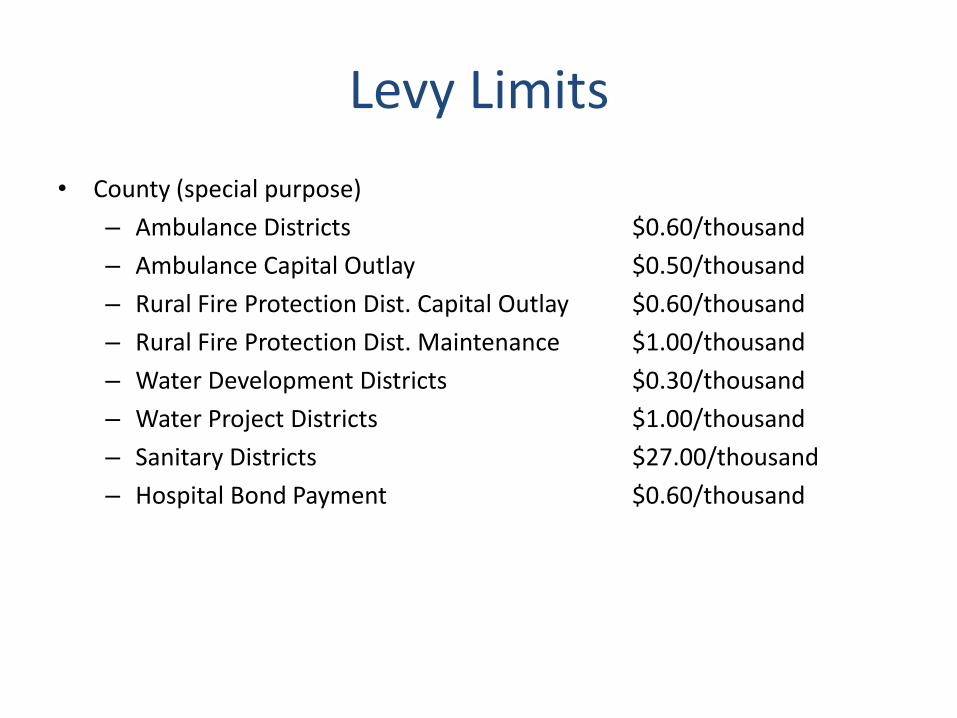
Levy Limits
• County (special purpose)
– Ambulance Districts $0.60/thousand
– Ambulance Capital Outlay $0.50/thousand
– Rural Fire Protection Dist. Capital Outlay $0.60/thousand
– Rural Fire Protection Dist. Maintenance $1.00/thousand
– Water Development Districts $0.30/thousand
– Water Project Districts $1.00/thousand
– Sanitary Districts $27.00/thousand
– Hospital Bond Payment $0.60/thousand

Levy Limits
• Schools
– General
• AG $2.090/thousand
• OO $4.296/thousand
• Other $9.200/thousand
– Bond Redemption sufficient to pay P & I
– Capital Outlay $3.00/thousand
– Liabilities $6.00/thousand
– Pension $0.30/thousand
– Special Ed $1.552/thousand
Levy Limits
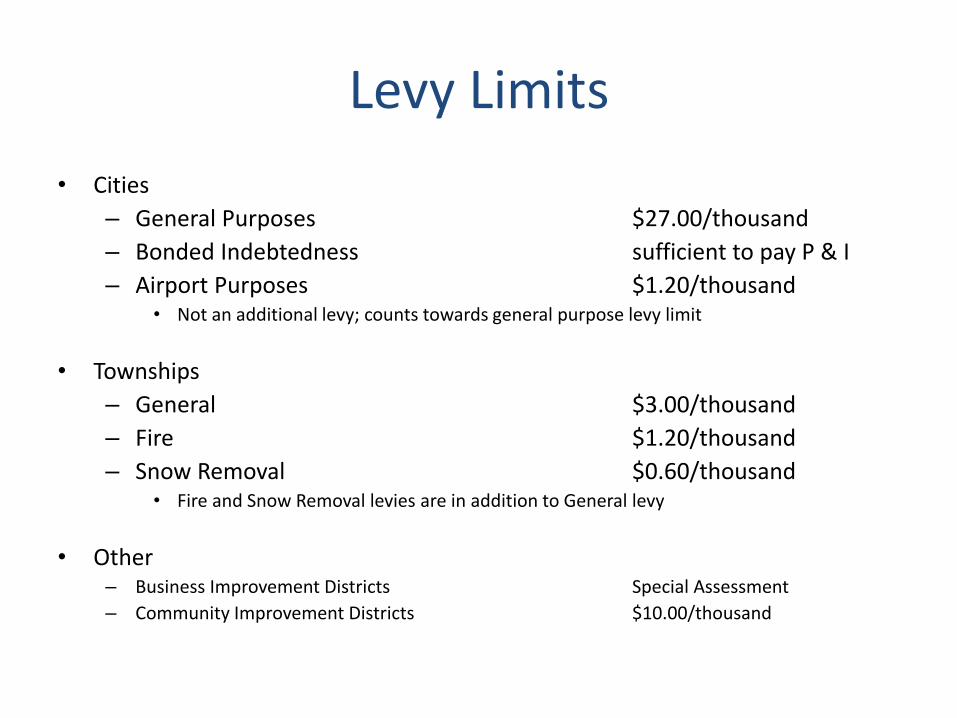
• Cities
– General Purposes $27.00/thousand
– Bonded Indebtedness sufficient to pay P & I
– Airport Purposes $1.20/thousand • Not an additional levy; counts towards general purpose levy limit
• Townships
– General $3.00/thousand
– Fire $1.20/thousand
– Snow Removal $0.60/thousand • Fire and Snow Removal levies are in addition to General levy
• Other – Business Improvement Districts Special Assessment
– Community Improvement Districts $10.00/thousand

Step 4 – Computing the Tax
• Property taxes for individual properties are computed by multiplying the taxable value by the tax (mill) levy. – Example: Taxable value of property is $102,000. The
municipal tax levy is $10 per thousand. Property tax on this property for city purposes would be: • $102,000 x ($10/1,000) = $1,020
• This same computation is performed for each taxing jurisdiction that can tax the property, with the sum of all taxes for each taxing jurisdiction being the total property taxes due on the property.
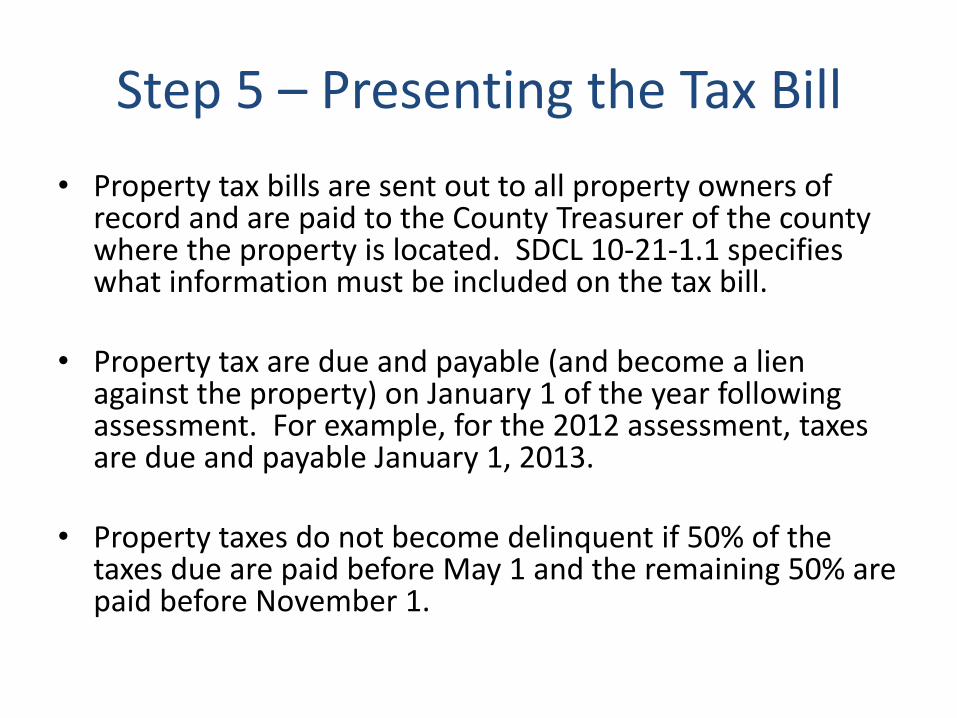
Step 5 – Presenting the Tax Bill
• Property tax bills are sent out to all property owners of record and are paid to the County Treasurer of the county where the property is located. SDCL 10-21-1.1 specifies what information must be included on the tax bill.
• Property tax are due and payable (and become a lien
against the property) on January 1 of the year following assessment. For example, for the 2012 assessment, taxes are due and payable January 1, 2013.
• Property taxes do not become delinquent if 50% of the
taxes due are paid before May 1 and the remaining 50% are paid before November 1.
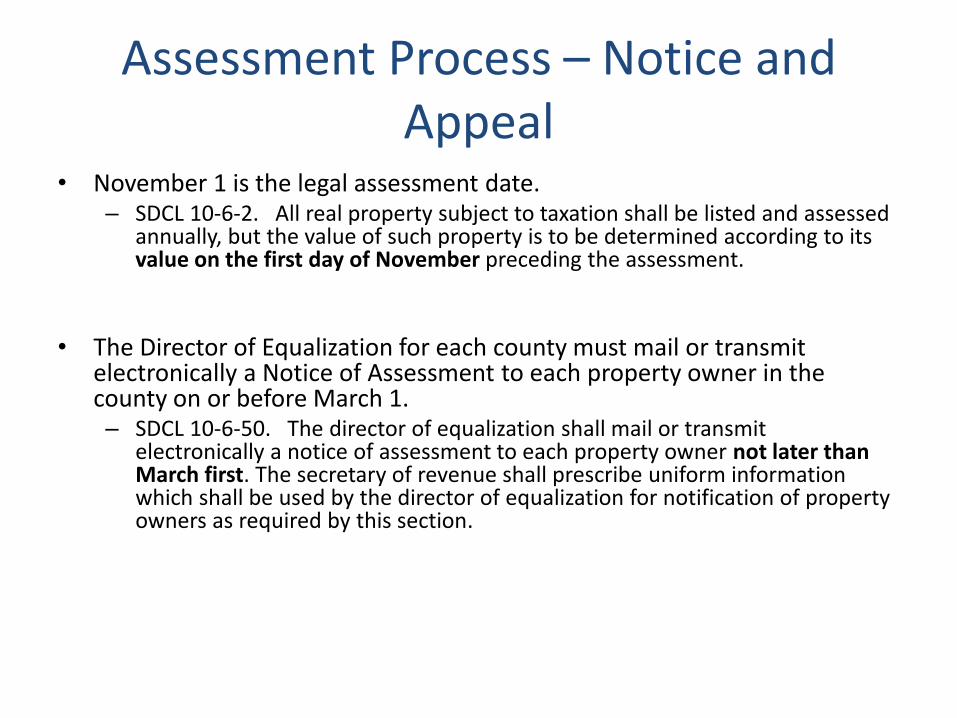
Assessment Process – Notice and Appeal
• November 1 is the legal assessment date. – SDCL 10-6-2. All real property subject to taxation shall be listed and assessed
annually, but the value of such property is to be determined according to its value on the first day of November preceding the assessment.
• The Director of Equalization for each county must mail or transmit electronically a Notice of Assessment to each property owner in the county on or before March 1. – SDCL 10-6-50. The director of equalization shall mail or transmit
electronically a notice of assessment to each property owner not later than March first. The secretary of revenue shall prescribe uniform information which shall be used by the director of equalization for notification of property owners as required by this section.

Assessment Process – Notice and Appeal
• Appeal process – Local Board of Equalization (township board of supervisors or
governing body of municipality, plus a member of the school board). Appeal by mid-March; decision by end of March.
– County Board of Equalization (county commissioners) hears appeals from local board decisions and appeals from property owners in unorganized territories. Appeal by first week of April; decision by first week of May.
– Consolidated Board of Equalization (in lieu of Local & County Boards) – Office of Hearing Examiners (OHE). Appeal by mid-May. – Circuit Court
• Appeal from County or Consolidated Board of Equalization must be made within thirty days of the published notice as required by SDCL 10-11-26.1 or the written notice that has been served on the property owner.
• Appeal from OHE must be made within thirty days from receiving notice of OHE decision.
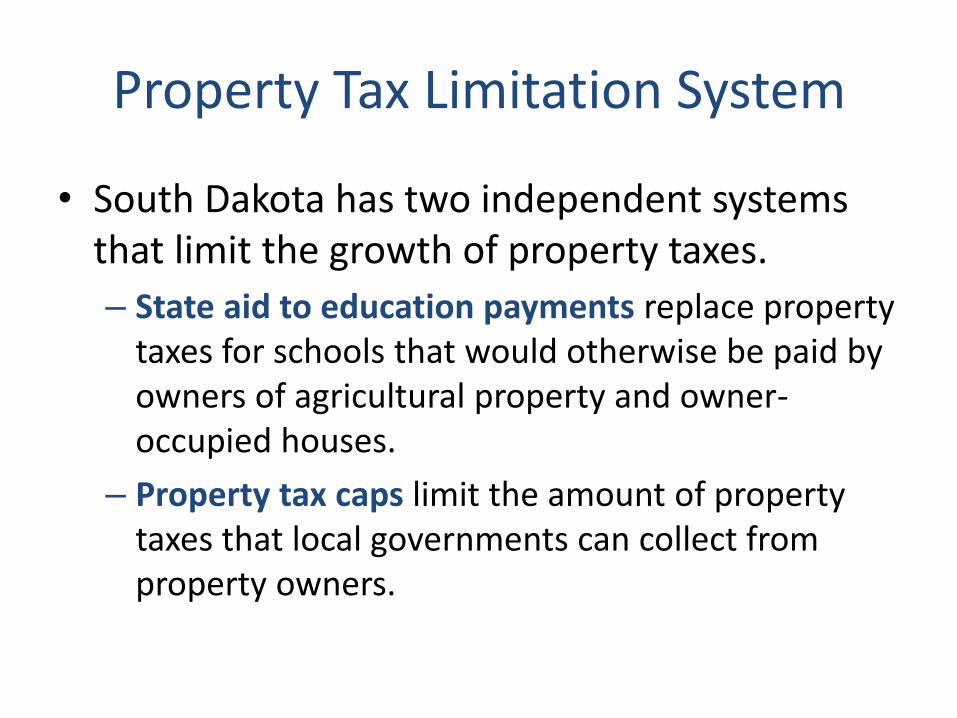
Property Tax Limitation System
• South Dakota has two independent systems that limit the growth of property taxes.
– State aid to education payments replace property taxes for schools that would otherwise be paid by owners of agricultural property and owner-occupied houses.
– Property tax caps limit the amount of property taxes that local governments can collect from property owners.

Property Tax Limitation System
• Property tax caps (continued) – Local governments are limited to the amount of property
taxes they collected the prior year, PLUS an increase for inflation based upon the consumer price index or 3%, whichever is less, and growth (new construction within the taxing jurisdiction). • Example:
– Municipality has a total property valuation of $100 million and collected $300,000 in property taxes by imposing a 3 mill tax levy last year. Current year CPI is 2% and residential development added $1 million of new value (growth). Values of existing properties increased to $109 million.
– Municipality can increase its prior year tax request by 3% (2% for CPI + 1% for growth), or $9,000, for a total current year request of $309,000.
– To prevent going over the cap, the tax rate applied to the $110 million of property in the municipality ($109 million of existing value + $1 million of new growth) would be automatically lowered from 3 mills to 2.81 mills ($309,000/110,000,000) x 1,000 = 2.81 per thousand)
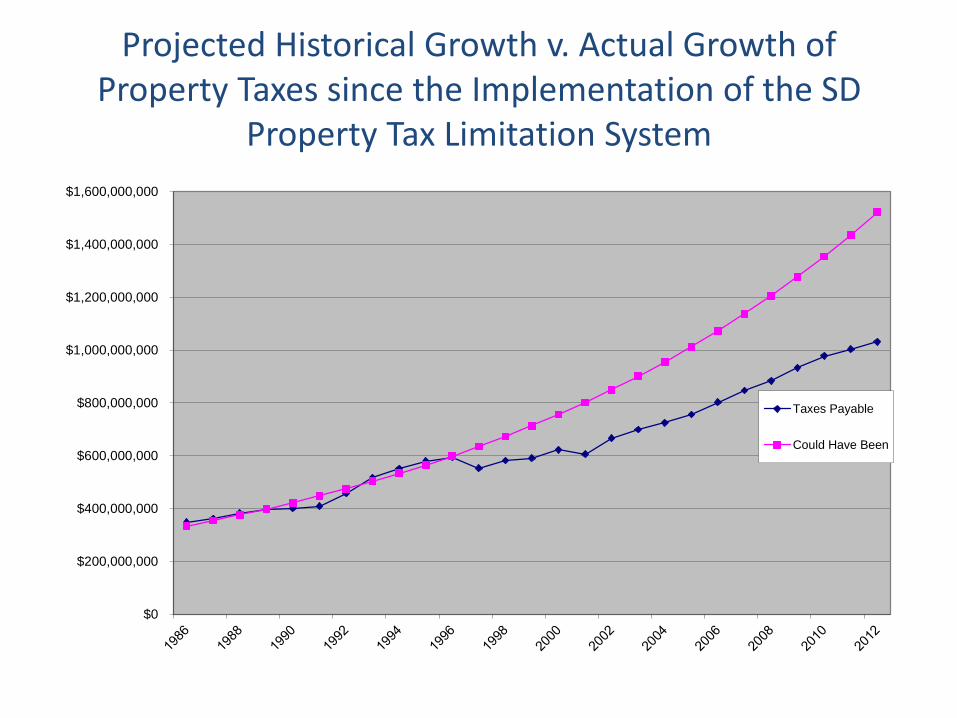
Projected Historical Growth v. Actual Growth of Property Taxes since the Implementation of the SD
Property Tax Limitation System
$0
$200,000,000
$400,000,000
$600,000,000
$800,000,000
$1,000,000,000
$1,200,000,000
$1,400,000,000
$1,600,000,000
Taxes Payable
Could Have Been
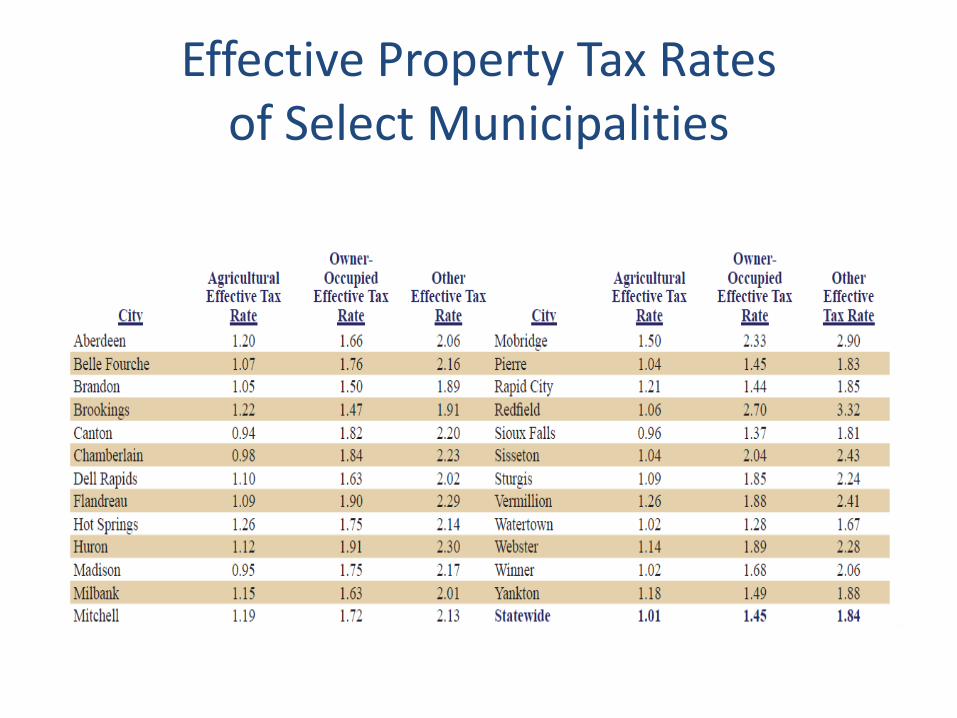
Effective Property Tax Rates of Select Municipalities

Valuations by Category For Taxes Payable in Agricultural * % of Total Owner-Occupied % of Total Commercial % of Total Utilities % of Total TOTAL
1994 8,850,851,599 41.12 11,836,674,785 55.00 835,128,505 3.88 21,522,654,889
1995 9,356,952,742 40.53 12,837,129,438 55.60 894,913,766 3.88 23,088,995,946
1996 9,666,008,672 39.32 14,023,290,094 57.05 892,925,717 3.63 24,582,224,483
1997 9,259,272,144 37.93 7,858,629,904 32.19 6,303,119,711 25.82 993,262,603 4.07 24,414,284,362
1998 9,700,112,744 37.40 9,031,445,601 34.82 6,222,551,169 23.99 982,426,625 3.79 25,936,536,139
1999 10,114,313,818 36.92 9,654,685,197 35.24 6,580,244,560 24.02 1,045,087,867 3.81 27,394,331,442
2000 10,759,050,990 36.65 10,400,962,518 35.43 7,072,312,159 24.09 1,125,213,808 3.83 29,357,539,475
2001 11,062,162,236 35.93 11,177,769,905 36.30 7,445,797,194 24.18 1,106,170,590 3.59 30,791,899,925
2002 11,549,861,305 35.68 11,934,525,973 36.87 7,753,707,599 23.95 1,134,307,137 3.50 32,372,402,014
2003 12,277,695,126 35.43 13,038,052,643 37.62 8,212,742,597 23.70 1,126,545,169 3.25 34,655,035,535
2004 13,085,504,017 35.07 14,269,607,712 38.25 8,811,374,289 23.62 1,141,657,751 3.06 37,308,143,769
2005 14,015,749,247 35.03 15,523,846,537 38.79 9,362,992,929 23.40 1,113,225,824 2.78 40,015,814,537
2006 15,097,290,060 34.80 16,954,988,100 39.08 10,238,689,250 23.60 1,093,714,459 2.52 43,384,681,869
2007 16,427,689,981 34.54 18,633,455,339 39.18 11,336,818,639 23.84 1,158,792,774 2.44 47,556,756,733
2008 17,688,985,934 34.23 20,353,223,881 39.39 12,504,672,828 24.20 1,124,579,669 2.18 51,671,462,309
2009 19,058,117,169 34.49 21,687,103,039 39.25 13,334,072,762 24.13 1,169,829,792 2.12 55,249,122,762
2010 19,690,137,457 34.11 22,768,420,477 39.44 14,051,480,469 24.34 1,222,801,442 2.12 57,732,839,845
2011 19,691,529,066 33.38 23,726,031,354 40.22 14,345,035,001 24.32 1,222,426,811 2.07 58,985,022,232
2012 21,198,601,461 34.84 24,168,972,982 39.72 14,186,603,573 23.32 1,289,522,163 2.12 60,843,700,179
* Agricultural value includes AGY value for Pay 1995 thru pay 1998; includes NA-Z value for pay 2000 to present
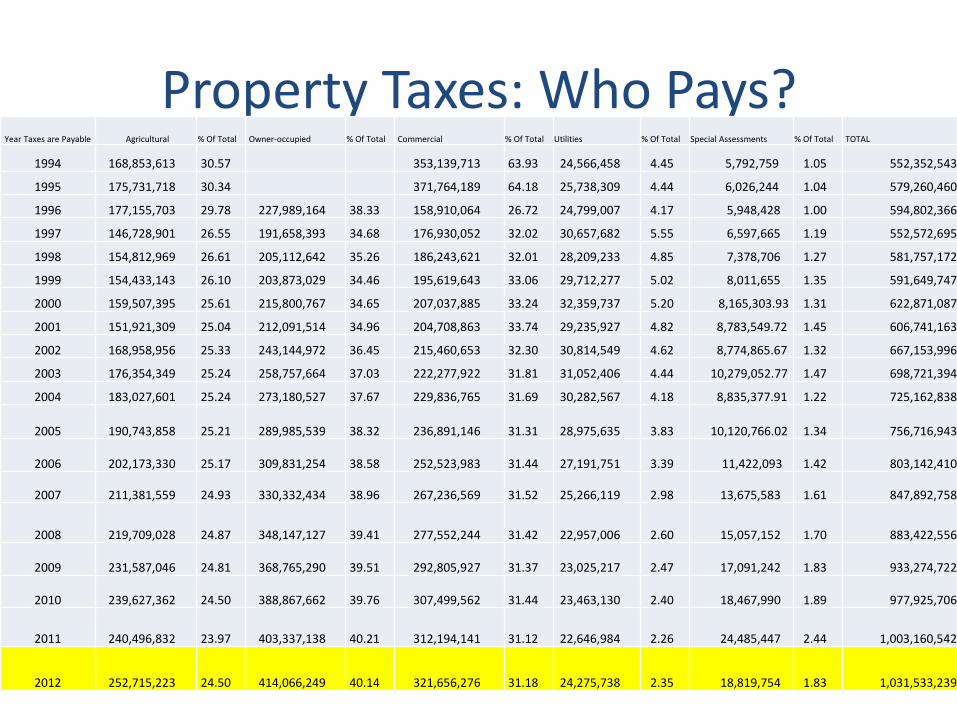
Property Taxes: Who Pays? Year Taxes are Payable Agricultural % Of Total Owner-occupied % Of Total Commercial % Of Total Utilities % Of Total Special Assessments % Of Total TOTAL
1994 168,853,613 30.57 353,139,713 63.93 24,566,458 4.45 5,792,759 1.05 552,352,543
1995 175,731,718 30.34 371,764,189 64.18 25,738,309 4.44 6,026,244 1.04 579,260,460
1996 177,155,703 29.78 227,989,164 38.33 158,910,064 26.72 24,799,007 4.17 5,948,428 1.00 594,802,366
1997 146,728,901 26.55 191,658,393 34.68 176,930,052 32.02 30,657,682 5.55 6,597,665 1.19 552,572,695
1998 154,812,969 26.61 205,112,642 35.26 186,243,621 32.01 28,209,233 4.85 7,378,706 1.27 581,757,172
1999 154,433,143 26.10 203,873,029 34.46 195,619,643 33.06 29,712,277 5.02 8,011,655 1.35 591,649,747
2000 159,507,395 25.61 215,800,767 34.65 207,037,885 33.24 32,359,737 5.20 8,165,303.93 1.31 622,871,087
2001 151,921,309 25.04 212,091,514 34.96 204,708,863 33.74 29,235,927 4.82 8,783,549.72 1.45 606,741,163
2002 168,958,956 25.33 243,144,972 36.45 215,460,653 32.30 30,814,549 4.62 8,774,865.67 1.32 667,153,996
2003 176,354,349 25.24 258,757,664 37.03 222,277,922 31.81 31,052,406 4.44 10,279,052.77 1.47 698,721,394
2004 183,027,601 25.24 273,180,527 37.67 229,836,765 31.69 30,282,567 4.18 8,835,377.91 1.22 725,162,838
2005 190,743,858 25.21 289,985,539 38.32 236,891,146 31.31 28,975,635 3.83 10,120,766.02 1.34 756,716,943
2006 202,173,330 25.17 309,831,254 38.58 252,523,983 31.44 27,191,751 3.39 11,422,093 1.42
803,142,410
2007 211,381,559 24.93 330,332,434 38.96 267,236,569 31.52 25,266,119 2.98 13,675,583 1.61 847,892,758
2008 219,709,028 24.87 348,147,127 39.41 277,552,244 31.42 22,957,006 2.60 15,057,152 1.70 883,422,556
2009 231,587,046 24.81 368,765,290 39.51 292,805,927 31.37 23,025,217 2.47 17,091,242 1.83
933,274,722
2010 239,627,362 24.50 388,867,662 39.76 307,499,562 31.44 23,463,130 2.40 18,467,990 1.89
977,925,706
2011 240,496,832 23.97 403,337,138 40.21 312,194,141 31.12 22,646,984 2.26 24,485,447 2.44
1,003,160,542
2012 252,715,223 24.50 414,066,249 40.14 321,656,276 31.18 24,275,738 2.35 18,819,754 1.83
1,031,533,239

Property Taxes: Where does the Money Go?
For Taxes Payable In County
% Of Total Municipalities
% Of Total Schools
% Of Total Townships
% Of Total
Special Assessments
% Of Total TOTAL
Pay 1994 118,831,783.00 21.51 55,737,706.00 10.09 363,995,381.00 65.90 7,994,914.00 1.45 5,792,759.00 1.05 552,352,543.00
Pay 1995 117,726,325.00 20.32 58,031,904.00 10.02 388,798,272.00 67.11 8,761,321.00 1.51 6,026,243.00 1.04 579,344,065.00
Pay 1996 127,707,478.00 21.47 59,501,041.00 10.00 393,055,072.00 66.08 8,590,347.00 1.44 5,948,428.00 1.00 594,802,366.00
Pay 1997 132,306,002.00 23.94 63,030,246.00 11.41 341,703,332.00 61.84 8,935,430.00 1.62 6,597,665.00 1.19 552,572,675.00
Pay 1998 138,413,304.00 23.79 66,159,294.19 11.37 359,703,611.50 61.83 10,102,256.60 1.74 7,378,706.13 1.27 581,757,172.42
Pay 1999 142,493,545.00 24.08 69,357,020.00 11.72 361,591,363.00 61.12 10,196,165.00 1.72 8,011,655.00 1.35 591,649,748.00
Pay 2000 147,698,194.74 23.71 72,234,893.06 11.60 384,503,303.42 61.73 10,269,391.49 1.65 8,165,303.93 1.31 622,871,086.64
Pay 2001 154,771,961.70 25.51 76,628,849.91 12.63 356,034,460.32 58.68 10,522,341.59 1.73 8,783,549.72 1.45 606,741,163.24
Pay 2002 165,080,172.03 24.74 81,296,731.49 12.19 400,493,843.04 60.03 11,508,383.36 1.72 8,774,865.67 1.32 667,153,995.59
Pay 2003 172,099,578.94 24.63 87,349,215.83 12.50 417,257,622.78 59.72 11,735,923.42 1.68 10,279,052.77 1.47 698,721,393.74
Pay 2004 182,029,759.26 25.10 92,005,242.69 12.69 430,465,019.66 59.36 11,827,438.59 1.63 8,835,377.91 1.22 725,162,838.11
Pay 2005 190,946,758.72 25.23 96,379,649.03 12.74 447,203,111.42 59.10 12,066,658.19 1.59 10,120,766.02 1.34 756,716,943.38
Pay 2006 201,763,441.09 25.12 102,625,075.87 12.78 475,005,461.62 59.14 12,326,338.96 1.53 11,422,092.91 1.42 803,142,410.45
Pay 2007 215,590,026.65 25.43 109,964,078.76 12.97 495,863,785.67 58.48 12,798,789.29 1.51 13,675,583.33 1.61 847,892,263.70
Pay 2008 231,487,473.04 26.20 116,772,551.54 13.22 506,618,292.21 57.35 13,487,087.45 1.53 15,057,151.84 1.70 883,422,556.08
Pay 2009 248,284,680.43 26.60 124,481,492.41 13.34 529,246,426.25 56.71 14,170,890.82 1.52 17,091,241.72 1.83 933,274,721.63
Pay 2010 267,475,362.85 27.35 131,066,116.47 13.40 546,181,893.81 55.85 14,734,342.49 1.51 18,467,990.01 1.89 977,925,705.63
Pay 2011 268,440,561.66 26.76 133,749,585.87 13.33 560,022,921.76 55.83 16,462,025.96 1.64 24,485,446.59 2.44 1,003,160,541.84
Pay 2012 281,180,298.77 27.26 139,272,205.75 13.50 574,213,936.82 55.67 18,047,044.42 1.75 18,819,753.71 1.82 1,031,533,239.44