properties of matter - mrlittlescience.com · + ratio of masses in a pure sample ... simplest...
TRANSCRIPT

+
Big Idea #1
Properties of Matter

+ Ratio of Masses in a Pure Sample
All elements and molecules
are made up of atoms
Substances with the same
atomic makeup will have same
average masses
The ratio of masses of the same
substance is independent of
size of the substance
Molecules with the same
atomic makeup (ex: H2O) will
have the same ratio of average
atomic masses
H2O2 ratio would be different
than H2O due to the different
chemical makeup
LO 1.1: Justify the observation that the ratio of the masses of the constituent elements
in any pure sample of that compound is always identical on the basis of the atomic
molecular theory.
Source
Video
H2O
108 g/mol
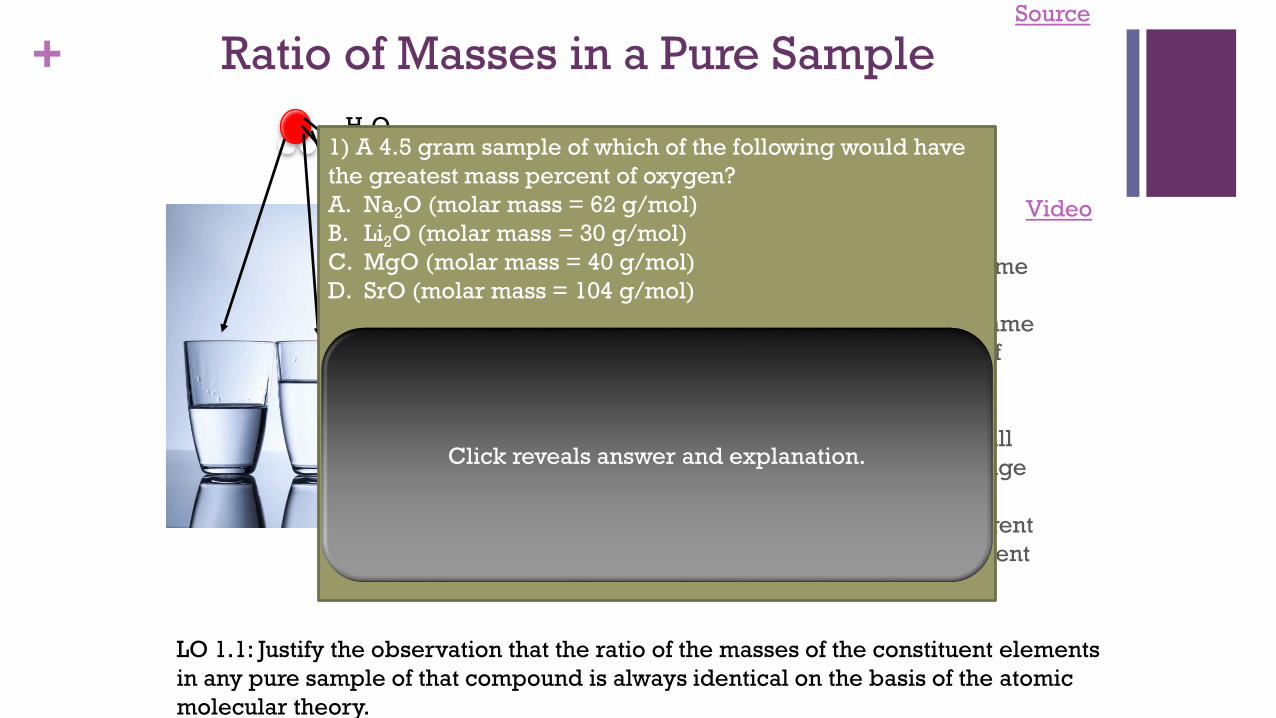
1) A 4.5 gram sample of which of the following would have
the greatest mass percent of oxygen?
A. Na2O (molar mass = 62 g/mol)
B. Li2O (molar mass = 30 g/mol)
C. MgO (molar mass = 40 g/mol)
D. SrO (molar mass = 104 g/mol)
Answer:
A. 16/62 x 100 = 26 %
B. 16/30 x 100 = 53%
C. 16/40 x 100 = 40%
D. 16/104 x 100 = 15%
Click reveals answer and explanation.

+ Ratio of Masses in a Pure Sample
All elements and molecules
are made up of atoms
Substances with the same
atomic makeup will have same
average masses
The ratio of masses of the same
substance is independent of
size of the substance
Molecules with the same
atomic makeup (ex: H2O) will
have the same ratio of average
atomic masses
H2O2 ratio would be different
than H2O due to the different
chemical makeup
LO 1.1: Justify the observation that the ratio of the masses of the constituent elements
in any pure sample of that compound is always identical on the basis of the atomic
molecular theory.
Source
Video
H2O
108 g/mol
1) A 4.5 gram sample of which of the following would have
the greatest mass percent of oxygen?
A. Na2O (molar mass = 62 g/mol)
B. Li2O (molar mass = 30 g/mol)
C. MgO (molar mass = 40 g/mol)
D. SrO (molar mass = 104 g/mol)
Answer:
A. 16/62 x 100 = 26 %
B. 16/30 x 100 = 53%
C. 16/40 x 100 = 40%
D. 16/104 x 100 = 15%

+ Composition of Pure Substances
and/or Mixtures Percent mass can be used to
determine the composition of a
substance
% mass can also be used to
find the empirical formula
The empirical formula is the
simplest formula of a
substance
It is a ratio between the
moles of each element in the
substance
Quick steps to solve!
% to mass, mass to moles,
divide by the smallest and
multiply ‘til whole!)
The molecular formula is the
actual formula of a substance
It is a whole number
multiple of the empirical
formula
LO 1.2: Select and apply mathematical routines to mass data to identify or infer the
composition of pure substances and/or mixtures.
Source
Video
Click reveals answer and explanation.
2)

+ Composition of Pure Substances
and/or Mixtures Percent mass can be used to
determine the composition of a
substance
% mass can also be used to
find the empirical formula
The empirical formula is the
simplest formula of a
substance
It is a ratio between the
moles of each element in the
substance
Quick steps to solve!
% to mass, mass to moles,
divide by the smallest and
multiply ‘til whole!)
The molecular formula is the
actual formula of a substance
It is a whole number
multiple of the empirical
formula
LO 1.2: Select and apply mathematical routines to mass data to identify or infer the
composition of pure substances and/or mixtures.
Source
Video
2)
+ Identifying Purity of a Substance
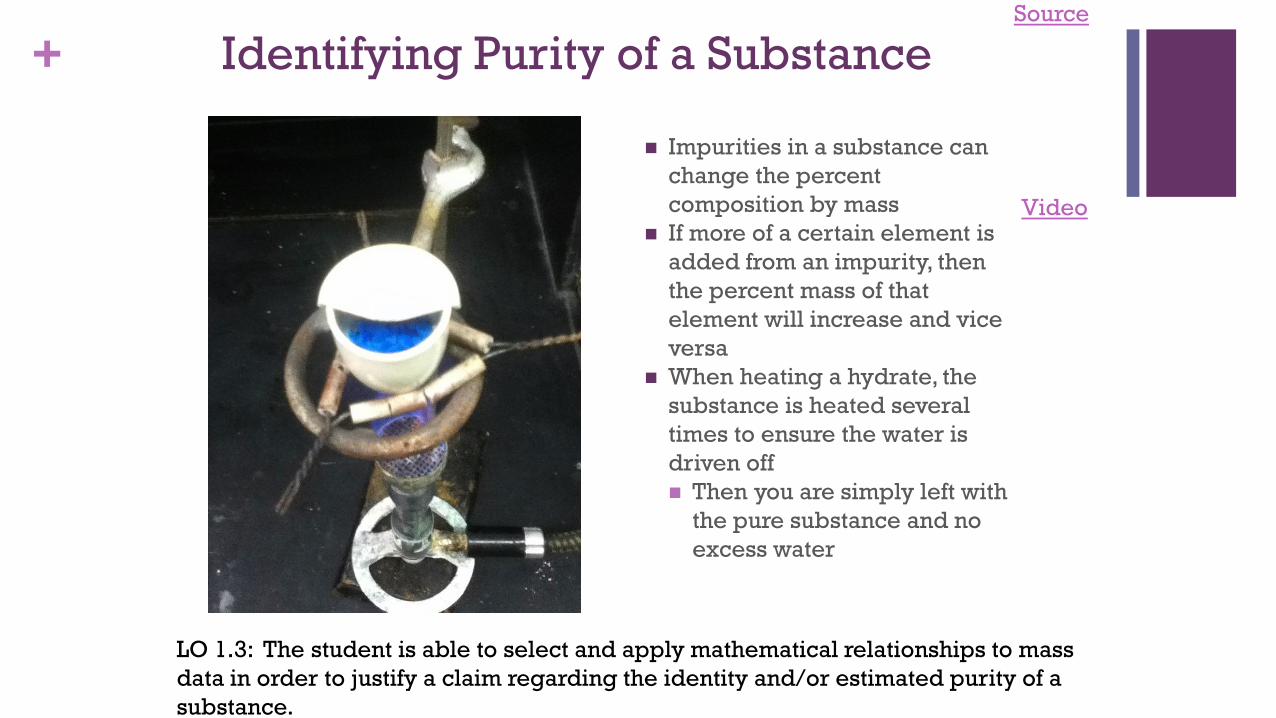
Impurities in a substance can
change the percent
composition by mass
If more of a certain element is
added from an impurity, then
the percent mass of that
element will increase and vice
versa
When heating a hydrate, the
substance is heated several
times to ensure the water is
driven off
Then you are simply left with
the pure substance and no
excess water
LO 1.3: The student is able to select and apply mathematical relationships to mass
data in order to justify a claim regarding the identity and/or estimated purity of a
substance.
Source
Video
+ Identifying Purity of a Substance
Impurities in a substance can
change the percent
composition by mass
If more of a certain element is
added from an impurity, then
the percent mass of that
element will increase and vice
versa
When heating a hydrate, the
substance is heated several
times to ensure the water is
driven off
Then you are simply left with
the pure substance and no
excess water
LO 1.3: The student is able to select and apply mathematical relationships to mass
data in order to justify a claim regarding the identity and/or estimated purity of a
substance.
Source
Video
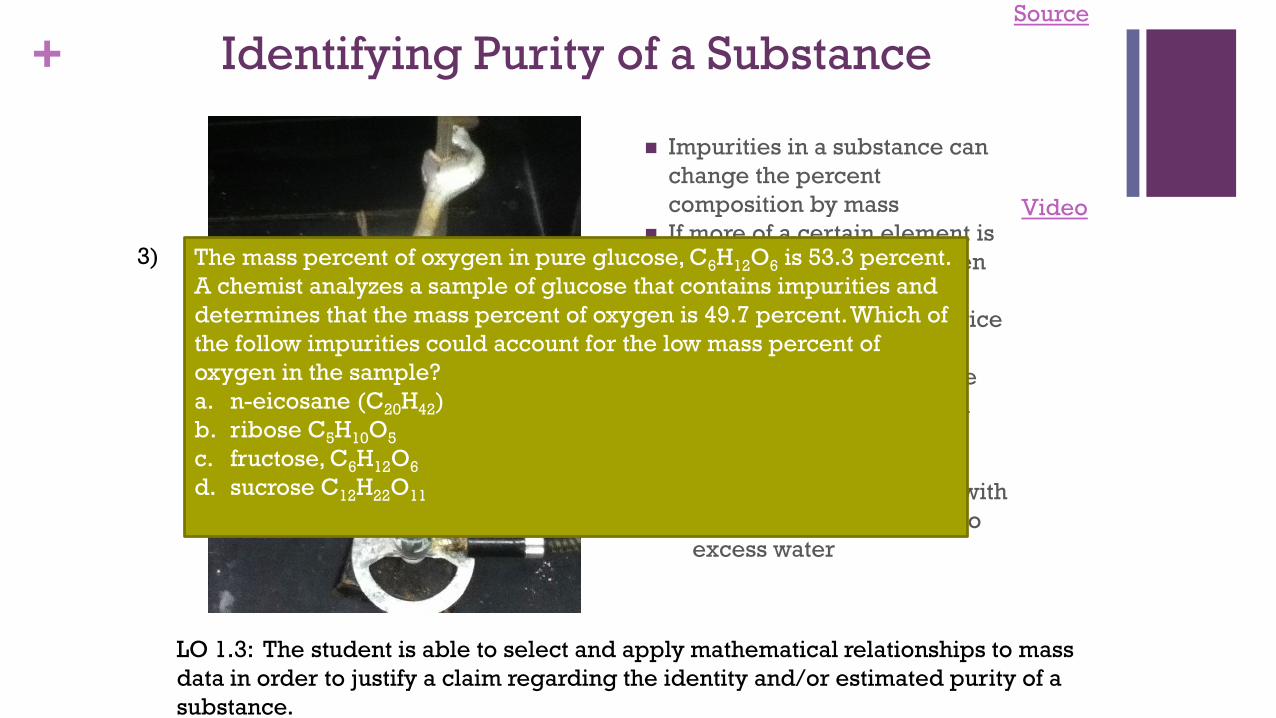
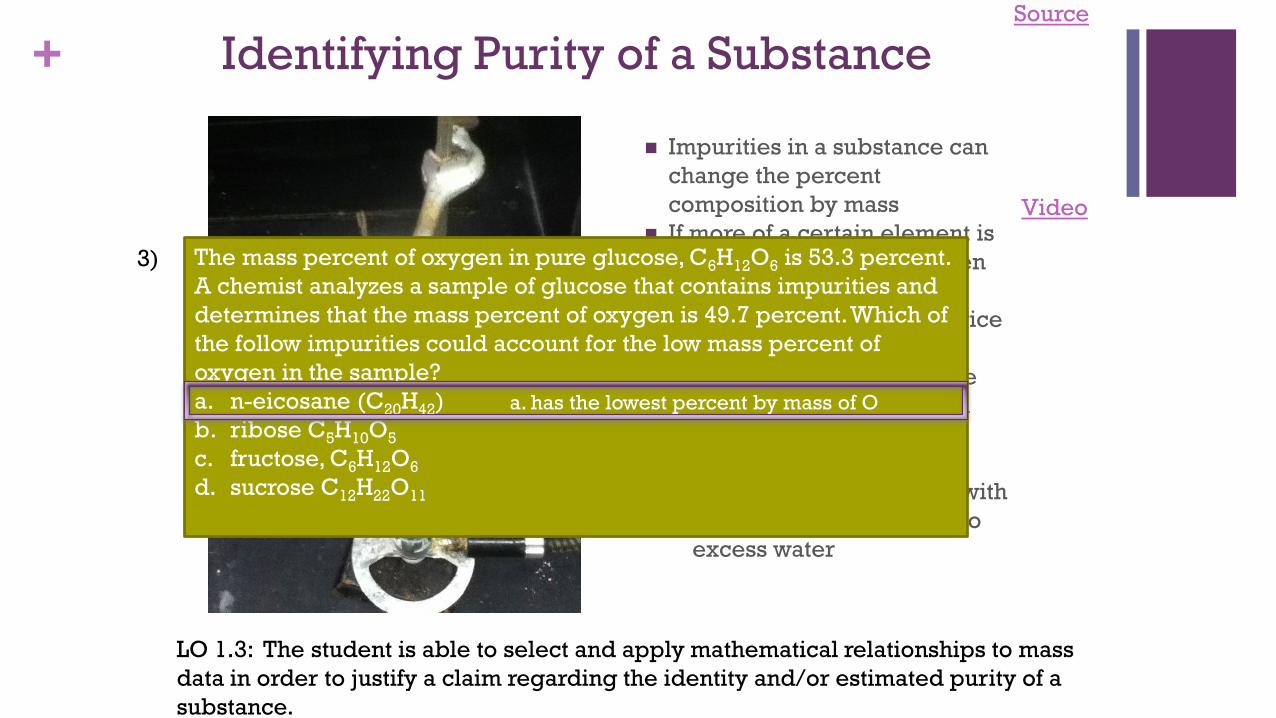
The mass percent of oxygen in pure glucose, C6H12O6 is 53.3 percent.
A chemist analyzes a sample of glucose that contains impurities and
determines that the mass percent of oxygen is 49.7 percent. Which of
the follow impurities could account for the low mass percent of
oxygen in the sample?
a. n-eicosane (C20H42)
b. ribose C5H10O5
c. fructose, C6H12O6
d. sucrose C12H22O11
3)
+ Identifying Purity of a Substance
Impurities in a substance can
change the percent
composition by mass
If more of a certain element is
added from an impurity, then
the percent mass of that
element will increase and vice
versa
When heating a hydrate, the
substance is heated several
times to ensure the water is
driven off
Then you are simply left with
the pure substance and no
excess water
LO 1.3: The student is able to select and apply mathematical relationships to mass
data in order to justify a claim regarding the identity and/or estimated purity of a
substance.
Source
Video
The mass percent of oxygen in pure glucose, C6H12O6 is 53.3 percent.
A chemist analyzes a sample of glucose that contains impurities and
determines that the mass percent of oxygen is 49.7 percent. Which of
the follow impurities could account for the low mass percent of
oxygen in the sample?
a. n-eicosane (C20H42)
b. ribose C5H10O5
c. fructose, C6H12O6
d. sucrose C12H22O11
a. has the lowest percent by mass of O
3)
+ Mole Calculations
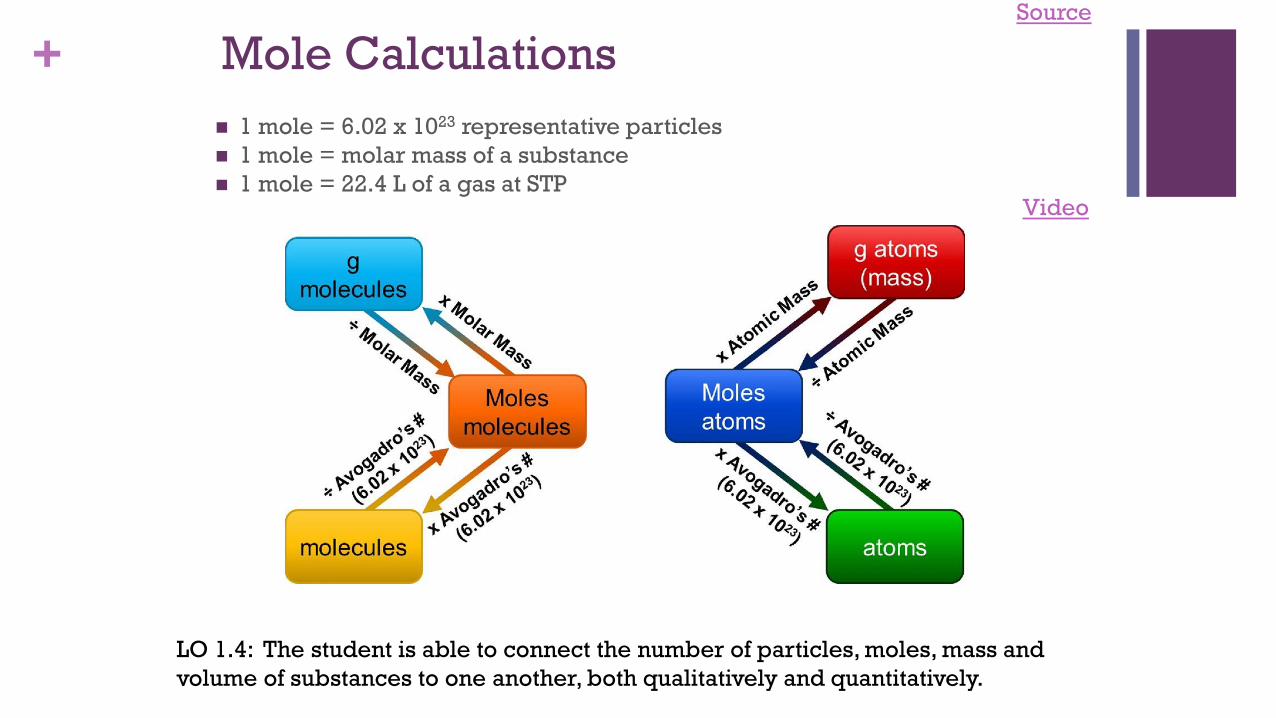
1 mole = 6.02 x 10²³ representative particles
1 mole = molar mass of a substance
1 mole = 22.4 L of a gas at STP
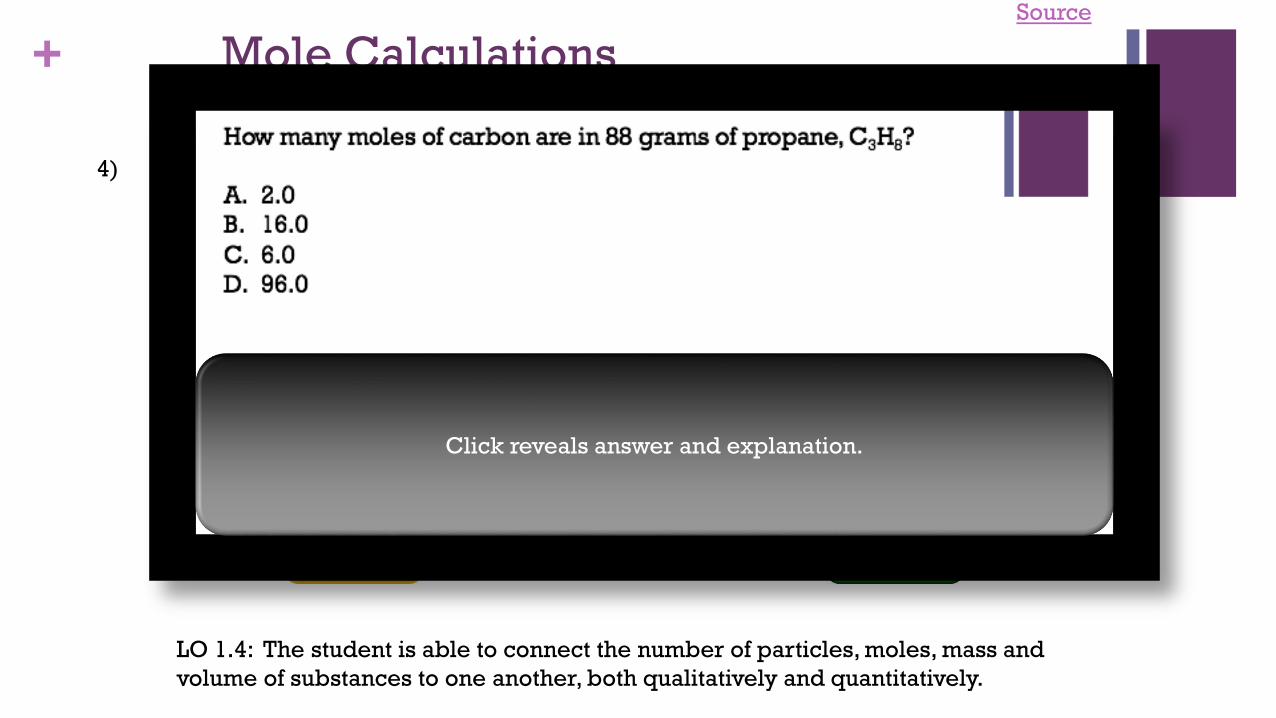
LO 1.4: The student is able to connect the number of particles, moles, mass and
volume of substances to one another, both qualitatively and quantitatively.
Source
Video
+ Mole Calculations
1 mole = 6.02 x 10²³ representative particles
1 mole = molar mass of a substance
1 mole = 22.4 L of a gas at STP
LO 1.4: The student is able to connect the number of particles, moles, mass and
volume of substances to one another, both qualitatively and quantitatively.
Source
Video
Click reveals answer and explanation.
4)

+ Mole Calculations
1 mole = 6.02 x 10²³ representative particles
1 mole = molar mass of a substance
1 mole = 22.4 L of a gas at STP
LO 1.4: The student is able to connect the number of particles, moles, mass and
volume of substances to one another, both qualitatively and quantitatively.
Source
Video
4)

+ Electronic Structure of the Atom:
Electron Configurations
Electrons occupy orbitals whose
energy level depends on the
nuclear charge and average
distance to the nucleus
Electron configurations & orbital
diagrams indicate the
arrangement of electrons with the
lowest energy (most stable):
Electrons occupy lowest
available energy levels
A maximum of two electrons
may occupy an energy level
Each must have opposite
spin (±½)
In orbitals of equal energy,
electrons maximize parallel
unpaired spins
LO 1.5: The student is able to explain the distribution of electrons in an atom or ion
based upon data.
Source
Video
Click reveals answer and explanation.
5)

+ Electronic Structure of the Atom:
Electron Configurations
Electrons occupy orbitals whose
energy level depends on the
nuclear charge and average
distance to the nucleus
Electron configurations & orbital
diagrams indicate the
arrangement of electrons with the
lowest energy (most stable):
Electrons occupy lowest
available energy levels
A maximum of two electrons
may occupy an energy level
Each must have opposite
spin (±½)
In orbitals of equal energy,
electrons maximize parallel
unpaired spins
LO 1.5: The student is able to explain the distribution of electrons in an atom or ion
based upon data.
Source
Video
5)

+ Electronic Structure of the Atom:
1st Ionization Energy
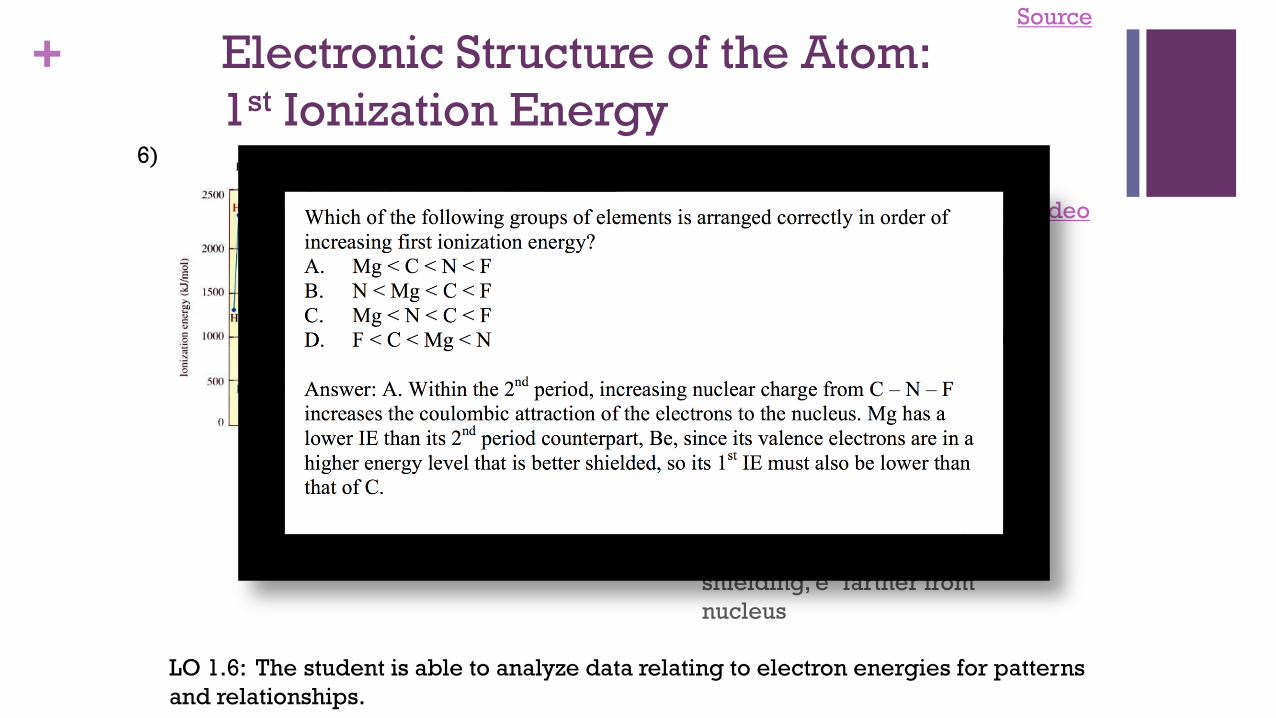
1st Ionization Energy (IE) indicates
the strength of the coulombic
attraction of the outermost, easiest
to remove, electron to the nucleus:
X(g) + IE X+(g) + e–
1st IE generally increases across
a period and decreases down a
group
IE generally increases as
#protons increases in same
energy level
IE decreases as e– in higher
energy level: increased
shielding, e– farther from
nucleus
LO 1.6: The student is able to analyze data relating to electron energies for patterns
and relationships.
Source
Video

+ Electronic Structure of the Atom:
1st Ionization Energy
1st Ionization Energy (IE) indicates
the strength of the coulombic
attraction of the outermost, easiest
to remove, electron to the nucleus:
X(g) + IE X+(g) + e–
1st IE generally increases across
a period and decreases down a
group
IE generally increases as
#protons increases in same
energy level
IE decreases as e– in higher
energy level: increased
shielding, e– farther from
nucleus
LO 1.6: The student is able to analyze data relating to electron energies for patterns
and relationships.
Source
Video
Click reveals answer and explanation.
6)
+ Electronic Structure of the Atom:
1st Ionization Energy
1st Ionization Energy (IE) indicates
the strength of the coulombic
attraction of the outermost, easiest
to remove, electron to the nucleus:
X(g) + IE X+(g) + e–
1st IE generally increases across
a period and decreases down a
group
IE generally increases as
#protons increases in same
energy level
IE decreases as e– in higher
energy level: increased
shielding, e– farther from
nucleus
LO 1.6: The student is able to analyze data relating to electron energies for patterns
and relationships.
Source
Video
6)

+ Electronic Structure of the Atom:
Photoelectron Spectroscopy (PES)
PES uses high-energy (X-ray)
photon to excite random e– from
atom
KE of ejected electron indicates
binding energy (coulombic
attraction) to nucleus:
BE = hvphoton – KE
Direct measurement of energy
and number of each electron
Lower energy levels have
higher BE
Signal size proportional to
number of e– in energy level
Elements with more protons have
stronger coulombic attraction,
higher BE at each energy level
LO 1.7: The student is able to describe the electronic structure of the atom, using PES
data, ionization energy data, and/or Coulomb’s law to construct explanations of how
the energies of electrons within shells in atoms vary.
Source
Video1s2
2s1
1s2
2s2
2p6
Li
Ne
Click reveals answer and explanation.
7)

+ Electronic Structure of the Atom:
Photoelectron Spectroscopy (PES)
PES uses high-energy (X-ray)
photon to excite random e– from
atom
KE of ejected electron indicates
binding energy (coulombic
attraction) to nucleus:
BE = hvphoton – KE
Direct measurement of energy
and number of each electron
Lower energy levels have
higher BE
Signal size proportional to
number of e– in energy level
Elements with more protons have
stronger coulombic attraction,
higher BE at each energy level
LO 1.7: The student is able to describe the electronic structure of the atom, using PES
data, ionization energy data, and/or Coulomb’s law to construct explanations of how
the energies of electrons within shells in atoms vary.
Source
Video1s2
2s1
1s2
2s2
2p6
Li
Ne
7)
+ Electronic Structure of the Atom:
Higher Ionization Energies
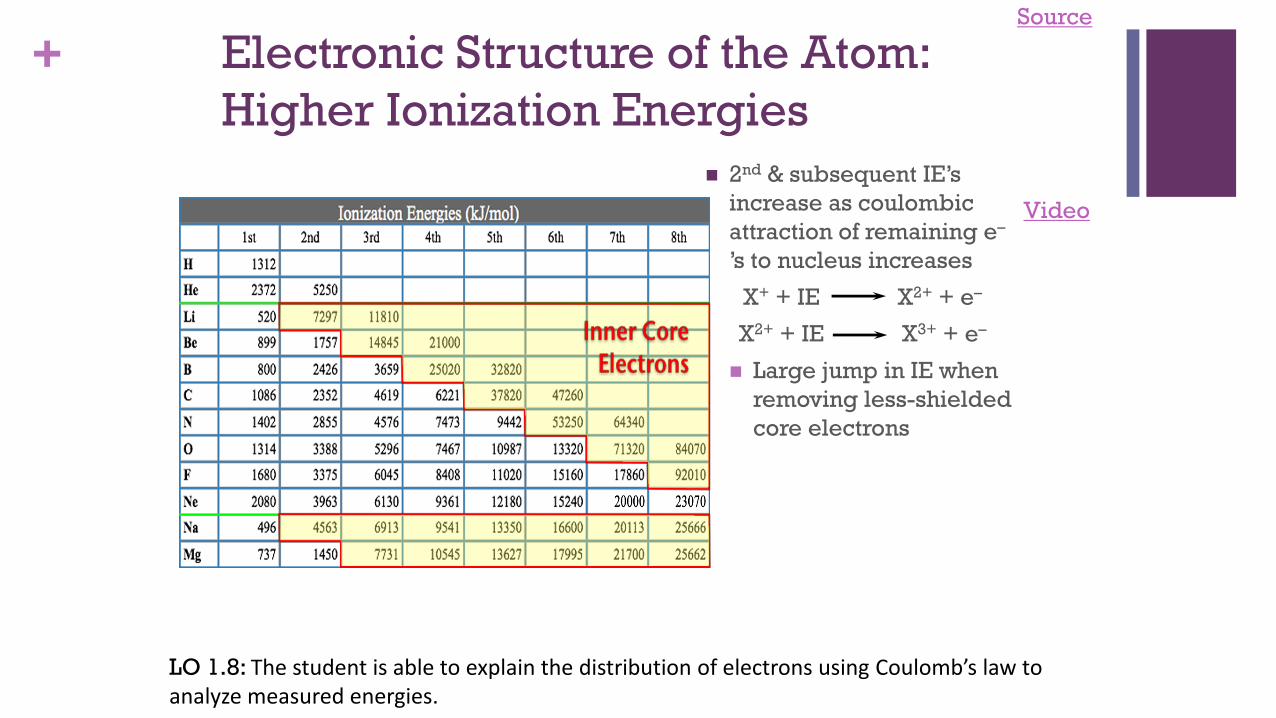
2nd & subsequent IE’s
increase as coulombic
attraction of remaining e–
’s to nucleus increases
X+ + IE X2+ + e–
X2+ + IE X3+ + e–
Large jump in IE when
removing less-shielded
core electrons
LO 1.8: The student is able to explain the distribution of electrons using Coulomb’s law to analyze measured energies.
Source
Video

+ Electronic Structure of the Atom:
Higher Ionization Energies
2nd & subsequent IE’s
increase as coulombic
attraction of remaining e–
’s to nucleus increases
X+ + IE X2+ + e–
X2+ + IE X3+ + e–
Large jump in IE when
removing less-shielded
core electrons
LO 1.8: The student is able to explain the distribution of electrons using Coulomb’s law to analyze measured energies.
Source
Video
Click reveals answer and explanation.
8)

+ Electronic Structure of the Atom:
Higher Ionization Energies
2nd & subsequent IE’s
increase as coulombic
attraction of remaining e–
’s to nucleus increases
X+ + IE X2+ + e–
X2+ + IE X3+ + e–
Large jump in IE when
removing less-shielded
core electrons
LO 1.8: The student is able to explain the distribution of electrons using Coulomb’s law to analyze measured energies.
Source
Video
8)

+ Electronic Structure of the Atom:
1st Ionization Energy Irregularities
1st Ionization Energy Energy (IE)
decreases from Be to B and Mg to
Al
Electron in 2p or 3p shielded by
2s2 or 3s2 electrons, decreasing
coulombic attraction despite
additional proton in nucleus.
Same effect seen in 3d10-4p,
4d10-5p and 5d10-6p
1st Ionization Energy decreases
from N to O and P to S
np4 contains first paired p
electrons, e–-e– repulsion
decreases coulombic attraction
despite additional proton
LO 1.8: The student is able to explain the distribution of electrons using Coulomb’s law to analyze measured energies.
Source
Video
Click reveals answer and explanation.
9)

+ Electronic Structure of the Atom:
1st Ionization Energy Irregularities
1st Ionization Energy Energy (IE)
decreases from Be to B and Mg to
Al
Electron in 2p or 3p shielded by
2s2 or 3s2 electrons, decreasing
coulombic attraction despite
additional proton in nucleus.
Same effect seen in 3d10-4p,
4d10-5p and 5d10-6p
1st Ionization Energy decreases
from N to O and P to S
np4 contains first paired p
electrons, e–-e– repulsion
decreases coulombic attraction
despite additional proton
LO 1.8: The student is able to explain the distribution of electrons using Coulomb’s law to analyze measured energies.
Source
Video
9)

+Predictions with Periodic Trends
The following explains these trends:
Electrons attracted to the protons in the nucleus of an atom
So the closer an electron is to a nucleus, the more strongly it is attracted (Coulomb’s law)
The more protons in a nucleus (effective nuclear force), the more strongly it attracts electrons
Electrons are repelled by other electrons in an atom. If valence electrons are shielded from nucleus by other electrons, you will have less attraction of the nucleus (again Coulomb’s law-greater the atomic radius, the greater the distance)
L.O. 1.9 The student is able to predict and/or justify trends in atomic properties
based on location on periodic table and/or the shell model
Video
Sources
attracts
its
10)

+ Chemical Reactivity Using Trends
Nonmetals have higher electronegativities than metals --> causes the formation of ionic solids
Compounds formed between nonmetals are molecular
Usually gases, liquids, or volatile solids at room temperature
Elements in the 3rd period and below can accommodate a larger number of bonds
The first element in a group (upper most element of a group) forms pi bonds more easily (most significant in 2nd row, non-metals)
Accounts for stronger bonds in molecules containing these elements
Major factor in determining the structures of compounds formed from these elements
Elements in periods 3-6 tend to form only single bonds
Reactivity tends to increase as you go down a group for metals and up a group for non-metals.
L.O. 1.10: Students can justify with evidence the arrangement of the periodic table
and can apply periodic properties to chemical reactivity
Source
Video
Of the elements below,
__________ reacts the most
quickly with water.
A) sodium
B) barium
C) calcium
D) cesium
E) magnesium
11)

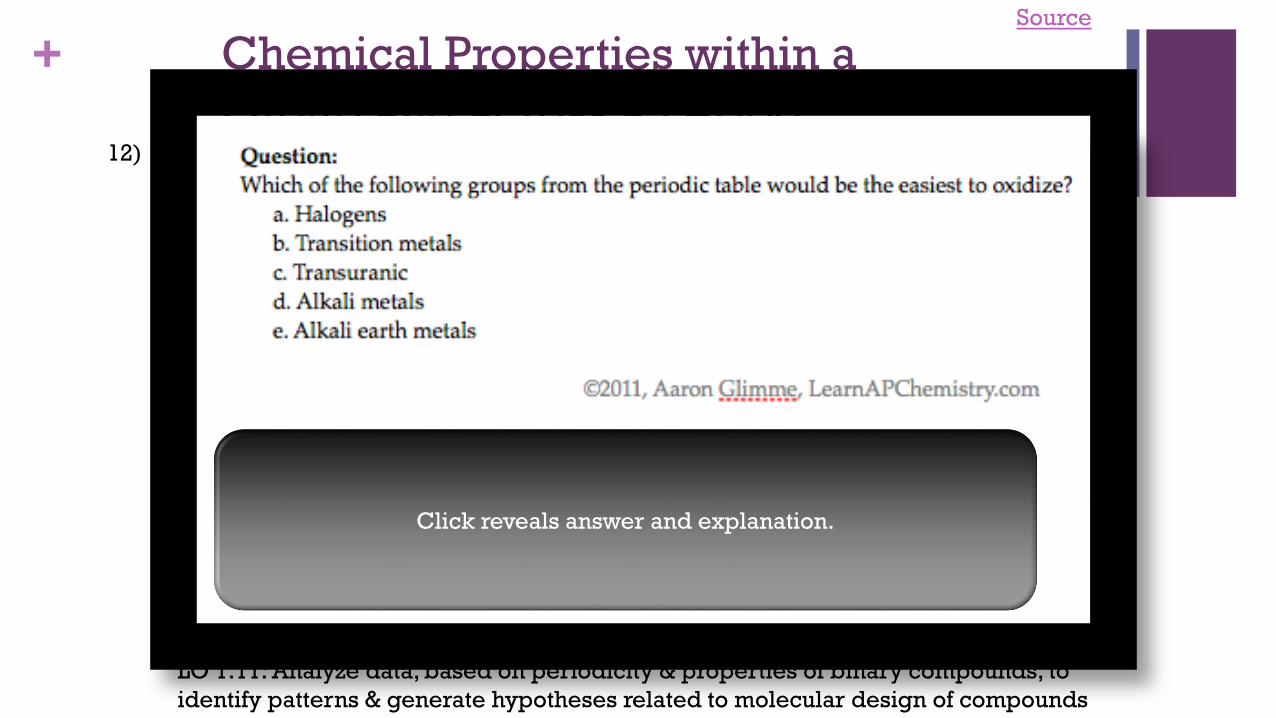
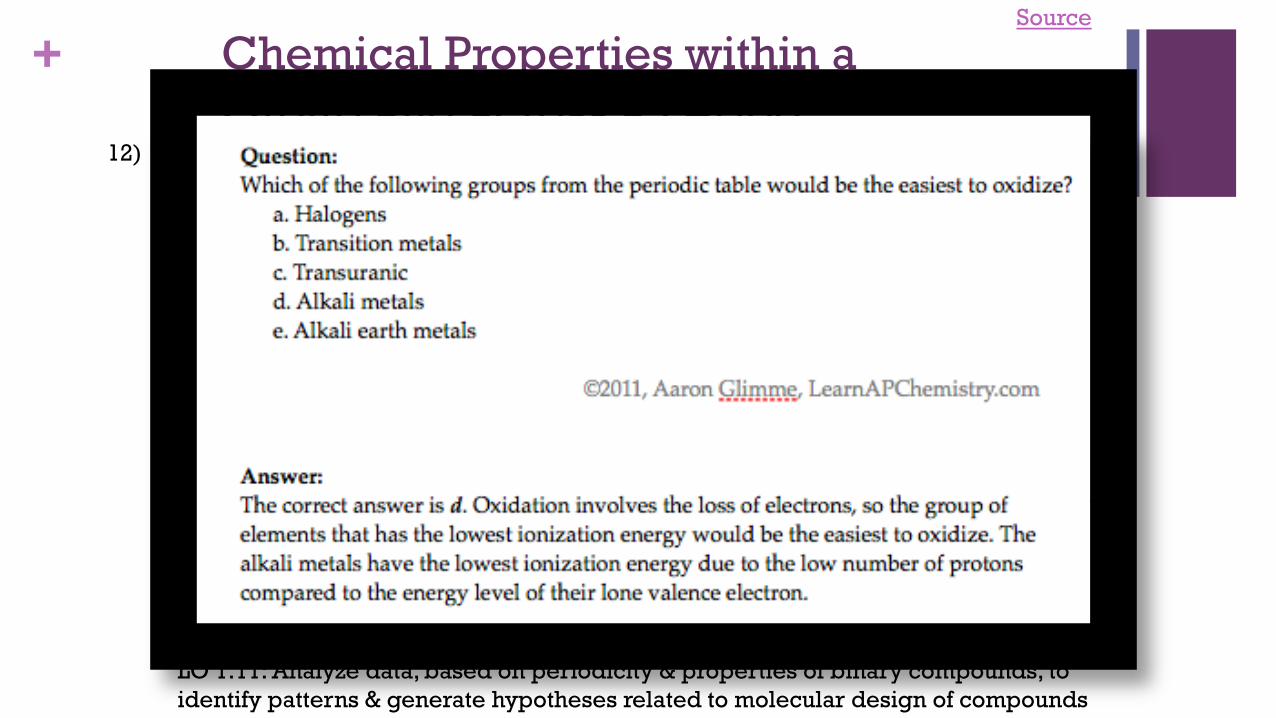
+ Chemical Properties within a
Group and across a Period Group 1 metals more
reactive than group 2
metals
Reactivity increases as you go
down a group
Metals on left form basic
oxides
Ex. Na2O + H2O → 2
NaOH
Nonmetals on right form form
acidic oxides
Ex. SO3 + H2O → H2SO4
Elements in the middle, like Al,
Ga, etc can behave
amphoterically
If SiO2 can be a ceramic then
SnO2 may be as well since
both in the same group
LO 1.11: Analyze data, based on periodicity & properties of binary compounds, to
identify patterns & generate hypotheses related to molecular design of compounds
Source
Video
attracts
its
Click reveals answer and explanation.
12)
+ Chemical Properties within a
Group and across a Period Group 1 metals more
reactive than group 2
metals
Reactivity increases as you go
down a group
Metals on left form basic
oxides
Ex. Na2O + H2O → 2
NaOH
Nonmetals on right form form
acidic oxides
Ex. SO3 + H2O → H2SO4
Elements in the middle, like Al,
Ga, etc can behave
amphoterically
If SiO2 can be a ceramic then
SnO2 may be as well since
both in the same group
LO 1.11: Analyze data, based on periodicity & properties of binary compounds, to
identify patterns & generate hypotheses related to molecular design of compounds
Source
Video
attracts
its
12)

+ Classic Shell Model of Atom vs
Quantum Mechanical ModelDeveloped by Schrodinger and the
position of an electron is now
represented by a wave equation
Most probable place of finding an
electron is called an ORBITAL (90%
probability)
Each orbital can only hold 2 electrons
with opposing spins (S, P, D & F orbitals)
Evidence for this theory:
Work of DeBroglie and PLanck that
electron had wavelike characteristics
Heisenberg Uncertainty Principle -
impossible to predict exact location of
electron- contradicted Bohr
This new evidence caused the Shell
Theory to be replaced by the Quantum
Mechanical Model of the atom
Quantum
Mechanical Model
LO 1.12: Explain why data suggests (or not) the need to refine a model from a
classical shell model with the quantum mechanical model
Source
Video
Developed by Schrodinger and the
position of an electron is now
represented by a wave equation
Most probable place of finding an
electron is called an ORBITAL (90%
probability)
Each orbital can only hold 2 electrons
with opposing spins (S, P, D & F orbitals)
Evidence for this theory:
Work of DeBroglie and Planck that
electron had wavelike characteristics
Heisenberg Uncertainty Principle -
impossible to predict exact location of
electron- contradicted Bohr
This new evidence caused the Shell
Theory to be replaced by the Quantum
Mechanical Model of the atom
Shell Model -
Bohr

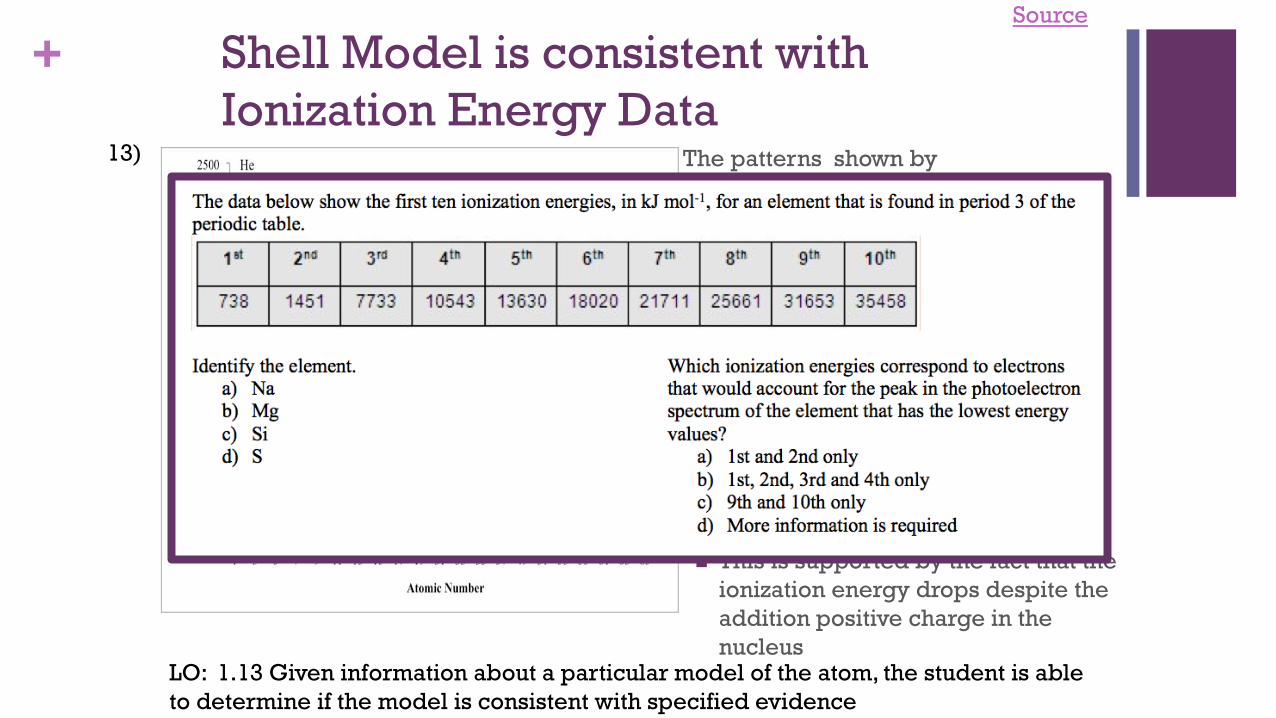
+ Shell Model is consistent with
Ionization Energy DataThe patterns shown by
the IE graph can be
explained by Coulomb’s law
As atomic number increases, would
expect the ionization energy to
constantly increase
Graph shows that this is NOT
observed. WHY NOT?
The data implies that a shell
becomes full at the end of each
period
Therefore the next electron added
must be in a new shell farther away
from the nucleus.
This is supported by the fact that the
ionization energy drops despite the
addition positive charge in the
nucleusLO: 1.13 Given information about a particular model of the atom, the student is able
to determine if the model is consistent with specified evidence
Source
Video
13)
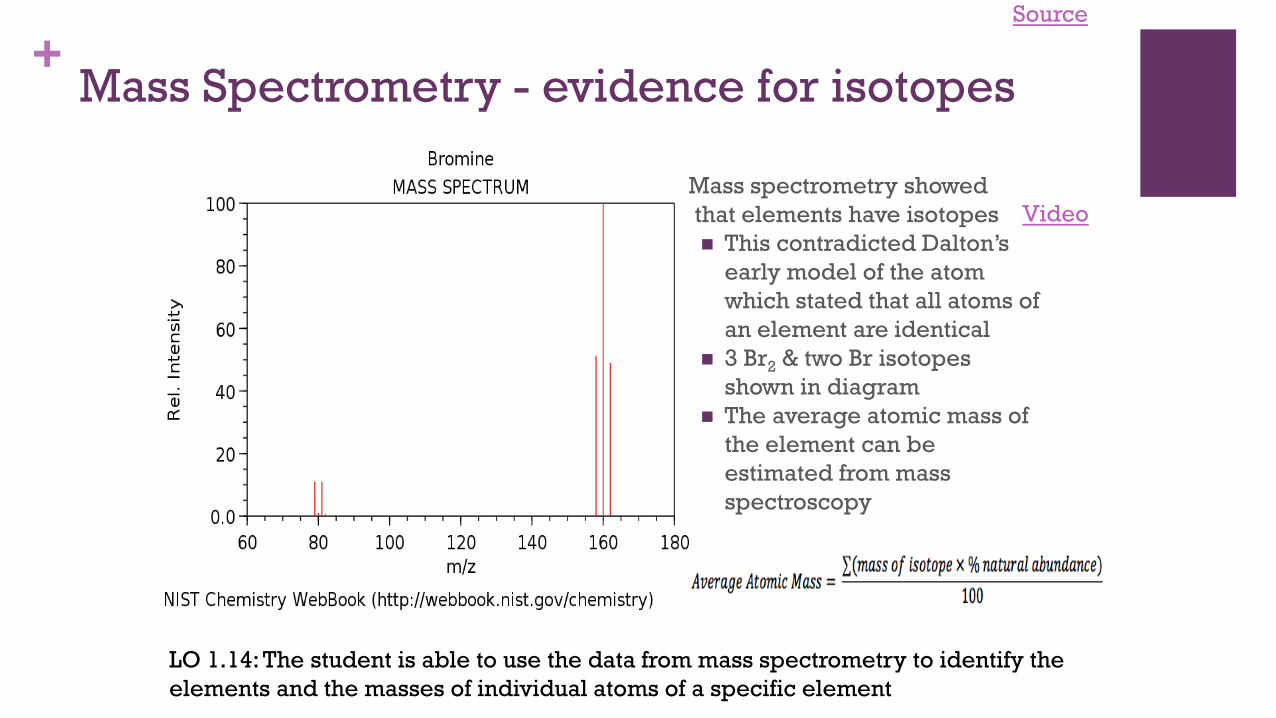
+Mass Spectrometry - evidence for isotopes
Mass spectrometry showed
that elements have isotopes
This contradicted Dalton’s
early model of the atom
which stated that all atoms of
an element are identical
3 Br2 & two Br isotopes
shown in diagram
The average atomic mass of
the element can be
estimated from mass
spectroscopy
Source
LO 1.14: The student is able to use the data from mass spectrometry to identify the
elements and the masses of individual atoms of a specific element
Video
14)
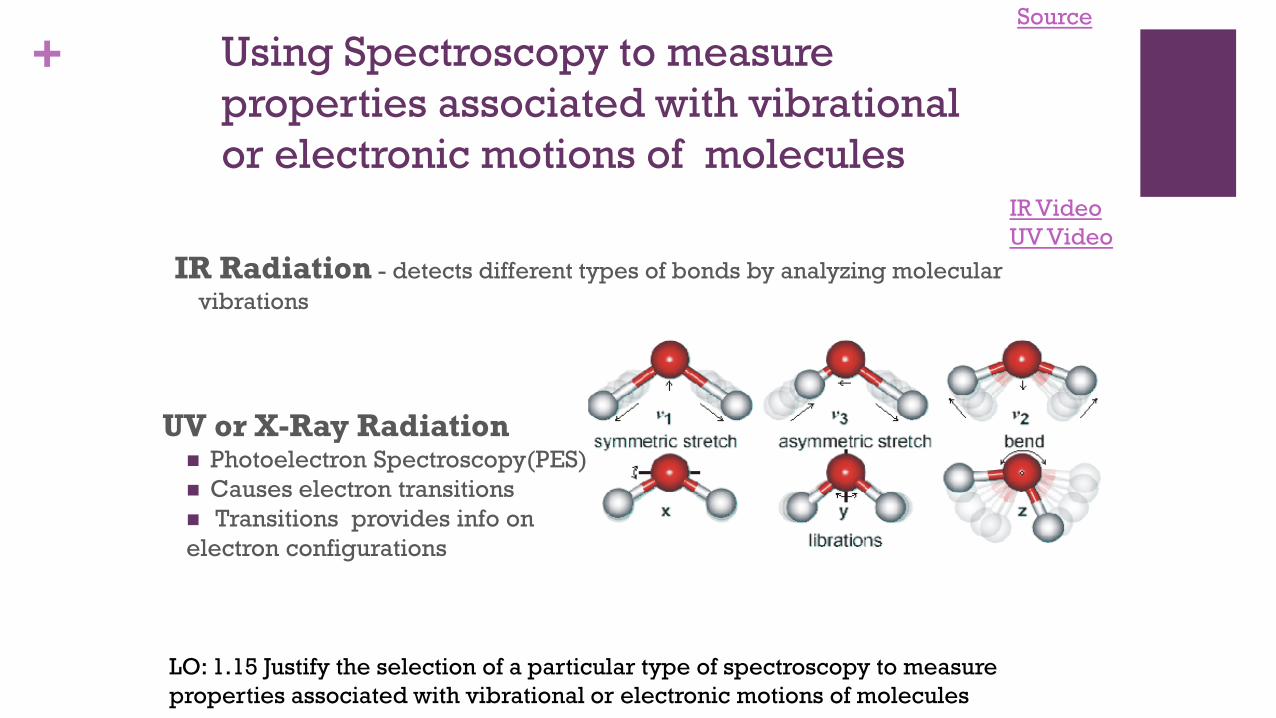
+ Using Spectroscopy to measure
properties associated with vibrational
or electronic motions of molecules
IR Radiation - detects different types of bonds by analyzing molecular
vibrations
UV or X-Ray Radiation Photoelectron Spectroscopy(PES)
Causes electron transitions
Transitions provides info on
electron configurations
Source
LO: 1.15 Justify the selection of a particular type of spectroscopy to measure
properties associated with vibrational or electronic motions of molecules
IR Video
UV Video
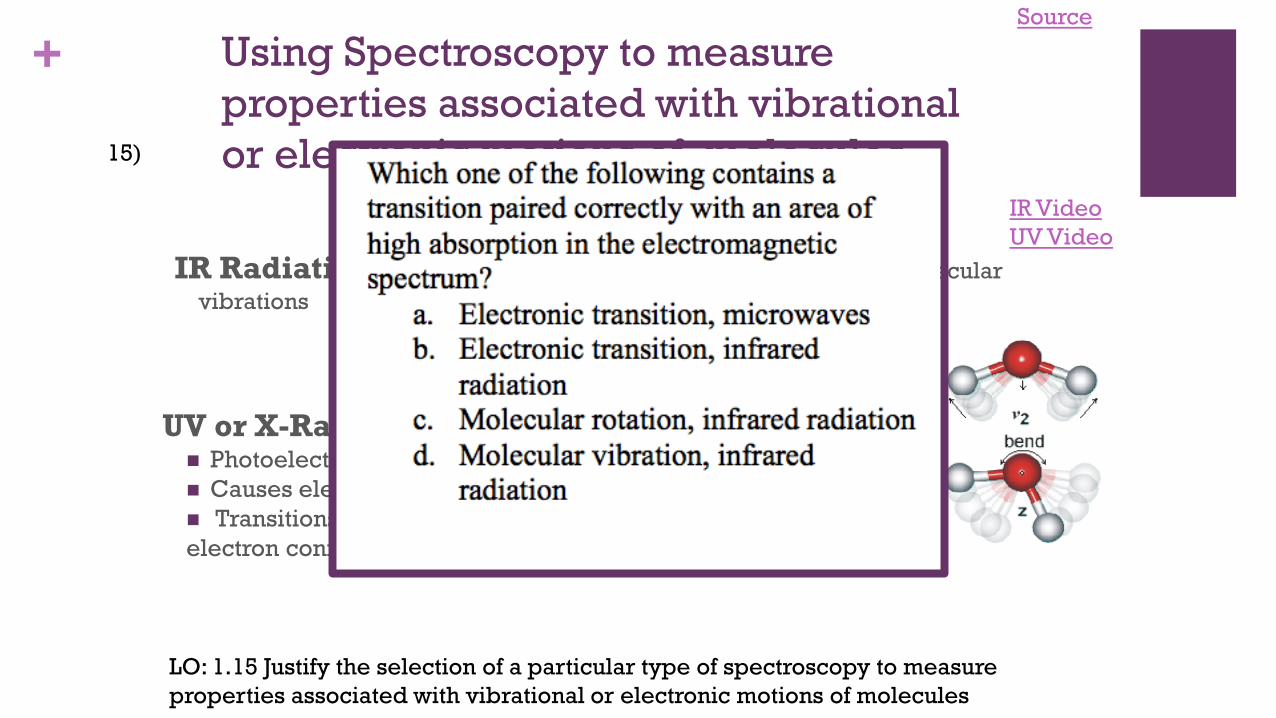
15)
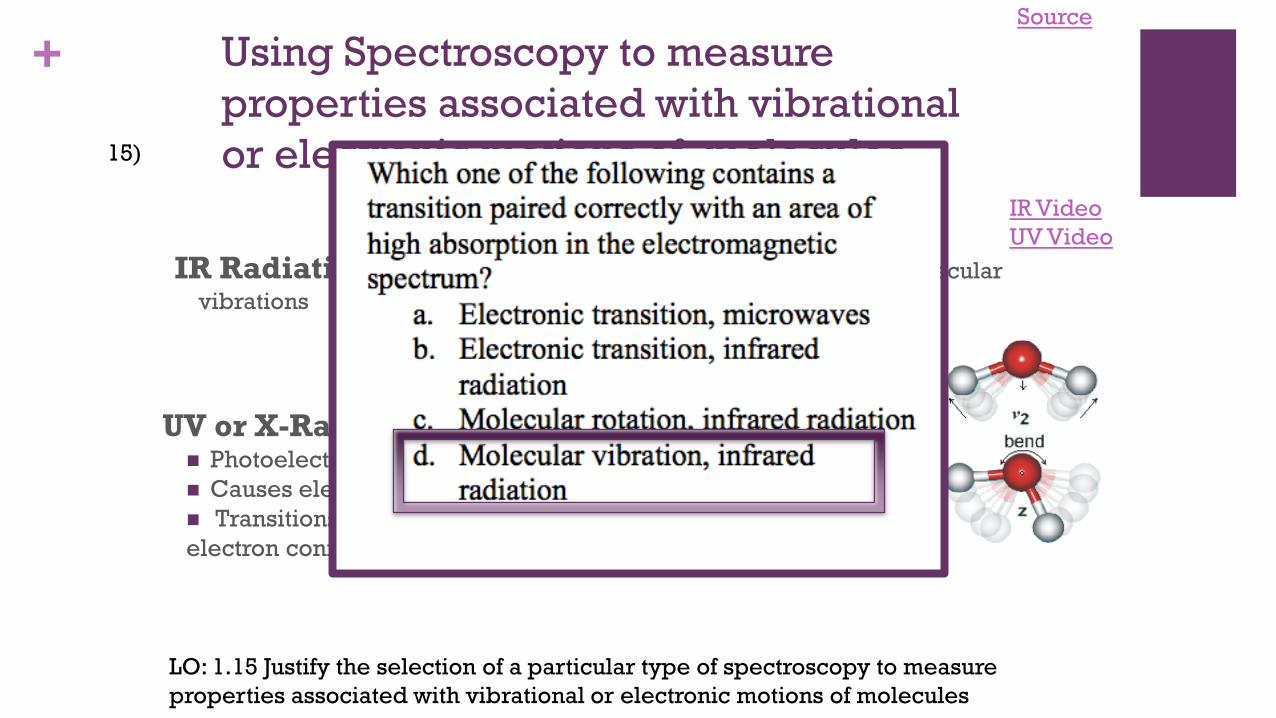
+ Using Spectroscopy to measure
properties associated with vibrational
or electronic motions of molecules
IR Radiation - detects different types of bonds by analyzing molecular
vibrations
UV or X-Ray Radiation Photoelectron Spectroscopy(PES)
Causes electron transitions
Transitions provides info on
electron configurations
Source
LO: 1.15 Justify the selection of a particular type of spectroscopy to measure
properties associated with vibrational or electronic motions of molecules
IR Video
UV Video
15)

+ Beer-Lambert Law - used to
measure the concentration of
colored solutions
A = abcA = absorbance
a = molar absorptivity (constant for
material being tested)
b = path length (cuvette = 1 cm)
c = concentration
Taken at fixed wavelength
Source 1, 2
LO1.16: Design and/or interpret the results of an experiment regarding the
absorption of light to determine the concentration of an absorbing species in solution
Video
Click reveals answer and explanation.
16)

+ Beer-Lambert Law - used to
measure the concentration of
colored solutions
A = abcA = absorbance
a = molar absorptivity (constant for
material being tested)
b = path length (cuvette = 1 cm)
c = concentration
Taken at fixed wavelength
Source 1, 2
LO1.16: Design and/or interpret the results of an experiment regarding the
absorption of light to determine the concentration of an absorbing species in solution
Video
16)

+Law of Conservation of Mass
N2 + 3H2 → 2NH3
Source
LO1.17: Express the law of conservation of mass quantitatively and qualitatively using
symbolic representations and particulate drawings
Video

+Law of Conservation of Mass
N2 + 3H2 → 2NH3
Source
LO1.17: Express the law of conservation of mass quantitatively and qualitatively using
symbolic representations and particulate drawings
Video
Click reveals answer and explanation.
17)

+Law of Conservation of Mass
N2 + 3H2 → 2NH3
Source
LO1.17: Express the law of conservation of mass quantitatively and qualitatively using
symbolic representations and particulate drawings
Video
17)
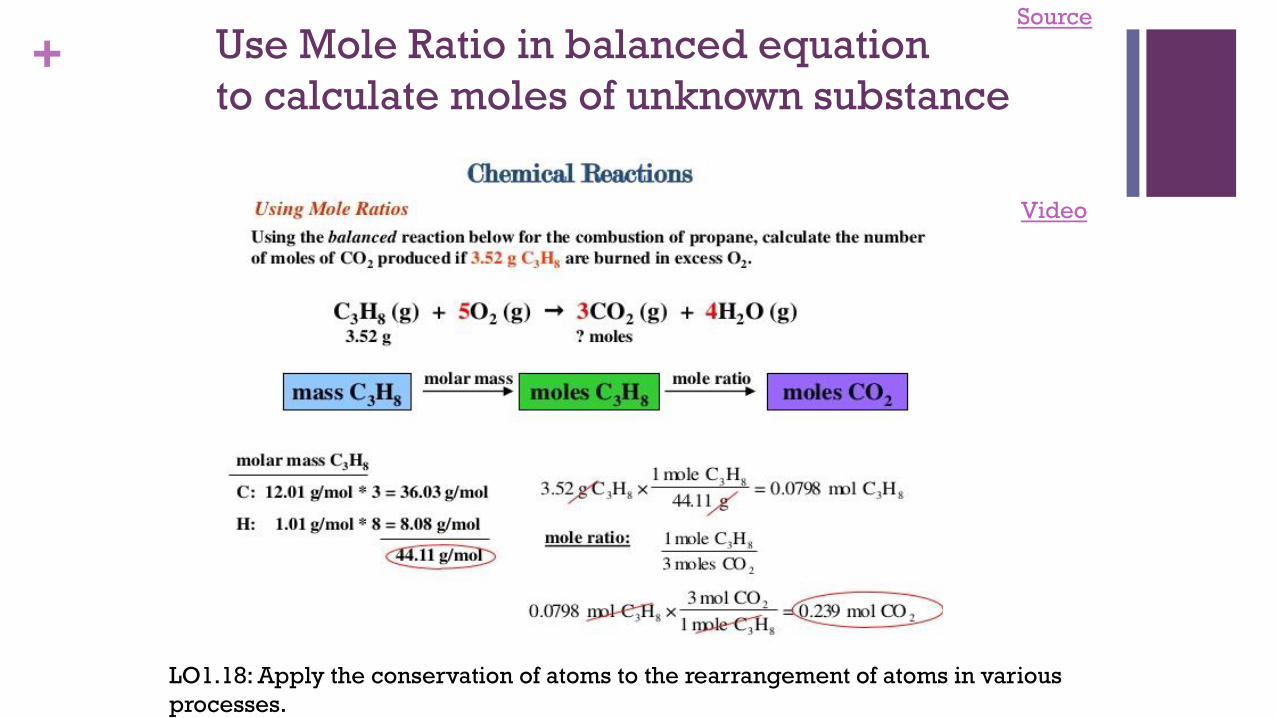
+ Use Mole Ratio in balanced equation
to calculate moles of unknown substance
Source
LO1.18: Apply the conservation of atoms to the rearrangement of atoms in various
processes.
Video

+Gravimetric Analysis
Buchner Filtration
Apparatus
How much lead
(Pb2+) in water?Pb2+(aq) + 2Cl-(aq) → PbCl2 (s)
By adding excess Cl- to the
sample, all of the Pb2+ will
precipitate as PbCl2
Solid product is filtered using a
Buchner Filter and then dried to
remove all water
Mass of PbCl2is then determined
This can be used to calculate the
original amount of lead in the
water
Source
LO 1.19: Design and/or interpret data from, an experiment that uses gravimetric
analysis to determine the the concentration of an analyte in a solution.
Video
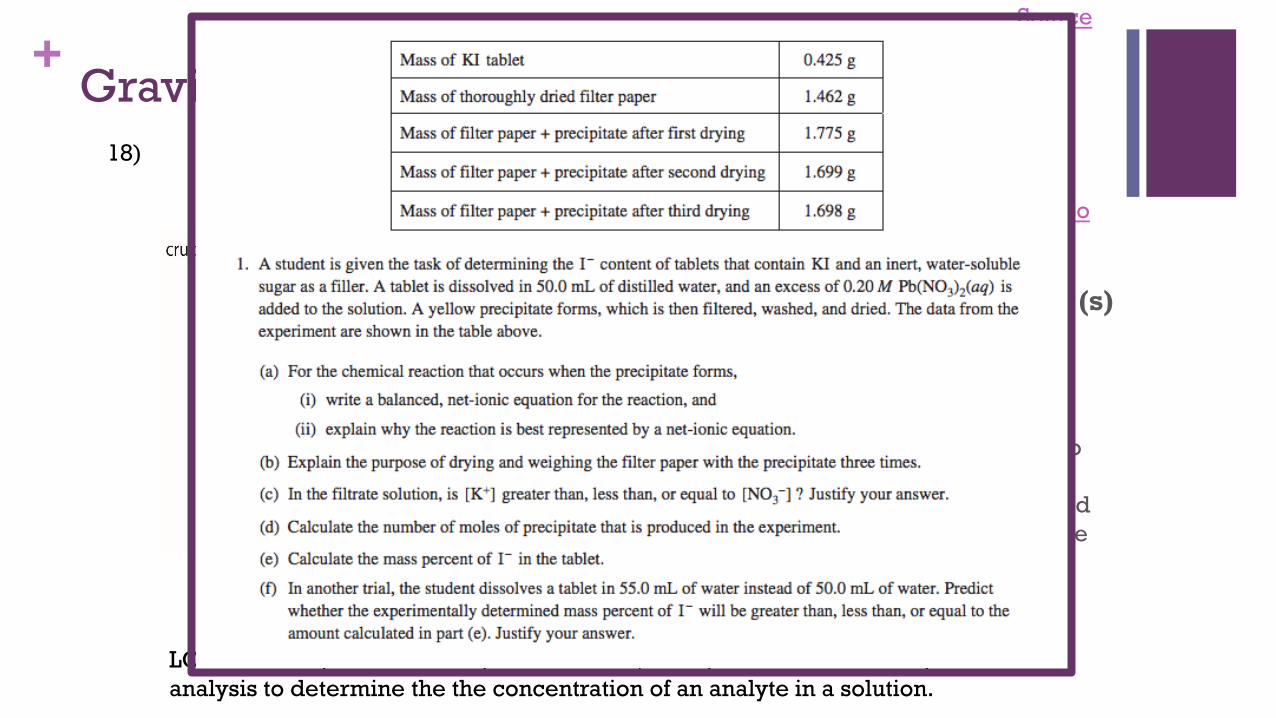
18)

+Gravimetric Analysis
Buchner Filtration
Apparatus
How much lead
(Pb2+) in water?Pb2+(aq) + 2Cl-(aq) → PbCl2 (s)
By adding excess Cl- to the
sample, all of the Pb2+ will
precipitate as PbCl2
Solid product is filtered using a
Buchner Filter and then dried to
remove all water
Mass of PbCl2is then determined
This can be used to calculate the
original amount of lead in the
water
Source
LO 1.19: Design and/or interpret data from, an experiment that uses gravimetric
analysis to determine the the concentration of an analyte in a solution.
Video
18)

+ Using titrations to determine
concentration of an analyte
Source
LO1.20: Design and/or interpret data from an experiment that uses titration to
determine the concentration of an analyte in a solution.
Video
At the equivalence point, the
stoichiometric molar ratio is reached
+ Using titrations to determine
concentration of an analyte
Source
LO1.20: Design and/or interpret data from an experiment that uses titration to
determine the concentration of an analyte in a solution.
Video
At the equivalence point, the
stoichiometric molar ratio is reached
Click reveals answer and explanation.
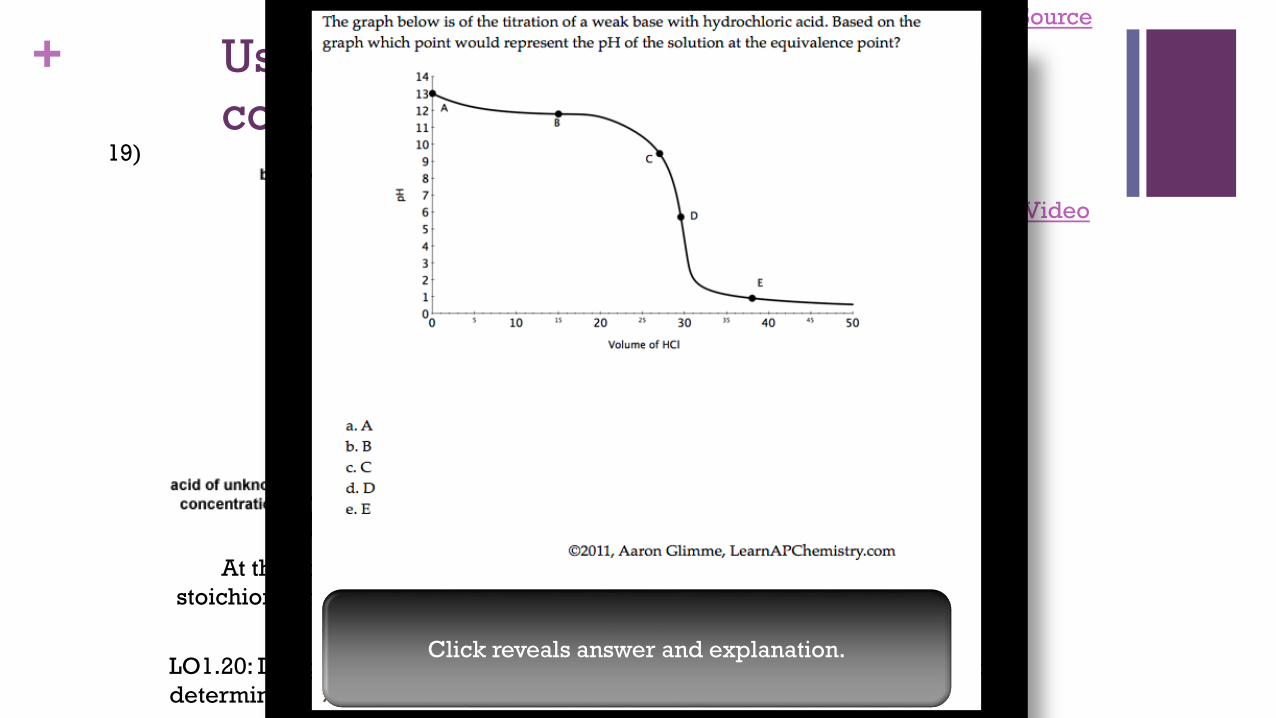
19)

+ Using titrations to determine
concentration of an analyte
Source
LO1.20: Design and/or interpret data from an experiment that uses titration to
determine the concentration of an analyte in a solution.
Video
At the equivalence point, the
stoichiometric molar ratio is reached
19)