proper motions of usco t-type candidates -...
TRANSCRIPT
MNRAS 430, 1784–1789 (2013) doi:10.1093/mnras/sts726
Proper motions of USco T-type candidates�†
N. Lodieu,1,2‡ V. D. Ivanov3 and P. D. Dobbie4
1Instituto de Astrofısica de Canarias (IAC), C/ Vıa Lactea s/n, E-38200 La Laguna, Tenerife, Spain2Departamento de Astrofısica, Universidad de La Laguna (ULL), E-38205 La Laguna, Tenerife, Spain3European Southern Observatory, Santiago de Chile, Chile4School of Mathematics & Physics, University of Tasmania, Hobart, TAS 7001, Australia
Accepted 2012 December 28. Received 2012 November 30
ABSTRACTWe present new z- and H-band photometry and proper motion measurements for the fivecandidate very-low-mass T-type objects we recently proposed to be members of the nearestOB association with the Sun, Upper Scorpius (USco). These new data fail to corroborate ourprior conclusions regarding their spectral types and affiliation with the USco population. Weconclude that we may be in presence of a turnover in the mass function of USco taking placebelow 10–4 MJup, depending on the age assigned to USco and the models used.
Key words: techniques: photometric – surveys – stars: luminosity function, mass function –infrared: stars.
1 IN T RO D U C T I O N
The quest for young objects of spectral-type T remains an area ofsubstantial interest as a way to address a fundamental question in ourunderstanding of star formation: what is the lowest mass that thisprocess can form? The earliest theoretical predictions by Kumar(1969), Low & Lynden-Bell (1976) and Rees (1976) suggestedmasses as low as ∼10 Jupiter (MJup) but contemporary calculationsreveal that in the presence of magnetic fields this limit could bemuch lower (Boss 2001; Stamatellos & Whitworth 2008).
Naturally, the searches for these objects have concentrated onthe nearest young clusters and star-forming regions and these haveled to the identification of several candidate infantile T-type ob-jects. Crucially, none of these has been unambiguously confirmedastrometrically and spectroscopically. For example, Bihain et al.(2010) have detected a further candidate T-type member of the σ Oricluster, adding to the previously known candidate mid-T, S Ori 70(Zapatero Osorio et al. 2002, 2008; Burgasser et al. 2004; Luhmanet al. 2008; Scholz & Jayawardhana 2008). However, proper motionmeasurements of both objects cast doubt on their association withthis population (Pena Ramırez et al. 2011). More recently, PenaRamırez et al. (2012) have identified another candidate T-type inthis same region using photometry from the Visible and InfraredSurvey Telescope for Astronomy (VISTA; Emerson et al. 2004)Orion survey.
� Based on observations collected with the ESO New Technology Telescopeunder programme number 089-C.0854(A).†Based on observations made with the Gran Telescopio Canarias (GTC),installed in the Spanish Observatorio del Roque de los Muchachos of theInstituto de Astrofısica de Canarias, in the island of La Palma.‡E-mail: [email protected]
Additionally, Marsh et al. (2010) have claimed the discovery ofa T2 member of ρ Ophiuchus but this has since been refuted byAlves de Oliveira et al. (2010). Independently, Geers et al. (2011)have proposed several candidates as substellar members of this pop-ulation through infrared spectroscopy, including one with a massclose to the deuterium burning limit. Another wide-field methaneimaging survey of ρ Ophiuchus revealed 22 T-type dwarf candidatemembers down to 1–2 Jupiter (Haisch, Barsony & Tinney 2010).Burgess et al. (2009) identified a mid-T-type candidate from a deepmethane survey of ∼0.11 square degree in IC 348 but neither spec-troscopy nor astrometry is yet available to confirm membership.Spezzi et al. (2012) reported two potential T-type candidates in thecore of the Serpens cloud although their nature remains uncertainwith the sets of data available to the authors. Similarly, none ofthe faint Pleiades L/T dwarf candidates announced by Casewellet al. (2007) have been confirmed spectroscopically as members(Casewell et al. 2011). It is worth noting here that there are twospectroscopically and astrometrically confirmed T dwarf membersof the Hyades cluster (Bouvier et al. 2008). However, these havesignificantly larger masses (∼50 MJup) than the young T-types dueto their substantially greater ages, τ ∼ 600 Myr.
Upper Scorpius (hereafter USco) is part of the Scorpius Centau-rus OB association: it is located at 145 pc from the Sun (de Bruijneet al. 1997) and its age is estimated to 5 ± 2 Myr from isochrone fit-ting and dynamical studies (Preibisch & Zinnecker 1999) althougha more recent study by Pecaut, Mamajek & Bubar (2012) sug-gests 11 ± 2 Myr (see also Song, Zuckerman & Bessell 2012).The association has been targeted in X rays (Walter et al. 1994;Preibisch et al. 1998; Kunkel 1999), astrometrically with Hipparcos(de Bruijne et al. 1997; de Zeeuw et al. 1999), and more recentlyat optical (Ardila, Martın & Basri 2000; Preibisch, Guenther &Zinnecker 2001; Preibisch & Zinnecker 2002; Martın, Delfosse& Guieu 2004; Slesnick, Carpenter & Hillenbrand 2006) andnear–infrared (Lodieu, Hambly & Jameson 2006; Lodieu et al. 2007,
C© 2013 The AuthorsPublished by Oxford University Press on behalf of the Royal Astronomical Society
at :: on May 7, 2013
http://mnras.oxfordjournals.org/
Dow
nloaded from

Proper motions of Upper Sco T-type candidates 1785
2011b; Dawson, Scholz & Ray 2011; Dawson et al. 2013) wave-lengths. Tens of brown dwarfs have now been confirmed spectro-scopically as members of USco (Martın et al. 2004, 2010; Lodieuet al. 2006, 2008; Slesnick et al. 2006; Slesnick, Hillenbrand &Carpenter 2008; Lodieu, Dobbie & Hambly 2011b) and the massfunction of this population determined robustly, deep into the sub-stellar regime (Preibisch et al. 2002; Slesnick et al. 2008; Lodieuet al. 2011b).
In a recent paper in our extensive series of publications relatingto USco (Lodieu et al. 2011a), we identified five T-type candidatemembers with deep infrared photometry from the UK Infrared tele-scope wide-field camera (UKIRT/WFCAM; Casali et al. 2007). Inthe current work, we report proper motion measurements for theseobjects obtained from early deep WFCAM J-band observations andnew H-band imaging that are separated in time by four years. InSection 2 and Section 3, we describe the new H-band observationscarried out with the Son of Isaac (SofI) instrument installed onthe European Southern Observatory (ESO) New Technology Tele-scope (NTT) in La Silla Observatory (Chile) and additional z-bandimaging conducted with the Optical System for Imaging and lowResolution Integrated Spectroscopy (OSIRIS) installed on the GranTelescopio de Canarias (GTC) in La Palma Observatory (CanaryIslands). In Section 4, we use the new photometry and astrome-try to examine the membership status of the five candidate T-typemembers. In Section 5, we place our new results into context andspeculate about our (positive/negative) results.
2 N E A R - I N F R A R E D PH OTO M E T RY
2.1 H-band imaging
We performed near-infrared imaging of the five T-type candidatesin USco listed in table 4 of Lodieu et al. (2011a) in the H filter withSofI on the 3.5-m NTT (Moorwood, Cuby & Lidman 1998). Allfive sources were observed on 2012 May 9.
SofI is equipped with a Hawaii HgCdTe 1024 × 1024 array withsquared 18.5 µm pixels and has both imaging and spectroscopiccapabilities. The pixel scale is 0.292 arcsec in the Large Field con-figuration, providing coverage of a 4.9 × 4.9 arcmin field of view.We employed a random dithering pattern within a 40 arcsec boxusing six on-source individual integrations of 20 s, repeating this10 or 20 times for the two brightest and three faintest T-type can-didates. This yielded total on-source exposures of 20 or 40 min forthe bright and faint objects, respectively. At the time of the observa-tions, the night was clear and the seeing was around 0.7–0.9 arcsec,allowing us to go deep enough to detect the T-type candidates withsignal-to-noise ratios between 8 and 15. Dome flats and darks withthe same on-source integrations were taken during the afternoonprior to our observing night. As our fields are within the footprintof the UKIRT Infrared Deep Sky Survey Galactic Clusters Survey(UKIDSS GCS; Lawrence et al. 2007), no photometric standardstars were observed.
2.2 Data reduction and astrometry
The data were reduced with the ESO European Southern Obser-vatory Recipe Execution Tool (EXOREX) SofI pipeline recipes.These perform an automatic reduction of the target frames withinan observing block, including flat-field correction, sky subtractionand cross-talk removal. The next step of the data analysis includedphotometric and astrometric calibrations using the WFCAM imagesas reference.
To astrometrically calibrate the SofI images we proceeded asfollows: for a first guess we used the astrometry.net package1 whichrequires the centre of image given by the (RA, Dec.) coordinates inthe header, the pixel scale (0.292 arcsec pixel−1), and a radius forthe search (set to 12 arcmin, more than twice the field of view of theSofI images). The astrometric solution was satisfactory comparingwith Two Micron All Sky Survey (2MASS) and the deep WFCAMimages obtained as first epoch. However, it was not good enoughfor our purposes, i.e. to measure proper motions between the twoepochs.
The second step made use of the GAIA software2 which itself usesSEXTRACTOR (Bertin & Arnouts 1996). We ran the detection algo-rithm to extract all sources (pixel and world coordinates systems) inthe SofI images. Then, we cross-correlated this SEXTRACTOR cata-logue against the deep WFCAM data set and kept only the SofI (x,y)and WFCAM (RA, Dec.) coordinates in an output file for sourceswith J-band magnitudes in the 19–20 range. Next we used the IRAF
task ccmap interactively with a polynomial of order 4. Using thefaintest stars from the WFCAM images allowed us to exploit morethan 100–170 point sources with a small intrinsic motion on thesky (i.e. about 21–25 per cent of all stars in the each SofI field),avoiding bright members of the association. We eliminated pointswhose astrometry was off by more than 5σ , yielding an rms of44.8–51.1 mas and 33.2–45.1 mas in right ascension and declina-tion, respectively (corresponding to about 1/6 of the SofI pixel scaleor 11–13 mas yr−1). The new image was saved and SEXTRACTOR ranagain with a detection threshold of 3σ and an aperture twice thesize of the full width at half-maximum (∼6 pixels or 2 arcsec) todetect all sources in the SofI field of view, including the targets.
2.3 Photometric calibration
We could not use point sources within the 2MASS data base to cal-ibrate photometrically the SofI frames because most of these weresaturated in our images. Instead, we cross-matched all objects de-tected by SEXTRACTOR (see Section 2.2) with the ninth data releaseof the UKIDSS GCS and retrieved all point sources detected in Hwith photometric error bars less than 0.1 mag for each individualfield. The total numbers of matched sources within a matching ra-dius of 2 arcsec was typically 200–240. We find a median offsetof −0.799 ± 0.095 mag between the UKIDSS system (Vega sys-tem; Hewett et al. 2006) and the SofI photometry when we adopt thedefault zero-point of 25 mag in the SEXTRACTOR parameter field. Welist the offsets for each of the five fields in Table 1. The final pho-tometric uncertainties on the offsets corresponds to the root meansquare of the dispersion between offsets and the individual errors.Table 2 lists the H magnitudes and their errors of our five UScotargets, computed using the offsets from each individual frame.
3 O P T I C A L P H OTO M E T RY
3.1 z-band imaging
OSIRIS is the Optical System for Imaging and low ResolutionIntegrated Spectroscopy instrument (Cepa et al. 2000) on the10.4-m GTC operating at the Observatory del Roque de Los
1 More details at astrometry.net2 GAIA is a derivative of the SKYCAT catalogue and image display tool, devel-oped as part of the VLT project at ESO. SKYCAT and GAIA are free softwareunder the terms of the GNU copyright.
at :: on May 7, 2013
http://mnras.oxfordjournals.org/
Dow
nloaded from

1786 N. Lodieu, V. D. Ivanov and P. D. Dobbie
Table 1. Offsets between the NTT/SofI and UKIRT/WFCAM H-band pho-tometry using >100 point sources in each individual SofI field. The last rowindicates the mean (Avg) value of the offset, taking into account the disper-sion and errors on the individual offsets.
Field RA Dec. Offset (H) No. of stars
(hh:mm:ss.ss) (◦:′:′ ′) (mag)
1 16:08:35.98 −22:29:11.1 −0.796 ± 0.082 2102 16:08:45.73 −22:29:53.5 −0.784 ± 0.064 2263 16:08:47.80 −22:29:04.5 −0.846 ± 0.070 2434 16:09:55.91 −22:33:45.7 −0.807 ± 0.070 2035 16:10:04.76 −22:32:30.6 −0.761 ± 0.080 197
Avg −0.799 ± 0.095
Muchachos (La Palma, Canary Islands). The OSIRIS instrumentis equipped with two 2048 × 4096 Marconi CCD 42–82 with an8 arcsec gap between them and operates at optical wavelengths,from 365 to 1000 nm. The unvignetted instrument field of view isabout 7 arcmin × 7 arcmin with a pixel scale of 0.125 arcsec. Weused the standard 2 × 2 binning mode.
We imaged the five T-type candidates in USco with the Sloanz filter available on OSIRIS during 2012 May. Bias and skyflatswere observed on May 26 (evening) and May 28+30 (morning).On 2012 May 27, we obtained three series of 10 frames with 60 son-source integrations covering the targets 16084780–2229045,16084573–2229535 and 16083598–2229111. On 2012 May 29, weobtained three sets of 10 images with 20 s on-source integrations for16095591–2233457 and 16100476–2232306 as well as nine imagesof 39 s for 16100476–2232306. We also repeated the observations of16084780–2229045 and 16084573–2229535 obtaining four seriesof 10 images exposed 60 s.
All observations were conducted under average seeing of 1.1–1.3 arcsec, photometric or clear conditions, and airmass between1.6 and 1.8. The sky was relatively dark during the observationsmade on May 27 because the moon was set whereas the 64 percent-full moon was below 20◦ on 2012 May 29.
3.2 Data reduction and astrometry
We reduced the OSIRIS Sloan z-band images in a standard mannerunder the IRAF environment3 (Tody 1986, 1993). First, we subtractedthe mean bias and divided by the normalized averaged master skyflatto each individual science frame. Then, we combined each set of10 images taken without dithering and finally combined those setsapplying the offsets to create a master science frame. We note thatour targets were located on CCD 2, thus, we only treated data fromthat chip throughout the reduction process.
We calibrated astrometrically the final combined science framesusing IRAF and ds9 (Joye & Mandel 2003). First, we saved in a filea list of point sources from the 2MASS catalogue (Cutri et al. 2003;Skrutskie et al. 2006) spread over the full OSIRIS field of view.Second, we ran the daofind task with the adequate detection andthreshold parameters to identify (roughly) the same point sources tocross-match them in a subsequent step with the ccxymatch routine.The latter task required a reference star with pixel (x,y) and worldcoordinate system (RA, Dec.) coordinates to efficiently cross-matchthe 2MASS (x,y) and (RA,Dec.) catalogues. We typically found
3 IRAF is distributed by the National Optical Astronomy Observatories, whichare operated by the Association of Universities for Research in Astronomy,Inc., under cooperative agreement with the National Science Foundation Ta
ble
2.Ph
otom
etry
for
the
USc
oT-
type
cand
idat
es:t
heY
,Jan
dm
etha
neph
otom
etry
isfr
omL
odie
uet
al.(
2011
a)to
whi
chw
ead
ded
the
new
H-b
and
phot
omet
ryfr
omN
TT
/Sof
Ian
dz-
band
mag
nitu
des
from
GT
C/O
SIR
IS.T
hez−
Jan
dJ
−H
colo
urs
are
give
nas
wel
l.T
here
sulti
ngpr
oper
mot
ions
mea
sure
dbe
twee
nth
efir
stan
dse
cond
epoc
him
ages
atne
ar-i
nfra
red
wav
elen
gths
are
quot
edin
mas
yr−1
.
RA
Dec
.Y
JC
H4o
ffC
H4o
nH
zJ
−H
z−
Jµ
αco
sδµ
δμ
(hh:
mm
:ss.
ss)
(◦:′ :
′′ )(m
ag)
(mag
)(m
ag)
(mag
)(m
ag)
(mag
)(m
ag)
(mag
)(m
asyr
−1)
(mas
yr−1
)(m
asyr
−1)
16:0
8:35
.98
−22:
29:1
1.1
21.8
7±
0.14
20.9
6±
0.11
20.4
7±
0.20
21.1
1±
0.18
20.4
1±
0.15
22.5
9±
0.04
0.55
±0.
181.
63±
0.12
−3.6
+12.
813
.316
:08:
45.7
3−2
2:29
:53.
521
.47
±0.
1020
.72
±0.
0920
.29
±0.
1721
.15
±0.
1320
.20
±0.
1222
.37
±0.
070.
52±
0.15
1.65
±0.
11−1
8.4
+6.9
19.7
16:0
8:47
.80
−22:
29:0
4.5
21.5
7±
0.11
20.7
2±
0.09
20.5
9±
0.24
21.4
5±
0.17
20.2
8±
0.13
22.4
8±
0.08
0.44
±0.
161.
76±
0.12
+12.
9−5
.814
.116
:09:
55.9
1−2
2:33
:45.
721
.10
±0.
0820
.19
±0.
0619
.81
±0.
1420
.40
±0.
0819
.87
±0.
1622
.02
±0.
070.
32±
0.17
1.83
±0.
09+2
1.0
−12.
724
.516
:10:
04.7
6−2
2:32
:30.
620
.46
±0.
0519
.69
±0.
0419
.26
±0.
1119
.75
±0.
0419
.16
±0.
1221
.50
±0.
090.
52±
0.12
1.81
±0.
10+3
5.4
+26.
344
.1
at :: on May 7, 2013
http://mnras.oxfordjournals.org/
Dow
nloaded from

Proper motions of Upper Sco T-type candidates 1787
Figure 1. GTC/OSIRIS z-band images for the five candidates (circled and centred). North is up and East is left. Images are 1 arcmin × 1 arcmin.
80–100 stars in the field of view of CCD 2 running ccmap with apolynomial of order 4, resulting in an astrometric calibration betterthan 0.1–0.15 arcsec. The final reduced z-band images of the fivecandidates are shown in Fig. 1.
3.3 Photometric calibration
The GTC calibration plan provided us with only one observation ofa photometric standard star (G 163-50) taken on the night of 2012May 27 with a single on-source integration of 0.8 s at an airmassof 1.253. This DA3.2 white dwarf (Holberg, Oswalt & Barstow2012) is a Sloan photometric standard (Adelman-McCarthy et al.2011) and has a z-band magnitude of 13.809. We measured theinstrumental magnitude using aperture photometry and applied acurve-of-growth analysis to allow for all the flux from the standardstar.
We obtained a photometric zero-point of 28.028 ± 0.020 magwhich is consistent within the error bars with both the val-ues from the GTC OSIRIS daily monitoring of the zero-points4
and our own previous measurement (28.038 ± 0.059) from datataken in Semester 12B (Lodieu et al. 2013). For the night of2012 May 29, we use the average value from Semester 12Bquoted above although data from the Carlsberg Meridian Telescope(http://www.ast.cam.ac.uk/ioa/research/cmt/data/camcext.12) sug-gest this night was similar in transparency to the first.
We performed aperture and point-spread function (PSF) pho-tometry with daophot under IRAF because of the fairly crowdednature of this region (Fig. 1) and the faintness of our targets. Wechoose an aperture equal to 3× the full width at half-maximum andchecked that our targets were all well subtracted without residualsby our PSF analysis. We corrected the instrumental magnitude forthe z-band zero-point and the airmass. We did not take into accountpossible effects due to colour terms. We list in Table 2 the finalmagnitudes of the five T-type candidates in USco. We note that wequote the mean value of the magnitudes when two measurementswere available (case of 16084573–2229535, 16084780–2229045and 16100476–2232306), the uncertainty being the dispersion be-tween both values to which we added in quadrature.
4 R E-EXAMINING MEMBERSHIP TO USco
4.1 New astrometric tests
To measure the relative proper motions for all common pointsources, we cross-matched the catalogues from the five NTT point-ings with the full catalogue of the deep WFCAM survey (Lodieuet al. 2011a) with a matching radius of two arcsec. We found about
4 www.gtc.iac.es/en/media/osiris/zeropoints.html
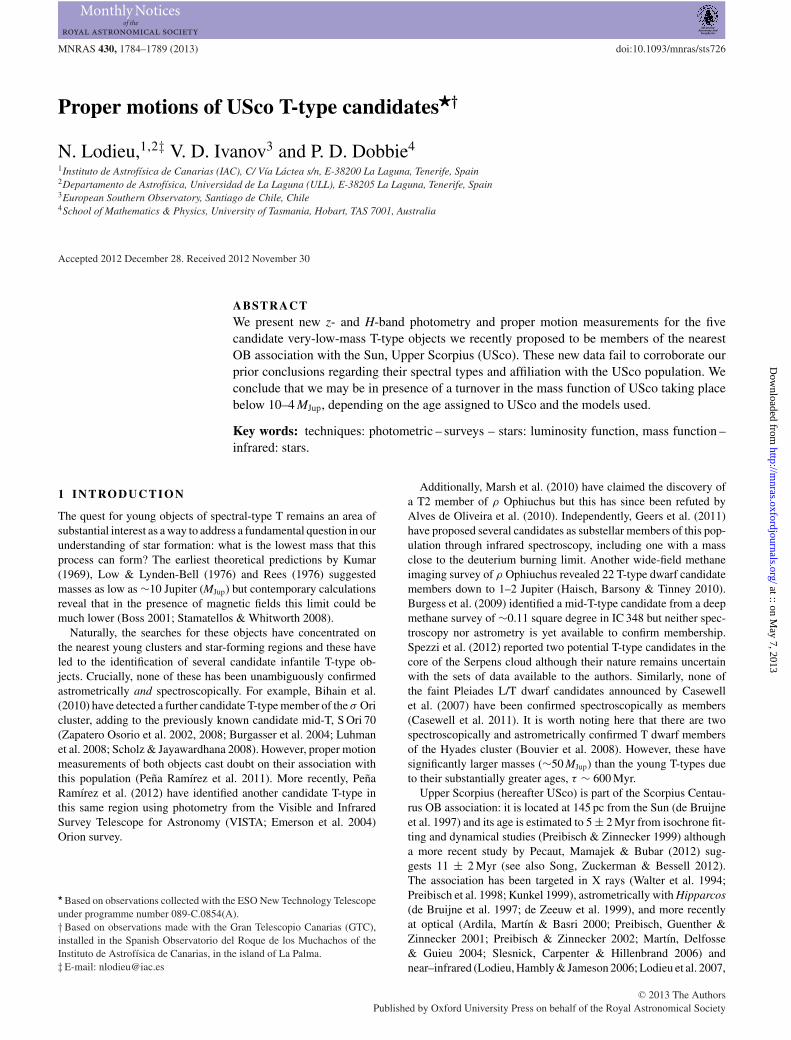
Figure 2. Proper motion vector point diagrams for the five T-type candi-dates in USco marked with thick black triangles. The large circle has a radiusof 12 mas yr−1 and is centred on the USco mean proper motion. The smallgrey dots represent all point sources common to the deep WFCAM surveyand the NTT fields.
3200 sources to compare with the proper motions measured forthe five T-type candidates. We list the proper motion in the rightascension and declination as well as the total proper motion in Ta-ble 2. We show their positions in proper motion reduced vectorpoint diagrams in Fig. 2 where our T-type candidates are high-lighted with thick black triangles. All five candidates lie at least2.5σ from the mean absolute proper motion of the association esti-mated as (−11,−25) mas yr−1 by Hipparcos (de Bruijne et al. 1997;de Zeeuw et al. 1999), arguing against their membership to the as-sociation.
We compiled a list of known spectroscopic members of UScofrom Ardila et al. (2000), Martın et al. (2004), Slesnick et al. (2006),Lodieu et al. (2006), Slesnick et al. (2008), Dawson et al. (2011),Lodieu et al. (2011b) and Dawson et al. (2013) to cross-match withthe catalogue of point sources common to the NTT fields of viewand the deep WFCAM survey (Lodieu et al. 2011a). Unfortunately,none of these known spectroscopic members lies within the NTTfields of view. This is not surprising considering that the total areacovered by the five NTT pointings is of the order of 0.03 squaredegree. Lodieu et al. (2006) and Lodieu et al. (2007) found between0.1 and 0.5 member candidates in 0.03 square degree down tothe depth of the UKIDSS GCS, depending on the location in theassociation.
at :: on May 7, 2013
http://mnras.oxfordjournals.org/
Dow
nloaded from
1788 N. Lodieu, V. D. Ivanov and P. D. Dobbie
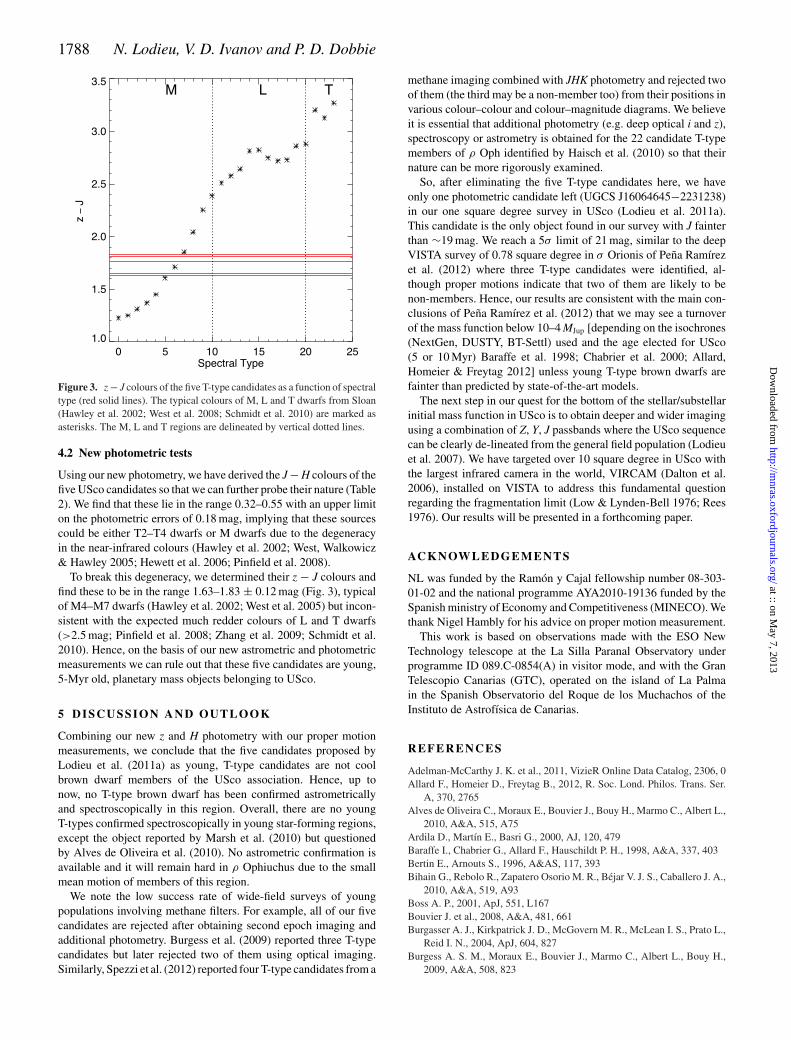
Figure 3. z − J colours of the five T-type candidates as a function of spectraltype (red solid lines). The typical colours of M, L and T dwarfs from Sloan(Hawley et al. 2002; West et al. 2008; Schmidt et al. 2010) are marked asasterisks. The M, L and T regions are delineated by vertical dotted lines.
4.2 New photometric tests
Using our new photometry, we have derived the J − H colours of thefive USco candidates so that we can further probe their nature (Table2). We find that these lie in the range 0.32–0.55 with an upper limiton the photometric errors of 0.18 mag, implying that these sourcescould be either T2–T4 dwarfs or M dwarfs due to the degeneracyin the near-infrared colours (Hawley et al. 2002; West, Walkowicz& Hawley 2005; Hewett et al. 2006; Pinfield et al. 2008).
To break this degeneracy, we determined their z − J colours andfind these to be in the range 1.63–1.83 ± 0.12 mag (Fig. 3), typicalof M4–M7 dwarfs (Hawley et al. 2002; West et al. 2005) but incon-sistent with the expected much redder colours of L and T dwarfs(>2.5 mag; Pinfield et al. 2008; Zhang et al. 2009; Schmidt et al.2010). Hence, on the basis of our new astrometric and photometricmeasurements we can rule out that these five candidates are young,5-Myr old, planetary mass objects belonging to USco.
5 D I S C U S S I O N A N D O U T L O O K
Combining our new z and H photometry with our proper motionmeasurements, we conclude that the five candidates proposed byLodieu et al. (2011a) as young, T-type candidates are not coolbrown dwarf members of the USco association. Hence, up tonow, no T-type brown dwarf has been confirmed astrometricallyand spectroscopically in this region. Overall, there are no youngT-types confirmed spectroscopically in young star-forming regions,except the object reported by Marsh et al. (2010) but questionedby Alves de Oliveira et al. (2010). No astrometric confirmation isavailable and it will remain hard in ρ Ophiuchus due to the smallmean motion of members of this region.
We note the low success rate of wide-field surveys of youngpopulations involving methane filters. For example, all of our fivecandidates are rejected after obtaining second epoch imaging andadditional photometry. Burgess et al. (2009) reported three T-typecandidates but later rejected two of them using optical imaging.Similarly, Spezzi et al. (2012) reported four T-type candidates from a
methane imaging combined with JHK photometry and rejected twoof them (the third may be a non-member too) from their positions invarious colour–colour and colour–magnitude diagrams. We believeit is essential that additional photometry (e.g. deep optical i and z),spectroscopy or astrometry is obtained for the 22 candidate T-typemembers of ρ Oph identified by Haisch et al. (2010) so that theirnature can be more rigorously examined.
So, after eliminating the five T-type candidates here, we haveonly one photometric candidate left (UGCS J16064645−2231238)in our one square degree survey in USco (Lodieu et al. 2011a).This candidate is the only object found in our survey with J fainterthan ∼19 mag. We reach a 5σ limit of 21 mag, similar to the deepVISTA survey of 0.78 square degree in σ Orionis of Pena Ramırezet al. (2012) where three T-type candidates were identified, al-though proper motions indicate that two of them are likely to benon-members. Hence, our results are consistent with the main con-clusions of Pena Ramırez et al. (2012) that we may see a turnoverof the mass function below 10–4 MJup [depending on the isochrones(NextGen, DUSTY, BT-Settl) used and the age elected for USco(5 or 10 Myr) Baraffe et al. 1998; Chabrier et al. 2000; Allard,Homeier & Freytag 2012] unless young T-type brown dwarfs arefainter than predicted by state-of-the-art models.
The next step in our quest for the bottom of the stellar/substellarinitial mass function in USco is to obtain deeper and wider imagingusing a combination of Z, Y, J passbands where the USco sequencecan be clearly de-lineated from the general field population (Lodieuet al. 2007). We have targeted over 10 square degree in USco withthe largest infrared camera in the world, VIRCAM (Dalton et al.2006), installed on VISTA to address this fundamental questionregarding the fragmentation limit (Low & Lynden-Bell 1976; Rees1976). Our results will be presented in a forthcoming paper.
AC K N OW L E D G E M E N T S
NL was funded by the Ramon y Cajal fellowship number 08-303-01-02 and the national programme AYA2010-19136 funded by theSpanish ministry of Economy and Competitiveness (MINECO). Wethank Nigel Hambly for his advice on proper motion measurement.
This work is based on observations made with the ESO NewTechnology telescope at the La Silla Paranal Observatory underprogramme ID 089.C-0854(A) in visitor mode, and with the GranTelescopio Canarias (GTC), operated on the island of La Palmain the Spanish Observatorio del Roque de los Muchachos of theInstituto de Astrofısica de Canarias.
R E F E R E N C E S
Adelman-McCarthy J. K. et al., 2011, VizieR Online Data Catalog, 2306, 0Allard F., Homeier D., Freytag B., 2012, R. Soc. Lond. Philos. Trans. Ser.
A, 370, 2765Alves de Oliveira C., Moraux E., Bouvier J., Bouy H., Marmo C., Albert L.,
2010, A&A, 515, A75Ardila D., Martın E., Basri G., 2000, AJ, 120, 479Baraffe I., Chabrier G., Allard F., Hauschildt P. H., 1998, A&A, 337, 403Bertin E., Arnouts S., 1996, A&AS, 117, 393Bihain G., Rebolo R., Zapatero Osorio M. R., Bejar V. J. S., Caballero J. A.,
2010, A&A, 519, A93Boss A. P., 2001, ApJ, 551, L167Bouvier J. et al., 2008, A&A, 481, 661Burgasser A. J., Kirkpatrick J. D., McGovern M. R., McLean I. S., Prato L.,
Reid I. N., 2004, ApJ, 604, 827Burgess A. S. M., Moraux E., Bouvier J., Marmo C., Albert L., Bouy H.,
2009, A&A, 508, 823
at :: on May 7, 2013
http://mnras.oxfordjournals.org/
Dow
nloaded from

Proper motions of Upper Sco T-type candidates 1789
Casali M. et al., 2007, A&A, 467, 77Casewell S. L., Dobbie P. D., Hodgkin S. T., Moraux E., Jameson R. F.,
Hambly N. C., Irwin J., Lodieu N., 2007, MNRAS, 378, 1131Casewell S. L., Jameson R. F., Burleigh M. R., Dobbie P. D., Roy M.,
Hodgkin S. T., Moraux E., 2011, MNRAS, 412, 2071Cepa J. et al., 2000, in Iye M., Moorwood A. F., eds, Proc. SPIE Conf. Ser.
Vol. 4008, OSIRIS tunable imager and spectrograph. SPIE, Bellingham,p. 623
Chabrier G., Baraffe I., Allard F., Hauschildt P., 2000, ApJ, 542, 464Cutri R. M. et al., 2003, 2MASS All Sky Catalog of Point Sources, 2246Dalton G. B. et al., 2006, Proc. SPIE Conf. Ser. Vol. 6269, Ground-based and
Airborne Instrumentation for Astronomy. SPIE, Bellingham, p. 62690XDawson P., Scholz A., Ray T. P., 2011, MNRAS, 418, 1231Dawson P., Scholz A., Ray T. P., Marsh K. A., Wood K., Natta A., Padgett
D., Ressler M. E., 2013, MNRAS, 429, 903de Zeeuw P. T., Hoogerwerf R., de Bruijne J. H. J., Brown A. G. A., Blaauw
A., 1999, AJ, 117, 354Emerson J. P., Sutherland W. J., McPherson A. M., Craig S. C., Dalton G.
B., Ward A. K., 2004, Messenger, 117, 27Geers V., Scholz A., Jayawardhana R., Lee E., Lafreniere D., Tamura M.,
2011, ApJ, 726, 23Haisch K. E., Jr, Barsony M., Tinney C., 2010, ApJ, 719, L90Hawley S. L. et al., 2002, AJ, 123, 3409Hewett P. C., Warren S. J., Leggett S. K., Hodgkin S. T., 2006, MNRAS,
367, 454Holberg J. B., Oswalt T. D., Barstow M. A., 2012, AJ, 143, 68Hoogerwerf R., de Bruijne J. H. J., Brown A. G. A., Aguilar L. A., de Zeeuw
P. T., 1997, in Proc. ESA Symp.: Hipparcos - Venice 97, ESA SP-402,p. 571
Joye W. A., Mandel E., 2003, in Payne H. E., Jedrzejewski R. I., Hook R.N., eds, ASP Conf. Ser. Vol. 295, New Features of SAOImage DS9.Astron. Soc. Pac., San Francisco, p. 489
Kumar S. S., 1969, in Kumar S. S., ed., Low-Luminosity Stars. The natureof low-mass ‘dark’ companions. Gordon and Breach, New York, p. 255
Kunkel M., 1999, PhD thesis, Julius-Maximilians-Universitat WurzburgLawrence A. et al., 2007, MNRAS, 379, 1599Lodieu N., Hambly N. C., Jameson R. F., 2006, MNRAS, 373, 95Lodieu N., Hambly N. C., Jameson R. F., Hodgkin S. T., Carraro G., Kendall
T. R., 2007, MNRAS, 374, 372Lodieu N., Hambly N. C., Jameson R. F., Hodgkin S. T., 2008, MNRAS,
383, 1385Lodieu N., Hambly N. C., Dobbie P. D., Cross N. J. G., Christensen L.,
Martin E. L., Valdivielso L., 2011a, MNRAS, 418, 2604Lodieu N., Dobbie P. D., Hambly N. C., 2011b, A&A, 527, A24Lodieu N., Deacon N. R., Hambly N. C., 2012, MNRAS, 422, 1495Lodieu N. et al., 2013, A&A, arXiv:1301.3280LLow C., Lynden-Bell D., 1976, MNRAS, 176, 367Luhman K. L., Hernandez J., Downes J. J., Hartmann L., Briceno C., 2008,
ApJ, 688, 362
Marsh K. A., Plavchan P., Kirkpatrick J. D., Lowrance P. J., Cutri R. M.,Velusamy T., 2010, ApJ, 719, 550
Martın E. L., Delfosse X., Guieu S., 2004, AJ, 127, 449Martın E. L. et al., 2010, A&A, 517, A53Moorwood A., Cuby J.-G., Lidman C., 1998, Messenger, 91, 9Pecaut M. J., Mamajek E. E., Bubar E. J., 2012, ApJ, 746, 154Pena Ramırez K., Zapatero Osorio M. R., Bejar V. J. S., Rebolo R., Bihain
G., 2011, A&A, 532, A42Pena Ramırez K., Bejar V. J. S., Zapatero Osorio M. R., Petr-Gotzens
M. G., Martın E. L., 2012, ApJ, 754, 30Pinfield D. J. et al., 2008, MNRAS, 390, 304Preibisch T., Zinnecker H., 1999, AJ, 117, 2381Preibisch T., Zinnecker H., 2002, AJ, 123, 1613Preibisch T., Guenther E., Zinnecker H., Sterzik M., Frink S., Roeser S.,
1998, A&A, 333, 619Preibisch T., Guenther E., Zinnecker H., 2001, AJ, 121, 1040Preibisch T., Brown A. G. A., Bridges T., Guenther E., Zinnecker H., 2002,
AJ, 124, 404Rees M. J., 1976, MNRAS, 176, 483Schmidt S. J., West A. A., Hawley S. L., Pineda J. S., 2010, AJ, 139, 1808Scholz A., Jayawardhana R., 2008, ApJ, 672, L49Skrutskie M. F. et al., 2006, AJ, 131, 1163Slesnick C. L., Carpenter J. M., Hillenbrand L. A., 2006, AJ, 131, 3016Slesnick C. L., Hillenbrand L. A., Carpenter J. M., 2008, ApJ, 688, 377Song I., Zuckerman B., Bessell M. S., 2012, AJ, 144, 8Spezzi L., Alves de Oliveira C., Moraux E., Bouvier J., Winston E., Hudelot
P., Bouy H., Cuillandre J.-C., 2012, A&A, 545, A105Stamatellos D., Whitworth A. P., 2008, A&A, 480, 879Tody D., 1986, in Crawford D. L., ed., Prpc. SPIE Conf. Ser. Vol. 627,
The IRAF Data Reduction and Analysis System. SPIE, Bellingham,p. 733
Tody D., 1993, in Hanisch R. J., Brissenden R. J. V., Barnes J., eds, ASPConf. Ser. Vol. 52, IRAF in the Nineties. Astron. Soc. Pac., San Fran-cisco, p. 173
Walter F. M., Vrba F. J., Mathieu R. D., Brown A., Myers P. C., 1994, AJ,107, 692
West A. A., Walkowicz L. M., Hawley S. L., 2005, PASP, 117, 706West A. A., Hawley S. L., Bochanski J. J., Covey K. R., Reid I. N., Dhital
S., Hilton E. J., Masuda M., 2008, AJ, 135, 785Zapatero Osorio M. R., Bejar V. J. S., Martın E. L., Rebolo R., Barrado y
Navascues D., Mundt R., Eisloffel J., Caballero J. A., 2002, ApJ, 578,536
Zapatero Osorio M. R. et al., 2008, A&A, 477, 895Zhang Z. H. et al., 2009, A&A, 497, 619
This paper has been typeset from a TEX/LATEX file prepared by the author.
at :: on May 7, 2013
http://mnras.oxfordjournals.org/
Dow
nloaded from