propagation characteristics in indoor office scenario at 3
TRANSCRIPT
Propagation Characteristics in Indoor OfficeScenario at 3.5 GHz
Jing Zeng†, Jianhua Zhang∗†,∗Key Laboratory of Universal Wireless Communications, Ministry of Education,†Wireless Technology Innovation Institute
Beijing University of Posts and Telecommunications, P.O. box #92, China,100876Email: [email protected]
Abstract—This paper presents results from the measurementin indoor office scenario at 3.5 GHz. The measurement wasperformed using vertical-polarized dipole antennas (VDA) andomni-directional array (ODA). Three cases including corridor-to-corridor, corridor-to-room and room-to-room, have been mea-sured and comprehensive propagation characteristics have beeninvestigated. Based on the measurement, large-scale, delay andspatial models are built and compared with the standard models.Path loss turns out to be 3-5 dB smaller in indoor line-of-sightcondition, while it is larger in non-line-of-sight condition becauseof the attenuation of concrete walls. Delay spread is the maximalin corridor-to-corridor case due to a strong reflection multipathcomponent and angular spread in space domain is much largerthan standard models in indoor scenario.
I. INTRODUCTION
With the indoor data service increasing dramatically, moreand more new techniques have been put forward to cope withindoor traffic explosion. Broadening bandwidth and improvingspectrum efficiency are two ways. However, considering theshortage of frequency resource, finding sufficient and suitablefrequency band is urgent to the future communication services.So higher frequency bands draw our attention. Recently, smallcell enhancement for hotspot deployments in indoor scenariois proposed by the 3rd Generation Partner Project (3GPP) inTR 36.932 [1], with special focus on higher frequency bands,e.g., the 3.5 GHz band, to enjoy the more available spectrumand wider bandwidth. Besides, 3.5 GHz has been discussed toallocate in indoor deployment in China.
In real environments, the achievable capacity and perfor-mance depend to a large extent on the radio channel. Soaccurate channel models are of vital importance to systemsimulation. Path loss and shadow fading are key parameters toanalyze indoor coverage; delay spread (DS) limits the length ofcyclic prefix in Orthogonal Frequency-Division Multiplexing(OFDM) system; angular spread (AS) indicates the degree ofdispersion in space domain. All these propagation characteris-tics should be modeled accurately. However, when frequencyincreases, radio wave becomes shorter in wavelength andsuffers more power loss during the propagation so that the cov-erage area becomes smaller [2]. Furthermore, different indoorlayouts have different propagation characteristics. Currently,the standard model International Telecommunication Union(ITU) M.2135 [3] only defines one scenario named indoorhotspot for the indoor environment. Indoor office scenario, asone of the typical and common indoor environment, defined
as A1 in Wireless World Initiative New Radio (WINNER) IIchannel model [4], but its channel models are built based onthe measurement at 2.45 GHz and 5.25 GHz.
The propagation environment is complicated in indoor sce-nario and many factors can have an impact on it, such as thematerials of walls and ceiling, or whether the door is open orclosed. To obtain realistic propagation characteristics, channelmeasurement is the most straightforward approach. So far,abundant measurements have been done in indoor scenarios atdifferent frequency [5]–[7]. However, numerous discrepanciesexist for the different carrier frequency and different layouts.So this establishes the necessity to precisely model indooroffice environment at a certain frequency.
3.5 GHz band has been used in Worldwide Interoperabilityfor Microwave Access (WIMAX) system, so most of themeasurements reported at 3.5 GHz are about WIMAX ra-dio channels [8], [9]. To our knowledge, the measurementsconducted in cellular system at 3.5 GHz are so little inindoor scenario. [10] compares path loss models for suburbanscenario at 2.3 GHz, 2.6 GHz and 3.5 GHz. [11] and [12]analyze multi-polarized statistics for outdoor-to-indoor andindoor-to-indoor channels at 3.5 GHz. The comprehensivechannel models in indoor office scenario at 3.5 GHz arelacking, so more attention should be paid.
Thus, in this paper, propagation characteristics in indoor of-fice scenario at 3.5 GHz is investigated. Three cases includingcorridor-to-corridor (C-C), corridor-to-room (C-R) and room-to-room (R-R), have been measured in detail. Comprehen-sive propagation characteristics, including path loss, shadowfading, DS and AS, have been analyzed and compared withstandard models for the three cases. More underlying reasonsare also analyzed.
The rest of this paper is organized as follows. Section IIgives a description of the measurement campaign. Section IIIintroduces the analysis methods of path loss, shadow fading,DS and AS. Detailed analysis results are shown in Section IVand Section V presents the relevant conclusions.
II. MEASUREMENT DESCRIPTION
A. Measurement System
To explore the comprehensive channel propagation char-acteristics, two types of antennas are used. One is vertical-polarized dipole antennas (VDA) and the other is omni-directional array (ODA). Electrobit Propsound Channel
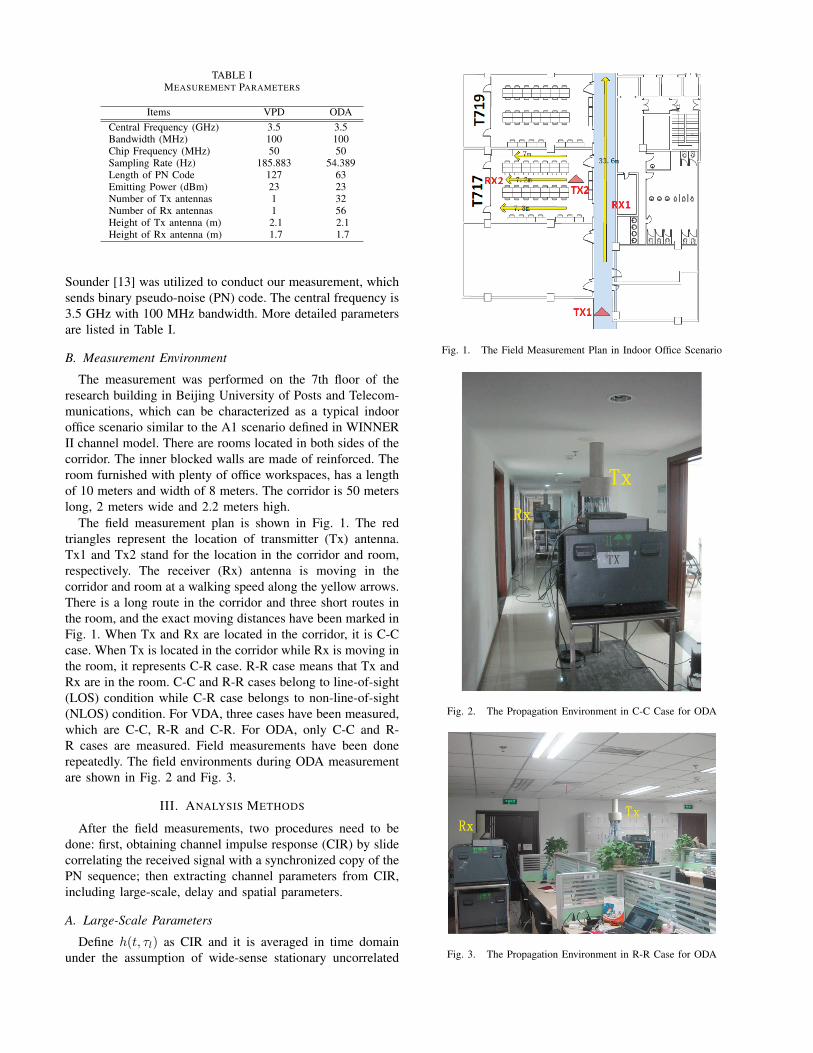
TABLE IMEASUREMENT PARAMETERS
Items VPD ODACentral Frequency (GHz) 3.5 3.5Bandwidth (MHz) 100 100Chip Frequency (MHz) 50 50Sampling Rate (Hz) 185.883 54.389Length of PN Code 127 63Emitting Power (dBm) 23 23Number of Tx antennas 1 32Number of Rx antennas 1 56Height of Tx antenna (m) 2.1 2.1Height of Rx antenna (m) 1.7 1.7
Sounder [13] was utilized to conduct our measurement, whichsends binary pseudo-noise (PN) code. The central frequency is3.5 GHz with 100 MHz bandwidth. More detailed parametersare listed in Table I.
B. Measurement Environment
The measurement was performed on the 7th floor of theresearch building in Beijing University of Posts and Telecom-munications, which can be characterized as a typical indooroffice scenario similar to the A1 scenario defined in WINNERII channel model. There are rooms located in both sides of thecorridor. The inner blocked walls are made of reinforced. Theroom furnished with plenty of office workspaces, has a lengthof 10 meters and width of 8 meters. The corridor is 50 meterslong, 2 meters wide and 2.2 meters high.
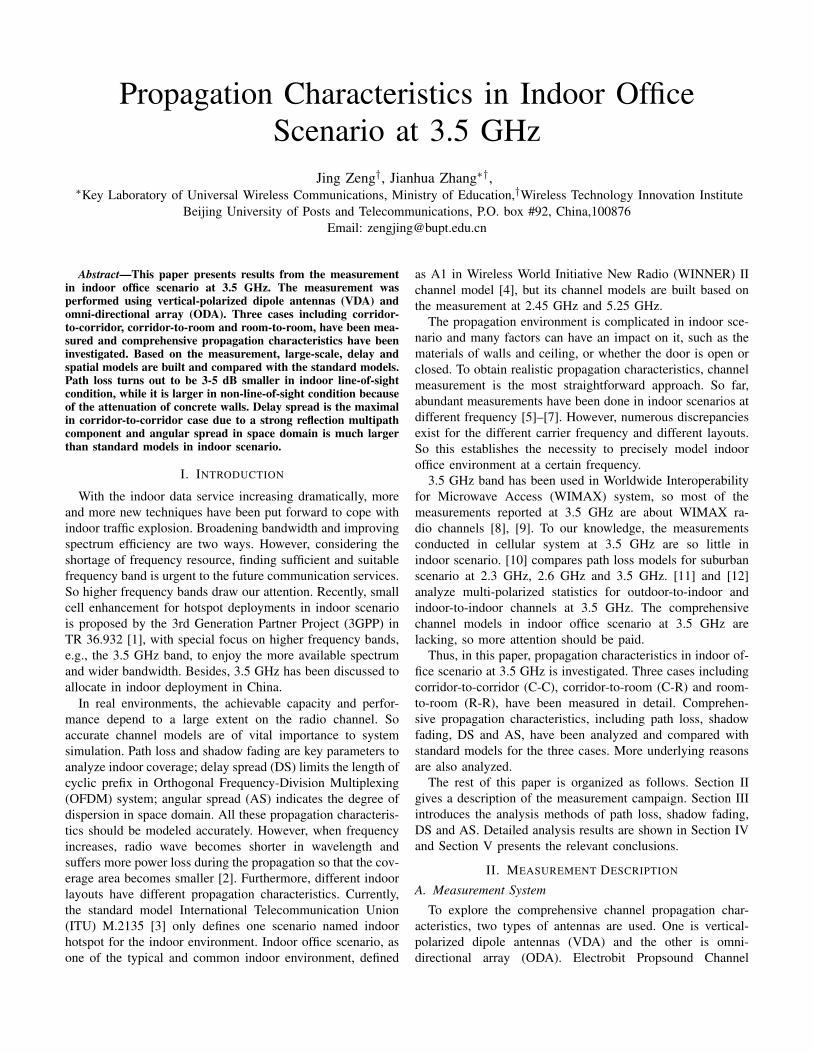
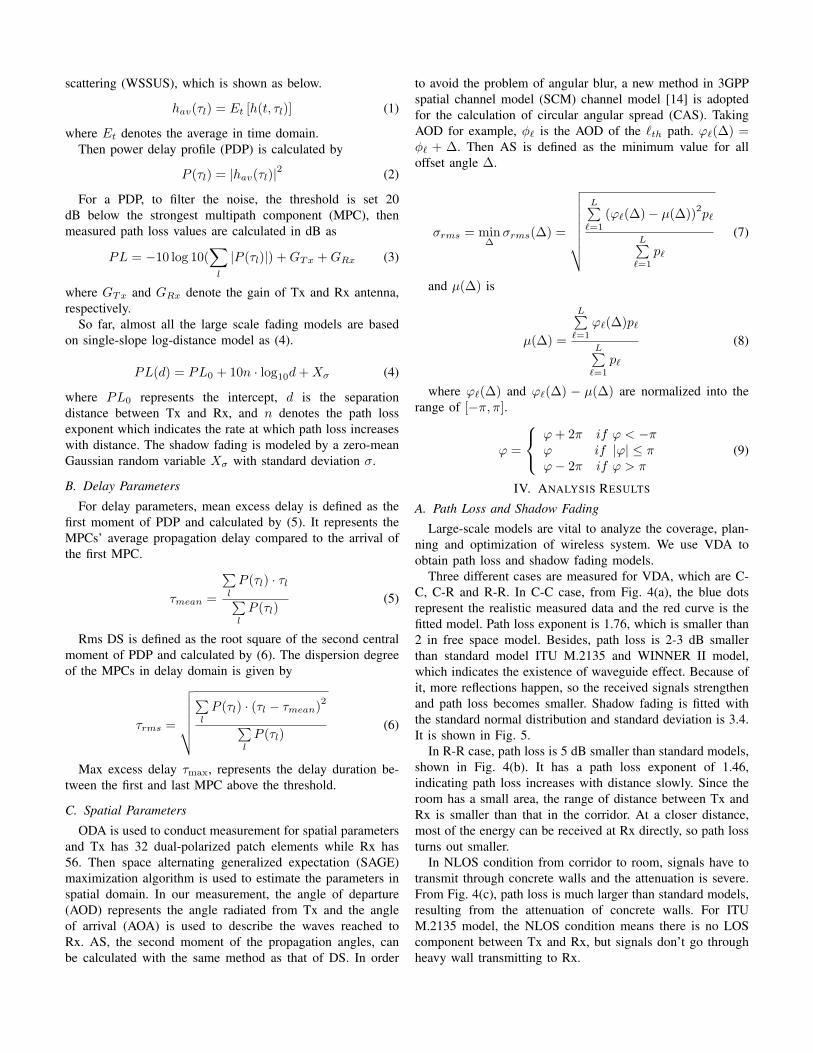
The field measurement plan is shown in Fig. 1. The redtriangles represent the location of transmitter (Tx) antenna.Tx1 and Tx2 stand for the location in the corridor and room,respectively. The receiver (Rx) antenna is moving in thecorridor and room at a walking speed along the yellow arrows.There is a long route in the corridor and three short routes inthe room, and the exact moving distances have been marked inFig. 1. When Tx and Rx are located in the corridor, it is C-Ccase. When Tx is located in the corridor while Rx is moving inthe room, it represents C-R case. R-R case means that Tx andRx are in the room. C-C and R-R cases belong to line-of-sight(LOS) condition while C-R case belongs to non-line-of-sight(NLOS) condition. For VDA, three cases have been measured,which are C-C, R-R and C-R. For ODA, only C-C and R-R cases are measured. Field measurements have been donerepeatedly. The field environments during ODA measurementare shown in Fig. 2 and Fig. 3.
III. ANALYSIS METHODS
After the field measurements, two procedures need to bedone: first, obtaining channel impulse response (CIR) by slidecorrelating the received signal with a synchronized copy of thePN sequence; then extracting channel parameters from CIR,including large-scale, delay and spatial parameters.
A. Large-Scale Parameters
Define h(t, τl) as CIR and it is averaged in time domainunder the assumption of wide-sense stationary uncorrelated
Fig. 1. The Field Measurement Plan in Indoor Office Scenario
Fig. 2. The Propagation Environment in C-C Case for ODA
Fig. 3. The Propagation Environment in R-R Case for ODA
scattering (WSSUS), which is shown as below.
hav(τl) = Et [h(t, τl)] (1)
where Et denotes the average in time domain.Then power delay profile (PDP) is calculated by
P (τl) = |hav(τl)|2 (2)
For a PDP, to filter the noise, the threshold is set 20dB below the strongest multipath component (MPC), thenmeasured path loss values are calculated in dB as
PL = −10 log 10(∑l
|P (τl)|) +GTx +GRx (3)
where GTx and GRx denote the gain of Tx and Rx antenna,respectively.
So far, almost all the large scale fading models are basedon single-slope log-distance model as (4).
PL(d) = PL0 + 10n · log10d+Xσ (4)
where PL0 represents the intercept, d is the separationdistance between Tx and Rx, and n denotes the path lossexponent which indicates the rate at which path loss increaseswith distance. The shadow fading is modeled by a zero-meanGaussian random variable Xσ with standard deviation σ.
B. Delay Parameters
For delay parameters, mean excess delay is defined as thefirst moment of PDP and calculated by (5). It represents theMPCs’ average propagation delay compared to the arrival ofthe first MPC.
τmean =
∑l
P (τl) · τl∑l
P (τl)(5)
Rms DS is defined as the root square of the second centralmoment of PDP and calculated by (6). The dispersion degreeof the MPCs in delay domain is given by
τrms =
√√√√√√∑l
P (τl) · (τl − τmean)2∑
l
P (τl)(6)
Max excess delay τmax, represents the delay duration be-tween the first and last MPC above the threshold.
C. Spatial Parameters
ODA is used to conduct measurement for spatial parametersand Tx has 32 dual-polarized patch elements while Rx has56. Then space alternating generalized expectation (SAGE)maximization algorithm is used to estimate the parameters inspatial domain. In our measurement, the angle of departure(AOD) represents the angle radiated from Tx and the angleof arrival (AOA) is used to describe the waves reached toRx. AS, the second moment of the propagation angles, canbe calculated with the same method as that of DS. In order
to avoid the problem of angular blur, a new method in 3GPPspatial channel model (SCM) channel model [14] is adoptedfor the calculation of circular angular spread (CAS). TakingAOD for example, ϕℓ is the AOD of the ℓth path. φℓ(∆) =ϕℓ + ∆. Then AS is defined as the minimum value for alloffset angle ∆.
σrms = min∆
σrms(∆) =
√√√√√√√√L∑
ℓ=1
(φℓ(∆)− µ(∆))2pℓ
L∑ℓ=1
pℓ
(7)
and µ(∆) is
µ(∆) =
L∑ℓ=1
φℓ(∆)pℓ
L∑ℓ=1
pℓ
(8)
where φℓ(∆) and φℓ(∆) − µ(∆) are normalized into therange of [−π, π].
φ =
φ+ 2π if φ < −πφ if |φ| ≤ πφ− 2π if φ > π
(9)
IV. ANALYSIS RESULTS
A. Path Loss and Shadow Fading
Large-scale models are vital to analyze the coverage, plan-ning and optimization of wireless system. We use VDA toobtain path loss and shadow fading models.
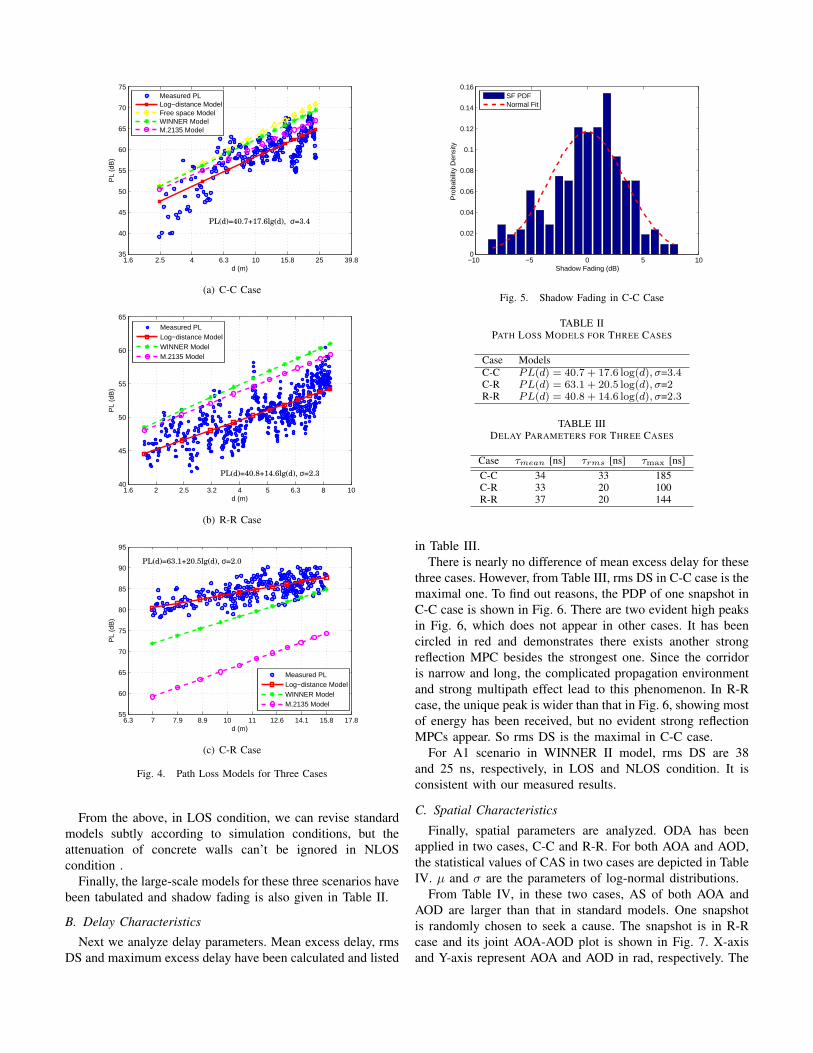
Three different cases are measured for VDA, which are C-C, C-R and R-R. In C-C case, from Fig. 4(a), the blue dotsrepresent the realistic measured data and the red curve is thefitted model. Path loss exponent is 1.76, which is smaller than2 in free space model. Besides, path loss is 2-3 dB smallerthan standard model ITU M.2135 and WINNER II model,which indicates the existence of waveguide effect. Because ofit, more reflections happen, so the received signals strengthenand path loss becomes smaller. Shadow fading is fitted withthe standard normal distribution and standard deviation is 3.4.It is shown in Fig. 5.
In R-R case, path loss is 5 dB smaller than standard models,shown in Fig. 4(b). It has a path loss exponent of 1.46,indicating path loss increases with distance slowly. Since theroom has a small area, the range of distance between Tx andRx is smaller than that in the corridor. At a closer distance,most of the energy can be received at Rx directly, so path lossturns out smaller.
In NLOS condition from corridor to room, signals have totransmit through concrete walls and the attenuation is severe.From Fig. 4(c), path loss is much larger than standard models,resulting from the attenuation of concrete walls. For ITUM.2135 model, the NLOS condition means there is no LOScomponent between Tx and Rx, but signals don’t go throughheavy wall transmitting to Rx.
1.6 2.5 4 6.3 10 15.8 25 39.835
40
45
50
55
60
65
70
75
d (m)
PL
(dB
)
Measured PLLog−distance ModelFree space ModelWINNER ModelM.2135 Model
PL(d)=40.7+17.6lg(d), σ=3.4
(a) C-C Case
1.6 2 2.5 3.2 4 5 6.3 8 1040
45
50
55
60
65
d (m)
PL
(dB
)
Measured PLLog−distance ModelWINNER ModelM.2135 Model
PL(d)=40.8+14.6lg(d), σ=2.3
(b) R-R Case
6.3 7 7.9 8.9 10 11 12.6 14.1 15.8 17.855
60
65
70
75
80
85
90
95
d (m)
PL
(dB
)
Measured PLLog−distance ModelWINNER ModelM.2135 Model
PL(d)=63.1+20.5lg(d), σ=2.0
(c) C-R Case
Fig. 4. Path Loss Models for Three Cases
From the above, in LOS condition, we can revise standardmodels subtly according to simulation conditions, but theattenuation of concrete walls can’t be ignored in NLOScondition .
Finally, the large-scale models for these three scenarios havebeen tabulated and shadow fading is also given in Table II.
B. Delay Characteristics
Next we analyze delay parameters. Mean excess delay, rmsDS and maximum excess delay have been calculated and listed
−10 −5 0 5 100
0.02
0.04
0.06
0.08
0.1
0.12
0.14
0.16
Shadow Fading (dB)
Pro
babi
lity
Den
sity
SF PDFNormal Fit
Fig. 5. Shadow Fading in C-C Case
TABLE IIPATH LOSS MODELS FOR THREE CASES
Case ModelsC-C PL(d) = 40.7 + 17.6 log(d), σ=3.4C-R PL(d) = 63.1 + 20.5 log(d), σ=2R-R PL(d) = 40.8 + 14.6 log(d), σ=2.3
TABLE IIIDELAY PARAMETERS FOR THREE CASES
Case τmean [ns] τrms [ns] τmax [ns]C-C 34 33 185C-R 33 20 100R-R 37 20 144
in Table III.There is nearly no difference of mean excess delay for these
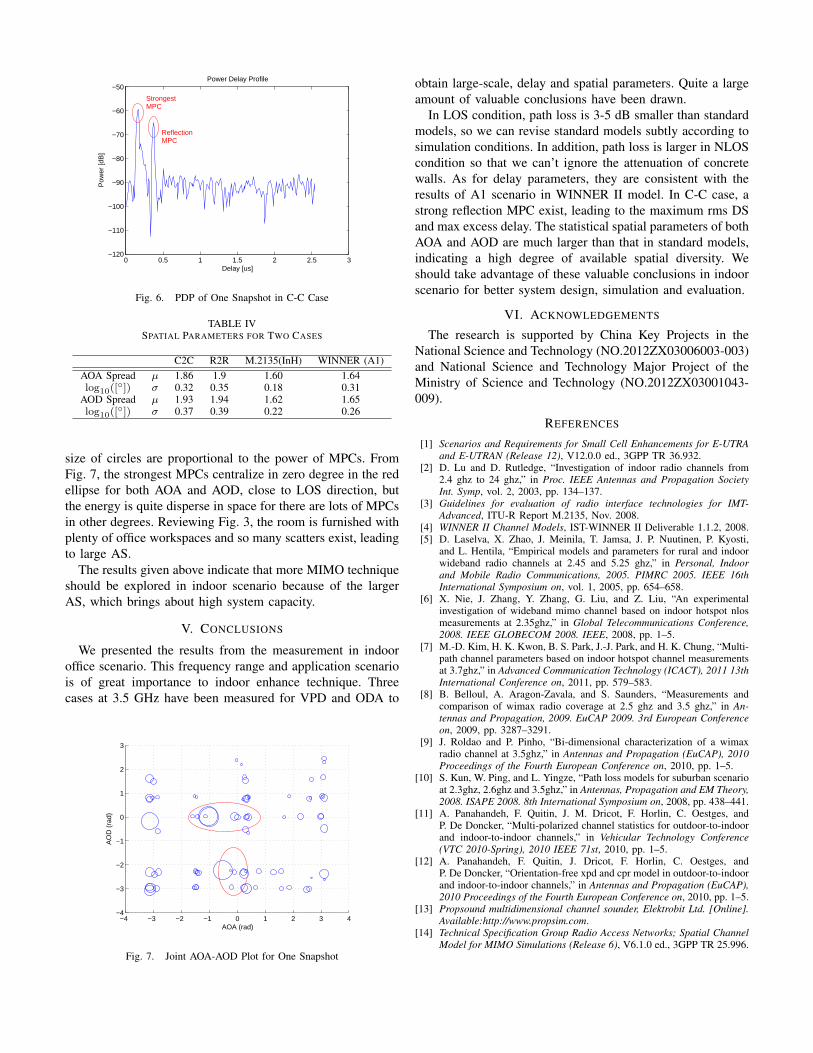
three cases. However, from Table III, rms DS in C-C case is themaximal one. To find out reasons, the PDP of one snapshot inC-C case is shown in Fig. 6. There are two evident high peaksin Fig. 6, which does not appear in other cases. It has beencircled in red and demonstrates there exists another strongreflection MPC besides the strongest one. Since the corridoris narrow and long, the complicated propagation environmentand strong multipath effect lead to this phenomenon. In R-Rcase, the unique peak is wider than that in Fig. 6, showing mostof energy has been received, but no evident strong reflectionMPCs appear. So rms DS is the maximal in C-C case.
For A1 scenario in WINNER II model, rms DS are 38and 25 ns, respectively, in LOS and NLOS condition. It isconsistent with our measured results.
C. Spatial Characteristics
Finally, spatial parameters are analyzed. ODA has beenapplied in two cases, C-C and R-R. For both AOA and AOD,the statistical values of CAS in two cases are depicted in TableIV. µ and σ are the parameters of log-normal distributions.
From Table IV, in these two cases, AS of both AOA andAOD are larger than that in standard models. One snapshotis randomly chosen to seek a cause. The snapshot is in R-Rcase and its joint AOA-AOD plot is shown in Fig. 7. X-axisand Y-axis represent AOA and AOD in rad, respectively. The
0 0.5 1 1.5 2 2.5 3−120
−110
−100
−90
−80
−70
−60
−50
Delay [us]
Pow
er [d
B]
Power Delay Profile
StrongestMPC
ReflectionMPC
Fig. 6. PDP of One Snapshot in C-C Case
TABLE IVSPATIAL PARAMETERS FOR TWO CASES
C2C R2R M.2135(InH) WINNER (A1)AOA Spread µ 1.86 1.9 1.60 1.64log10([
◦]) σ 0.32 0.35 0.18 0.31AOD Spread µ 1.93 1.94 1.62 1.65log10([
◦]) σ 0.37 0.39 0.22 0.26
size of circles are proportional to the power of MPCs. FromFig. 7, the strongest MPCs centralize in zero degree in the redellipse for both AOA and AOD, close to LOS direction, butthe energy is quite disperse in space for there are lots of MPCsin other degrees. Reviewing Fig. 3, the room is furnished withplenty of office workspaces and so many scatters exist, leadingto large AS.
The results given above indicate that more MIMO techniqueshould be explored in indoor scenario because of the largerAS, which brings about high system capacity.
V. CONCLUSIONS
We presented the results from the measurement in indooroffice scenario. This frequency range and application scenariois of great importance to indoor enhance technique. Threecases at 3.5 GHz have been measured for VPD and ODA to
−4 −3 −2 −1 0 1 2 3 4−4
−3
−2
−1
0
1
2
3
AOA (rad)
AO
D (
rad)
Fig. 7. Joint AOA-AOD Plot for One Snapshot
obtain large-scale, delay and spatial parameters. Quite a largeamount of valuable conclusions have been drawn.
In LOS condition, path loss is 3-5 dB smaller than standardmodels, so we can revise standard models subtly according tosimulation conditions. In addition, path loss is larger in NLOScondition so that we can’t ignore the attenuation of concretewalls. As for delay parameters, they are consistent with theresults of A1 scenario in WINNER II model. In C-C case, astrong reflection MPC exist, leading to the maximum rms DSand max excess delay. The statistical spatial parameters of bothAOA and AOD are much larger than that in standard models,indicating a high degree of available spatial diversity. Weshould take advantage of these valuable conclusions in indoorscenario for better system design, simulation and evaluation.
VI. ACKNOWLEDGEMENTS
The research is supported by China Key Projects in theNational Science and Technology (NO.2012ZX03006003-003)and National Science and Technology Major Project of theMinistry of Science and Technology (NO.2012ZX03001043-009).
REFERENCES
[1] Scenarios and Requirements for Small Cell Enhancements for E-UTRAand E-UTRAN (Release 12), V12.0.0 ed., 3GPP TR 36.932.
[2] D. Lu and D. Rutledge, “Investigation of indoor radio channels from2.4 ghz to 24 ghz,” in Proc. IEEE Antennas and Propagation SocietyInt. Symp, vol. 2, 2003, pp. 134–137.
[3] Guidelines for evaluation of radio interface technologies for IMT-Advanced, ITU-R Report M.2135, Nov. 2008.
[4] WINNER II Channel Models, IST-WINNER II Deliverable 1.1.2, 2008.[5] D. Laselva, X. Zhao, J. Meinila, T. Jamsa, J. P. Nuutinen, P. Kyosti,
and L. Hentila, “Empirical models and parameters for rural and indoorwideband radio channels at 2.45 and 5.25 ghz,” in Personal, Indoorand Mobile Radio Communications, 2005. PIMRC 2005. IEEE 16thInternational Symposium on, vol. 1, 2005, pp. 654–658.
[6] X. Nie, J. Zhang, Y. Zhang, G. Liu, and Z. Liu, “An experimentalinvestigation of wideband mimo channel based on indoor hotspot nlosmeasurements at 2.35ghz,” in Global Telecommunications Conference,2008. IEEE GLOBECOM 2008. IEEE, 2008, pp. 1–5.
[7] M.-D. Kim, H. K. Kwon, B. S. Park, J.-J. Park, and H. K. Chung, “Multi-path channel parameters based on indoor hotspot channel measurementsat 3.7ghz,” in Advanced Communication Technology (ICACT), 2011 13thInternational Conference on, 2011, pp. 579–583.
[8] B. Belloul, A. Aragon-Zavala, and S. Saunders, “Measurements andcomparison of wimax radio coverage at 2.5 ghz and 3.5 ghz,” in An-tennas and Propagation, 2009. EuCAP 2009. 3rd European Conferenceon, 2009, pp. 3287–3291.
[9] J. Roldao and P. Pinho, “Bi-dimensional characterization of a wimaxradio channel at 3.5ghz,” in Antennas and Propagation (EuCAP), 2010Proceedings of the Fourth European Conference on, 2010, pp. 1–5.
[10] S. Kun, W. Ping, and L. Yingze, “Path loss models for suburban scenarioat 2.3ghz, 2.6ghz and 3.5ghz,” in Antennas, Propagation and EM Theory,2008. ISAPE 2008. 8th International Symposium on, 2008, pp. 438–441.
[11] A. Panahandeh, F. Quitin, J. M. Dricot, F. Horlin, C. Oestges, andP. De Doncker, “Multi-polarized channel statistics for outdoor-to-indoorand indoor-to-indoor channels,” in Vehicular Technology Conference(VTC 2010-Spring), 2010 IEEE 71st, 2010, pp. 1–5.
[12] A. Panahandeh, F. Quitin, J. Dricot, F. Horlin, C. Oestges, andP. De Doncker, “Orientation-free xpd and cpr model in outdoor-to-indoorand indoor-to-indoor channels,” in Antennas and Propagation (EuCAP),2010 Proceedings of the Fourth European Conference on, 2010, pp. 1–5.
[13] Propsound multidimensional channel sounder, Elektrobit Ltd. [Online].Available:http://www.propsim.com.
[14] Technical Specification Group Radio Access Networks; Spatial ChannelModel for MIMO Simulations (Release 6), V6.1.0 ed., 3GPP TR 25.996.