proof-abec-2010-77 - abechem.com. 1-2011/2011,3_1_, 67-86.pdf · the terpolymer sample p-cof-ii...
TRANSCRIPT

Anal. Bioanal. Electrochem., Vol. 3, No. 1, 2011, 67-86
Full Paper
Studies on Semiconducting, Chelating and Thermal Properties of P-Cresol–Oxamide-Formaldehyde Terpolymer Resin
Rajesh Narayanrao Singru,1,* Vandana Arun Khati,2 Wasudeo Buburao Gurnule3, Anil
Bhausaheb Zade,1 Jivan Ramanna Dontulwar4
1 Department of Chemistry, Laxminarayan Institute of Technology, RTM Nagpur University,
Nagpur – 440 010, India 2 Department of Physics,Institute of Science, Nagpur, India 3 Department of Chemistry, Kamla Nehru College, Nagpur – 440 009, India 4 Priyadarshani Institute of Engeenearing and Technology, Nagpur-440 019, India
* Corresponding Author; Tel.: 91-0712-2284032; Fax: 91-0712-2747853
E-Mails: [email protected]
Received: 23 November 2010 / Accepted: 13 February 2011 / Published online: 28 February
2011
Abstract- The title terpolymer (p-COF-II) synthesized by the condensation of p-Cresol (p-C) and Oxamide (O) with Formaldehyde (F) in the presence of acid catalyst and using 2:1:3 molar proportions of the reacting monomers. The synthesized terpolymer resin then characterized by elemental analysis and spectral studies like IR, 1H NMR, 13C NMR and XRD. The morphology of synthesized terpolymer was studied by scanning electron microscopy (SEM).The electrical property was measured over a wide range of temperature (313-403K).The plot of log vs. 103/T of the resin is linear over a wide range of temperature showing its semiconducting nature. The chelating ion-exchange study was carried out over a wide pH range, shaking time and in media of various ionic strengths for seven metal ions Fe (III), Cu (II), Ni (II), Co (II), Zn (II), Cd (II) and Pb (II) in the form of their metal nitrate solutions. The terpolymer showed a higher selectivity for Fe (III), Cu (II), and Ni (II) ions. Thermal study of the resin was carried out to determine its mode of decomposition and thermal stability. By using data of thermogravimetry various kinetic parameter like frequency factor (Z), entropy change (S), free energy change (F) and apparent entropy (S*) have been determined using Freeman-Carroll method. Keywords- Semiconductor, Ion-exchanger, Adsorption, Thermogravimetric Analysis, Synthesis
Analytical & Bioanalytical Electrochemistry
© 2011 by CEE
www.abechem.com

Anal. Bioanal. Electrochem., Vol. 3, No. 1, 2011, 67-86
1. INTRODUCTION
The synthesized terpolymer resins with highly conjugated chains have attracted much
attention of scientist and introduce the recent innovations in the polymer chemistry in the last
few years because they show versatile applications and properties. The terpolymer resins can
be used as high energy material, ion-exchanger, semiconductors, antioxidants, fire proofing
agent, optical storage data, binders, molding materials etc [1,2,3].
The semiconducting properties of terpolymer resins have gained sufficient ground in
recent years. Electrically conducting polymer resins are undoubtedly one of the focal points
of current interest in solid-state physics and chemistry. Their discovery has led to the
emergency of not only new types of materials capable of replacing metals but also new
concepts to explain their high conductivity. Work on organic conducting polymers is carried
out extensively due to their wide applications in areas such as corrosion protection and
antistatic coatings [4], in biosensors for coupling of electron transfer [5], fabrication of
electrochemical windows and gas sensors [6], development of individual electronic devices
and whole integrated circuits [7,8] etc. Delocalized electrons and conjugation impart
semiconducting properties to the polymer resins.
Pollution by toxic heavy metals due to their toxicities in relatively low concentration and
tendency to bioaccumulation in the ecosystem, agriculture, and human body has received
wide spread attention in recent years. Various approaches such as ion-exchange, reverse
osmosis, electro dialysis, precipitation, and adsorption techniques have been developed for
the removal and recovery of the metal ions from sewage and industrial wastewater. Among
these techniques, many research works have focused on metal ions removal by adsorption on
chelating polymers, because they are reusable, easily separable, and with higher adsorption
capacity and selectivity having physical and chemical stabilities [9, 10]. Chelating ion-
exchange properties of the resin involving poly [(2, 4-dihydroxybenzophenone) butylenes] V
and its polychelates with transition metals are reported [11]. A new chelating sorbent for
metal ion extraction under saline conditions has also been studied [12].
The study of the thermal degradation of terpolymer resins have recently become a subject
of interest. Terpolymer resins having good thermal stability have enhanced the scope for
development of some polymeric materials. Michael EP, et al. studied the thermal
decomposition behavior of 8-hydroxyquinoline-guanidine-formaldehyde terpolymer [13].
The present paper explored the synthesis and characterizations of p-Cresol-Oxamide-
Formaldehyde (p-COF-II) terpolymer resin which exhibits a unique combination of
properties: chelating and thermal properties along with the semiconducting nature.

Anal. Bioanal. Electrochem., Vol. 3, No. 1, 2011, 67-86
2. EXPERIMENTAL
2.1. Starting materials
The chemicals (starting materials) were of Analar or Chemically pure grade and wherever
necessary the purity was tested and confirmed by TLC.
2.2. Synthesis of p-COF-II terpolymer resin
The new terpolymer resin p-COF-II was synthesized by condensing p-cresol (2.16 g, 0.2
mol) and oxamide (0.88 g, 0.1 mol) with 37 % formaldehyde (11.1 ml, 0.3 mol) in a mol ratio
of 2:1:3 in the presence of 2M 200 ml HCl as a catalyst at 130oC±2oC for 5h in an oil bath
with occasional shaking to ensure thorough mixing. The separated cream color terpolymer
resin was washed with hot water and methanol to remove unreacted starting materials and
acid monomers. The properly washed resin was dried, powdered and then extracted with
diethyl ether and then with petroleum ether to remove p-cresol-formaldehyde copolymer
which might be present along with p-COF-II terpolymer. The terpolymer resin was purified
further by dissolving in 8% aqueous sodium hydroxide solution, filtered and reprecipitated by
gradual drop wise addition of ice cold 1:1 (v/v) concentrated hydrochloric acid / distilled
water with constant and rapid stirring to avoid lump formation. The process of reprecipitation
was repeated twice. The terpolymer sample p-COF-II thus obtained was filtered, washed
several times with hot water, dried in air, powdered and kept in vacuum desicator over silica
gel. The yield of the terpolymer resin was found to be 80%. The reaction and suggested
structure has been given in Fig. 1.
Fig. 1. Reaction and suggested structure of p-COF-II terpolymer resin
Anal. Bioanal. Electrochem., Vol. 3, No. 1, 2011, 67-86
3. CHARACTERIZATION
The viscosities of the p-COF-II terpolymer were determined using Taun-Fuoss
viscometer at six different concentrations ranging from 1.00 to 0.031% of terpolymer in
DMSO at 30C. The intrinsic viscosity was calculated by relevant plots of the Huggins’
equation (1) and Kramer’s equation (2).
sp/C = [] + K1 []2.C------------(1)
lnr/C = [] +K2[]2.C-----------(2)
Where C= concentration in gm/100 ml.
r = the ratio between viscosity of solution [] and viscosity of the solvent [0] is
known as relative viscosity r = /0
sp= this function has been derived from relative viscosity and given by
sp= (-0) / 0 = /0 - 1 = r – 1
[] = it is intrinsic viscosity obtained by extrapolating a plot of sp/C or ln r/C against concentration. []=
0Clim
(sp/C).
The intrinsic viscosity is characteristics parameter of a polymer.
The number average molecular weight )nM( was determined by conductometric titration
in non aqueous medium such as dimethylsulphoxide (DMSO) using ethanolic KOH as a
titrant. Form the graph of specific conductance against milliequivalents of base, first and last
break were noted from which degree of polymerization )DP( and the number average
molecular weight )nM( has been calculated for terpolymer resin under investigation.
An infra-red spectrum of p-COF-II terpolymer resin was recorded on Perkin-Elmer-R-X-
R spectrophotometer in KBr pallets in the wave number region of 4000-400 cm-1 at
Sophisticated Analytical Instrumentation Facility (SAIF), Punjab University; Chandigarh. A
Nuclear Magnetic Resonance (NMR) spectrum of newly synthesized terpolymer resin has
been scanned on FT-NMR-cryo-magnet 400 MHz (Bruker) spectrometer using DMSO-d6
at Sophisticated Analytical Instrumentation Facility Punjab University, Chandigarh.
A 13C nuclear magnetic resonance spectrum of the terpolymer resin was scanned on Bruker
Advanced 400 spectrometer at National Chemical Laboratory (NCL), Pune. The x-ray spectra
of terpolymer sample was taken on Philips PW-1700, Automatic x-ray diffractometer at
Sophisticated Analytical Instrumentation Facility RTM, Nagpur University, Nagpur. The ion
exchange property of the p-COF-II terpolymer resin was determined by the batch equilibrium
method. TGA of terpolymer resin has been carried out by using Perkin–Elmer Pyrix-1TGA,
DTA-7 Thermogravimetric Analyzer at heating rate of 10 ºC per minute up to 800ºC. SEM
has been scanned by FEI-Philips XL-30 electron microscope.

Anal. Bioanal. Electrochem., Vol. 3, No. 1, 2011, 67-86
4. RESULTS AND DISCUSSION
4.1. Infrared spectra
Infrared spectrum of the p-COF-II terpolymer resin has been shown in Fig. 2. Very broad
band appeared in the region 3229 cm-1 may be assigned to the stretching vibration of phenolic
-OH groups exhibiting intermolecular hydrogen bonding between -OH and >C=O and NH
group of amide. The band obtained at 1371 cm-1 suggests the presence of methylene (-CH2-)
bridges. A sharp and strong peak at 1607 cm-1 may be ascribed to aromatic skeletal ring. The
1,2,3,5 tetrasubstitution of aromatic benzene ring can be recognized from sharp and medium
absorption bands appeared at 912, 1098, 1149 cm-1 respectively. The presence of C-H
stretching of aromatic ring may be assigned as a sharp and strong band at 3011cm-1 which
seems to be merged with very broad band of phenolic hydroxyl group [15]. A sharp and
strong peak at 1379 cm-1 may be ascribed to -CH2- symmetrical deformation. A sharp peak at
2917 cm-1 may be ascribed to >CH2, -NH, -CH3 stretching. A sharp and strong peak at 1743
cm-1 may be due to >C=O stretching (oxamide moiety). A broad and sharp peak at 1481 cm-1
may be ascribed to -NH bending of secondary amide. A sharp peak at 1286 cm-1 may be
ascribed to -CH2 bending (wagging & twisting). The band obtained at 1231 cm-1 suggests the
presence of -CH2- plane bending. The band obtained at 784 cm-1 suggests the presence of -
CH2 bending (rocking) and-NH deformation out of plane of secondary amide respectively.
Fig. 2. Infrared Spectra of p-COF-II terpolymer resin

Anal. Bioanal. Electrochem., Vol. 3, No. 1, 2011, 67-86
4.2. Nuclear magnetic resonance spectra
The NMR spectrum of p-COF-II terpolymer was scanned in DMSO-d6 and has been
shown in Fig.3. The chemical shift () in ppm has been assigned on the basis of data
available in literature [16]. The p-COF-II terpolymer resin shows an intense weakly
multiplate signals at 2.56 ppm which may be attributed to methyl proton of Ar-CH3
group. The singlet obtained in the region of 3.46 ppm may be due to the methylene proton
of Ar-CH2-N moiety. The signal in the region of 4.60 ppm is attributed to protons of
>CHO group. The signal in the region of 5.73 ppm is attributed to protons of bridge –NH.
The weak multiplate signal (unsymmetrical pattern) in the region of 6.62 ppm may be due
to terminal methylene group. The signals in the range at 8.65 ppm may be due to phenolic
hydroxyl protons. The much downfield chemical shift for phenolic –OH indicates clearly the
intramolecular hydrogen bonding of -OH group. The signal at 1.20 ppm may due to -
CH3-C moiety. The signal at 2.80 ppm and at 3.37 ppm may due to CH2-N moiety.
The signal at 7.52 ppm may due to aromatic proton (Ar-H).
Fig. 3. Nuclear Magnetic Resonance Spectra of p-COF-II terpolymer resin
4.3. 13C Nuclear magnetic resonance spectra
13C NMR spectrum of p-COF-II terpolymer resin has been recorded as shown in Fig. 4.
The 13C NMR spectrum of p-COF-II terpolymer resin shows the signals at 148.3, 188.5,
131.6, 140.3, 131.6 and 118.5 ppm. These signals may be due to C1 to C6 carbon atoms of
aromatic benzene nucleus. The signals at 180.2 ppm may be due to C1 to C2 carbon of

Anal. Bioanal. Electrochem., Vol. 3, No. 1, 2011, 67-86
carbonyl groups of oxamide moiety. The signal at 120.5 ppm may be assigned from -C-NH
group and at 65.72 ppm may be assigned to C-OH group. Nearly at 40.5 ppm the signal is
appeared, which may be corresponded to carbon atom of methyl group attached to aromatic
benzene nucleus. The shifting of signals is due to the substitution in benzene. The 13C NMR
spectrum after analysis minutely confirmed that the monomers are arranged in a straight
manner, giving the linear structure for terpolymer, which we have proposed is obliviously
correct given in Fig. 1.
Fig. 4. 13C Nuclear Magnetic Resonance Spectra of p-COF-II terpolymer resin
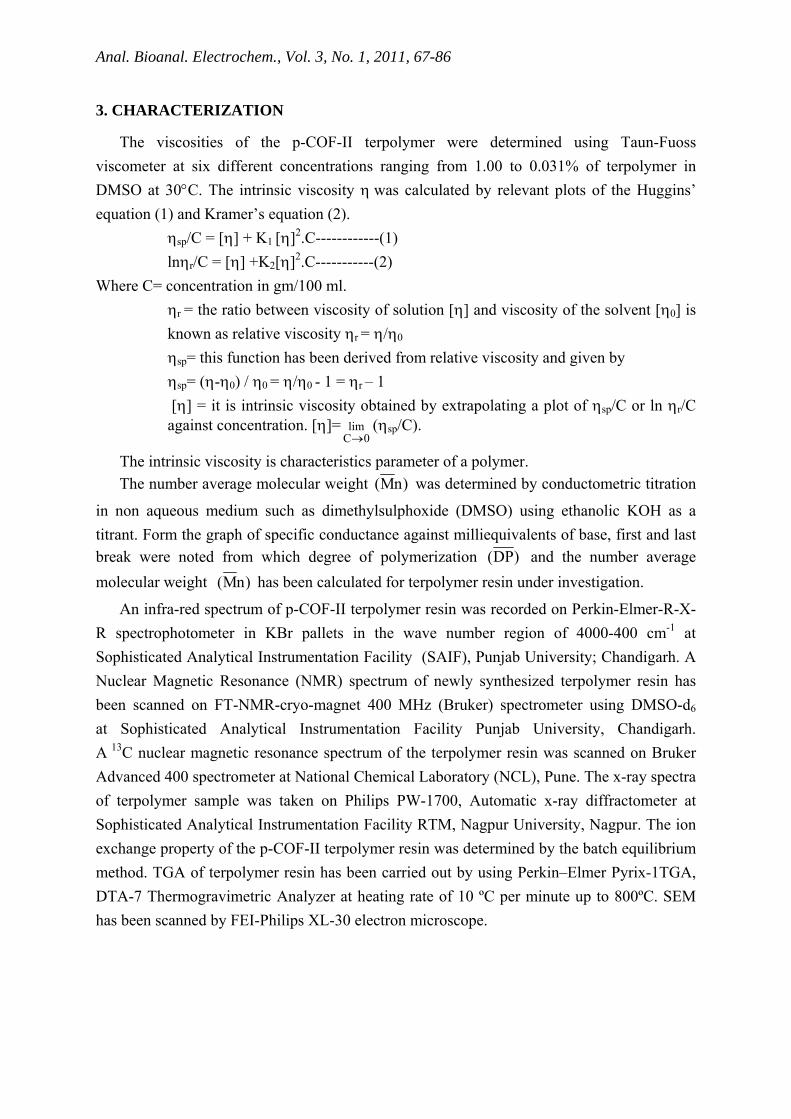
4.4. Scanning electron microscopy (SEM)
Scanning electron micrographs of the p-COF-II terpolymer resin has been recorded as
shown in Fig. 5 at 1500X and 3000X magnification. The SEM micrographs of p-COF-II
terpolymer resin sample exhibits spherulites with deep corrugation. The spherulites are
typical crystalline formation and they grow in high viscous and concentrated solution. In the
present case, the spherulites are complex polycrystalline. The crystals are smaller in surface
area with less closely packed structure. The spherulites morphology of resin exhibit
crystalline structure with deep corrugation which is clearly visible in SEM photographs of
resin. These evidences indicate that more or less the resin shows amorphous character with
less close packed surface having deep pits. The resin thus possesses amorphous nature and
showing higher exchange capacity for metal ions [17]. Thus SEM study shows that the p-
COF-II terpolymer resin has crystalline and some amorphous characters. Thus it has the
transition structure between crystalline and amorphous.
Anal. Bioanal. Electrochem., Vol. 3, No. 1, 2011, 67-86
Fig. 5. Scanning Electron micrographs (SEM) of p-COF-II terpolymer resin
4.5. X-ray diffraction
X-ray diffraction pattern of p-COF-II terpolymer has been shown in Fig. 6. The x-ray
diffraction diagram of the polymer displayed the main characteristic peak and a broad
shoulder in the range of 22-23 2θ. In view of the relative half value width, it may be
concluded that the polymer is partially crystalline. The broad characteristic peak indicates the
amorphous nature of the polymer which can also be explained by SEM study. The XRD
spectrum was used to calculate crystallite size of p-COF-II terpolymer resin using Scherres
formula of Cullity.
Where -λ is x-ray wavelength (1-54056Aº), θ B is Bragg’s diffraction angle and B is
reflection broadening as full width at half maximum intensity. The particle size of p-COF-II
terpolymer resin has been calculated which is found to be at around 145 nm.
The polymer under study is a terpolymer hence it is very difficult to assign its exact
structure. However on the basis of the nature and relative position of the monomers,
elemental analysis, IR, NMR, 13CNMR and XRD spectral studies and taking into
consideration the linear structure of other phenol-formaldehyde resin and the linear branched
nature of urea-formaldehyde polymers, the most probable structure has been proposed for
p-COF-II terpolymer resin( Fig. 1).

Anal. Bioanal. Electrochem., Vol. 3, No. 1, 2011, 67-86
Fig. 6. X-ray diffraction pattern of p-COF-II terpolymer resin
4.6. Electrical conductivity
The thermal activation energy is found to be 0.85×10⁻⁴ eV and the values of electrical
conductivity at different temperatures is found to be in the range of 1.29×10⁻⁹ to2.91×10-9
ohm-1m-1.
The resistance values of the pellet of the polymer ranging from 303 K to 403 K were
converted into conductivity values () by taking into account the thickness of the pellet and
its diameter and evaluating thickness area parameters of the pellet of a terpolymer. The
temperature dependence of the electrical conductivity of the polymer has been shown in
Fig.7.The electrical conduction of polymeric material depends upon incalculable parameters
such as porosity, pressure, method of preparation, atmosphere etc; activation energy (Ea) is
not affected by these parameters and, therefore, it is fairly reproducible. The magnitude of
activation energy depends on the number of electrons present in semiconductor materials.
The more the number of – electrons lowers the magnitude of activation energy and vice
versa. Generally polymers containing aromatic nuclei in the backbone exhibit lower
activation energy than those with aliphatic system. Thus, the low magnitude of activation
energy in p-COF-II resin may be due to the presence of large number of electrons in the
polymer chain. This is in good agreement with the most probable structure proposed for the
newly synthesized resin under investigation. The p-COF-II polymer shows the electrical
conductivity in the range of 1.29×10⁻⁹ to 2.91×10⁻⁹ ohm-1m-1 and the plots of log σ versus 1/T
is found to be linear in the temperature range under study, which indicate that the Wilson’s
exponential law is obeyed.

Anal. Bioanal. Electrochem., Vol. 3, No. 1, 2011, 67-86
= o exp (- E / k T)
Where, k = Boltzmann constant, = electrical conductivity at temperature T
o = electrical conductivity at temperature T
E = electrical conductivity energy of electrical conduction.
This relation has been modified in to the equation of straight line.
kT303.2
Eloglog o
The energy of activation (Ea) of electrical conduction calculated from the slope of the
plot between log σ versus 1/ T is found to be 0.85 x 10⁻⁴ eV. It has been found under
investigation that the order of thermal activation energy is just the reverse of electrical
conductivity. The temperature dependence of electrical conductivity shows that conductivity
increases with temperature. As the conductivity is found very low in the range of 10-10 ohm-1
cm-1 even at higher temperature, it indicates that p-COF-II polymer resin has low charge
carrier intramolecular transfer. This indicates the semiconducting nature of the p-COF-II
polymer resin.
4.7. Ion-exchange properties
Batch equilibrium technique developed by Gregor et al and De Geiso et al was used to
study ion exchange properties of p-COF-II terpolymer resin. The results of the batch
equilibrium study have been presented in Table 2, 3 and 4. Seven metal ions Fe3+, Cu2+, Ni2+,
Co2+, Zn2+, Cd2+ and Pb2+ in the form of aqueous metal nitrate solution were used. The ion
exchange study was carried out using three experimental variables: a) Electrolyte and its
ionic strength, b) uptake time and c) pH of the aqueous medium. Among these three
variables, two were kept constant and only one was varied at a time to evaluate its effect on
metal uptake of the polymer similar to the earlier co-workers [18,19].

Anal. Bioanal. Electrochem., Vol. 3, No. 1, 2011, 67-86
Fig. 7. Electrical conductivity plot of p-COF-II terpolymer resin
Table 1. Elemental analysis, molecular weight determination and intrinsic viscosity data of
the p-COF-II terpolymer resin
Terpolymer
Empirical formula of repeat unit
Empirical
weight of repeat unit (gm)
Average degree of polymer-rization
)DP(
Average molecular
weight n)M(
Intrinsic viscosity
[ (d1/g)
Elemental Analysis
% of C % of H % of N
Found (Cal.)
Found (Cal.)
Found (Cal.)
p-COF-II C19H14N2O 59 24.11 8655 1.49 62.45
(63.50) 5.15
(5.80) 7.28
(7.79)
4.7.1. Effect of electrolyte and its ionic strength on metal uptake
We examined the influence of -4ClO , -
3NO , -Cl and SO42- at various concentrations on
the equilibrium of metal-resin interaction. Table 2 shows that the amount of metal ions taken
up by a given amount of terpolymer depends on the nature and concentration of the
electrolyte present in the solution. In the presence of perchlorate, chloride and nitrate ions,
the uptake of Fe(III), Cu(II) and Ni(II) ions increase with increasing concentration of the

Anal. Bioanal. Electrochem., Vol. 3, No. 1, 2011, 67-86
electrolytes, whereas in the presence of sulphate ions the amount of the above mentioned ions
taken up by the terpolymer decreases with increasing concentration of the electrolyte.
Moreover, the uptake of Co (II), Zn (II), Cd (II) and Pb (II) ions increase with decreasing
concentration of the chloride, nitrate, perchlorate and sulphate ions [19]. This may be
explained on the basis of the stability constants of the complexes with those metal ions. SO42-
might form rather strong complexes with Fe3+, Ni2+, Cu2+ ions while NO3-, Cl- and ClO4
-
might form weak complexes and therefore might not be expected to influence the position of
the Fe3+, Ni2+ and Cu2+ chelates equilibrium as much as SO4-2 , NO3
-, Cl- and ClO4- might
form rather strong chelates with CO2+, Zn2+, Cd2+, and Pb2+ chelates equilibrium. This type of
trend has also been observed by other investigators in this field [19,20].
4.7.2. Estimation of the rate of metal ion uptake as a function of time
The rate of metal adsorption was determined to find out the shortest period of time for
which equilibrium could be carried while operating as close to equilibrium conditions as
possible. Table 3 shows the results of rate of uptake of metal ion on p-CoF-II terpolymer
resin. The rate refers to the change in the concentration of the metal ions in the aqueous
solution which is in contact with the given polymer. The result shows that the time taken for
the uptake of the different mental ions at a given stage depends on the nature of the metal ion
under given conditions. It is found that Fe (III) ions require about 3hrs for the establishment
of the equilibrium, whereas Cu (II), Ni (II), Co (II) and Zn (II) ions required about 5 and 6
hrs. Thus the rate of metal ions uptake follows the order Cu (II) > Ni (II) > Co (II) ≈ Zn (II) >
Cd (II) > Pb (II) for all of the terpolymer [21].
4.7.3. Distribution ratios of metal ions at different pH
The effect of pH on the amount of metal ions distributed between two phases can be
explained by the results given in Table 4. The data on the distribution ratio as a function of
pH indicate that the relative amount of metal ion taken up by the p-COF-II terpolymer
increases with increasing pH of the medium. The magnitude of increase, however, is different
for different metal cations. The p-COF-II terpolymer resin takes up Fe (III) ion more
selectively than any other metal ions under study. The order of distribution ratio of metal ions
measured in pH range 2.5 to 6.5 is found to be Fe (III) > Cu (II) > Ni (II) > Co (II) > Zn (II) >
Cd (II) > Pb (II). Thus the results of such type of study are helpful in selecting the optimum
pH for a selective uptake of a particular metal cation from a mixture of different metal ions
[22]. For example, the result suggest the optimum pH 6.0, for the separation of Co(II) and Ni
(II) with distribution ratio ‘D’ at 445.4 and 914.1 respectively using the p-COF-II terpolymer
resin as ion-exchanger.

Anal. Bioanal. Electrochem., Vol. 3, No. 1, 2011, 67-86
Table 2. Evaluation of the effect of different electrolytes on the uptake of several metal ionsa
by p-COF-II terpolymer resin
Metal ionElectrolyte
(mol/l) pH
Weight of the metal uptake (mmol.g-1) in the presence of
NaNO3 NaCl NaClO4 Na2SO4
Fe(III)
0.01 0.05 0.10 0.50 1.00
2.5
1.06 1.24 1.45 1.75 2.23
0.56 0.84 1.06 1.45 2.06
1.18 1.70 1.92 2.42 3.01
3.17 2.52 1.99 1.16 0.73
Cu(II)
0.01 0.05 0.10 0.50 1.00
4.5
1.99 2.17 2.41 2.73 2.88
1.21 1.86 2.43 3.01 3.71
1.73 2.36 3.01 3.69 4.27
3.45 2.81 2.18 1.35 0.65
Ni(II)
0.01 0.05 0.10 0.50 1.00
4.5
0.87 1.46 2.02 2.50 3.22
0.74 1.22 1.69 2.21 2.98
1.33 1.92 2.51 3.09 3.68
2.92 2.33 1.74 1.16 0.57
Co(II)
0.01 0.05 0.10 0.50 1.00
5.00
1.40 1.16 0.92 0.69 0.45
1.33 1.14 0.97 0.79 0.57
1.16 1.04 0.86 0.69 0.41
1.87 1.23 0.92 0.75 0.51
Zn(II)
0.01 0.05 0.10 0.50 1.00
5.00
2.41 2.02 1.56 1.17 0.64
1.74 1.47 1.10 0.84 0.51
1.79 1.66 1.40 1.16 0.71
2.08 1.42 1.28 0.89 0.57
Cd(II)
0.01 0.05 0.10 0.50 1.00
5.00
2.43 1.98 1.49 0.98 0.77
2.30 1.82 1.42 0.97 0.66
1.95 1.55 1.11 0.92 0.68
1.66 1.28 1.02 0.79 0.57
Pb(II)
0.01 0.05 0.10 0.50 1.00
6.00
2.41 1.77 1.12 0.45 0.17
2.24 1.67 1.40 1.21 0.92
1.87 1.52 1.21 0.93 0.59
3.47 2.84 2.18 1.56 0.91
a [M(NO3)2] = 0.1 mol/l; Volume = 2 ml; Volume of electrolyte solution : 25 ml Weight of resin = 25 mg; time:
24 h: Room temperature

Anal. Bioanal. Electrochem., Vol. 3, No. 1, 2011, 67-86
Similarly, for the separation of Cu (II) and Fe (III) the optimum pH is 3, at which the
distribution ratio ‘D’ for Cu (II) is 68.6 and that for Fe (III) are 368.2. The lowering in the
distribution of Fe (III) was found to be small and, hence, efficient separation could be
achieved [22].
Table 3. Comparison of the rates of metal (M) iona uptakeb by p-COF–II terpolymer resin
Metal
ionpH
Percentage of metal ion uptakeb at different times (h)
1 2 3 4 5 6 7
Fe(III) 2.5 53.3 78.6 96.4 - - - -
Cu(II) 4.5 49.5 61.3 68.6 79.9 93.7 - -
Ni(II) 4.5 50.7 60.6 70.1 86.1 94.6 - -
Co(II) 5 45.2 59.7 69.1 84.2 94.1 - -
Zn(II) 5 49.1 59.6 69.5 84.5 96.1 - -
Cd(II) 5 30.1 50.6 60.2 70.1 85.2 94.1 -
Pb(II) 6 28.5 49.3 57.2 69.2 84.1 95.7 -
a [M(NO3)2] = 0.1 mol / l; volume : 2ml; NaNO3 = 1.0 mol / L; volume: 25 ml, Room temperature.
b Metal ion uptake = (Amount of metal ion absorbed x 100) / amount of metal ion absorbed at equilibrium
Table 4. Distribution ratio Da of various metal ionsb as function of the pH by p-COF-II
terpolymer resin
Metal
ion
Distribution ratio of the metal ion at different pH
1.5 2 2.5 3 3.5 4 5 6
Fe(III) 20.2 125.6 237.1 368.2 - - - -
Cu(II) - - - 68.3 93.4 212.1 681.4 1209.4
Ni(II) - - - 52.1 74.8 230.4 462.1 914.1
Co(II) - - - 41.5 65.4 155.8 248.2 445.4
Zn(II) - - - 43.7 73.1 99.3 133.0 225.8
Cd(II) - - - 31.2 65.7 107.1 174.2 234.3
Pb(II) - - - 39.6 63.5 126.2 197.2 273.6 a D = weight (in mg) of metal ions taken up by 1g of terpolymer/weight (in mg) of metal ions present in 1ml of
solution. b [M(NO3)2] = 0.1 mol/l; volume : 2ml; NaNO3 = 1.0 mol/l; volume: 25 ml, time 24 h (equilibrium state) at
Room temperature.

Anal. Bioanal. Electrochem., Vol. 3, No. 1, 2011, 67-86
4.8. Thermogravimetry of p-COF-II terpolymer resin
Thermogravimetry is found to be a very useful method to assess the thermal stability of a
polymeric resin. Thermogram has been recorded in the temperature range of 40 oC to 800 oC
which is shown in Fig. 8. The p-COF-II terpolymer resin exhibit three stage decomposition
after loss of one water molecule in the temperature range of 40–140 oC (4.91% found and
5.01% calculated). The first step of decomposition starts from 140ºC to 380ºC corresponding
the mass loss of 26.89% found and 27.01% calculated, which may be due to loss of the
hydroxyl groups and two methyl groups attached to aromatic benzene ring. This degradation
may be due to increasing strain by thermal vibrations. The second step starts from 380ºC to
550 ºC, correspond to the mass loss of 69.63% found and 69.91% calculated which may be
due to degradation of two aromatic benzene nuclei. This degradation may be due to
unzipping strain and unstability in the molecule. The third step of degradation starts from 580
ºC to 800 ºC, corresponding to the mass loss equal to 77.52% found and 77.71% calculated,
which may be due to the degradation of side chain (-CH2-NH) of oxamide moiety and
consequently the residue left over is oxamide moiety having mass equal to 23.44% found and
22.29% calculated [23].
Fig. 8. Decomposition pattern of p-COF-II terpolymer resin

Anal. Bioanal. Electrochem., Vol. 3, No. 1, 2011, 67-86
In the present investigation Sharp-Wentworth and Freeman-Carroll methods have been
used to determine the kinetic parameters of p-COF-II terpolymer resin.
Sharp-Wentworth method: In this method following expression is used.
Where, A - constant of frequency factor
is the linear heating rate. The graph of T1versusc1Δ
dc/dtlog
has been plotted. The
graph is a straight line with Ea as slope and A as intercept. The linear relationship confirms
that the assumed order (n) = 1 is correct.
Freeman-Carroll method: In this method following expression is used.
nrr WΔlog
1/TΔ.R)Ea/2.303(
WΔlog
dw/dtΔlog
where dw/dt = rate of change of weight of terpolymer sample with respect to time,
Wr = Wc-W, where Wc is the weight loss at the completion of the terpolymer reaction or at
definite time and ‘W’ is the total weight loss up to time t. ‘T’ is the temperature, ‘R’ is the
gas constant and ‘n’ is the order of reaction. Hence the graph of
rr WΔlog
1/TΔversus
WΔlog
dw/dtΔlog
Should give on Y axis (x=0) an intercept for the value of n (the order of reaction) and the
slope m=-Ea/2.303 R.
Using thermal decomposition data and then applying the Sharp-Wentworth method (Fig.
9) activation energy is calculated which is in agreement with the activation energy calculated
by Freeman-Carroll method [23] (Fig. 10 and 11). Thermodynamic parameters such as
entropy change (S), free energy change (F), frequency factor (Z) and Apparent entropy
(S*) calculated on the basis of thermal activation energy are given in Table 5. From
abnormally the low values of frequency factor, it may be concluded that the decomposition
reaction of p-COF-II terpolymer can be classed as a ‘slow’ reaction. There is no other
obvious reason [24].
Fairly good straight line plots are obtained using the two methods. This is expected since
the decomposition of terpolymer is known not to obey first order kinetics perfectly [25,26].
T1.Ea/2.303RA/βlogc1Δ
dc/dtlog

Anal. Bioanal. Electrochem., Vol. 3, No. 1, 2011, 67-86
Fig. 9. Sharp – Wentworth plot of p-COF-II terpolymer resin
Table 5. Results of thermogravimetric analysis of p-COF-II terpolymer reins
Terpolymer
resin
Half
decompositi
on Temp.
(ºC)
Activation energy
Ea (KJ) Entropy
change
S(J)
Free
energy
F(KJ)
Frequency
factor
(Z)(Sec.-1)
Apparent
entropy
(S*)(KJ)
Order of
reaction
(n) FC SW
p-COF-II 673 25.848 25.446 164.521 100.375 705 -19.11 0.96 SW – Sharp-Wentworth Method FC – Freeman–Carroll Method

Anal. Bioanal. Electrochem., Vol. 3, No. 1, 2011, 67-86
Fig. 10. Freeman – Carroll plot of p-COF-II terpolymer resin
Fig. 11. Thermal energy plot of p-COF-II terpolymer resin
Anal. Bioanal. Electrochem., Vol. 3, No. 1, 2011, 67-86
5. CONCLUSION
Electrical conductivity of p-COF-II terpolymer resin increases by increasing temperature.
Hence this terpolymer may be ranked as semiconductor. The uptake capacities of metal ions
by the terpolymer resin were pH dependent. Due to considerable difference in the uptake
capacities at different pH and media of electrolyte, the rate of metal ion uptake and
distribution ratios at equilibrium, it is possible to use for separation of particular metal ions
from their admixture. The p-COF-II terpolymer resin undergoes degradation at elevated
temperature which indicates that the resin is thermally stable
Acknowledgement
The authors are thankful to the Director and Head Department of Chemistry,
Laxminarayan Institute of Technology; RTM Nagpur University, Nagpur for providing
necessary laboratory facilities.
REFERENCES
[1] H. Kimura, Y. Murata, A. Matsumoto, K. Hasegawa, K. Ohtsuka, and A. Fulkuda, J.
Appl. Polym. Sci. 74 (1999) 2273.
[2] W. B. Gurnule, H. D. Juneja, and L. J. Paliwal, Ind. J. Chem. 39 (2000) 1113.
[3] P. K. Rahangdale, W. B. Gurnule, L. J. Paliwal, and R. B. Kharat, Synth. React. Inorg.
Met. Org. Chem. 33 (2003) 1205.
[4] L. Gautman, and O. L. E. Lyons, “Organic Semiconductors”, John Wiley, New York,
(1967).
[5] E. M. Genies, A. A. Syed, and C. Tsintavis, Mol. Cryst. Liq. Cryst. 121 (1985) 181.
[6] J. S. Dewar, and A. M. Talati, J. Am. Chem. Soc. 86 (1964) 1592.
[7] P. S. Lingala, L. J. Paliwal, and H. D. Juneja, National Seminar on Polymers, Chennai,
(1999)
[8] T. K. Pal, and R. B. Kharat, Die Angew. Makromol. Chem. 173 (1989) 55.
[9] H. Treavor, and P. C. Boyer, Water Res. 4 (2007) 2876.
[10] B. Shah, A. Shah, and N. Patel, Iran. Polym. J. 17 (2008) 17.
[11] P. K. Rahangdale, W. B. Gurnule, L. J. Paliwal, and R. B. Kharat, React. Funct. Polym.
55 (265) 2003.
[12] V. D. Mane, N. J. Wahane, and W. B. Gurnule, J. Appl. Polym. Sci. 111 (2009) 3039.
[13] H. Zhao, Y. Wang, X. Wang, and K. Yang, Polym. Deg. Stab. 80 (2002) 80.
[14] M. V. Tarase, A. B. Zade, and W. B. Gurnule, J. Appl. Polym. Sci. 108 (2008) 746.
[15] S. Dutta, and A. Das, Ind. J. Chem. Tech. 12 (2005) 139.
[16] M. M. Jadhav, L. J. Paliwal, and N. S. Bhave, Ind. J. Chem. 44 (2005) 225.
[17] E. J. Suzuki, Microscopy 208 (2002) 157.
Anal. Bioanal. Electrochem., Vol. 3, No. 1, 2011, 67-86
[18] W. B. Gurnule, H. D. Juneja, and L. J. Paliwal, Ind. J. Chem. 39 (2005) 1110.
[19] M. R. Luftor, and S. Silong, Eur. Polym. J. 36 (2000) 2105.
[20] S. C. Das, J. Ind. Chem. Soc. 77 (2000) 69.
[21] S. S. Rahangdale, A. B. Zade, and W.B. Gurnule, J. Appl. Polym. Sci, 108 (2008) 756.
[22] W. B. Gurnule, P. K. Rahandale, L. J. Paliwal, and R. B. Kharat, J. Appl. Polym. Sci. 89
(2003) 886.
[23] W. B. Gurnule, P. K. Rahandale, L. J. Paliwal, and R. B. Kharat, React. Funct. Polym.
55 (2003) 255.
[24] E. P. M. Pratic, J. N. Barbe, H. D. Juneja, and L. J. Paliwal, Eur. Polym. J. 43 (2007)
5000.
[25] M. M. Patel, M. A. Kapadia, D. P. Patel, and J. D. Joshi, React. Funct. Polym. 67 (2007)
757.
[26] R. N. Singru, A. B. Zade, and W. B. Gurnule, J. Appl. Polym. Sci. 109 (2008) 868.
Copyright © 2011 by CEE (Center of Excellence in Electrochemistry)
ANALYTICAL & BIOANALYTICAL ELECTROCHEMISTRY (http://www.abechem.com)
Reproduction is permitted for noncommercial purposes.