promotion of higher efficiency air conditioners in … · baseline assessments of air conditioner...
TRANSCRIPT

FINAL REPORTFEBRUARY 2015
PROMOTION OF HIGHER EFFICIENCY AIR CONDITIONERS IN ASEAN: A REGIONAL POLICY ROADMAP

This report has been produced as part of the ASEAN-SHINE program. ASEAN-SHINE is an initiative implemented by the International Copper Association, in partnership with UNEP, SIRIM, RCEE, EEI and IIEE.
Program ID:
Project title : Promotion and Deployment of energy efficient air conditioners in ASEAN Acronym : ASEAN-SHINEFunded by : European Union, Switch-Asia programGrant amount : 1,749,099.90 EURContract ref. : DCI-ASIE 2012/291-458Name of beneficiary : European Copper Institute
Partners : - United Nations Environment Programme - Division of Technology, Industry and Economics (DTIE), Energy Branch - International Copper Association Southeast Asia - Electrical and Electronics Institute - SIRIM QAS International - Integrated Institute of Electrical Engineers - Research Center for Energy and Environment
Contact person:
Pierre Cazelles
Director – Partnerships Asia International Copper Association China Email: [email protected]
Program implementation team
Technical Advisor
Funding Steering Committee
Disclaimer: this report has been produced with the �nancial assistance of the European Union. It does not represent the views of the European Union but only that of the authors.

Promotion of higher efficiency air conditioners in ASEAN: a Regional Policy Roadmap
Contents Executive Summary 1
Background and introduction 1
Summary of findings and considerations for the regional policy roadmap 2
Regional policy roadmap and recommendations for ASEAN economies 3
1. Regional Assessment 7
AC Markets 7
Policy frameworks 9
Potential energy savings 12
2. National Assessment - Thailand 13
Power sector profile 13
AC Market Characteristics 14
Institutional and Regulatory Framework 17
Assessment of energy savings potential 20
3. National Assessment - Vietnam 22
Power sector profile 22
AC Market Characteristics 23
Institutional and Regulatory Framework 25
Assessment of energy savings potential 28
4. National Assessment - Philippines 30
Power sector profile 30
AC Market Characteristics 30
Institutional and Regulatory Framework 33
Assessment of energy savings potential 37
5. National Assessment - Malaysia 39
Power Sector Profile 39
AC Market Characteristics 40
Institutional and Regulatory Framework 42
Assessment of energy savings potential Error! Bookmark not defined.
6. National assessment - Indonesia 46
Power sector profile 46
AC Market Characteristics 47
Institutional and Regulatory Framework 49
Assessment of energy savings potential 53
7. National assessment - Brunei Darussalam 54

Promotion of higher efficiency air conditioners in ASEAN: a Regional Policy Roadmap
Power sector profile 54
AC Market Characteristics 55
Institutional and Regulatory Framework 55
8. National assessment - Cambodia 58
Power sector profile 58
AC Market Characteristics 58
Institutional and Regulatory Framework 59
9. National assessment - Lao People’s Democratic Republic 60
Power sector profile 60
AC Market Characteristics 61
Institutional and Regulatory Framework 61
10. National assessment - Myanmar 62
Power sector profile 62
AC Market Characteristics 63
Institutional and Regulatory Framework 63
11. National assessment - Singapore 64
Power sector profile 64
AC Market Characteristics 65
Institutional and Regulatory Framework 68
12. Regional Policy Roadmap 74
Robust and harmonized energy performance standards 74
Testing infrastructure and laboratory capacity 81
Monitoring and Verification 83
Other policy measures to enhance market transformation 86
ANNEX 1 88
ANNEX 2 95
APPENDIX 99
Appendix 1 100
Appendix 2 101
Appendix 3 104

Promotion of higher efficiency air conditioners in ASEAN: a Regional Policy Roadmap
Abbreviations and Acronyms
AC air conditioner
APEC Asia-Pacific Economic Cooperation
ASEAN Association of Southeast Asian Nations
ASEAN SHINE ASEAN Standardization Harmonization Initiative for Energy Efficiency
BAT best available technology
COP coefficient of performance
CSPF cooling seasonal performance factor
EE energy efficiency
EER energy efficiency ratio
GWP global warming potential
ICA International Copper Association
IEC International Electrotechnical Commission
ISO International Organization for Standardization
MEPS minimum energy performance standards
MRA mutual recognition agreement
MV&E monitoring, verification and enforcement
M&V monitoring and verification
PPAT Product Policy Analysis Tool
RRT round robin testing
SCP Sustainable Consumption and Production
SEER seasonal energy efficiency ratio
SME small and medium-sized enterprises
S&L standards and labels
UNEP United Nations Environment Programme

Promotion of higher efficiency air conditioners in ASEAN: a Regional Policy Roadmap
List of Figures Figure 1: Room ACs sales in ASEAN economies (measured and forecast) 7
Figure 2: Average EERs of ACs in the region 8
Figure 3: MEPS stringency and coverage (cooling capacity) in ASEAN economies for single split ACs 10
Figure 4: Potential energy savings in ASEAN Region 12
Figure 5: Share of total primary energy supply in 2012-Thailand 13
Figure 6: Average electricity consumption by Sector in Thailand 13
Figure 7: Sales of all ACs 2009 - 2013 14
Figure 8: Overview of AC sales by cooling capacity 14
Figure 9: AC type distribution in 2013 16
Figure 10: Refrigerant type distribution in 2013 15
Figure 11: Average EER (Btu/h/W) by model 15
Figure 12: Maximum EER (Btu/h/W) by model 16
Figure 13: Minimum EER (Btu/h/W) by model 16
Figure 14: EER of all models available on the market 17
Figure 15: Thailand Energy Efficiency S&L structure 18
Figure 16: Sample of the comparative label 19
Figure 17: Energy Saving Potentials for Air Conditioners in Thailand in 2030 21
Figure 18: Share of total primary energy supply in 2012-Vietnam 22
Figure 19: Average electricity consumption by Sector in Vietnam 22
Figure 20: Sales of all ACs 2010 - 2013 23
Figure 21: Overview of AC sales by cooling capacity 23
Figure 22: AC type distribution in 2013 25
Figure 23: Refrigerant type distribution in 2013 24
Figure 24: Average, Max and Min EER (Btu/h/W) by model capacity in 2013 24
Figure 25: EER distribution for all surveyed models 25
Figure 26: Sample of the comparative label 27
Figure 27: Energy Saving Potentials and CO2 Abatement for Air Conditioners in Vietnam in 2030 29
Figure 28: Share of total primary energy supply in 2012-Philippines 30
Figure 29: Sales of all ACs 2009 – 2013 31
Figure 30: Overview of AC models by cooling capacity (Btu/h) 31
Figure 31: Average EER (Btu/h/W) by model 32
Figure 32: Maximum EER (Btu/h/W) by model 32
Figure 33: Minimum EER (Btu/h/W) by model 33
Figure 34: EER distribution for all surveyed models 33
Figure 35: Philippines Energy Efficiency S&L structure 34
Figure 36: Sample of the endorsement label 35
Figure 37: Philippines monitoring and verification cycle 36
Figure 38: Energy Saving Potentials and CO2 Abatement for Air Conditioners in Philippines in 2030 38
Figure 39: Share of total primary energy supply in 2012-Malaysia 39

Promotion of higher efficiency air conditioners in ASEAN: a Regional Policy Roadmap
Figure 40: Average electricity consumption by Sector in Malaysia 39
Figure 41: Sales of all ACs 2009 - 2013 40
Figure 42: Overview of AC sales by cooling capacity 40
Figure 43: AC type distribution in 2013 42
Figure 44: Refrigerant type distribution in 2013 42
Figure 45: EER (Btu/h/W) trend by cooling capacity in 2013 41
Figure 46: EER distribution of all surveyed models 42
Figure 47: Sample of the comparative label 44
Figure 48: Sample of the endorsement label 44
Figure 49: Energy Saving Potentials and CO2 Abatement for Air Conditioners in Malaysia in 2030 45
Figure 50: Share of total primary energy supply in 2012-Indonesia 46
Figure 51: Sales of all ACs 2009 – 2013 (1,000 units) 47
Figure 52: Overview of AC sales by cooling capacity 47
Figure 53: AC type distribution in 2013 49
Figure 54: Refrigerant type distribution in 2013 49
Figure 55: Average, Max and Min EER (Btu/h/W) by model in 2013 48
Figure 56: EER distribution for all surveyed models 49
Figure 57: Sample of the comparative label 51
Figure 58: Energy Saving Potentials and CO2 Abatement for Air Conditioners in Indonesia in 2030 53
Figure 59: Share of total primary energy supply in 2012-Brunei 54
Figure 60: Average electricity consumption by Sector in Brunei Darussalam 54
Figure 61: AC sales in Brunei (modelled) 55
Figure 62: Brunei Energy Efficiency S&L structure 56
Figure 63: Sample of the comparative label 57
Figure 64: Share of total primary energy supply in 2012-Cambodia 58
Figure 65: AC sales in Cambodia (modelled) 59
Figure 66: Average electricity consumption by Sector in Lao PDR 60
Figure 67: AC sales in Laos (modelled) 61
Figure 68: Share of total primary energy supply in 2012-Myanmar 62
Figure 69: AC sales in Myanmar (modelled) 63
Figure 70: Average electricity consumption by Sector in Singapore 64
Figure 71: AC sales in Singapore 65
Figure 72: Overview of AC sales by cooling capacity 65
Figure 74: Refrigerant type distribution in 2013 66
Figure 75: Average COP weighted by sales volumes of individual models, by cooling capacity (kW) 66
Figure 73: AC type distribution in 2013 67
Figure 76: Maximum COP by cooling capacity (kW) 67
Figure 77: Minimum COP by cooling capacity (kW) 67
Figure 78: COP distribution of all available models 68
Figure 79: Sample of the comparative label 71
Figure 80: Sample of the endorsement label 72

Promotion of higher efficiency air conditioners in ASEAN: a Regional Policy Roadmap
Figure 81: CSPF trends worldwide 77
Figure 82: MEPS for split units in a list of economies 78
Figure 83: Proposed tiers in Thailand vs. current market efficiency (starting at Tier III – EER=3.3/11.3) 79
Figure 84: Proposed tiers in Vietnam vs. current market efficiency (starting at Tier III – EER=3.3/11.3) 80
Figure 85: Proposed tiers in Malaysia vs. current market efficiency (starting at Tier III – EER=3.3/11.3) 80
Figure 86: Bureau of Energy Efficiency’s approach to monitoring and verification in India 94
Figure 87: MEPS stringency and coverage (cooling capacity) in ASEAN economies for single split ACs and
Harmonized MEPS 101

Regional Policy Roadmap for harmonization of AC standards in ASEAN economies 1
Executive Summary
Background and introduction
Space cooling appliances represent a large proportion (up to 50%1) of electricity demand in the
residential and commercial sectors in ASEAN economies. The market for room air conditioners (AC)
in ASEAN economies is expected to grow by at least 10% annually over the next 5 years2, and this AC
growth will drive electricity demand, particularly during peak hours of the day. In recognition of this
challenge, ICA, UNEP and its partners, launched the ASEAN Standardization Harmonization Initiative
for Energy Efficiency (ASEAN SHINE), a regional program to increase the market share of higher
efficient air conditioners in ASEAN through harmonization of test methods and energy efficiency (EE)
standards, adoption of common minimum energy performance standards (MEPS), and changing
consumer purchasing attitudes in favor of energy efficient air-conditioners. ASEAN SHINE is funded
under the EU SWITCH-Asia program, which seeks to promote the adoption of Sustainable Consumption
and Production (SCP) among small and medium-sized enterprises SMEs and consumer groups in Asia.
The objective of this project is to support the development of a regional policy roadmap that will
facilitate harmonization of test methods and MEPS for ACs3 in ASEAN. UNEP, with the technical
assistance from CLASP has conducted an assessment of the market for ACs, and efficiency policies
and regulatory frameworks for this product in ASEAN member countries4. The following four primary
activities were undertaken as part of this assignment: 1) development of a framework for local
baseline assessments of air conditioner markets in the ten ASEAN member states, 2) provide a
methodology for data collection, 3) data analysis and evaluation of various policy scenarios at the
national level, and 4) development of a regional policy roadmap.
This report presents the AC market data analysis and evaluation of various policy scenarios, as well
as a regional policy road map for AC policy harmonization. The data analysis and proposed policy road
map built upon the data collection framework that was developed for each ASEAN economy.
Comprehensive questionnaires covering both AC markets and policies were developed. UNEP led the
actual data collection process in 5 ASEAN economies, including Indonesia, Philippines, Malaysia,
Thailand, and Vietnam (hereafter referred to as Group A), where they have established country
chapters to support the ASEAN AC harmonization effort. The remaining ASEAN economies were not
included in the market assessment study as (a) Cambodia, Lao PDR, and Myanmar do not have any
energy efficiency standards and labeling programs for household appliances and equipment, and (b)
EU SWITCH-Asia funding secured to implement this project did not support such activities in Brunei
and Singapore. Hence, secondary research was done to support the market and policy analysis of
Brunei, Cambodia, Laos, Myanmar and Singapore (hereafter referred to as Group B).
Section 1 of this report presents an overview of the AC market and related AC policies in the ASEAN
region, while sections 2 to 11 provide a brief power sector profile, as well as a detailed review of the
national AC markets and related policies for each ASEAN member country. In addition, sections 2 to
6 present results of analysis conducted based on data and information provided by manufacturers in
Group A economies. Sections 7 to 11 present the results of secondary research for economies in Group
1 International Copper Association, “Market Study for Harmonization of Energy Efficiency Standards for Air-conditioners and
Refrigerators in South-east Asia”, Research report, ICA, 15th November 2010.
2 Source: Euromonitor.
3 A room air-conditioner is defined as an encased assembly or assemblies, designed primarily to provide non-ducted free
delivery of conditioned air to an enclosed space, room or zone. It can be either single-package (window or casement type) or
single split system.
4 ASEAN member countries include: Brunei Darussalam, Cambodia, Indonesia, Lao PDR, Malaysia, Myanmar, Philippines,
Singapore, Thailand, and Viet Nam.

Regional Policy Roadmap for harmonization of AC standards in ASEAN economies 2
B and thus are less comprehensive than the analysis that is presented for those economies in Group
A.
The national market assessments provide an overview of the AC market in each economy, including
overall size, growth rates, types and energy performance of AC models available on the market, as
well as the distribution of the various models by cooling capacity and their specific refrigerants5.
The review of AC policy frameworks include a description of the institutions responsible for
development, implementation and enforcement of energy efficiency policies for air conditioners, the
current regulations (MEPS and labeling requirements) applicable for ACs, and the product testing
capacity and market surveillance mechanisms that are in place to monitor, verify and enforce product
regulations.
Projections of energy savings potential for economies in Group A were developed by establishing a
base case that considered the most popular cooling capacity and the average performance of the AC
models on the market, and then assuming a transition to the best available technology that is already
present on the market for that cooling capacity.
Section 12 presents the Regional Policy Roadmap, which takes into account the key findings from the
national and regional assessments, and includes recommendations on the following components:
Robust and harmonized energy performance standards
Testing infrastructure and laboratory capacity
Monitoring and verification
Other policy measures that enable market transformation
Summary of findings and considerations for the regional policy roadmap
The AC market in ASEAN economies is expected to grow at a pace of 10% per year in the next five
years, dramatically increasing future energy demand from space cooling appliances in the residential
sector. The most popular AC types are split units, while the current share of window units is 8%
regionally, and it is expected to decrease by 0.5% to 1% per year as split units become popular in
markets where they were introduced later. Several economies in the ASEAN region also have a
significant proportion - between 20% and 40% - of variable speed/capacity (inverter technology) units6
of split type. Efficient AC units are already available in most economies and average efficiency levels
are well above the current MEPS.
Most of the ACs available on the market use R-227, which is scheduled to be phased out under the
Montreal Protocol, with step-wise reductions every 5 years starting in 2015 and terminating in 2040.
The available alternative on the market is R-410A, a refrigerant with high global warming potential
(GWP), which is already found in all inverter units in the economies surveyed. ASEAN economies
should look forward to transition to low GWP refrigerants when alternatives become available (e.g.,
R-290), avoiding all together the transition to R-410A with the resulting climate impacts.
The review of the standards and labels (S&L) institutional and regulatory regimes in each country
indicates a wide diversity of agencies (i.e., multiple Ministries) that are responsible for activities in
support of S&L programs. The development of a national policy roadmap for AC should consider early
5 Refrigerants are substances used in various applications requiring cooling mechanisms, such as air-conditioning systems.
6 Inverter-equipped air conditioners have a variable-frequency drive that incorporates an adjustable electrical inverter to
control the speed of the motor and thus the compressor and cooling output.
7 A refrigerant with ozone depletion potential (ODP) and high global warming potential (GWP).

Regional Policy Roadmap for harmonization of AC standards in ASEAN economies 3
engagement and involvement of relevant stakeholders to ensure coordination between parties
involved.
Efficiency policies, including MEPS and labels, are already in place in most ASEAN economies, but
stringency and coverage vary significantly. The regional policy roadmap should propose a set of MEPS
that are appropriate for each economy and a set of aspirational levels in the medium to long term at
a regional level, considering that: i) markets already have efficient technologies available, ii) the
less efficient product types are becoming less popular and, iii) the current base case (average product
efficiencies in the market) are well above the current MEPS levels.
Data analysis and secondary research indicate that laboratory testing capacity for ACs is limited at
the national level, and regionally there are only seven third party testing facilities (most government-
owned) and five manufacturer testing facilities. However, testing facilities are already receiving
accreditation under the standard ISO/IEC 17025, which can be a first step to recognition of product
testing in laboratories at the regional level. Some countries are already using mutual recognition
agreements to encourage the use of available testing capacity elsewhere. ASEAN economies should
consider enabling access to current laboratory testing capacity through the use of mutual recognition
agreements, and enhancing current testing capacity through training.
Monitoring and verification practices have been adopted in some economies (Thailand, Vietnam,
Philippines, Singapore) and will be adopted in places that currently do not have market surveillance
mechanisms or where labeling is still voluntary (Malaysia, Indonesia). A more in depth evaluation in
the economies where M&V practices exist could provide information on the effectiveness or how
robust the MV&E programs are.
Regional policy roadmap and recommendations for ASEAN economies
The objective of the Regional Policy Roadmap is to facilitate harmonization or clear alignment of
minimum energy performance standards for air conditioners in ASEAN economies. The ultimate goal
is to drive market transformation in ASEAN member countries, promoting the use of more efficient
air conditioning equipment. Other goals include greater intra-ASEAN trade in space cooling products,
reduced costs for product testing, monitoring and verification, energy savings, and carbon emissions
reductions from more efficient ACs for consumers.
Most ASEAN member countries have mechanisms in place to promote the use of more efficient cooling
applications by strengthening energy performance requirements for new ACs in the market through
S&L and ensuring performance requirements are met by products placed in those markets through
monitoring, verification and enforcement regimes.
This policy roadmap builds on those mechanisms and discusses the harmonization or alignment of
critical components of energy efficiency policies at the regional level.
1. Robust and harmonized energy performance standards
Harmonization of test methods
The ISO 5151:2010 standard has been identified as the benchmark test standard for AC harmonization
in ASEAN region, according to the “APEC-ASEAN Harmonization of Energy Efficiency Standards for Air
Conditioners”8 study. The high level of alignment among the ASEAN national test standards with ISO
8 Wai Meng, Chin. APEC-ASEAN Harmonization of Energy Efficiency Standards for Air Conditioners: Phase 1. Comparative
Analysis of Test Standards. June 2013.

Regional Policy Roadmap for harmonization of AC standards in ASEAN economies 4
5151:2010 provides a compelling rationale for regional harmonization using this standard for ASEAN
economies.
It is also strongly recommended that in addition to the six economies (Malaysia, Singapore, Thailand,
Indonesia, Viet Nam, and Philippines) already using or planning to adopt ISO 5151, Brunei, Myanmar,
Laos and Cambodia should also adopt the ISO 5151:2010 test standard to further the harmonization
of test methods in ASEAN.
Harmonization of metrics
The ISO 5151 standard does not specify the method to evaluate the part-load and seasonal energy
efficiencies of air-conditioner equipment, e.g. inverter technology. The evaluation method of such
seasonal performances is however specified in ISO 16358-1 which uses the Cooling Seasonal
Performance Factor (CSPF).
Considering the increasing number of inverter units available in the ASEAN AC market and that this
AC type performs better at part load conditions, ASEAN economies should introduce metrics to
measure part-load energy performance, in accordance with the ISO 16358-1, and follow the CSPF
for both inverter and fixed capacity units.
Harmonization of MEPS
ASEAN economies should revise and make serious efforts to ratchet up the current MEPS and labeling
requirements, to encourage widespread adoption of efficient units and deflect future energy demand
growth. It is recommended that MEPS levels are revised for the overall net benefit of consumers,
national economies and the ASEAN region as a whole. Five of the ASEAN economies (Malaysia,
Philippines, Thailand, Singapore and Vietnam) have an AC market that is on average 15% to 30% more
efficient than the current MEPS. More stringent efficiency requirements would eliminate the most
inefficient products from the market and provide greater incentive for manufacturers to introduce
more efficient products.
Considering the difference in efficiencies among ASEAN economies and that timing of S&L revision
cycles is not aligned, the regional policy roadmap proposes setting a MEPS target for all ASEAN
economies by 2020. The level will be set and agreed by ASEAN economies, so that each economy can
develop a path for its future alignment (through a national policy roadmap), by setting more stringent
MEPS and introducing higher performing products. The MEPS level should also be technology neutral;
meaning that both variable and fixed speed units should be considered under a single category of
room air conditioners, and use CSPF to evaluate seasonal performance.
2. Testing infrastructure and laboratory capacity
There is limited testing capacity for air conditioners at the national level and overall in the ASEAN
region. There are two primary recommendations for improving the access and credibility of testing
laboratories in ASEAN:
A. Build testing capacity in existing facilities, enhance capability and reduce differences in
laboratory testing conditions
Following harmonization of test methods to measure energy performance at the regional level and
alignment of testing conditions, the natural step would be to develop programs for training in existing
testing facilities in ASEAN to ensure accuracy and reliability of testing results. A round robin testing
exercise is a very effective way to build capacity as participant laboratories identify corrective
measures for improvement in their processes if necessary, or ratify the quality of current practices.

Regional Policy Roadmap for harmonization of AC standards in ASEAN economies 5
B. Encourage mutual recognition agreements (MRA)9 to access regional infrastructure and resources
more effectively
The development of an intergovernmental MRA could be pursued by a regional network of market
surveillance authorities, as part of the efforts to improve monitoring and verification practices in the
region.
3. Monitoring and Verification
The following recommendations are based on the policy and institutional assessments and sound
existing monitoring and verification (M&V) practices which should operate on the regional level for
regional harmonization to succeed. These include opportunities to improve M&V regimes through
collaboration between economies in the ASEAN region.
Recommendation 1 – Coordinated approach to verification testing
Currently verification testing is conducted at the national level by individual ASEAN economies, even
though there are many common AC models traded within the region. The benefits of a more
coordinated approach to testing include cost savings and the gathering of market intelligence based
on larger sample sizes. Specific examples of the types of collaboration on verification testing that
ASEAN member states could consider are discussed in detailed in the report.
Recommendation 2 - Establishment of a regional network
Coordination among market surveillance authorities in the ASEAN region could facilitate program
implementation and enforcement by increasing information sharing of compliance of products sold
at the regional level. As such, ASEAN economies should consider supporting the establishment of, and
participation in a forum on M&V.
Recommendation 3 - Industry Engagement
Governments with responsibility for S&L programs need to engage with industry participants and work
together to develop more effective M&V regimes. ASEAN economies should consider engaging industry
in a constructive dialogue, to increase awareness and understanding of the objectives of
governments, and assist governments to find ways of reducing costs and increasing effectiveness.
Recommendation 4 - Reporting to increase visibility and transparency of the M&V regime
Reporting outcomes of any screening or verification tests is an important part of the compliance
regime. In addition to communication with relevant suppliers, further reporting options that ASEAN
economies should consider include: informing trade associations and other verification authorities,
and publication of test results.
Recommendation 5 – Development of a regional product database
The effectiveness of a program’s compliance regime would likely be improved considerably with the
availability of a national or regional centralized listing of product models that are part of the
program. ASEAN economies should consider either aligning database criteria or establishing a regional
database to facilitate cross-border M&V.
Recommendation 6 – Increase access to competent laboratories
In ASEAN there is limited testing capacity for air conditioners at the national level and overall in the
region. This presents an opportunity to develop a regional approach to improve and increase access
to testing facilities on a regional basis. The use of mutual recognition agreements can grant access
to competent test facilities for those countries with limited resources, while the development of
round robin testing exercises can improve the competency of the already existing capacity at the
regional level.
9 MRAs are “multilateral arrangements between two or more economies to mutually recognize or accept some or all aspects
of another’s conformity test procedures”.

Regional Policy Roadmap for harmonization of AC standards in ASEAN economies 6
4. Other policy measures that enable market transformation
In order to ramp up the regional effort of promoting high efficiency ACs among ASEAN countries,
incentive policies could be used to overcome the barrier of higher cost at the point of sale that often
inhibits the purchase of energy-efficient ACs. The most common incentives are consumer rebates,
tax credits or accelerated depreciation, loan financing (including shared-savings or performance-
based contracting), and equipment replacement. The policy makers in ASEAN countries could consider
some of these incentive policies in their effort to accelerate the transition to greater uptake and
deployment of high efficiency ACs in their national markets and in the region as a whole.

Regional Policy Roadmap for harmonization of AC standards in ASEAN economies 7
1. Regional Assessment
AC Markets
The room air conditioner market in ASEAN economies grew rapidly from sales of over 1.5 million units
in the year 2000 to more than 6.5 million units in 2013. It is expected that the market will grow at a
pace of at least 10% per year over the next 5 years, with expected sales of over 10 million units in
2018.
Within the ASEAN, at the country level, Indonesia and Thailand are the largest markets (with more
than 2.5 million units sold per year), followed by Malaysia, the Philippines, Singapore and Vietnam
(150,000 to 1 million units sold per year). The remaining ASEAN economies - Brunei, Cambodia, Laos
and Myanmar - have sales limited to the thousands of units.
The most popular AC types are split units, as shown in Figure 1. The current share of window units is
8% regionally, and it is expected to decrease by 0.5% to 1% per year as split units become popular in
markets where they were introduced later. Several economies in the ASEAN region (Thailand,
Vietnam, and Malaysia) have a significant proportion - between 20% and 40% - of variable
speed/capacity (inverter technology) units10 of split type, which are much more efficient than fixed
speed window and split types. These two economies have also eliminated window units from the
market (i.e., there are no more window units available for sale) and thus are considered to have a
more efficient AC product market than the other economies surveyed in ASEAN. Singapore is an outlier
with an 84% market share of inverter units. In Indonesia, there is a small proportion of window units
available for sale; the majority is of the split type with inverter units having a market share of 5%.
The Philippines is the only market in the region where inverter units are not available for sale; and
the proportion of window units is also disproportionately higher (more than 60%) than in any other
member country, indicating that the AC market in the Philippines is more inefficient than markets in
other economies in the region. Information on AC types for the remaining economies was not
available.
Figure 1: Room ACs sales in ASEAN economies (measured and forecast)11
10 Inverter-equipped air conditioners have a variable-frequency drive that incorporates an adjustable electrical inverter to
control the speed of the motor and thus the compressor and cooling output.
11 Source: Euromonitor.

Regional Policy Roadmap for harmonization of AC standards in ASEAN economies 8
Manufacturers in various economies were consistent in reporting using two types of refrigerants —R-
22 and R-410A - in the available RAC models. R-2212 is mostly used in non-inverter units, while R-
410A13 is mostly common in inverter type units. Since non-inverter units constitute a large proportion
of the market in all economies, R-22 is still the most preferred refrigerant type in the ASEAN region.
AC models were available in a wide range of cooling capacities, up to 60,000 Btu/h (17.6 kW) in some
cases. However, the most popular models based on annual sales were below 15,000 Btu/h (4.4 kW),
and in most cases (Group A countries) the most popular (best sold) cooling capacities were 9,000
(2.6) and/or 12,000 Btu/h (3.5 kW).
Information on the origin of AC products was provided by some countries, but data was not
comprehensive. In general, countries reported that units were imported from China, Thailand and
other non-specified countries of manufacture. Economies which reported a large number of local
units did not provide additional information on whether it was actual local production or whether
components were imported and the units were assembled locally. For a comprehensive understanding
of the AC market supply chain in the region, each economy would need to provide more data and
information on its supply chain.
The energy performance of ACs, which is measured by the Energy Efficiency Ratio (EER)14 varies
significantly among ASEAN economies as a result of the type of ACs available in each country and the
corresponding efficiency and labeling policies that are currently in place (which are discussed in the
next section). As seen in Figure 2 below, Thailand displays the most efficient product market in all
AC capacity categories among the surveyed economies (Singapore has the most efficient market but
it did not participate in the survey and thus it is not shown in the figure). Vietnam is second on
performance for smaller cooling capacities, followed by Malaysia. However, for ACs > 20,000 Btu/h
(5.9 kW), the two countries show a similar range of efficiencies. The Philippines has the least efficient
product market, as noted earlier, due to the large market share of less efficient window units and
the lack of more efficient inverter product models.
Figure 2: Average EERs of ACs in the region15
12 R22, a widely used refrigerant in air conditioners, is an Hydrochlorofluorocarbon (HCFCs) refrigerant.
13 R410A, a mixture of HFC-125 and HFC-32, is currently the most important HFC group refrigerant for air conditioners.
14 EER (energy efficiency ratio) is the ratio of the total cooling capacity to the effective power input to the device. The
larger the EER value, the more efficient the equipment.
15 Source: Project data, unless otherwise noted.
2.50
2.70
2.90
3.10
3.30
3.50
3.70
EE
R (
W/W
)
Cooling capacity (Btu/h)
Thailand
Vietnam
Malaysia
Philippines

Regional Policy Roadmap for harmonization of AC standards in ASEAN economies 9
Data from Indonesia is not shown here as the performance data received was only of a few
manufacturers and the data set may not be representative of the entire market. Singapore has the
most efficient product market in the region (it also has the most stringent policies in place) as
described in section 11; however, detailed information on product performance was reported in a
different format that does not allow a comparison of models using the same cooling capacity ranges
as shown in Figure 2.
Policy frameworks
Governments of ASEAN economies have recognized the need for energy conservation for many years
and, in some cases, initiated efforts to promote energy efficiency as early as 1980. Most governments
passed a series of laws, acts or regulations setting priorities for energy conservation, and assigned
functions or created agencies with a mandate to develop strategies and mechanisms that ensure an
appropriate use of energy in all sectors. In addition, some economies established plans to promote
energy efficiency, calling specifically for energy saving targets and the implementation of minimum
energy performance standards and labeling for appliances.
For instance, Thailand’s national energy efficiency policy (under the Thailand 20-Year Energy
Efficiency Development Plan) set up a reduction target of final energy consumption by 20% in 2030,
compared with that in 2005. Vietnam’s National Energy Efficiency Program (VNEEP), designed to
improve energy efficiency in all sectors, calls for 5~8% energy savings from the 2006 level, in its
second phase (2011 – 2015). Malaysia is in the process of developing an Energy Efficiency and
conservation act. Philippines established an energy saving target for the period 2005 – 2014, but
there is no information on whether there are plans to define a new target or revise the previous one.
There were no specific targets cited in the Indonesian Government’s energy efficiency policies.
Agencies and organizations responsible for the development and implementation of the standards
and labeling programs in each economy are detailed in the national assessments (sections 2 – 11). In
general, these structures are unique to each country, involving agencies with the mandate to
implement standards, or labels, or both, and at least a National Standard Body responsible for the
development of test methods (to measure product energy performance). In most countries, the
mandate for standards development and for labels fall under different agencies (or Ministries), thus
greater coordination among agencies is needed to ensure that strategies and policies are
complementary and facilitate achievement of energy efficiency objectives.
AC policies
Most ASEAN economies already have energy efficiency standards and labeling regulations for ACs (see
Table 1 below). Mandatory MEPS are the norm, while labeling programs are either voluntary or
mandatory.
Table 1: S&L policies for ACs in ASEAN economies
ASEAN country MEPS Label
Indonesia Mandatory* Voluntary
Malaysia Mandatory Voluntary
Philippines Mandatory Mandatory
Singapore Mandatory Mandatory
Thailand Mandatory Voluntary
Vietnam Mandatory Mandatory

Regional Policy Roadmap for harmonization of AC standards in ASEAN economies 10
ASEAN country MEPS Label
Brunei Under development Under discussion
Cambodia None None
Laos None None
Myanmar None None
*Implemented as an informal agreement between industry and the regulator
MEPS stringency levels vary significantly among ASEAN economies. For example, Singapore has the
most stringent MEPS at an EER of 3.34 (W/W) or 11.4 (Btu/h/W) for single split units with cooling
capacities below 10kW (34,000 Btu/h), while the remaining economies have MEPS below 2.9/10 for
the same AC types. Indonesia has the lowest MEPS for inverter units at 2.5/8.5. Figure 3 shows MEPS
stringency and coverage by cooling capacity, where major differences in size coverage are also noted.
While it is true that in most economies the most popular sizes are below 20,000 Btu/h (5.9 kW), some
economies have a significant proportion of market sales above that size (e.g., Singapore market sales
> 20,000 Btu/h account for more than 50%).
Figure 3: MEPS stringency and coverage (cooling capacity) in ASEAN economies for single split
ACs
Product testing capacity
There is a limited testing capacity for air conditioners in the ASEAN economies. Table 2 presents the
results of the survey in Group A on local testing capacity per economy. Most economies have at least
one third party test facility for ACs, and in most cases it is government owned. Manufacturer testing
facilities are also available in some economies.
2.2
2.4
2.6
2.8
3.0
3.2
3.4
0 1 0 0 0 0 2 0 0 0 0 3 0 0 0 0 4 0 0 0 0 5 0 0 0 0
EE
R (
W/W
)
COOLING CAPACITY (BTU/H))
Singapore Thailand Malaysia
Philippines Indonesia (inverter) Vietnam
Indonesia (non-inverter)

Regional Policy Roadmap for harmonization of AC standards in ASEAN economies 11
Table 2: AC product testing laboratories by country
Local testing capacity Third party test
facility (may be
government owned)
Manufacturer
test facility
Thailand 1 2
Vietnam 1 3
Philippines 1 0
Indonesia 3 0
Malaysia 1 0
TOTAL 7 5
Testing facilities in all economies surveyed can and do receive accreditation from the national
accreditation body. In the case of Indonesia, Thailand, Vietnam, Philippines, and Malaysia,
accreditation process follows the standard ISO/IEC 1702516, which can facilitate recognition of
product testing in laboratories at the regional level, as it certifies that tests are conducted under a
well-defined procedure prescribed in ISO 17025 by competent bodies. For instance, Malaysia allows
product testing to be done by any accredited regional testing laboratories recognized by Standards
Malaysia. Singapore also allows testing in laboratories in countries other than Singapore that are
accredited by their local accreditation bodies, which have signed a Mutual Recognition
Arrangement (MRA) with the Singapore Accreditation Council.
Market Surveillance Mechanisms
Mechanisms to ensure compliance with S&L programs exist in some ASEAN economies.
Thailand and Vietnam ensure compliance with their respective labeling programs by way of market
surveillance and verification testing once a year, and there is also enforcement in the case of non-
compliance. In Thailand, the procedure details specific actions (ranging from requiring manufacturers
to correct/modify labels to forbidding participation in the program for one year) for various instances
of non-compliance. The process in Vietnam is generic and possible enforcement actions are listed but
not referred to specific instances of non-compliance.
The Philippines reports periodical random selection of products from the market and testing in an
independent laboratory. It is not clear if actions of non-compliance are enforceable as it refers to
advising manufacturers to take remedial measures.
Indonesia’s labeling program is voluntary so manufacturers are not mandated to label their products.
In case of fraudulent use or misuse of labels, a written warning is issued to the manufacturer or
importer and the relevant agency imposes sanctions or revokes the license of manufacturers who fail
to respond.
Singapore requires registration and labeling of products under the program and lists offenses, and
the corresponding enforcement actions and fines for those who are non-compliant. Singapore carries
out market monitoring (store checks) and verification testing of products.
Malaysia doesn’t have a legal framework or a compliance mechanism in place as of date.
16 ISO/IEC 17025:2005 specifies the general requirements for the competence to carry out tests and/or calibrations,
including sampling. It covers testing and calibration performed using standard methods, non-standard methods, and
laboratory-developed methods.

Regional Policy Roadmap for harmonization of AC standards in ASEAN economies 12
Potential energy savings
An assessment of the energy savings potential from transitioning to the best available technology was
conducted for the five economies participating in the data collection survey. The Product and Policy
Analysis Tool (PPAT), a comprehensive model that estimates potential energy savings based on
specific data inputs and policy scenarios was used to conduct the analysis. By inputting economy-
specific data such as the annual product sales, the rate of energy consumption, and the consumer
usage information, PPAT generates estimates of the expected energy savings and GHG emissions
avoided by implementing minimum energy performance standards for a specific appliance.
The following assumptions were used to generate scenarios and input parameters:
The base case was defined at the most popular size (cooling capacity) in each economy and
considered the average efficiency reported on the market for that size (average EER)
The best available technology (BAT) was defined as the EER of the best product in the market for
each country (i.e., the technology that is already available in the market17)
Usage data in terms of hours per day and days per year as reported by manufacturers or as a
default value considering the local climate
Annual sales data were derived from the surveys and validated with third-party market data18
Growth projections from third-party market data19 were used to derive the compound annual
growth rate (CAGR)
The results at the regional level are shown in
Figure 4. Large markets (such as Indonesia and Thailand) are expected to have the largest savings
potential. The modeled scenario considered a transition to the current BAT in each market and
resulted in annual savings potential 180 TWh in 2030 at the regional level. However, as more efficient
AC units get introduced in ASEAN economies, and more stringent policies and other initiatives drive
market transformation towards greater efficiency, additional savings could be realized.
Figure 4: Potential energy savings in ASEAN Region
17 Except for the Philippines where the BAT was too low and was replaced by the BAT in Indonesia.
18 Source: Euromonitor.
19 Euromonitor sales forecasts.
103,884
51,672
9,700 7,600 6,500
-
20,000
40,000
60,000
80,000
100,000
120,000
Energy savings in 2030 from transition to BAT (GWh)
En
ergy
sav
ings
in 2
03
0 (
GW
h)
Thailand Indonesia Malaysia Philippines Vietnam
38% savingspotential
30% savingspotential
22% savingspotential
40% savingspotential
24% savingspotential

Regional Policy Roadmap for harmonization of AC standards in ASEAN economies 13
2. National Assessment - Thailand
Power sector profile
Thailand’s energy supply comes mostly from fossil fuels and a large percentage is imported from
other countries raising a concern for energy security. The primary sources of energy supply in Thailand
are oil, natural gas, biofuel, coal and hydropower as shown in Figure 5. Power is imported from
Myanmar, China, Laos and Cambodia. Figure 6 shows the average electricity consumption by sector:
the industrial sector is the largest consuming sector in Thailand, followed by the residential.
Figure 5: Share of total primary energy supply in 2012-Thailand20
*Share of TPES excludes electricity trade
** In this graph, peat and oil shale are aggregated with coal, when relevant.
Figure 6: Average electricity consumption by Sector in Thailand21
20 http://www.iea.org/stats/WebGraphs/THAILAND4.pdf
21
http://www.cssckmutt.in.th/cssc/cssc_classroom/solar_cells/doc/aj_chaya/LectureNotes/Presentations_documents/5_Thai
landCountryReport_2Feb2012.pdf
46%
22%
10%
15%
6%
Industrial Residential Small general service Business Others

Regional Policy Roadmap for harmonization of AC standards in ASEAN economies 14
AC Market Characteristics
Sales and types overview
The room air conditioner market in Thailand achieved sales of over 2.5 million units in 2013. The
average sales growth in the past 5 years has been 16% per year, with the largest increase in sales in
the 2009 – 2010 period, where yearly sales increased from 1.54 million in 2009 to 2.34 million in 2010.
Figure 7: Sales of all ACs 2009 - 2013
A large proportion of the units (82%) are of room ACs with a cooling capacity less than 27,000 Btu/h,
which normally correspond to single phase ACs; within these, the most popular are units between
9,000 and 15,000 Btu/h. Figure 8 provides an overview of the distribution of ACs sales by capacity in
2013.
Figure 8: Overview of AC sales by cooling capacity

Regional Policy Roadmap for harmonization of AC standards in ASEAN economies 15
Types of ACs available on the Thai market include wall mount (83%), floor/ceiling type (16%), and a
very small proportion of cassette units. There were no window units reported on sales data from
manufacturer surveys or Euromonitor market reports.
Most of the ACs available in the Thai market are of the non-inverter type, with R-22 refrigerant;
inverter units available in the market use R-410A. Figure 9 and 10 show the market shares of ACs by
type and refrigerant used.
Figure 9: AC type distribution in 2013 Figure 10: Refrigerant type distribution in 2013
The 93% of ACs in Thailand were manufactured domestically while the imported units were from
Malaysia and Vietnam.
Energy performance
The average efficiency of ACs available in the market improved over the past five years as shown in
Figure 11. Models with lower cooling capacities (<9,000 Btu/h) display a better performance and show
the highest improvement rate (5%) over the period 2009 – 2013. The most popular models in the range
of 9,000 – 15,000 Btu/h show a 3% improvement over the same period, similar to other capacity
ranges. The average EER of these models is around 11.5.
Figure 11: Average EER (Btu/h/W) by model
Inverter16%
Non-inverter
84%
NA2%
R-2279%
R-410A19%
10.50
11.00
11.50
12.00
12.50
20132012201120102009
< = 9000
> 9000 < = 15000
> 15000 < = 20000
> 20000 < = 27000
> 27000 < = 30000
> 30000

Regional Policy Roadmap for harmonization of AC standards in ASEAN economies 16
The efficiency of the best available models in the market also increased in the past 5 years, showing
a dramatic increase from an EER of 14.9 to an EER of 23.8 for the lower cooling capacities (<9,000
Btu/h). The second highest performer is the most popular category of models in the 9,000 – 15,000
range, with the best available model with an EER of 18.8. Less efficient models in the lower cooling
capacities (<15,000 Btu/h) are also available in the market since 2012 as can be seen in
Figure 13.
Figure 12: Maximum EER (Btu/h/W) by model
Figure 13: Minimum EER (Btu/h/W) by model
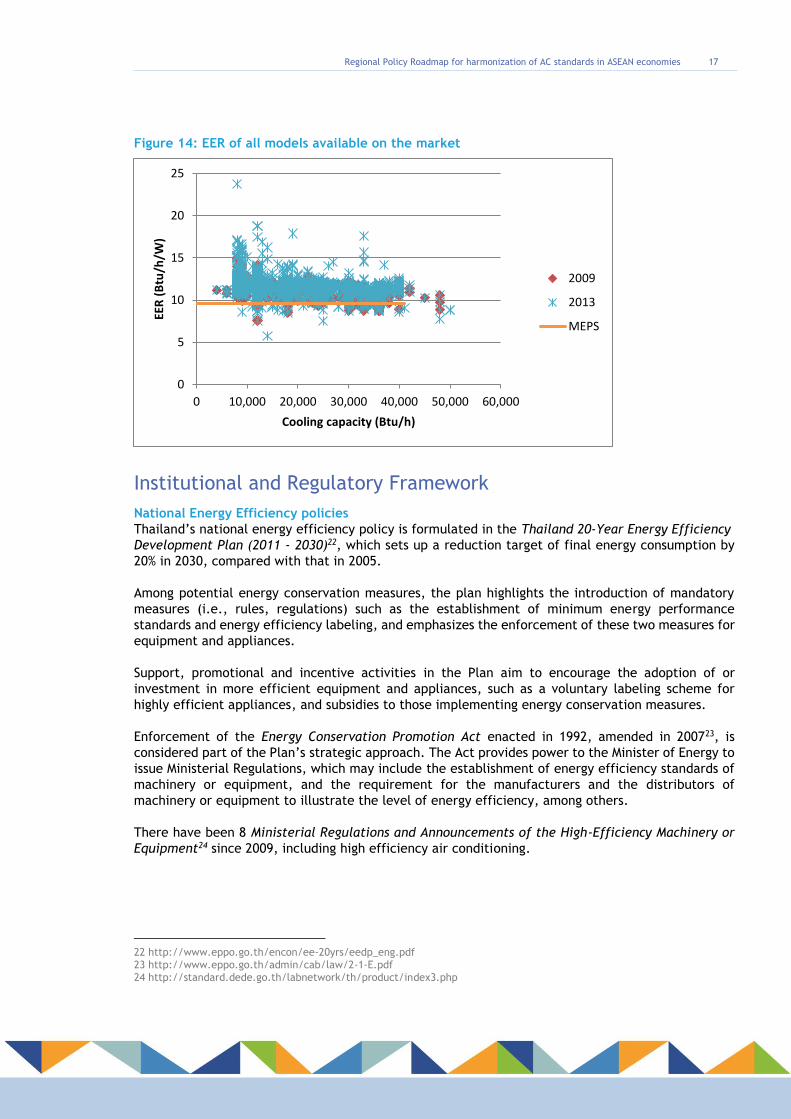
Figure 14 shows the performance of all models available in the market in 2009 and 2013. The EERs of
most of the available models were above the MEPS level, and new more efficient models above the
EER 15.0 have been introduced in 2013 as shown by the scattered points. However, some models
appear to be below the MEPS level both in 2009 and 2013.
10.00
12.00
14.00
16.00
18.00
20.00
22.00
24.00
20132012201120102009
< = 9000 high
> 9000 < = 15000 high
> 15000 < = 20000 high
> 20000 < = 27000 high
> 27000 < = 30000 high
> 30000 high
0.00
2.00
4.00
6.00
8.00
10.00
12.00
20132012201120102009
< = 9000
> 9000 < = 15000
> 15000 < = 20000
> 20000 < = 27000
> 27000 < = 30000
> 30000
Regional Policy Roadmap for harmonization of AC standards in ASEAN economies 17
Figure 14: EER of all models available on the market
Institutional and Regulatory Framework
National Energy Efficiency policies
Thailand’s national energy efficiency policy is formulated in the Thailand 20-Year Energy Efficiency
Development Plan (2011 - 2030)22, which sets up a reduction target of final energy consumption by
20% in 2030, compared with that in 2005.
Among potential energy conservation measures, the plan highlights the introduction of mandatory
measures (i.e., rules, regulations) such as the establishment of minimum energy performance
standards and energy efficiency labeling, and emphasizes the enforcement of these two measures for
equipment and appliances.
Support, promotional and incentive activities in the Plan aim to encourage the adoption of or
investment in more efficient equipment and appliances, such as a voluntary labeling scheme for
highly efficient appliances, and subsidies to those implementing energy conservation measures.
Enforcement of the Energy Conservation Promotion Act enacted in 1992, amended in 200723, is
considered part of the Plan’s strategic approach. The Act provides power to the Minister of Energy to
issue Ministerial Regulations, which may include the establishment of energy efficiency standards of
machinery or equipment, and the requirement for the manufacturers and the distributors of
machinery or equipment to illustrate the level of energy efficiency, among others.
There have been 8 Ministerial Regulations and Announcements of the High-Efficiency Machinery or
Equipment24 since 2009, including high efficiency air conditioning.
22 http://www.eppo.go.th/encon/ee-20yrs/eedp_eng.pdf
23 http://www.eppo.go.th/admin/cab/law/2-1-E.pdf
24 http://standard.dede.go.th/labnetwork/th/product/index3.php
0
5
10
15
20
25
0 10,000 20,000 30,000 40,000 50,000 60,000
EER
(B
tu/h
/W)
Cooling capacity (Btu/h)
2009
2013
MEPS

Regional Policy Roadmap for harmonization of AC standards in ASEAN economies 18
Organizations and responsibilities
The Department of Alternative Energy Development and Efficiency (DEDE) under the Ministry of
Energy is responsible for the development, implementation and enforcement of the National energy
efficiency policy. Its duties include energy efficiency promotion and energy conservation regulation.
The Department falls under the Ministry of Energy and works with other agencies in the development
and promotion of MEPS and labels, as can be seen in Figure 15.
Figure 15: Thailand Energy Efficiency S&L structure
Standards and labels for ACs
MEPS
Thailand has MEPS for air conditioners and other 11 appliances and equipment25, both mandatory and
voluntary. MEPS are developed by the DEDE and Thai Industrial Standards Institute, in consultation
with stakeholders representing government and private sectors. There is no fixed periodicity for
revising the standards.
Mandatory MEPS for ACs were implemented in 2004, and revised in 2011, with the following scope:
Cooling capacity less than or equal to 12,000 Watt
Window type and split type
Table 3: MEPS requirements
Type Cooling capacity ≤ 8,000 W Cooling capacity > 8,000 and
≤ 12,000 W
Window type (non-split type) (not less
than)
2.82 W/W
(9.6 Btu/hr/W)
2.53 W/W
(8.6 Btu/hr/W)
Split type (not less than) 2.82 W/W
(9.6 Btu/hr/W)
2.82 W/W
(9.6 Btu/hr/W)
25 Refrigerators, self-ballasted lamps, single-capped fluorescent lamps, double-capped fluorescent lamps, 3-Phase motors,
LPG stoves, insulator, diesel engines, rice cookers, microwave ovens, and motorcycles.
Ministry of Energy
Thai Industrial Standards Institute
MEPS
DEDE
Set EE standards and labeling
Labeling and promotion (non-electric & industrial products)
Electricity Generating Authority of Thailand
Labeling and promotion (household appliances & office equipment)

Regional Policy Roadmap for harmonization of AC standards in ASEAN economies 19
Labeling program and requirements
The labeling program uses a comparative label. Manufacturers can affix the label upon self-
declaration by testing in an independent third party test laboratory and registration. Testing using a
balanced-type calorimeter room is required. A label sample and labeling requirements are shown in
Figure 16 and Table 4.
Figure 16: Sample of the comparative label
Table 4: EER requirements for label classes
Label class AC < 8000 Watt, 27296 BTU/Hr AC > 8000 Watt, 27296 BTU/Hr
No. 5 above or 11.60 above or 11.00
No. 4 above or 11.00 – less than 11.59 above or 10.60 – less than 10.99
No. 3 above or 10.60 – less than 11.00 above or 9.60 – less than 10.59
Local testing capabilities
There is a third party test facility for ACs available in Thailand (government owned laboratory); two
manufacturers also own test facilities.
The accreditation agency for test laboratories is the Thai Industrial Standards Institute (TISI), which
provides accreditation under the following standards:
National standard- TIS 17025
International Standard- ISO/IEC 17025
These labs conduct AC testing under TIS 1155-2536, following both methods: balance calorimeter
and psychrometric (enthalpy).There is no information on the time required to complete and issue a
test report.
Market surveillance mechanisms
Thailand has put in place mechanisms to ensure compliance with the labeling program (products
which are labelled by the Electricity Generating Authority of Thailand - EGAT - and have attached a
certification mark by TISI). Market surveillance of retailers and manufacturers takes place once a
year, as follows:

Regional Policy Roadmap for harmonization of AC standards in ASEAN economies 20
Randomly spot-purchase appliances at electric appliances shop and department stores
Check product’s specification under label criteria
Send those models to test for compliance with label’s criteria at the accredited laboratory
Verification/check testing is also conducted once a year. TISI’s surveillance process lists the following
procedures where appropriate:
A. Taking sample from the factory to be tested by designated laboratory
B. Taking sample to be tested at the factory
C. Taking sample from sale premises to be tested by designated laboratory
D. Taking sample from each import to be tested by designated laboratory
In the case of a non-compliant product (i.e., the test result of the random model does not comply
with the declared performance on label ± 5%), the enforcement process by EGAT is:
1) Spot picking the models for a second time at production sites (twice amount) at
producers/importers cost
2) Average test results of 1st and 2nd random models to justify the compliance
In case the average test result does not comply with the declared performance on label (± 5%):
1) If the test results still pass label No. 5 criteria, producers/manufacturers will be forced to edit the
information published, and after that EGAT will distribute a new label base on the new test results.
2) If the test results fail, EGAT will call back all distributed labels of the unqualified models and
forbid those models to participate in labeling program for at least 1 year.
Court imposed sanctions such as fines, declarations and injunctions against the manufacturers can
also take place.
Assessment of energy savings potential
Base case and Policy case
The Thai AC market is dominated by models with small capacities under 27000 Btu/h, which
correspond to single phase ACs and represent over 82% of the market. However, a signification portion
of the market (18%) is represented by three-phase ACs with cooling capacities over 27000 Btu/h.
Therefore, two base cases are analyzed in the energy savings assessment in order to capture both
single- and three-phase ACs types.
Base case 1:
A cooling capacity of 12000 Btu/h is selected as it is the most popular single-phase ACs. The analysis
shows that 489 models have cooling capacities of 12000 Btu/h, representing over 20% of all 2388
surveyed models.
The average EER (Btu/h/W) for models with cooling capacity of 12000 Btu/h is 11.6 and the EER
(Btu/h/W) for the best performing model in this product category is 18.8.
Base case 2:
For three-phase ACs, cooling capacities of 36000 Btu/h units are the most popular. The analysis
shows that 127 models have cooling capacities of 36000 Btu/h, representing over 5% of all 2388
surveyed models.

Regional Policy Roadmap for harmonization of AC standards in ASEAN economies 21
The average EER (Btu/h/W) for models with cooling capacity of 36000 Btu/h is 11.1 and the EER
(Btu/h/W) for the best performing model in this product category is 17.6.
Based on the market trend from 2009 to 2013, it is assumed that the AC market in Thailand will grow
at an annual rate of 8% from 2013 to 2030.
Thailand has a typical tropical climate. The average maximum daily temperatures in Thailand are
over 30oC26 year-round. Therefore, it is assumed a year-round AC operation of 365 days and 8 hours
of AC usage per day.
The lifespan for ACs is expected to be 10 years based on values reported in other economies.
Results
Using CLASP’s Product Policy Analysis Tool (PPAT), it is estimated that over 66,400 GWh and 37,400
GWh of energy savings can be achieved in 2030 for base cases 1 and 2 respectively.
Figure 17: Energy Saving Potentials for Air Conditioners in Thailand in 2030
26 http://www.tmd.go.th/en/province_stat.php?StationNumber=48455 [Date accessed: 2014 Nov. 18th.]
66,414 GWh
37,470 GWh
-
10,000
20,000
30,000
40,000
50,000
60,000
70,000
Base case A Base case B
Energy savings

Regional Policy Roadmap for harmonization of AC standards in ASEAN economies 22
3. National Assessment - Vietnam
Power sector profile
The major sources of energy in Vietnam are coal, petroleum, hydropower and natural gas. A significant number of households are still using traditional solid fuels for heating, lighting and cooking in the residential sector. Vietnam is a net exporter of energy due to its oil and coal resources.
Figure 18: Share of total primary energy supply in 2012-Vietnam27
In 2009 Vietnam’s net import of electricity was 4%. At the end of June 2005, the National Power Grid
has reached all provinces, connecting 95% of communes and 89% of households in rural areas28.
Figure 19: Average electricity consumption by Sector in Vietnam29
With the rapid growth and expansion of the Vietnamese economy over the last decade, power demand
has been increasing dramatically. In order to meet this rapidly growing demand, Vietnam’s power
industry has to expand and improve the power system by developing its resources, enhance
transmission lines that connect the country’s three regions (north, center, and south), and reduce
transmission and distribution (T&D) losses.30
27 http://www.iea.org/stats/WebGraphs/VIETNAM4.pdf
28 http://www.laurea.fi/en/connect/results/Documents/Vietnam%20Fact%20Sheet.pdf
29https://www.esmap.org/sites/esmap.org/files/Vietnam's%20Power%20Sector%20.pdf
30 http://www.nbr.org/downloads/pdfs/eta/PES_2012_summitpaper_Nguyen.pdf
52%
1%
37%
10%Industry and construction
Agriculture, forestry andaquaculture
Residences andadministration
Commerce, hotels andothers

Regional Policy Roadmap for harmonization of AC standards in ASEAN economies 23
AC Market Characteristics
Sales and types overview
The room air conditioner market in Vietnam achieved sales of over 900,000 units in 2013, with a 25%
growth over the previous year. Sales were more or less stagnant from 2010 to 2012, with a slight
decline in 2011. It was estimated that the majority of the ACs sold in Vietnam (70%) were for
residential use.
Panasonic and Daikin are the two largest players in the Vietnamese AC market, with market shares
of 26.7% and 21.6% in 2013, respectively. Manufacturers such as LG, Sharp, Mitsubishi, Samsung,
Toshiba, Funiki, and Midea also have notable presence on the Vietnamese market.
Figure 20: Sales of all ACs 2010 - 2013
A large proportion of the units (98%) are room ACs with a cooling capacity less than 20,000 Btu/h,
which normally correspond to single phase AC; within these, the most popular are units smaller than
11,000 Btu/h and units between 11,000 and 15,000 Btu/h. Figure 21 provides an overview of the
distribution of AC sales by capacity in 2013.
Figure 21: Overview of AC sales by cooling capacity
-
200,000
400,000
600,000
800,000
1,000,000
2010 2011 2012 2013
56%34%
8%2%
Cooing Capacity (Btu/h) Distribution by sales in 2013
< = 11000
>11000 < = 15000
> 15000 < = 20000
> 20000

Regional Policy Roadmap for harmonization of AC standards in ASEAN economies 24
The types of ACs available in the Vietnamese market include wall mount (83%), floor/ceiling type
(6%), floor standing/corner type (5%) and cassette units (5%). A very small amount of sales data of
window units was reported from manufacturer surveys or Euromonitor market reports.
Most of the ACs available in the Vietnamese market are of the non-inverter type and use R-22
refrigerant; inverter units available in the market use R-410A. Figure 22 and Figure 23 show the
market shares of ACs by type and refrigerant used.
Figure 22: AC type distribution in 2013 Figure 23: Refrigerant type distribution in 2013
Most of ACs sold in Vietnam are imported from Malaysia, Thailand and China (77%), whereas only 23% were manufactured locally.
Energy performance
There was no performance data available before 2013. The average EER for models with cooling
capacities lower than 20,000 Btu/h was around 11 Btu/h/W, whereas for larger units, the average
EER was slightly lower, at 9.4 Btu/h/W. The minimum EERs range from 7.1 to 9.4 Btu/h/W and the
maximum EERs range from 13.5 to 20.1 Btu/h/W.
Figure 24: Average, Max and Min EER (Btu/h/W) by model capacity in 2013
NA2%
R2271%
R410A27%
5.00
7.00
9.00
11.00
13.00
15.00
17.00
19.00
21.00
< = 11000 >11000 < = 15000 > 15000 < = 20000 > 20000
Average Max Min
Inverter34%
Non-inverter
62%
NA4%

Regional Policy Roadmap for harmonization of AC standards in ASEAN economies 25
Among all 219 surveyed models, almost all products satisfy the MEPS requirements as shown in Figure
25. However, a few models with EER lower than required value are still in the market.
Figure 25: EER distribution for all surveyed models
Institutional and Regulatory Framework
National Energy Efficiency policies
Vietnam’s national energy efficiency policy was first initiated by the issuance of the Governmental
Decree on Thrifty and Efficient Use of Energy (No. 102/2003/ND-CP)31 in 2003. The Decree outlined
the efficient energy use in production establishments, buildings, daily activities, as well as for energy
consuming equipment and means. The Decree also sets measures to promote the efficient use of
energy, such as incentives policies, consumer awareness promotion, and research.
Vietnam National Energy Efficiency Program (VNEEP), initiated in 2006, was the first-ever
comprehensive program designed to improve energy efficiency in all sectors in Vietnam. The program
was divided into two phases:
Phase One (2006~2010): 3~5% energy savings from 2006 level
Phase Two (2011~2015): 5~8% energy savings from 2006 level
Six components and a total of 11 projects were specified in VNEEP in order to achieve these savings.
The Law on Energy Saving and Efficiency was approved by the 12th National Assembly on June 17,
2010 and became effective on Jan 1, 2011. The Law formed the legal basis for Vietnam’s national
energy efficiency programs. It provided policies and measures to promote economical and efficient
use of energy; and the rights, obligations and responsibilities of organizations, households and
individuals in the economical and efficient use of energy.
31 http://tietkiemnangluong.com.vn/home/eepmedia/2011/07/06/be72ebdb6_28_decree_102.2003ndcp.pdf
5.00
7.00
9.00
11.00
13.00
15.00
17.00
19.00
21.00
0 10000 20000 30000 40000 50000 60000
EE
R (
Btu
/h
/W
)
Cooling capacity (Btu/h)
2013
MEPS
Regional Policy Roadmap for harmonization of AC standards in ASEAN economies 26
Organizations and responsibilities
The General Directorate of Energy of the Ministry of Industry and Trade is responsible for developing
the national energy efficiency policies which are submitted directly to the Prime Minister. It is also
responsible for developing strategies and policies in the energy sector, as well as for setting policies
and mechanisms for electricity prices. The General Directorate of Energy is also responsible for the
issuance of circulars guiding the implementations of decrees and decisions of the Vietnamese
government and Prime Minister. The General Directorate manages and regulates energy-related
activities and energy consumption.
The Ministry of Science and Technology is responsible for developing and publishing national standards
for energy efficiency and the minimum energy efficiency requirements. The Ministry of Science and
Technology coordinates with relevant ministries to organize research, and apply advanced science
and technology in the field of energy efficiency and conservation.
Standards and labels for ACs
MEPS
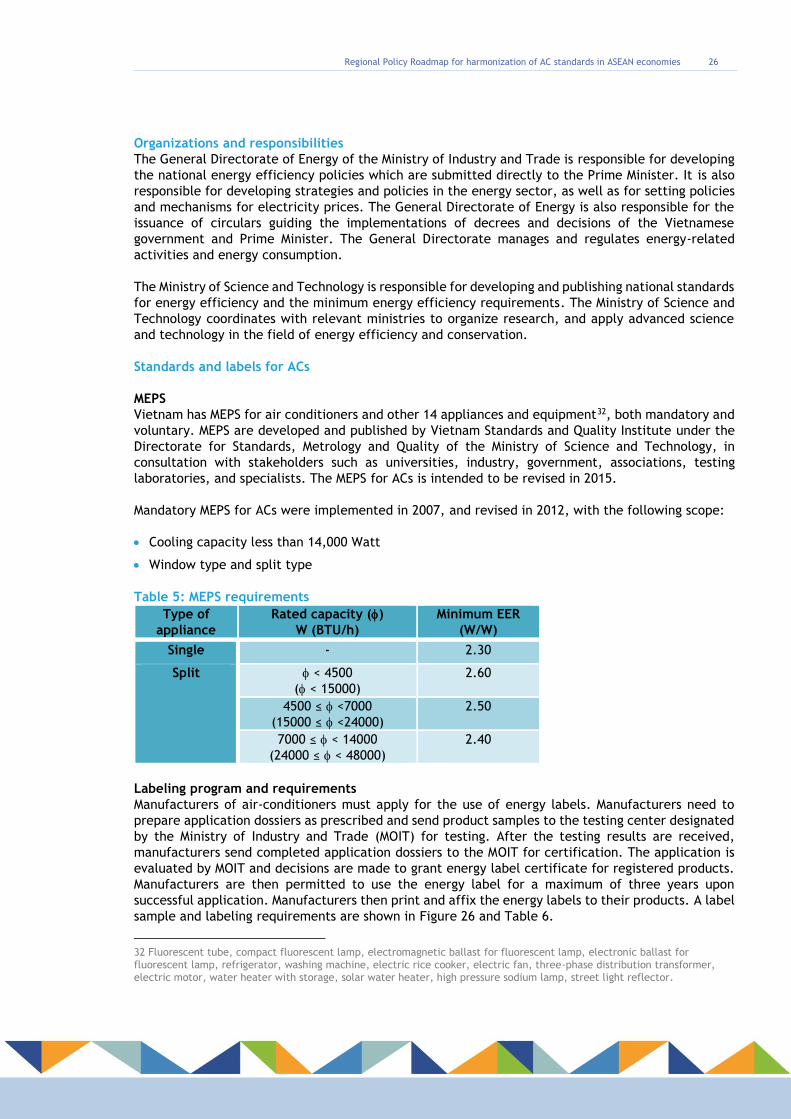
Vietnam has MEPS for air conditioners and other 14 appliances and equipment32, both mandatory and
voluntary. MEPS are developed and published by Vietnam Standards and Quality Institute under the
Directorate for Standards, Metrology and Quality of the Ministry of Science and Technology, in
consultation with stakeholders such as universities, industry, government, associations, testing
laboratories, and specialists. The MEPS for ACs is intended to be revised in 2015.
Mandatory MEPS for ACs were implemented in 2007, and revised in 2012, with the following scope:
Cooling capacity less than 14,000 Watt
Window type and split type
Table 5: MEPS requirements
Type of
appliance
Rated capacity ()
W (BTU/h)
Minimum EER
(W/W)
Single - 2.30
Split < 4500
( < 15000)
2.60
4500 ≤ <7000
(15000 ≤ <24000)
2.50
7000 ≤ < 14000
(24000 ≤ < 48000)
2.40
Labeling program and requirements
Manufacturers of air-conditioners must apply for the use of energy labels. Manufacturers need to
prepare application dossiers as prescribed and send product samples to the testing center designated
by the Ministry of Industry and Trade (MOIT) for testing. After the testing results are received,
manufacturers send completed application dossiers to the MOIT for certification. The application is
evaluated by MOIT and decisions are made to grant energy label certificate for registered products.
Manufacturers are then permitted to use the energy label for a maximum of three years upon
successful application. Manufacturers then print and affix the energy labels to their products. A label
sample and labeling requirements are shown in Figure 26 and Table 6.
32 Fluorescent tube, compact fluorescent lamp, electromagnetic ballast for fluorescent lamp, electronic ballast for
fluorescent lamp, refrigerator, washing machine, electric rice cooker, electric fan, three-phase distribution transformer,
electric motor, water heater with storage, solar water heater, high pressure sodium lamp, street light reflector.

Regional Policy Roadmap for harmonization of AC standards in ASEAN economies 27
Figure 26: Sample of the comparative label
Table 6: EER requirements for label grades
Type of
appliance
Rated capacity ()
W (BTU/h)
Grades
1 2 3 4 5
Single - 2.30 2.50 2.70 2.90 3.10
Split < 4500
( < 15000)
2.60 2.80 3.00 3.20 3.40
4500 ≤ <7000
(15000 ≤ <24000)
2.50 2.70 2.90 3.10 3.30
7000 ≤ < 14000
(24000 ≤ < 48000)
2.40 2.60 2.80 3.00 3.20
Local testing capabilities
The state-owned testing facility, Testing and Verification Center for Industry which is under Vietnam
National Coal - Mineral Industries Holding Corporation (Vinacomin), is responsible for all product
testing for the energy label application. Three manufacturer owned testing facilities are also
available locally:
Panasonic Vietnam
Haier Electrical Vietnam
Daikin Vietnam
The accreditation agency for test laboratories is the Bureau of Accreditation33, which provides
accreditation under the International Standard- ISO/IEC 17025.
The test standard used is Air conditioner – Methods to determine energy performance (TCVN
7831:2012)34, following the calorimeter method.
Market surveillance mechanisms
Vietnam has put in place mechanisms to ensure compliance with the labeling program. Market
surveillance of retailers and manufacturers takes place once a year. Departments of Industry and
Trade at local provincial level are responsible for the market surveillance effort. The market
surveillance mechanisms are as follows:
33 http://www.tcvn.gov.vn/en/about_stameq/vpcna.htm
34 http://vneec.gov.vn/en/to-label/list-of-tcvn-standards-for-means-and-equipment-of-the-energy-efficiency-labeling-
program-36002-12052.html

Regional Policy Roadmap for harmonization of AC standards in ASEAN economies 28
Market monitoring to ensure that all eligible products are registered and that the energy
efficiency labels are placed correctly on products at the point of sale. It is the responsibility of
the vendor to ensure that product labels are not misused or wrongly placed.
Verification/check testing to ensure that the energy performance of product meet the declared
values. Products are randomly selected from the market and tested by designated laboratories.
Manufacturers are responsible for the transportation of samples to the testing facility. The
monitoring and surveillance system is carried out by Air Conditioning & Refrigeration Technical
Science Association (VISRAE).
Challenge testing is carried out based on complaints filed towards products.
The enforcement of MEPS and energy labels is also carried out by Department of Industry and Trade
at provincial level. In the case of a non-compliant product, the following actions are generally taken
towards the manufacturer:
Educational initiative;
Products confiscation;
Fines;
Termination of labeling or withdrawal of label certificate;
Compensation to adversely affected persons;
Formal court enforceable undertakings.
For fraudulent use or misuse of labels, punitive actions are taken against both retailers and
manufacturers:
Penalty of 50-70mil. VND;
Termination of label use.
For manufacturers in violation of energy efficiency regulations or laws, the following actions are
taken:
Warning letters;
Fines.
Assessment of energy savings potential
Base case and Policy case
As described previously, the AC market in Vietnam is dominated by smaller units with cooling
capacities below 15000 Btu/h, which account for over 90% of the entire market. Among this product
category, models with cooling capacities of 12000 Btu/h are very popular – from 219 surveyed models,
11% of models have cooling capacities of 12000 Btu/h – and thus are selected as the base case.
The analysis shows that the associated rated power and average EER for products with 12000 Btu/h
are 1099 W and 3.2 (W/W). Among all surveyed models, the best performing ACs under 12000 Btu/h
cooling capacity have an EER of 5.3 (W/W). These values are used for the base case and BAT scenarios.
Based on the market trend from 2010 to 2013, it is assumed that the AC market in Vietnam will grow
at an annual rate of 5% from 2013 to 2030.

Regional Policy Roadmap for harmonization of AC standards in ASEAN economies 29
Vietnam has a typical tropical climate, and its weather is generally warm year around, however the
weather is cooler from October to April with average maximum daily temperature between 20 to
29oC. Temperatures are higher in May through September with average maximum daily temperature
of over 30oC35. Therefore, it is assumed a 150 days of AC operation and 8 hours of AC usage per day.
The lifespan for ACs is expected to be 10 years based on values reported in other economies.
Results
Using the PPAT, it is estimated that over 6.5 TWh of energy savings can be achieved in 2030 if the
best available technology on the current Vietnam market is adopted.
Figure 27: Energy Saving Potentials and CO2 Abatement for Air Conditioners in Vietnam in 2030
35 http://www.vietnamembassy.org.uk/climate.html [Date accessed: 2014 Nov. 18th.]
6.5 TWh3.0 mtCO2e
0
0.5
1
1.5
2
2.5
3
3.5
0
1
2
3
4
5
6
7
Energy Savings CO2 Abatement
CO
2 A
bate
ment
(mtC
O2e)
Energ
y S
avin
g (
TW
h)

Regional Policy Roadmap for harmonization of AC standards in ASEAN economies 30
4. National Assessment - Philippines
Power sector profile
Philippines is a net importer of energy due to its relatively small indigenous energy reserves and
growing consumption. The primary energy supply of Philippines is sourced from oil, coal, renewables
and natural gas as seen in Figure 28. The transport sector is the country’s largest consumer, with
33.4% demand, followed by the industrial and residential sectors with 27.6% and 27.1% respectively;
the remainder corresponds to the commercial and agricultural sectors36. Considerable indigenous
geothermal resources are in the process of being developed, but until then, imported fossil fuels will
continue to dominate the energy mix.
Figure 28: Share of total primary energy supply in 2012-Philippines37
*Share of TPES excludes electricity trade
** In this graph, peat and oil shale are aggregated with coal, when relevant.
AC Market Characteristics
Sales and types overview
The sales of room air conditioners in Philippines reached over 650,000 units in 2013. The average
sales growth over the past 5 years is 3-6% per year, with a slight decrease in sales in 2011, when the
sales were 580,000 units. Window units account for a large portion of the market (64%), the remaining
being split units.
36 http://cigrasp.pik-potsdam.de/countries/2/energy_profile
37 http://www.iea.org/stats/WebGraphs/PHILIPPINE4.pdf

Regional Policy Roadmap for harmonization of AC standards in ASEAN economies 31
Figure 29: Sales of all ACs 2009 – 2013
A large proportion (95%) of the models have a cooling capacity less than 20,000 Btu/h; within these,
the most popular are units less than 9,000 Btu/h. Figure 30 provides an overview of the distribution
of ACs models by capacity in 2013.
Figure 30: Overview of AC models by cooling capacity (Btu/h)
All of the ACs available on the Philippines market are of the non-inverter type and use R-22
refrigerant; 30% of the ACs in Philippines was reported to be manufactured domestically while 70%
of the units were imported from China and other not specified countries.
Energy performance
The efficiency of ACs available in the market did not change significantly over the last 5 year period
i.e., there was no introduction of more efficient models or even new technologies. The average EER
of these models are shown in Figure 31. Models with lower cooling capacities (<15,000 Btu/h) display
a better performance over the period 2009 – 2013.
43%
35%
17%
5%
< = 9000
> 9000 < = 15000
> 15000 < = 20000
> 20000 < = 27000
0
100,000
200,000
300,000
400,000
500,000
600,000
700,000
2009 2010 2011 2012 2013
Window AC
Split AC

Regional Policy Roadmap for harmonization of AC standards in ASEAN economies 32
Figure 31: Average EER (Btu/h/W) by model
The efficiency of the best available models in the market remained unchanged in the last 5 years,
with some more efficient units being only available for some years. The most popular category
below 9,000 Btu/h has the best available model with an EER of 12.64. Least efficient models can be
seen in
Figure 33.
Figure 32: Maximum EER (Btu/h/W) by model
8.0
8.5
9.0
9.5
10.0
10.5
11.0
11.5
12.0
12.5
13.0
2009 2010 2011 2012 2013
< = 9000
> 9000 < = 15000
> 15000 < = 20000
> 20000 < = 27000
> 27000 < = 30000
8.0
8.5
9.0
9.5
10.0
10.5
11.0
2009 2010 2011 2012 2013
< = 9000
> 9000 < = 15000
> 15000 < = 20000
> 20000 < = 27000
> 27000 < = 30000

Regional Policy Roadmap for harmonization of AC standards in ASEAN economies 33
Figure 33: Minimum EER (Btu/h/W) by model
Among all the surveyed models, almost all products satisfied the MEPS requirements in 2009 and in
2013 as shown in Figure 34. The figure also shows there is no variation in the market performance
in the 5 year period, as EERs remained in the same range.
Figure 34: EER distribution for all surveyed models
8.0
8.5
9.0
9.5
10.0
2009 2010 2011 2012 2013
< = 9000
> 9000 < = 15000
> 15000 < = 20000
> 20000 < = 27000
> 27000 < = 30000
7
8
9
10
11
12
13
14
0 10,000 20,000 30,000 40,000
EER
(B
tu/h
/W)
Cooling capacity (Btu/h)
2009
2013
MEPS

Regional Policy Roadmap for harmonization of AC standards in ASEAN economies 34
Institutional and Regulatory Framework
National Energy Efficiency policies
The Philippines’ “Republic Act No. 7638”, also known as the Department of Energy Act of 1992,
created the Department of Energy for all the functions and activities related to Energy and for other
purposes. The Department of Energy is mandated to provide adequate, reliable and affordable energy
to industries, to enable them to provide employment opportunities and low cost of goods and
services, and to the ordinary citizen, to enable them to achieve a decent lifestyle.
The primary goal of the Department of Energy towards energy efficiency and conservation is to make
it a way of life, increase awareness and the attainment of total energy savings of 229 million barrels
of fuel oil equivalent (MMBFOE) from the implementation of energy efficiency and alternative fuels
programs for the period 2005-2014. It is estimated that about 50.9 million tons of CO2 equivalent
emissions will be avoided over the same period38. Appliance and equipment standards and labeling is
one of the major thrust areas to achieve this goal.
Organizations and responsibilities
The standards and labeling program is a joint effort of Department of Energy (DOE) and Department
of Trade and Industry (DTI) which requires appliances and lighting products to meet prescribed energy
efficiency levels and carry an energy label at the point of sale. DOE through its Lighting and Appliance
Testing Laboratory (LATL) implements the energy labeling and undertakes energy performance
testing and certification of specific household appliances and energy equipment in the
implementation of the energy standards and labeling program.
The Bureau of Philippines Standards (BPS) of the DTI is the National Standards Body of the Philippines
as mandated by Republic Act 4109 also known as the Standardization law of Philippines. BPS is
mandated to develop, promulgate, implement and coordinate standardization activities in
Philippines. It is mainly responsible for development of relevant Philippine National Standards,
product certification and enforcement activities. Standards are developed by BPS in consultation with
stakeholders representing government and private sectors. The institutional structure of S&L can be
seen in the Figure 35.
Figure 35: Philippines Energy Efficiency S&L structure39
DOE - Department of Energy
DTI - Department of Trade and Industry
ERTLS - Energy Research and Testing Laboratory
Services
BPS - Bureau of Product Standards
LATL - Lighting and Appliance Testing
Laboratory
PLIA - Philippines Lighting Industry Association
PAIA - Philippines Appliance Industry Association
38 https://www.doe.gov.ph/energy-efficiency
39http://www.lites.asia/files/otherfiles/0000/0173/Informing_the_Supplier_Philippines_Raquel_Huliganga.pdf

Regional Policy Roadmap for harmonization of AC standards in ASEAN economies 35
Standards and labels for ACs
MEPS
Philippines has MEPS for room air conditioners, refrigerators/freezers and lighting products including
compact fluorescent lamps, linear fluorescent lamps and ballasts, which are enforced jointly by DoE
and DTI.
The energy labeling program for window-type RACs was launched in 1993 and was later expanded to
include split type-RACs in 2001 with the following scope:
Cooling capacity less than or equal to 36,000 kJ/hour (10 kW)
Window type and split type (wall and floor mounted)
Table 7: MEPS requirements for all types
Classification of room
air conditioners
1999 2000 2001 2002
Cooling capacity ≤
12,000 kJ/hr (3.33
kW)
2.55 W/W
(8.7 Btu/hr/W)
2.55 W/W
(8.7 Btu/hr/W)
2.66 W/W
(9.1 Btu/hr/W)
2.66 W/W
(9.1 Btu/hr/W)
Cooling capacity >
12,000 kJ/hr (3.33
kW)
2.4 W/W
(8.2 Btu/hr/W)
2.4 W/W
(8.2 Btu/hr/W)
2.4 W/W
(8.2 Btu/hr/W)
2.53 W/W
(8.6 Btu/hr/W)
Labeling program and requirements
The labeling program uses a comparative label. Manufacturers and importers must supply a test report
from a government-recognized third party independent testing laboratory and complete a registration
process for each model/family of product models to be able to sell products. Testing can be
performed by both balanced-type calorimeter and enthalpy method. The label shows the Energy
Efficiency Ratio or EER of the unit, which allow consumers to compare the efficiency and cost of
operation of the different RAC models. A label sample is shown in Figure 36.
Figure 36: Sample of the endorsement label

Regional Policy Roadmap for harmonization of AC standards in ASEAN economies 36
Local testing capabilities
There is a third party test facility available in Philippines (government owned laboratory) which
conducts testing under national standard for air conditioners i.e., PNS 240:1998/ISO5151:1994 “Non-
ducted air conditioners and heat pumps – Testing and rating for performance”. There is no
information on the time required to complete and issue a test report.
In Philippines, the government agency mandated to carry out the task of accreditation of laboratories
is the DTI through its Bureau of Product Standards Laboratory Accreditation Scheme (BPS-LAS), which
provides accreditation under following standards:
National standard- PNS ISO/IEC 17025
International Standard- ISO/IEC 17025
Market surveillance mechanisms
The flow chart below in Figure 37: explains the market surveillance mechanisms undertaken in
Philippines for S&L program.
Figure 37: Philippines monitoring and verification cycle40
DOE Department of Energy
DTI Department of Trade and Industry
BPS Bureau of Product Standards
LATL Lighting and Appliance Testing Laboratory
PS Philippines Standard Certification Mark Scheme
ICC Import Commodity Clearance Scheme
In order to protect buyers as well as manufacturers from false claims, samples of all brand and models
of RACs are randomly selected and tested periodically in a government recognized laboratory for
validation of the claimed ratings as indicated in the label and to determine compliance with the
MEPS.
40 http://www.lites.asia/files/otherfiles/0000/0173/Informing_the_Supplier_Philippines_Raquel_Huliganga.pdf

Regional Policy Roadmap for harmonization of AC standards in ASEAN economies 37
The authorized representatives of DTI and BPS procure a sample of RAC from the factories,
warehouses, or from the market to ascertain proper labeling or conformance of the units to the
minimum EER standards. The sample is tested in LATL, which submits the test results to BPS, which
in turn then administers the validation of energy labels. In case LATL is not available for testing,
tests can be carried out by testing laboratories that are recognized by DTI-BPS.
DOE also collaborates with DTI in monitoring compliance at the appliance stores for the accuracy and
correctness of information on the label.
The DTI regional and provincial offices, strategically located in various parts of the country,
undertake sampling of RAC products from the warehouse, inspect appliance stores for compliance to
the energy label requirements, and impose penalties for non-compliance ranging from legal action
with administrative fine or seizure of non-compliant products to possible suspension or cancelation
of the license.
For air conditioners and refrigerators, if a product fails the first round of testing, another sample
from the same lot will be tested. If upon testing the product complies with the standard, the lot is
declared as conforming to the requirements of the standard.
If both tests fail to conform to the requirements of the standard:
i) The manufacturer will be advised to undertake remedial measures; and
ii) The importer will be advised to export the products to the country of import.
If the ratings on the energy label are incorrect, the manufacturer or importer is required to undertake
the necessary corrections on the energy label.
Assessment of energy savings potential
Base case and Policy case
According to the surveys’ results, all ACs sold in the Philippines market are single-phase. Small units
with less than 9000 Btu/h cooling capacity dominate the market and are thus selected as the base
case. The rated power is 850W and the average EER is 10.1 Btu/h/W under this product category.
There were no best performing ACs in Philippines, so the BAT from Indonesia was selected for the
energy savings potential (EER of 13.3).
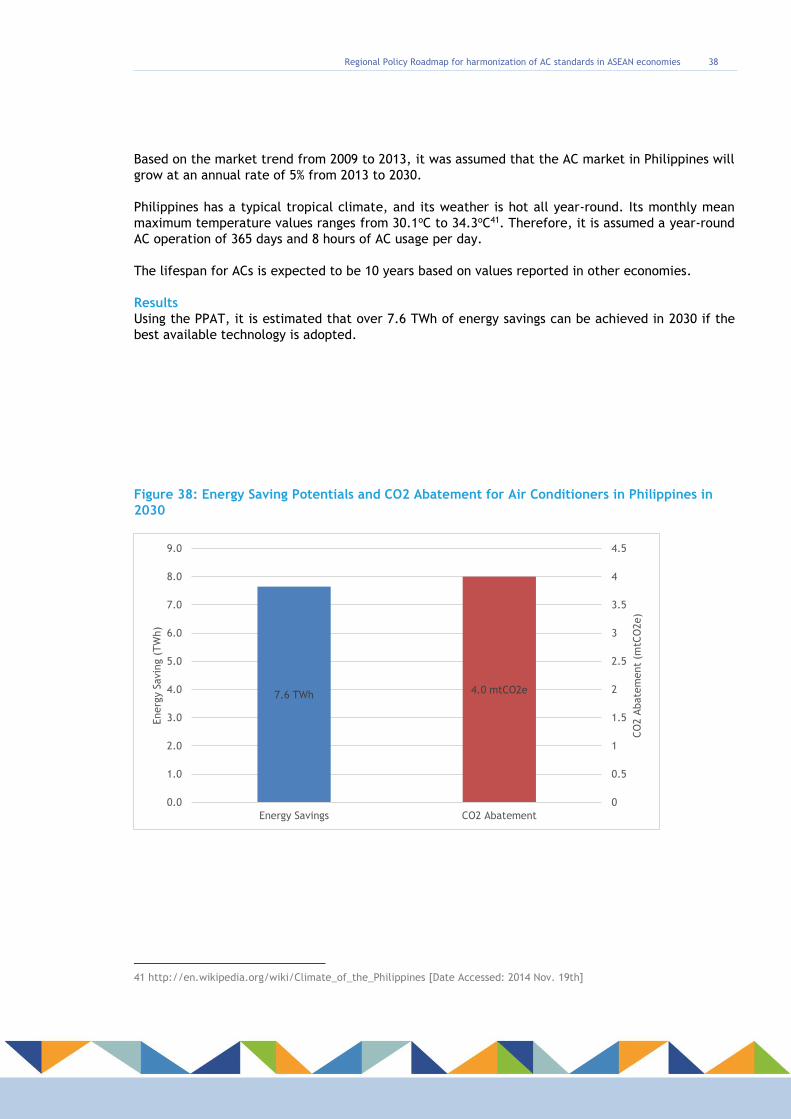
Regional Policy Roadmap for harmonization of AC standards in ASEAN economies 38
Based on the market trend from 2009 to 2013, it was assumed that the AC market in Philippines will
grow at an annual rate of 5% from 2013 to 2030.
Philippines has a typical tropical climate, and its weather is hot all year-round. Its monthly mean
maximum temperature values ranges from 30.1oC to 34.3oC41. Therefore, it is assumed a year-round
AC operation of 365 days and 8 hours of AC usage per day.
The lifespan for ACs is expected to be 10 years based on values reported in other economies.
Results
Using the PPAT, it is estimated that over 7.6 TWh of energy savings can be achieved in 2030 if the
best available technology is adopted.
Figure 38: Energy Saving Potentials and CO2 Abatement for Air Conditioners in Philippines in
2030
41 http://en.wikipedia.org/wiki/Climate_of_the_Philippines [Date Accessed: 2014 Nov. 19th]
7.6 TWh 4.0 mtCO2e
0
0.5
1
1.5
2
2.5
3
3.5
4
4.5
0.0
1.0
2.0
3.0
4.0
5.0
6.0
7.0
8.0
9.0
Energy Savings CO2 Abatement
CO
2 A
bate
ment
(mtC
O2e)
Energ
y S
avin
g (
TW
h)

Regional Policy Roadmap for harmonization of AC standards in ASEAN economies 39
5. National Assessment - Malaysia
Power Sector Profile
Natural gas, oil and coal are the main fuel sources for power in Malaysia. Over the years, the
indigenous gas production declined due to maturing fields whereas demand for the fuel is steadily
rising especially from industrial users. The Industrial sector was the main user of electricity in
Malaysia with a share of 45.9% of the total consumption in 2014. The residential and commercial
sectors contributed about 53.5% of the total energy demand in 2014; these two combined are the
largest contributors to energy demand and expected to continue to grow in the future based on the
current energy needs in Malaysia.
Figure 39: Share of total primary energy supply in 2012-Malaysia42
Figure 40: Electricity consumption by Sector in Malaysia43
42 http://meih.st.gov.my/statistic -Primary Energy Supply
43 http://meih.st.gov.my/statistic-Final Electricity Consumption
28.93
7.24
43.35
16.60
3.280.32 0.07 0.20 0.01
Percentage of Primary Energy Supply 2014
Crude Oil
Petroleum Products
Natural Gas
Coal and Coke
Hydropower
Biodiesel
Solar
Biomass
Biogas
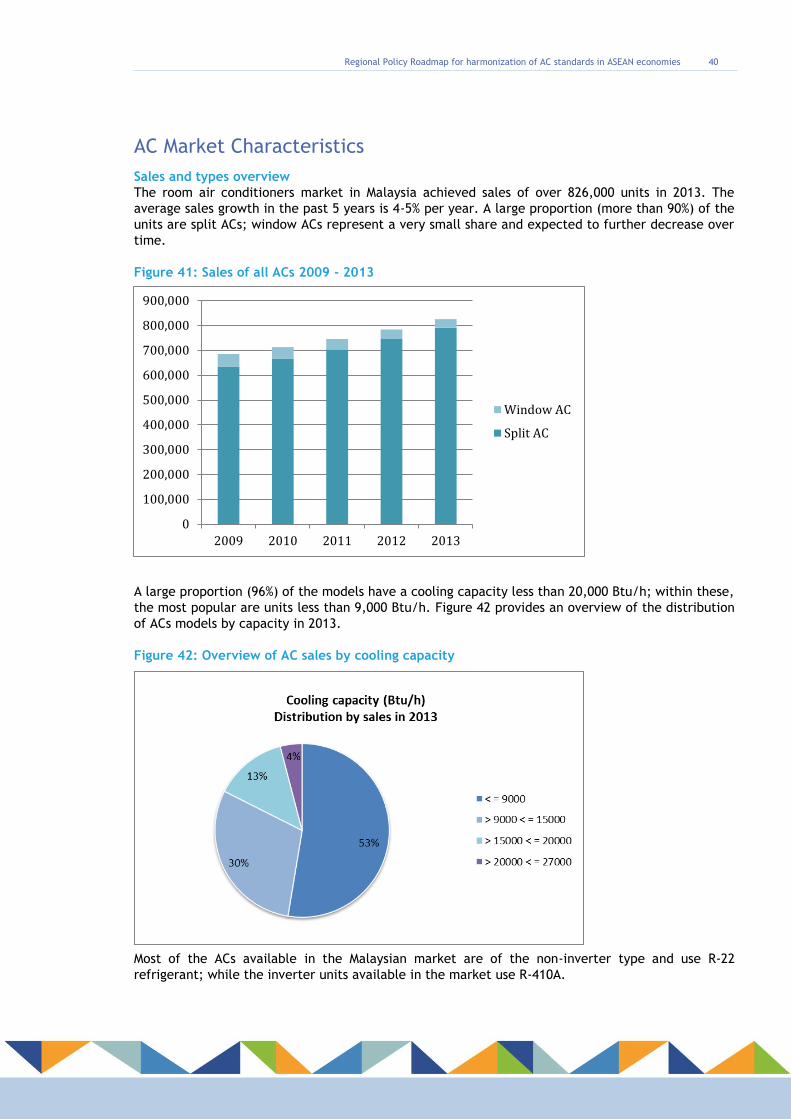
Regional Policy Roadmap for harmonization of AC standards in ASEAN economies 40
AC Market Characteristics
Sales and types overview
The room air conditioners market in Malaysia achieved sales of over 826,000 units in 2013. The
average sales growth in the past 5 years is 4-5% per year. A large proportion (more than 90%) of the
units are split ACs; window ACs represent a very small share and expected to further decrease over
time.
Figure 41: Sales of all ACs 2009 - 2013
A large proportion (96%) of the models have a cooling capacity less than 20,000 Btu/h; within these,
the most popular are units less than 9,000 Btu/h. Figure 42 provides an overview of the distribution
of ACs models by capacity in 2013.
Figure 42: Overview of AC sales by cooling capacity
Most of the ACs available in the Malaysian market are of the non-inverter type and use R-22
refrigerant; while the inverter units available in the market use R-410A.
0
100,000
200,000
300,000
400,000
500,000
600,000
700,000
800,000
900,000
2009 2010 2011 2012 2013
Window AC
Split AC

Regional Policy Roadmap for harmonization of AC standards in ASEAN economies 41
Figure 43 and 44 show the market shares of ACs by type and refrigerant used.
Figure 43: AC type distribution in 2013 Figure 44: Refrigerant type distribution in 2013
From the data available, 20% of ACs in Malaysia are manufactured domestically and 45% of the units
are imported, while the data did not specify the origin of almost 35% of the ACs. Amongst the
imported units, ACs are coming from China and other countries not specified.
Energy performance There was no performance data available before 2013. The efficiency of the best available model is for the cooling capacity range > 20000 < = 27000 with an EER of 16.30. The same category has the
least efficient model with an EER of 8.00.
Figure 45: EER (Btu/h/W) trend by cooling capacity in 2013
R-2279%
R-410A21%
Inverter21%
Non Inverter
79%
8.00
9.00
10.00
11.00
12.00
13.00
14.00
15.00
16.00
17.00
EE
R (
Btu
/h
/W
)
Cooling capacity (Btu/h)
Avg
Max
Min

Regional Policy Roadmap for harmonization of AC standards in ASEAN economies 42
Among all surveyed models, some smaller units appear to not satisfy the MEPS requirements as shown
in the figure below. There is also a wide range of efficiencies available for units < 20,000 Btu/h,
showing a large potential for improving efficiency with more stringent MEPS.
Figure 46: EER distribution of all surveyed models
Institutional and Regulatory Framework
National Energy Efficiency policies
The Government of Malaysia enacted the Electricity Supply Act in 1990 to promote the efficient use
of electricity, to formulate the standards, specifications, practices and measures for the efficient
use of electricity and to meet the requirements of efficient use of electricity for installation and
equipment.
Malaysia also enacted the Energy Commission Act in 2001, which was later amended in 2010. It had
provisions for establishing the Energy Commission (Suruhanjaya Tenaga-ST) with powers to regulate
the energy supply activities in Malaysia, and to enforce the energy supply laws, and for matters
connected therewith.
Malaysia has had Electricity Regulations since 1994 which were later amended in 2013 and
incorporated MEPS.
Organizations and responsibilities
The Ministry of Energy, Green Technology and Water (MEGTW) oversees energy efficiency policy
formulation. The Energy Commission (Suruhanjaya Tenaga-ST) is the implementation agency for
energy efficiency activities in Malaysia
7.0
8.0
9.0
10.0
11.0
12.0
13.0
14.0
15.0
16.0
17.0
0 10000 20000 30000 40000 50000 60000 70000
EER
(B
tu/h
/W)
Cooling capacity (Btu/h)
MEPS
2013

Regional Policy Roadmap for harmonization of AC standards in ASEAN economies 43
Department of Standards, Malaysia (DSM) under the Ministry of Science, Technology and Innovation
(MOSTI) is the national standard making agency in Malaysia. It is governed by the Standards of Malaysia
Act 1996 (Act 549) and is mandated to develop, promulgate and promote the use of Malaysian
Standards. DSM is responsible for the policy and strategy and it appoints SIRIM Berhad to undertake
the implementation at the technical level.
Standards and labels for ACs
MEPS
Malaysia has MEPS for air conditioners, refrigerators, televisions, fans and lighting products (TFL,
CFL, ballast and LED) under a mandatory regime; and a voluntary regime for high efficiency motors.
It is likely to be revised every 5 years.
MEPS for ACs were implemented with the following scope:
Cooling capacity less than or equal to 7,100 W (25,000 Btu/h)
Single-phase non-ducted single split wall mounted type vapor compression air conditioners
Labeling program and requirements
The labeling program uses comparative label. Products rated with 5 star is mandatory to fix STAR
rating label.
Television, fans, air conditioner and refrigerator are included in the Energy Commission (Suruhanjaya
Tenaga-ST) STAR labeling program. A label sample and labeling requirements are shown in Figure 47.
Figure 47: Sample of the comparative label
The table below specifies EER requirements for various categories of star rating.

Regional Policy Roadmap for harmonization of AC standards in ASEAN economies 44
Table 8: EER requirements for label classes
Star Rating Cooling capacity < 4.5kW,
15355 BTU/hr
AC > 4.5 to ≤ 7.1kW Watt,
15355 to ≤ 24226 BTU/Hr
5 ≥ 11.94 ≥ 10.71
4 11.16 – 11.93 9.83 – 10.70
3 10.37 – 11.15 8.94 – 9.82
2 9.56 - 10.3 8.03 - 8.93
1 9.00 - 9.55 7.50 - 8.02
The MEPS value has been revised, and appliances should have at least a 2 star rating.
Local testing capabilities
In order to join the program or sell the products, manufacturers must provide the test report from
an independent third party laboratory, which should be recognized by Department of Standards
Malaysia (DSM). Along with test report, manufacturers must register with the Energy Commission
(Suruhanjaya Tenaga-ST). Testing can be carried out by either balanced-type calorimeter or
psychrometric type.
SIRIM QAS International Sdn Bhd (SIRIM QAS) is a testing and certification body in Malaysia with
operational testing laboratories for the five appliances under MEPS, including ACs.
Department of Standards Malaysia (DSM) under the National Laboratory Accreditation Scheme (SAMM)
is the accreditation agency for test laboratories, which provides accreditation under the following
standards:
National standard- MS ISO/IEC 17025
International Standard- ISO/IEC 17025
These labs conduct AC testing under MS ISO 5151, Non-ducted air conditioners and heat pumps:
Testing and rating for performance, following both methods: balance calorimeter and psychrometric
(enthalpy).There is no information on the time required to complete and issue a test report.
Product testing can be done in any accredited national or regional testing laboratories recognized by
Department of Standards Malaysia (DSM). Foreign test reports are accepted as long as the test
laboratory is recognized by Department of Standards Malaysia (DSM) (a member of ILAC and APLAC).
Market surveillance mechanisms
There is a legal framework to act on non-compliance issues for the labeling program in Malaysia.
Under the Energy Commission Electricity (Amendment) Regulation 2013, regulation 109A, it states
that the Energy Commission may, from time to time, carry out market surveillance to determine if
the equipment referred to in the regulation is safe and affixed with an efficiency rating label. The
non-compliance and related issues are addressed by the regulation. In addition, the Energy
Commission is also responsible to ensure the compliance with safety requirements.
Verification of the product performance for the program is conducted by the government laboratory
SIRIM QAS International Sdn Bhd.

Regional Policy Roadmap for harmonization of AC standards in ASEAN economies 45
Assessment of energy savings potential
Base case and Policy case
According to the survey results, all ACs sold on the Malaysia market are single-phase. Small units with
less than 9000 Btu/h cooling capacity dominate the market, and thus are selected as the base case
cooling capacity. The rated power is 850W and the average EER is 10.6 Btu/h/W under this product
category. The best performing ACs have EER of 13.6.
Based on the market trend from 2009 to 2013, it is assumed that the AC market in Malaysia will grow
at an annual rate of 6% from 2013 to 2030.
Malaysia has a typical tropical climate, and its weather is hot all year-round. Its monthly mean
maximum temperature values ranged from 30.7oC to 34.1oC44. Therefore, it is assumed a year-round
AC operation of 365 days and 8 hours of AC usage per day.
The lifespan for ACs is expected to be 10 years based on values reported by other economies.
Results
Using the PPAT it is estimated that over 9.7 TWh of energy savings can be achieved in 2030 if the
best available technology in the current Malaysia market is adopted.
Figure 48: Energy Saving Potentials and CO2 Abatement for Air Conditioners in Malaysia in 2030
44 http://www.met.gov.my/index.php?option=com_content&task=view&id=846&Itemid=1586 [Date Accessed: 2014 Nov.
19th]
9.7 TWh
7.3 mtCO2e
0
1
2
3
4
5
6
7
8
0
2
4
6
8
10
12
Energy Savings CO2 Abatement
CO
2 A
bate
ment
(mtC
O2e)
Energ
y S
avin
g (
TW
h)

Regional Policy Roadmap for harmonization of AC standards in ASEAN economies 46
6. National assessment - Indonesia
Power sector profile
Indonesia is reorienting its energy production from primarily serving export markets to serve its
growing domestic consumption. It was the world's largest exporter of coal by weight in 2012 and the
fourth-largest exporter of liquid natural gas (LNG) in 2013. As Indonesia seeks to meet its energy
export obligations and earn revenues through international market sales, the country is also trying to
meet demand at home.
Indonesia's total primary energy consumption grew by 44% between 2002 and 2012. Overall, the
energy sector (including electricity) constituted 15.6% of Indonesia's GDP in 2012 and has held roughly
constant at this level since 2005.
Generation capacity growth in Indonesia has been lower than growth in electricity demand, leading
to power shortages and a low electrification ratio. Indonesia has the world's third-largest geothermal
electric capacity, although much of this resource potential is still undeveloped.45
The Indonesian government has set a national goal for electrification: 90% of households will have
electricity by 2020.
Figure 49: Share of total primary energy supply in 2012-Indonesia46
*Share of TPES excludes electricity trade
** In this graph, peat and oil shale are aggregated with coal, when relevant.
The total primary energy supply of Indonesia comes from multiple sources. The major share being oil, followed by biofuel/waste, natural gas and coal. Other sources include renewable energy such as geothermal, solar, wind and hydropower.
45 http://www.eia.gov/countries/cab.cfm?fips=id
46 http://www.iea.org/stats/WebGraphs/INDONESIA4.pdf

Regional Policy Roadmap for harmonization of AC standards in ASEAN economies 47
AC Market Characteristics
Sales and types overview
The room air conditioner market in Indonesia grew rapidly over the past few years. The annual sales
increased from 1.2 million units in 2009 to over 3 million units in 2013, with an average growth rate
of 24%.
Figure 50: Sales of all ACs 2009 – 2013 (1,000 units)
Almost all ACs sold in the Indonesian market have cooling capacities less than 20,000 Btu/h, which
correspond to single phase ACs. Smaller units with cooling capacities less than 11,000 Btu/h are the
most popular models which account for 78% of ACs sold in 2013. Figure 51 provides an overview of
the distribution of ACs sales by capacity in 2013.
Figure 51: Overview of AC sales by cooling capacity
-
500
1,000
1,500
2,000
2,500
3,000
3,500
2009 2010 2011 2012 2013
78%
12%
9%
1%
Cooing Capacity (Btu/h) Distribution by sales in 2013
< = 11000
>11000 < = 15000
> 15000 < = 20000
> 20000

Regional Policy Roadmap for harmonization of AC standards in ASEAN economies 48
The types of ACs available in the Indonesian market include wall mount (80%), floor standing/corner
type (7%) and cassette units (6%). A very small amount of window units are also available for sale.
Most of the ACs available in the Indonesian market are of the non-inverter type and use R-22
refrigerant; while the inverter units available in the market use R-410A. Non-inverter ACs are
currently dominating the Indonesian market with over 95% of market share in 2013. Figure 52 and 53
show the market shares of ACs by type and refrigerant used. It is reported that all units are imported.
Figure 52: AC type distribution in 2013 Figure 53: Refrigerant type distribution in 2013
Energy performance As per data available, only a very small sample size for EERs is reported (30 models). It was observed that EERs for smaller units with cooling capacities lower than 11,000 Btu/h were higher than other product capacities. The average EERs decrease with increasing cooling capacity in general. It has to be noted that only one model with cooling capacity higher than 20,000 was available and therefore no maximum and minimum EER data in that product category was reported. The efficiencies reported below should be considered as indicative values, as the sample size is very small and may not be representative of the market.
Figure 54: Average, Max and Min EER (Btu/h/W) by model in 2013
Inverter5%
non-inverter
95%
R2295%
R410A5%
0.00
2.00
4.00
6.00
8.00
10.00
12.00
14.00
16.00
18.00
< = 11000 >11000 < = 15000 > 15000 < = 20000 > 20000
Average Max Min

Regional Policy Roadmap for harmonization of AC standards in ASEAN economies 49
Only one manufacturer provided detailed data on cooling capacity and performance expressed in
EER. It was observed that all models reported satisfy the MEPS requirements (for non-inverters) as
shown in Figure 55.
Figure 55: EER distribution for all surveyed models
Institutional and Regulatory Framework
National Energy Efficiency policies
The government of Indonesia’s effort for energy conservation was initiated as early as 1982 when the
Presidential Instruction No. 9/1982 concerning Energy Conservation was issued. Since then, the
government of Indonesia passed a series of laws, act and regulations to promote energy conservation
and efficiency.
In 2007, the government passed the Law No. 30 / 2007 Concerning Energy, in which the utilization of
new renewable energy and energy efficiencies by the national and regional governments was set as
top priority and incentives were given to promote energy efficiencies and renewable energy. The
National Energy Council was established and the National Energy Plan and Regional Energy Plan were
also developed.
A more detailed Government Regulation No. 70 / 2009 on Energy Conservation was issued in 2009.
The regulation clearly indicated that the national government, regional governments, private sectors
and society in general were all responsible for energy conservation. The regulation stipulated the
implementation of energy conservation and energy efficiency, the implementation of standards and
labeling, and the facilitation of incentive measures for efficient products, such as tax reduction or
duty reduction.
The laws and regulations established the legal basis for Indonesian government’s standards and
labeling program for energy efficient appliances. The first energy label program for CFLs was
mandated by the Regulation of the Minister of Energy and Mineral Resources No. 18 Year 2014 on
Label Affixing Signs Save Energy for ballast lamp. Indonesian National Standards (SNI) for energy
performance are already in place for refrigerators and air conditioners, whereas their labeling scheme
is at the draft stage SNI and labeling scheme for electric fans, rice cooker, electronic ballasts and
6
7
8
9
10
11
12
13
14
15
16
17
0 5000 10000 15000 20000 25000 30000
EE
R (
Btu
/h
/W
)
Cooling capacity (Btu/h)
MEPS
2013

Regional Policy Roadmap for harmonization of AC standards in ASEAN economies 50
electric motors are still in draft or preparation phase at the moment. TV, washing machines and
electric iron are also target product groups for MEPS and labeling.
Organizations and responsibilities
At the highest level, the National Energy Board (DEN), which is chaired by the President of Indonesia,
is responsible for designing and formulating national energy policies. The implementation of energy
policies is left to each ministry in accordance with their duties and functions.
The Ministry of Energy and Mineral Resources is responsible for the energy efficiency labeling
program. The ministry is divided into: (a) The Directorate General of Oil and Gas; (b) The Directorate
General of Electricity; (c) Directorate General of Coal and Minerals; and (d) Directorate General of
New Renewable Energy and Energy Conservation. The Directorate General of New Renewable Energy
and Energy Conservation is responsible for energy efficiency related policies.
The Ministry of Trade is responsible for the monitoring of product distribution in the market and the
Ministry of Industry is responsible for the SNI label to certify safety, which must be obtained before
the product is eligible for the energy efficiency label.
Standards and labels for ACs
MEPS
MEPS for AC will be published by Indonesian government in the near future. However, the mandatory
MEPS is already being implemented unofficially since there is an informal agreement between the
industry/importers and regulator to carry out a voluntary labeling program, and mandatory MEPS.
The MEPS levels are set as shown in Table 9:
Table 9: Indonesian MEPS for AC47
EER/COP
Inverter 9.01/2.64
Non – Inverter 8.53/2.50
The MEPS is also intended to serve as the baseline for further efficiency improvement. A road map
for improvement indicated that an increment of 0.2 in COP should be made every time levels are
revised.
Labeling program and requirements
Indonesia is currently running a voluntary labeling program which aims to introduce energy-saving
rates as a guide for consumers. The comparative label features a four-star system where one star
represents the lowest efficiency and four stars represent the highest efficiency. The label also
employs a key message of “more star, more efficient”. A label sample and labeling requirements are
shown in Figure 56 and Table 10.
In order to use the energy labels, the manufacturer sends the product samples to a government
assigned certifying body to ensure the products are tested by an independent and accredited test
laboratory. Certificate is issued to products which meet the star rating requirements48.
47 Maritje Hutapea. (2014). Market Transformation towards Energy Efficient Air Condition in Indonesia. Presented at Asia
Clean Energy Forum, 19th June 2014.
48 Mark Ellis & Associates. (2011). Survey of Market Compliance Mechanisms for Energy Efficiency Programs in APEC
economies.

Regional Policy Roadmap for harmonization of AC standards in ASEAN economies 51
Table 10: Voluntary Star label requirements47
Star Rating Inverter Non-inverter
1-Star 9.01 ≤ EER <9.96 8.53 ≤ EER<9.01
2-Stars 9.96 ≤ EER<11.40 9.01 ≤ EER<9.96
3-Stars 11.40 ≤ EER<12.83 9.96 ≤ EER<10.41
4-Stars 12.83 ≤ EER 10.41 ≤ EER
Figure 56: Sample of the comparative label
Local testing capabilities
There are limited testing capabilities in Indonesia for AC energy efficiencies. A total of three
laboratories are available in Indonesia: one is government-owned and two are third-party owned. The
government-owned laboratory is under the Center for Material and Technical Products which is under
the Ministry of Industry. The other two laboratories are from Indonesian Institute of Science, and
Succofindo, a large-scale Indonesia corporate engaged in the inspection, monitoring, testing, and
assessment.
The testing facilities are accredited by the National Accreditation Committee and Indonesian National
Standards following ISO 17025 and ISO 5151.
Market surveillance mechanisms
The overall market surveillance mechanisms are based on the following laws and regulations:
Law No. 8 Year 1999 on Consumer Protection
Government Regulation No. 58 Year 2001 on Guidance and Supervision of Consumer Protection
Ministerial Regulation No. 20 Year 2009 on Terms and Procedures for Control of Goods
Almost all ACs sold on Indonesian market are imported, thus customs inspection is an integral part of
the overall market surveillance mechanism. Document inspection and physical inspection are carried
out by Customs when the product is being imported. The documents related to compliance such as
importer's identity, fulfillment obligation documents, prohibition/restriction of the relevant
technical agencies, customs duties and taxes on import, are examined by Customs. Physical
examination is done selectively based on importer profile or product profiles. Product labeling can
also be proved through physical inspection, if label is required to be affixed to the products from the
exporting country.
Market surveillance is conducted based on the authority possessed by the State agency or the Ministry
or the non-ministry government institutions technical units. The Ministry of Commerce is one of the
government agencies conducting market surveillance for existing items in the market. The frequency
of market surveillance varies depending on the available budget at the Ministry of Commerce in

Regional Policy Roadmap for harmonization of AC standards in ASEAN economies 52
central, provincial and city governments. The market supervision is carried out by the Goods and
Services Supervisory Officer and Civil Servant Investigators of Consumer Protection. There are
normally two types of supervision:
1. Periodic supervision monitoring, which is conducted based on the priority of goods and/or services
to be monitored according to the program,
2. Special supervision, which is carried out at any time based on the finding of a violation indication,
consumer complaint or public report by Institute of Societal Consumer Protection (LPKSM) or
follow-up of the results of periodic supervision or information.
Ministerial Regulation of Trade No. 20 of 2009 On Terms and Procedures of Controlling Goods and/or
Services laid out the monitoring and verification systems. The Director-General of New, Renewable
Energy and Energy Conservation, under Ministry of Trade, is responsible for check testing and
verification. Samples are randomly selected from the market by the Products and Services Supervisory
Officer, and delivered to an accredited laboratory by National Accreditation Commission. Check
testing and verification can be carried out periodically but the frequency depends on the budget and
should not exceed once every three months. Check testing and verification can also be carried out at
the request of producers or if there is suspicion of non-compliance of a particular product.
An enforcement system is also in place in Indonesia, with Law No. 8 Year 1999 on Consumer
Protection, Government Regulation No. 58 Year 2001 on Guidance and Supervision of Consumer
Protection, and Ministerial Regulation No. 20 Year 2009 on Terms and Procedures for Control of Goods
and/or Services. The Directorate General of Customs and Excise (DGCE) is responsible for ensuring
that all products entering the country meet regulations and requirement (such as labeling).
Once the products are distributed to the market, it is the responsibility of Supervisory officers and
Investigator officers of the technical office of the Ministry of Commerce, and the Police department
to enforce the regulations. Law No. 8 of 1999 on Consumer Protection stipulates that domestic
manufacturers or importers who committed any offense referred to by the law shall be liable for
prosecution in accordance with the provisions of the legislation.
The current AC labels are voluntary so the manufacturers or importers do not have the obligation to
label their products. However, the voluntary labeling program may become mandatory, similar to the
CFL labeling scheme (already mandatory). Therefore, similar punitive actions towards non-
compliance of CFL labeling may be used for ACs and other products. For CFL products without
mandatory energy labels, the following actions are taken:
Products withdrawn from circulation with no efficient energy label;
Importer is obliged to re-export or destroy imported ballast lamps bearing no efficient energy
label at their own cost.
In case of fraudulent use of misuse of labels, a written warning is issued to the manufacturer or
importer three times in a warning period of at least three months. If the manufacturer or importer
fails to respond to the written warnings before the expiration date, the Director-General imposes
sanctions such as license revocation of efficient energy label and reports filed to the Police
department.
In terms of import customs compliance obligations using false documents (labels/false
recommendation) may be subject to criminal falsification of import documents under Article 103,
Law on Customs. Legal action is limited to the subject of the document forger/labels for import
compliance obligations (relating to Customs and Excise, among others, transporters, importers or
their proxies).

Regional Policy Roadmap for harmonization of AC standards in ASEAN economies 53
Assessment of energy savings potential
Base case and Policy case
According to the survey results, most ACs sold in Indonesia are single-phase. Small units with less
than 11,000 Btu/h cooling capacity dominate the market, and thus a 9,000 Btu/h unit is selected as
the base case cooling capacity. The rated power is 800W and the average EER is 11.3 Btu/h/W under
this product category. The best performing ACs have EER of 16.1.
Based on the market trend from 2009 to 2013 and third-party market data, it is assumed that the AC
market in Indonesia will grow at an annual rate of 17% until 2015 and 13% from 2016 to 2030.
Indonesia has a typical tropical climate, and its weather is hot all year-round. Average temperatures
vary from 23ºC to 28 ºC depending on the region, and temperature varies little from season to season.
Therefore, it is assumed a year-round AC operation of 365 days and 8 hours of AC usage per day.
Manufacturers in Indonesia also reported similar yearly usage.
The lifespan for ACs is expected to be 10 years based on values reported by other economies.
Results
Using the PPAT it is estimated that over 51.7 TWh of energy savings can be achieved in 2030 if the
best available technology on the current market is adopted.
Figure 57: Energy Saving Potentials and CO2 Abatement for Air Conditioners in Indonesia in
2030
51.7 TWh
35.1 mt CO2e
0
10
20
30
40
50
60
Energy savings CO2 abatement

Regional Policy Roadmap for harmonization of AC standards in ASEAN economies 54
7. National assessment - Brunei Darussalam
Power sector profile
Brunei Darussalam is one of the few economies in ASEAN that is self-sufficient when it comes to
energy. The economy is blessed with an abundance of oil and gas resources, and some potential of
renewable energy sources such as solar. With a small population, the overall total energy consumption
constitutes a small share of energy production and the economy is able to export the bulk of its
resources and generate revenue49. Based on APERC’s projections in the APEC Energy Demand and
Supply Outlook 5th Edition, Brunei Darussalam is likely to remain an energy exporter beyond the year
2035. The revenue from energy sector accounts for more than 60 percent of Brunei Darussalam's Gross
Domestic Product50.
Figure 58: Share of total primary energy supply in 2012-Brunei51
The residential and commercial sectors account for the largest energy demand. As a result, in the past few years efforts towards saving energy in these sectors have been initiated. Measures include applying “smart” tariffs in the residential sector, an initiative launched in January 2012, and using high-energy efficiency technologies in buildings like air-conditioners with ‘inverter’ technology, chillers, lighting equipment (i.e., compact fluorescent lamps, LEDs), and lighting system controls, among others.
Figure 59: Average electricity consumption by Sector in Brunei Darussalam
49 http://www.ewg.apec.org/documents/EWG46.PEER%20Review%20Brunei%20Darussalam%20Final%20Report.pdf
50 https://www.usasean.org/sites/default/files/uploads/Energy%20White%20Paper%202014.pdf
51 http://www.iea.org/stats/WebGraphs/BRUNEI4.pdf
39%
27%
18%
16% Residential
Commercial & LightIndustry
Government
Industry Sector

Regional Policy Roadmap for harmonization of AC standards in ASEAN economies 55
Air conditioning is the leading end-use of electricity in Brunei, accounting for almost 60% of electricity consumption in buildings. This is prevalent in almost all homes, government and commercial buildings in Brunei Darussalam.
AC Market Characteristics
Sales and types overview The AC market in Brunei is fairly small. Annual sales of AC in Brunei fluctuated between 9,600 and 8,600 units from 2009 to 2013. Most of the ACs on the Brunei market were split units and only a small fraction are window units.
Figure 60: AC sales in Brunei (modelled)52
Institutional and Regulatory Framework
National Energy Efficiency policies In 2005, Brunei Darussalam released an overall energy efficiency goal to reduce energy intensity by 25% by 2030. This was part of the Energy Efficiency and Conservation Strategic Plan, which includes the planned introduction of energy efficiency labeling for electrical equipment and appliances. The Energy Efficiency and Conservation Act is under development. Air conditioners and lighting are under consideration for labeling, with plans to expand to other electrical appliances and equipment in the future.
52 Source: Euromonitor.
8.6 8.1 8.47.7 7.9
1.00.9 0.8
0.7 0.7
0.0
2.0
4.0
6.0
8.0
10.0
12.0
2009 2010 2011 2012 2013
Sale
s ('
00
0 U
nit
s)
Split Window

Regional Policy Roadmap for harmonization of AC standards in ASEAN economies 56
Organizations and responsibilities
Figure 61: Brunei Energy Efficiency S&L structure
The Energy Department, created in 2005, is under the purview of the Minister of Energy at the Prime
Minister’s Office and is the implementing agency for standards and labeling scheme in Brunei. Under
the EDPMO, the Energy Efficiency & Conservation (EEC) Unit was established. The EEC Unit takes the
coordination lead among government agencies in all topics related to energy efficiency and
conservation (EEC), in implementing EEC measures including the National Standards and Labeling
initiative, the Building Code initiative, the Electricity Tariff Reforms and EEC Awareness Raising
amongst others.

Regional Policy Roadmap for harmonization of AC standards in ASEAN economies 57
Standards and labels for ACs
MEPS
Brunei does not have MEPS for room air conditioners.
Labeling program and requirements
The comparative labeling program is under development with ratings from 1 to 5 star. One star being
the least efficient and five the most. The program would include non-inverter type and single phase
ACs.
There is no information on the test standard to be adopted under the labeling program.
Table 11: Labeling requirements
Stars Energy efficiency
rating
Minimum EER w/w for window/
single split (non-inverter)
1 Low < 2.5
2 Fair ≥ 2.5
3 Good ≥ 2.78
4 Very Good ≥ 3.2
5 Excellent N/A
Figure 62: Sample of the comparative label53
53 http://www.erc.or.th/ERCWeb/Upload/Document/09.20-10.30%201Cheng%20Guan%20Lim(Brunei%20Darussalam)-edit.pdf

Regional Policy Roadmap for harmonization of AC standards in ASEAN economies 58
8. National assessment - Cambodia
Power sector profile
In Cambodia, less than 15% of households have access to electricity (urban 53.6%, rural 8.6%). The
share of electricity consumption among various sectors is as follows: residential 36%, industry 24%,
administration, public buildings and others 40%54. The supply requirements are projected to increase
in average by 12.1% per year, and the peak load is expected to reach up to 1,000 MW in 2020. The total primary energy of Cambodia comes from various sources. Biofuel/waste accounts for a major share, followed by oil. Coal and hydropower constitute approx. 1 % of supply.
Figure 63: Share of total primary energy supply in 2012-Cambodia55
*Share of TPES excludes electricity trade ** In this graph, peat and oil shale are aggregated with coal, when relevant.
AC Market Characteristics
Sales and types overview Although the AC market in Cambodia has grown consistently from 2009 to 2013, the market is still very small. The annual sales of AC in Cambodia were only 1,000 units in 2013. No window units were available in Cambodia.
54 http://cambodia.usembassy.gov/media2/pdf/energy_sector_in_cambodia.pdf
55 http://www.iea.org/stats/WebGraphs/CAMBODIA4.pdf

Regional Policy Roadmap for harmonization of AC standards in ASEAN economies 59
Figure 64: AC sales in Cambodia (modelled)56
Institutional and Regulatory Framework
National Energy Efficiency policies
Currently, there is no law or Act for energy efficiency and conservation in Cambodia. However,
Cambodia has a National Energy Efficiency Policy, Strategy and Action Plan.
Organizations and responsibilities
The Department of Energy Technique (DET) of the Ministry of Industry, Mines and Energy (MIME)
collaborates with Climate Change Department (CCD) to translate energy efficiency labels for selected
electric appliances sold in the market.
Standards and labels for ACs No energy efficiency standards or labels for air conditioners currently exist in Cambodia.
56 Source: Euromonitor.
0.50.6
0.80.9
1.0
0.0
0.2
0.4
0.6
0.8
1.0
1.2
2009 2010 2011 2012 2013
Sale
s ('
00
0 U
nit
s)

Regional Policy Roadmap for harmonization of AC standards in ASEAN economies 60
9. National assessment - Lao People’s
Democratic Republic
Power sector profile
Lao’s government’s Seventh Five-Year National Socio-Economic Development Plan (NSEDP), 2011–
2015 identifies the energy sector as a strategic development factor, both for the short and longer
terms. The primary energy source in the Lao PDR, as in many developing countries in the region, is
biomass. However, in terms of final energy use, biomass accounts for less than 60%, petroleum
products account for about 17%, electricity for 12%, and charcoal and coal for 14%.
Figure 65: Average electricity consumption by Sector in Lao PDR57
Domestic demand for electricity is expected to increase rapidly by 15%-18% annually, reflecting the
government’s policy to accelerate rural electrification and industrial development. Currently,
electricity consumption in the Lao PDR is very low. The government’s rural electrification program is
targeting provision of electricity services to 90% of households by 202058.
57 http://www.gms-eoc.org/uploads/resources/303/attachment/ADB%20lao%20pdr%20energy%20assessment%202013.pdf
58 http://www.gms-eoc.org/uploads/resources/303/attachment/ADB%20lao%20pdr%20energy%20assessment%202013.pdf
54%
22%
14%
10%
Residential Transport Commercial Industrial and agricultural

Regional Policy Roadmap for harmonization of AC standards in ASEAN economies 61
AC Market Characteristics
Sales and types overview As Cambodia, the AC market in Laos is very small, with annual sales of less than 700 units from 2009 to 2013. Most of the ACs were split units while a small proportion are window units.
Figure 66: AC sales in Laos (modelled)59
Institutional and Regulatory Framework
National Energy Efficiency policies
Currently, there is no National Strategy and Policy, legislation, regulation or guideline for the
promotion of Energy Efficiency and Conservation (EEC) in Lao PDR. Formulation of a national energy
policy is a priority for the Ministry of Energy and Mines (MEM). With a national energy policy
framework, the MEM will be better placed to undertake its responsibilities for energy planning and
strategic guidance.
Organizations and responsibilities
In Lao PDR, the energy-related ministries have been integrated into the Ministry of Energy and Mines
(MEM). The MEM is responsible for energy policy and overall strategic guidance, as well as
management of sector development. With the creation of the Institute of Renewable Energy and
Promotion (IREP) and Department of Energy Management (DEM) under the Ministry of Energy and
Mines, EEC initiatives are now more coordinated. The IREP is preparing a national EEC strategy and
draft EEC laws and regulations. The DEM is preparing requirements concerning monitoring of energy
use and labeling for appliances.
Standards and labels for ACs
No energy efficiency standards currently exist in Lao PDR.
59 Source: Euromonitor.
0.2
0.4
0.6 0.6 0.60.2
0.1
0.1 0.1 0.1
0.0
0.1
0.2
0.3
0.4
0.5
0.6
0.7
0.8
2009 2010 2011 2012 2013
Sale
s ('
00
0 U
nit
s)
Split Window

Regional Policy Roadmap for harmonization of AC standards in ASEAN economies 62
10. National assessment - Myanmar
Power sector profile
Myanmar has abundant energy resources, particularly hydropower and natural gas and is one of the
five major energy exporters in the region, particularly of natural gas. The country’s primary energy
supply includes biofuel, oil, gas, hydropower, and coal. Investment in hydropower and coal-powered
plants, gas fields, and oil and gas pipelines is gaining rapidly, evidence of a highly dynamic sector60.
Presently, only 30% of Myanmar’s population has access to electricity (with that percentage
decreasing to around 6% in rural areas). Power cuts and brown outs are a feature of daily life. The
power sector is therefore a top priority for the government.61 Myanmar allows power producers to
export the bulk of the power produced domestically to neighboring countries, despite its own unmet
demand.62 The Myanmar government is broadening its strategic approach to fully tap the large
potential of Myanmar’s energy sector by inviting foreign technical expertise and foreign investment
for participation in its hydropower, oil, and gas subsectors; expanding the capacity of existing
liquefied petroleum gas plants and implementing new liquefied natural and petroleum gas production
projects; and substituting the use of liquid fuel in the transport sector with compressed natural gas.63
Figure 67: Share of total primary energy supply in 2012-Myanmar64
*Share of TPES excludes electricity trade
** In this graph, peat and oil shale are aggregated with coal, when relevant
60 http://www.myanmarenergyinvestmentsummit.com/
61 http://www.mayerbrown.com/files/uploads/Documents/PDFs/2014/May/140527-Newsletter-Energy-
Review.PDF#page%3D15
62 http://breakingenergy.com/2014/03/27/powering-myanmar-fdi-geopolitics-and-the-appetite-for-risk/
63 http://www.myanmarenergyinvestmentsummit.com/
64 http://www.iea.org/stats/WebGraphs/MYANMAR4.pdf

Regional Policy Roadmap for harmonization of AC standards in ASEAN economies 63
AC Market Characteristics
Sales and types overview Myanmar AC market expanded steadily over the past five years, with an approximate average annual growth rate of 10%. The annual sales increased from 8,600 units in 2009 to 12,800 units in 2013. All ACs on Myanmar market were split units and no window units were available.
Figure 68: AC sales in Myanmar (modelled)65
Institutional and Regulatory Framework
National Energy Efficiency policies
There is no law on energy efficiency or conservation. Myanmar is currently preparing its Energy
Efficiency and conservation master plan66. Myanmar is at the very beginning of the process aimed at
introducing appliances and equipment standards and labeling.
Organizations and responsibilities
The focal point for all matters of energy conservation is the Ministry of Energy.
Standards and labels for ACs
No energy efficiency standards currently exist in Myanmar.
65 Source: Euromonitor.
66 http://eeasia.unescap.org/PDFs/Assessment-Report.pdf
8.69.4
10.211.3
12.8
0.0
2.0
4.0
6.0
8.0
10.0
12.0
14.0
2009 2010 2011 2012 2013
Sale
s ('
00
0 U
nit
s)
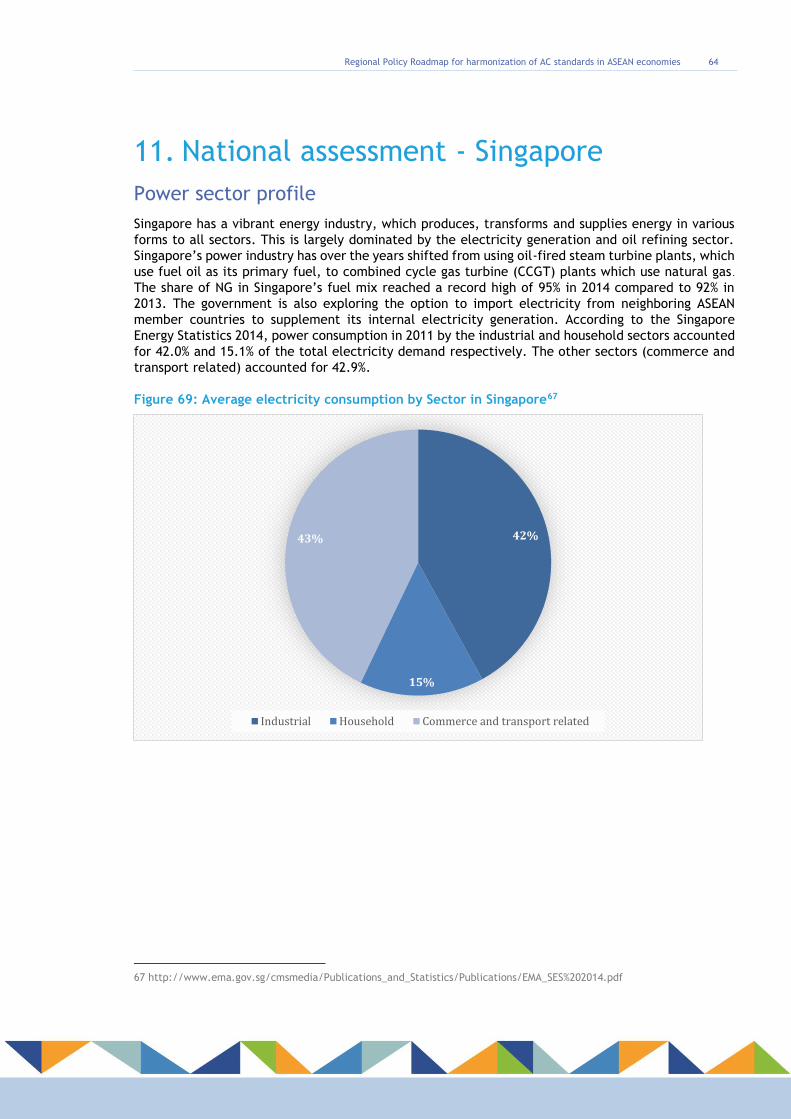
Regional Policy Roadmap for harmonization of AC standards in ASEAN economies 64
11. National assessment - Singapore
Power sector profile
Singapore has a vibrant energy industry, which produces, transforms and supplies energy in various
forms to all sectors. This is largely dominated by the electricity generation and oil refining sector.
Singapore’s power industry has over the years shifted from using oil-fired steam turbine plants, which
use fuel oil as its primary fuel, to combined cycle gas turbine (CCGT) plants which use natural gas .
The share of NG in Singapore’s fuel mix reached a record high of 95% in 2014 compared to 92% in
2013. The government is also exploring the option to import electricity from neighboring ASEAN
member countries to supplement its internal electricity generation. According to the Singapore
Energy Statistics 2014, power consumption in 2011 by the industrial and household sectors accounted
for 42.0% and 15.1% of the total electricity demand respectively. The other sectors (commerce and
transport related) accounted for 42.9%.
Figure 69: Average electricity consumption by Sector in Singapore67
67 http://www.ema.gov.sg/cmsmedia/Publications_and_Statistics/Publications/EMA_SES%202014.pdf
42%
15%
43%
Industrial Household Commerce and transport related

Regional Policy Roadmap for harmonization of AC standards in ASEAN economies 65
AC Market Characteristics
Sales and types overview Singapore has a fairly sizable AC market with annual sales of 174,000 units in 2013. The market appears to be mature with a steady sales growth rate of 1~2% per year from 2009 to 2013. The majority of ACs in the market were split units, accounting for approximately 90% of the market. Window units accounted for the other 10% of the market.
Figure 70: AC sales in Singapore68
A large proportion of reported sales in Singapore in 2013 were in the range of 5.5 to 7.5kW as can be seen in Figure 71. Smaller capacities had a market share of 34%, and larger models (>7.5kW) corresponded to 15% of total sales.
Figure 71: Overview of AC sales by cooling capacity
68 Source: Euromonitor.
143.2 146.1 149.3 152.3 156.3
21.9 20.4 19.4 18.2 17.7
0
25
50
75
100
125
150
175
200
2009 2010 2011 2012 2013
Sale
s ('
00
0 U
nit
s)
Split Window
13%
21%
51%
13%
2%
Cooling capacity (in kW) Distribution by sales in 2013
< = 3.5
> 3.5 < = 5.5
> 5.5 < = 7.5
> 7.5 < = 9.5
> 9.5 < = 15.5

Regional Policy Roadmap for harmonization of AC standards in ASEAN economies 66
Types of ACs available in Singapore include casement ACs (1%), window ACs (5%), single split non-inverter ACs (10%) and single split inverter ACs (84%). Most of the ACs available in the Singapore market are of the inverter type and use R-410A as a refrigerant. Figure 73 and 74 show the market shares of ACs by type and refrigerant used.
Figure 73: Refrigerant type distribution in
2013
Energy Performance
The average performance of ACs available in Singapore has improved slightly from 2011 to 2013, as
can be seen in Figure 74. The most efficient models correspond to a large size category (7.5 –
9.5kW), contrary to what is found in other markets where smaller sizes tend to have better
performances. Figure 75 and
Figure 76 also show the maximum and minimum coefficient of performance (COP) of available models by cooling capacity.
Figure 74: Average COP weighted by sales volumes of individual models, by cooling capacity
(kW)
R-228%
R-410A92%
Inverter84%
Non-inverter
15%
Figure 72: AC type distribution in 2013

Regional Policy Roadmap for harmonization of AC standards in ASEAN economies 67
Figure 75: Maximum COP by cooling capacity (kW)
3.50
3.70
3.90
4.10
4.30
4.50
4.70
4.90
201320122011
< = 3.5
> 3.5 < = 5.5
> 5.5 < = 7.5
> 7.5 < = 9.5
> 9.5 < = 15.5
4.50
4.70
4.90
5.10
5.30
5.50
5.70
5.90
201320122011
< = 3.5
> 3.5 < = 5.5
> 5.5 < = 7.5
> 7.5 < = 9.5
> 9.5 < = 15.5

Regional Policy Roadmap for harmonization of AC standards in ASEAN economies 68
Figure 76: Minimum COP by cooling capacity (kW)
Figure 77 shows reported COP values of models available for sale in Singapore vs. the MEPS level for single split non-inverter ACs. Models below the MEPS level correspond to casement and window units which are allowed a lower MEPS of 2.9. Some inverter units appear to be also below the MEPS level; this is due to the fact that plotted values correspond to the COP at full load (lower than the weighted COP for inverter units).
Figure 77: COP distribution of all available models
2.40
2.50
2.60
2.70
2.80
2.90
3.00
201320122011
< = 3.5
> 3.5 < = 5.5
> 5.5 < = 7.5
> 7.5 < = 9.5
> 9.5 < = 15.5
0.0
1.0
2.0
3.0
4.0
5.0
6.0
7.0
0 2 4 6 8 10 12 14 16
CO
P
Cooling capacity (kW)
MEPS (single split-noninverter)
Single Split Inverter AC
Single Split Non InverterAC
Window AC
Casement AC

Regional Policy Roadmap for harmonization of AC standards in ASEAN economies 69
Institutional and Regulatory Framework
National Energy Efficiency policies
When Singapore planned to introduce mandatory S&L in 2007, it expanded the existing
‘Environmental Protection and Management Act’ by including a division on energy conservation and
setting a regulation to define the scope of regulated goods. Over time, Singapore gradually enriched
its EEC policy portfolio and in 2012 put together all EE regulations, including S&L regulations, into a
comprehensive EEC legal framework, called the Energy Conservation Act69. One of the major
objectives of the Act is to help Singapore achieve the target of a 35% improvement in energy intensity
by 2030, from 2005 levels and to ensure a coordinated approach to standards setting for energy
efficiency across all sectors.
Organizations and responsibilities
Singapore has mandatory energy performance standards, mandatory comparative labeling and
voluntary endorsement labeling for a number of products.
The National Environment Agency is the implementing agency for MEPS and comparative labeling
while voluntary endorsement labeling is implemented by Singapore Environment Council (SEC).
Standards and labels for ACs
MEPS
The mandatory Energy Performance Standards program came into effect in 2011, with three products
initially being covered – room air conditioners, refrigerators, and refrigerator/freezers. The program
was extended to clothes dryers in April 2014. There are plans to widen the coverage of the program
to include products such as incandescent lamps, self-ballasted compact fluorescent lamps and LED
lamps in the future. Singapore has the highest MEPS in comparison with the other countries in the
ASEAN region.
In order to join the program, a test report must be provided by the manufacturer, with each model
or family of models required to undertake a registration process.
Test standard for air conditioner are ISO 5151:2010 for casement, window and single-split, ISO 15042:
2011 for multi split and IEC: 62301 for all ACs for standby power. All tests are carried out at 230V AC.
Testing is performed by both calorimeter and enthalpy method.
Table 12: MEPS Requirements
Type of room air conditioners Cooling Capacity * Minimum Coefficient of Performance (COP)
Casement and Window Up to 8.8 kW 2.90 W/W
(9.9 Btu/hr/W)
Single Split Inverter
< 10 kW Weighted COP2 3.34 and COP100% 3.06
≥ 10 kW Weighted COP2 2.78
69 http://www.nea.gov.sg/energy-waste/energy-efficiency/household-sector/about-mandatory-energy-labelling

Regional Policy Roadmap for harmonization of AC standards in ASEAN economies 70
Single Split Non-inverter < 10 kW COP100% 3.34
≥ 10 kW COP100% 2.78
Multi Split Inverter < 10 kW Weighted COP2 3.34 and COP100% 3.06
≥ 10 kW Weighted COP2 2.64
Multi Split Non-Inverter < 10 kW COP100% 3.34
≥ 10 kW COP100% 2.64
* Cooling capacity refers to the measured total cooling capacity in accordance with the applicable test
standards.
** 2 Weighted COP = 0.4 x COP100% + 0.6 x COP50%
Labeling program and requirements
Comparative Labeling
The Mandatory Energy Labeling Scheme was launched in 2008. The appliances under the labeling
program include refrigerators, refrigerators/freezers, room air conditioners, clothes dryers and
televisions. The energy label and rating system for refrigerators, refrigerators/freezers, room air
conditioners and clothes dryers were revised on 1 September 2014. The label for television was
launched on 1 April 2014.
The comparative labeling program is based on ticks with ticks ranging from 1 to 5 (low efficiency to
high efficiency).
In order to join the program, a test report must be provided. NEA recognizes following test reports:
Testing laboratories that are accredited by the Singapore Accreditation Council (SAC) to carry out
the tests in accordance with the applicable test standards;
Testing laboratories in countries other than Singapore that are accredited by their local
accreditation bodies, which have signed a Mutual Recognition Arrangement (MRA) with the SAC,
to carry out the tests in accordance with the applicable test standards; or
Manufacturer's in-house testing laboratories.
Registered suppliers selling registrable products into the market must affix the energy label on the
units they supply to Singapore. The energy label shall be affixed only after the NEA has issued the
Certificate of Registration (COR) for the model. Retailers are only allowed to display models that
have the label affixed on them.
Table 13: Labeling requirements

Regional Policy Roadmap for harmonization of AC standards in ASEAN economies 71
Type Capacity
(kW)
COP (W/W) and Standby Power
1 tick 2 ticks 3 ticks 4 ticks 5 ticks
Casement and
Window
8.8 or lower 2.90 ≤
COP100%1 <
3.78
3.78 ≤
COP100% <
4.29
4.29 ≤
COP100% <
4.86
COP100% ≥
4.86
COP100% ≥
5.50 and
Standby
power5 ≤ 4
Single-Split
(non-inverter)
Less than 10 3.34 ≤
COP100% <
3.78
3.78 ≤
COP100% <
4.29
4.29 ≤
COP100% <
4.86
COP100% ≥
4.86
COP100% ≥
5.50
and Standby
power ≤ 4 10 or more 2.78 ≤
COP100% <
3.78
Multi-Split
(non-inverter)
Less than 10 3.34 ≤
COP100% <
3.78
3.78 ≤
COP100% <
4.29
4.29 ≤
COP100% <
4.86
COP100% ≥
4.86
COP100% ≥
5.50 and
Standby
power ≤ 9 x
N4
10 or more 2.64 ≤
COP100% <
3.78
Single-split
(inverter)2
COP100%
Weighted
COP3
Less than 10 Weighted
COP ≥ 3.34
and COP100% ≥
3.06
Weighted
COP ≥ 3.78
and COP100%≥
3.34
Weighted
COP ≥ 4.29
and
COP100% ≥
3.78
Weighted
COP ≥ 4.86
and
COP100% ≥
4.29
Weighted
COP ≥ 5.50,
COP100% ≥
4.86 and
Standby
power ≤ 4
10 or more Weighted
COP ≥ 2.78
Multi-split
(inverter)2
COP100%
Weighted COP3
Less than 10 Weighted
COP ≥ 3.34
and COP100% ≥
3.06
Weighted
COP ≥ 3.78
and COP100%≥
3.34
Weighted
COP ≥ 4.29
and
COP100% ≥
3.78
Weighted
COP ≥ 4.86
and
COP100% ≥
4.29
Weighted
COP ≥ 5.50,
COP100% ≥
4.86 and
Standby
power ≤ 9 x
N 10 or more Weighted
COP ≥ 2.64
1COP100% is defined as the ratio of total cooling capacity to effective power input at full load cooling capacity 2For split (inverter) type air-conditioners, the model shall meet both the minimum COP100% and weighted COP 3Weighted COP = 0.4 x COP100% + 0.6 x COP50%
4N is the number of indoor and outdoor units 5Standby power is expressed in Watts

Regional Policy Roadmap for harmonization of AC standards in ASEAN economies 72
Figure 78: Sample of the comparative label
Endorsement Labeling
Launched in 1992 and administered by the Singapore Environmental Council (SEC), the Singapore
Green Labeling Scheme is Singapore’s leading environmental standards and certification mark. It is a
voluntary labeling scheme. The label is applicable to most products except food, drinks and
pharmaceuticals, with products evaluated through stringent standards. Some of the appliance
categories include air conditioners, coffee machines, dishwashers, refrigerators,
refrigerator/freezers, television (flat screen and CRT). Application for the Scheme is open to both
local and foreign companies.
Figure 79: Sample of the endorsement label
Local testing capabilities In Singapore, the NEA recognizes laboratories that check air conditioners (ACs) that have been accredited by the Singaporean national accreditation authority, including laboratories in China, Malaysia, Thailand, the US and the EU.
Market surveillance mechanisms
Under Section 12 of the Energy Conservation Act of Singapore, no person shall, in the course of any
trade or business, supply any registrable goods in Singapore on or after the effective date unless the
registrable goods are registered and labeled in the prescribed manner, and meet minimum energy
efficiency standards where prescribed. Any person who supplies such products shall be guilty of an
offence and shall be liable on conviction to a fine up to $2,000.
Under Section 13 of the Act, any importer and manufacturer who intends, in the course of any trade
or business, to supply registrable goods in Singapore on or after the effective date shall apply to the
National Environment Agency (NEA) to register itself as a registered supplier and to register any
registrable goods, which the importer or manufacturer intends to supply in Singapore. Any importer
or manufacturer who contravenes this section, shall be guilty of an offence and shall be liable on
conviction to a fine up to $2,000.

Regional Policy Roadmap for harmonization of AC standards in ASEAN economies 73
Under Section 18, any registered supplier that does not maintain complete and accurate records or
does not provide such records or other related documents or information to NEA when requested,
shall be liable on conviction to a fine not exceeding $2,000.
Section 16 of the Act states that once a registration is withdrawn or revoked, the registered suppliers
must inform their customers and those who are trading such goods. The purpose is to prevent
suppliers from withholding the information, which would allow registrable goods to be sold in the
market as unregistered goods, and thus undermine the restriction on the registrable goods.
Under section 16 of the Act, if a supplier is supplying products which do not conform with the test
results as furnished by the supplier or do not meet the prescribed minimum energy performance
standards or a modification to the registered goods has resulted in a change that affects the energy
efficiency or the registered goods or the registered supplier has procured the registration of the
registered goods by providing any particulars, information or document, or by making any statement
or representation, which are false or misleading, NEA may revoke the registration of such products
after giving notice to the registered supplier.
Under section 19, NEA may require registered suppliers to provide free of charge samples of the
registrable goods for the purpose of testing or analysis; and to furnish such documents or information
as he may require in respect of those registrable goods or the supply of those registrable goods,
failing which the supplier shall be guilty of an offence and shall be liable on conviction to a fine up
to $2,000.
Under Section 20, any person who in relation to an application for registration made under section
13 or to renew the registration made under section 15, makes or causes to be made any statement
or declaration, provides any document or information which is false or misleading in any material
particular;, shall be guilty of an offence and shall be liable on conviction to a fine up to $2,000 or to
imprisonment for a term not exceeding 3 months or to both.
NEA completed a verification testing exercise of air-conditioner, refrigerator and clothes dryer
models in mid-2014 and published the results of the exercise on its website70 in January 2015.
It is the responsibility of the retailers and suppliers to ensure products are correctly labeled. Surveys
(visual checks of retail outlets) are commissioned by NEA to check that energy efficiency labels are
placed correctly on products at the point of sale.
Verification testing
Stage 1
Models of registered products are randomly selected for verification testing by NEA. Samples of
selected models are provided by suppliers for testing and are collected from warehouse of the
supplier
Samples are selected and sealed by NEA personnel at the time of collection
Samples are tested by test laboratory contracted by NEA for verification testing (1 sample per
model)
Verification testing results are compared with the values in the test report submitted by
suppliers at the time of registration
70 http://www.nea.gov.sg/energy-waste/energy-efficiency/household-sector/verification-testing

Regional Policy Roadmap for harmonization of AC standards in ASEAN economies 74
Stage 2
In case the sample has failed verification testing, 2 more units of the same model are tested. All
the costs for second testing are borne by the supplier. The second testing is conducted by third
party laboratories which are either accredited by Singapore Accreditation Council (SAC) or the
test laboratory’s national accredited body which has signed a mutual recognition agreement
(MRA) with the SAC.
If the average energy performance of these 2 units is within the allowed tolerance limits, the
model is considered to be passed.
Apart from Energy Conservation Act, the subsidiary legislation governing these requirements are:
Energy Conservation (Registrable Goods) Order 2013
Energy Conservation (Energy Labeling and Minimum Performance Standards For Registrable
Goods) Regulations 2013
Energy Conservation (Composition of Offences) Regulations 2013

Regional Policy Roadmap for harmonization of AC standards in ASEAN economies 75
12. Regional Policy Roadmap One of the objectives of the formation of the ASEAN Economic Community (AEC) by 2015 is achieving
economic integration in Southeast Asia. The implementation of trade facilitation measures, such as
removal of Technical Barriers to Trade (TBT), is key for achieving this goal, as the differences in
regulations, standards and conformance assessment measures pose barriers to the movement of goods
from one country to another within the region. Thus, the objective of the Regional Policy Roadmap
is to facilitate harmonization or clear alignment of minimum energy performance standards for air
conditioners in ASEAN economies. The ultimate goal is to drive market transformation in ASEAN
member countries, promoting the use of more efficient air conditioning equipment. Other goals
include greater intra-ASEAN trade in space cooling products, reduced costs for product testing,
monitoring and verification, energy savings, and carbon emissions reductions from more efficient ACs
for consumers.
The regional market for ACs is expected to grow at 10% per year in the next 5 years (as per the
regional assessment - Section 1). Therefore, economies in ASEAN will see an increase in the energy
demand from cooling applications. Most ASEAN member countries have mechanisms in place to
address this challenge by strengthening energy performance requirements for new ACs in the market
(through S&L) and ensuring performance requirements are met by products placed in those markets
(through monitoring, verification and enforcement regimes).
This policy roadmap will build on those mechanisms and discuss specifically the harmonization or
alignment of critical components of energy efficiency policies at the regional level.
Robust and harmonized energy performance standards
Harmonization of test methods
Among commonly used air-conditioners, there are small variations in the ISO test procedures (i.e. ISO
5151) that are used or referenced. The scope of ISO 5151:2010 is wide, i.e. it covers all non-ducted
air-cooled air-conditioners and air-to-air heat pumps, irrespective of the capacity71. It covers most,
if not all, of the common applications of air-conditioners used in residential, commercial and
industrial sectors. These standards, however do not take into account the partial load under different
climatic conditions72. The scope of the test standard relates to new products only and does not cover
depreciation in the energy efficiency performance over a period of time. Deterioration of the energy
efficiency over time depends on several factors including the local conditions particularly the
pollution level, grid conditions, usage pattern, maintenance, poor product quality, etc.
The current national test standards used in the ASEAN countries are:
Country Standard Notes
Malaysia MS ISO 2010:2012 Identical to ISO 5151:2010
Singapore ISO 5151:1994 Transition to ISO 5151:2010 -
1st September 2013
Thailand TIS 1155-2536, TIS 385-2524 -
Indonesia SNI 19-6713 -
Viet Nam TCVN 6576:1999 Transition to ISO 5151:2010 in
2013
Philippines PNS 240:1998 -
71 This standard also covers ducted AC and heat pumps having rating less than 8kW.
72 Even though ISO 5151:2010 allows evaluation of variable capacity systems at full-load conditions, it does not specify the
test method for part load conditions (i.e. for evaluation of seasonal efficiencies)

Regional Policy Roadmap for harmonization of AC standards in ASEAN economies 76
The ISO 5151:2010 standard has been identified as the benchmark test standard for harmonization in
ASEAN region, according to the “APEC-ASEAN Harmonization of Energy Efficiency Standards for Air
Conditioners”73 study. The high level of alignment among the ASEAN national test standards with ISO
5151:2010 provides a compelling rationale for regional harmonization using this standard for ASEAN
economies.
Across economies, the cooling capacity test is conducted at the T1 standard rating condition (see
Table 14). The T2 (cool climate) and T3 (hot climate) conditions are not used for rating purposes
while in Philippines the rating test is conducted at the T4 test condition. The majority of the ASEAN
economies conduct tests on equipment with fixed-speed compressors.
Table 14: Test conditions for the determination of cooling capacity
The “comparative analysis of test standards report (APEC-ASEAN 2013)” has shown that about 80% of
the relevant clauses in the ISO 5151:2010 standard are common among the existing national test
standards in the region. However, six areas of differences have been identified which will require
further scrutiny:
standard rating condition (Philippines as described above)
Test rated voltage specified in ISO 5151:2010 vs. system voltage specified in the national wiring
rules
Duration of test data recording and interval of data recording
73 Wai Meng, Chin. APEC-ASEAN Harmonization of Energy Efficiency Standards for Air Conditioners: Phase 1. Comparative
Analysis of Test Standards. June 2013.
Parameter
Standard rating test conditions -
ISO PNS 240
T1 T2 T3 T4
Temperature of air entering indoor side (°C)
dry-bulb
wet-bulb
27
19
21
15
29
19
27
19
Temperature of air entering outdoor side (°C)
dry-bulb
wet-bulb
35
24
27
19
46
24
35
27
Condenser water temperature (°C)
inlet
outlet
30
35
22
27
30
35
T1 = Standard cooling capacity rating conditions for moderate climates
T2 = Standard cooling capacity rating conditions for cool climates
T3 = Standard cooling capacity rating conditions for hot climates
T4 = Philippines standard rating test condition

Regional Policy Roadmap for harmonization of AC standards in ASEAN economies 77
Allowable variation of entering air temperature readings during steady-state cooling capacity
tests74
Location of unit under test in the outdoor test room, and the percentage of piping length in the
two room chambers
Acceptance of both calorimeter and indoor air-enthalpy (psychrometric) test methods
The impact of the differences listed above is expected to be minor and it is anticipated that the
findings from the comparative analysis will form the basis to develop the harmonized test standard
for the ASEAN region.
It is also strongly recommended that in addition to the six economies (Malaysia, Singapore,
Thailand, Indonesia, Viet Nam, and Philippines) already using or planning to adopt ISO 5151,
Brunei, Myanmar, Laos and Cambodia should also adopt ISO 5151:2010 test standard to further
the harmonization of test methods in ASEAN and as a step towards the ASEAN Economy
Community 2015 target.
Harmonization of metrics
The EER and the Seasonal Energy Efficiency Ratio (SEER) are the two main types of metrics in use
internationally to rate the energy efficiency of ACs. The EER is the ratio of the cooling capacity to
the electricity consumption when measured at full load (i.e., at the maximum deliverable cooling
capacity of the AC). The EER is not representative of the seasonal energy performance because it
does not take into consideration part load due to variation in the ambient temperature conditions
annually and the occurrence of the temperature variations in terms of number of hours of operation
at each temperature conditions. In fact, ACs typically operate at full capacity for only a small number
of hours in the cooling season; they run at part load or cycle on and off for the rest of the time. In
order to address this shortcoming of the EER metric, the SEER has been created to provide a more
representative measure of the EE performance of AC units over the cooling season. SEER metrics are
increasingly being used or considered as alternatives to the EER to set MEPS and labeling
requirements. Various economies have already adopted seasonal energy performance test standards
for ACs, including the US, the EU, Korea, Japan and China.
The ISO 5151 standard does not specify the method to evaluate the part-load and seasonal energy
efficiencies of air-conditioner equipment, e.g. inverter technology. The evaluation method of such
seasonal performances is however specified in ISO 16358-1 which uses the Cooling Seasonal
Performance Factor (CSPF). The calculation of the CSPF can be accomplished by using test data
obtained from two test conditions, one at standard rating, and the other at specified part load
conditions defined in the standard for particular types of unit (e.g. fixed speed, two-stage, multi-
stage, and variable capacity). Nevertheless, the ISO 16358-1 standard makes reference to ISO 5151
for the testing method.
The cooling load can vary appreciably from region to region and country to country depending on
multiple factors. Therefore in order to assess the SEER and CSPF, it is necessary to understand the
cooling load at different outdoor temperature conditions and its occurrence over a period of 24 hours
and also annually.
The outdoor ambient temperatures in ASEAN countries are higher than those given in ISO 16358. The
reference outdoor temperature bin distribution to calculate the cooling load is represented by a value
and the assumption that it changes in a linear fashion depending on the change in outdoor
temperature. The outdoor temperature and the corresponding bin hours play a very important role
74 The maximum variation of individual readings from the specified test conditions

Regional Policy Roadmap for harmonization of AC standards in ASEAN economies 78
and influence the CSPF/SEER. Therefore the prevailing outdoor temperature conditions in ASEAN
countries rather than the outdoor temperature conditions given in ISO 16358 should be taken into
account. The CSPF/SEER should be evaluated based on a reference outdoor temperature bin
distribution of each country75. This methodology would facilitate the correct assessment of product
performance evaluation in countries having tropical climate.
Vietnam and Singapore are two countries in the ASEAN region to reference a standard for variable
capacity air-conditioners (inverter type). Vietnam refers to TCVN 10273:2013, Air-cooled air
conditioners and air-to-air heat pumps - Testing and calculating methods for seasonal performance
factors, which is based on ISO 16358 standard to determine seasonal energy efficiency of inverter-
driven products. Singapore specifies in its Energy Conservation (Energy Labelling And Minimum
Performance Standards For Registrable Goods) Regulations 2013 that the cooling test shall be
conducted at 2 points, namely the full-load cooling capacity and the part-load cooling capacity, and
makes reference to testing standards, ISO 5151:2010 and ISO 15042:2011, to measure the energy
consumption and cooling capacity of single-split and multi-split type inverter air-conditioners
respectively. Philippines plans to introduce ISO 16358 into the national standard for air conditioner
as PNS/ISO 16358-1:2014 and the technical working group is deliberating on the use of CSPF for both
variable (inverter type) and fixed capacity units. Thailand has adopted CSPF for voluntary labeling
system for inverter unit from January 2015.
Figure 80 shows the adoption trends of CSPF in various economies. In ASEAN, the CSPF is under
consideration as illustrated below, and expected to be adopted in some economies in 2016-17.
Figure 80: CSPF trends worldwide76
Considering the increasing number of inverter units available in the ASEAN AC market and that
this AC type performs better at part load conditions, ASEAN economies should consider to
75 For instance, the reference outdoor temperature bin distribution in India has been devised based on a detail analysis of
national weather data.
76 Source: Mr. Makoto Kaibara, JRAIA, e-mail message to author, February 18, 2015.
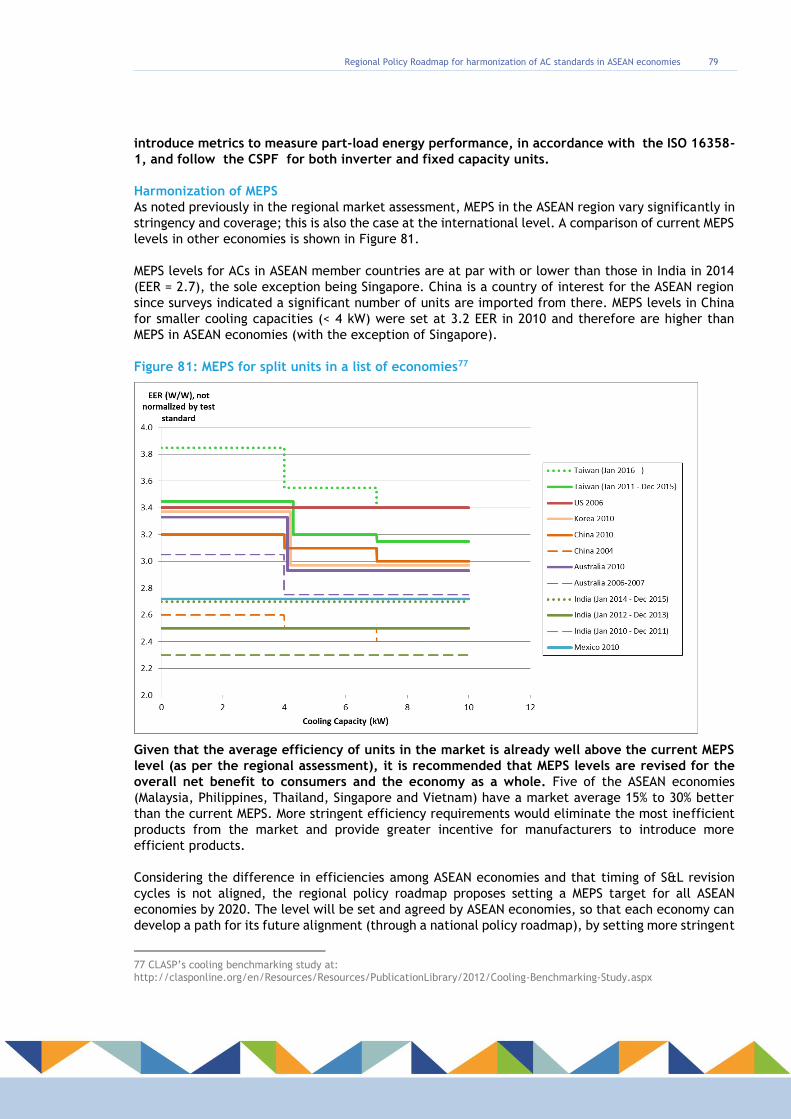
Regional Policy Roadmap for harmonization of AC standards in ASEAN economies 79
introduce metrics to measure part-load energy performance, in accordance with the ISO 16358-
1, and follow the CSPF for both inverter and fixed capacity units.
Harmonization of MEPS
As noted previously in the regional market assessment, MEPS in the ASEAN region vary significantly in
stringency and coverage; this is also the case at the international level. A comparison of current MEPS
levels in other economies is shown in Figure 81.
MEPS levels for ACs in ASEAN member countries are at par with or lower than those in India in 2014
(EER = 2.7), the sole exception being Singapore. China is a country of interest for the ASEAN region
since surveys indicated a significant number of units are imported from there. MEPS levels in China
for smaller cooling capacities (< 4 kW) were set at 3.2 EER in 2010 and therefore are higher than
MEPS in ASEAN economies (with the exception of Singapore).
Figure 81: MEPS for split units in a list of economies77
Given that the average efficiency of units in the market is already well above the current MEPS
level (as per the regional assessment), it is recommended that MEPS levels are revised for the
overall net benefit to consumers and the economy as a whole. Five of the ASEAN economies
(Malaysia, Philippines, Thailand, Singapore and Vietnam) have a market average 15% to 30% better
than the current MEPS. More stringent efficiency requirements would eliminate the most inefficient
products from the market and provide greater incentive for manufacturers to introduce more
efficient products.
Considering the difference in efficiencies among ASEAN economies and that timing of S&L revision
cycles is not aligned, the regional policy roadmap proposes setting a MEPS target for all ASEAN
economies by 2020. The level will be set and agreed by ASEAN economies, so that each economy can
develop a path for its future alignment (through a national policy roadmap), by setting more stringent
77 CLASP’s cooling benchmarking study at:
http://clasponline.org/en/Resources/Resources/PublicationLibrary/2012/Cooling-Benchmarking-Study.aspx

Regional Policy Roadmap for harmonization of AC standards in ASEAN economies 80
MEPS and introducing higher performing products. The MEPS level should also be technology neutral;
meaning that both variable and fixed speed units should be considered under a single category of
room air conditioners, and use CSPF to evaluate seasonal performance.
A multi-tier schedule for MEPS (see table below) has been developed that provides a path that can
be used by the economies to define MEPS levels for future alignment. The tiers have increments of
approximately 6%, in other words, the next efficiency level corresponds to a 6% efficiency increase.
A schedule with a set of revisions every two years is proposed and could be included in the local
regulations, so that future performance requirements (improvements) are laid out at an early stage.
This has clear advantages by signaling expectations of future performance requirements in advance,
thereby allowing the industry to integrate design changes (due to higher efficiency requirements)
into normal manufacturing cycles.
The proposed MEPS tiers correspond to levels that would align with the current levels in India (Tier
I), or Singapore (Tier III), with new efficiency levels for smaller cooling capacities (<36,000 Btu/h)
starting at an EER of 2.9.
Table 15: MEPS levels for fixed speed units - EER in w/w (Btu/h/W)
Proposal 1 Year 1 Year 3 Year 5
Tier I 2.9 (9.9) 3.1 (10.6) 3.3 (11.3)
Tier II 3.1 (10.6) 3.3 (11.3) 3.5 (12.0)
Tier III 3.3 (11.3) 3.5 (12.0) 3.7 (12.6)
Figure 82 to Figure 84 show proposed MEPS Tiers III with the distribution of models available in 2013
(and the current MEPS) for Thailand, Malaysia and Vietnam.
Figure 82: Proposed tiers in Thailand vs. current market efficiency (starting at Tier III –
EER=3.3/11.3)

Regional Policy Roadmap for harmonization of AC standards in ASEAN economies 81
Figure 83: Proposed tiers in Vietnam vs. current market efficiency (starting at Tier III –
EER=3.3/11.3)
Figure 84: Proposed tiers in Malaysia vs. current market efficiency (starting at Tier III –
EER=3.3/11.3)

Regional Policy Roadmap for harmonization of AC standards in ASEAN economies 82
The selection of a MEPS Tier for a specific economy should be developed in conjunction with the
national policy roadmap. A cost-benefit analysis could support the process, by identifying a MEPS Tier
that is technically feasible and economically viable in each country, considering the impacts to
consumers and manufacturers. The national assessments already provide information that can be
used in this type of analysis. Additional information on the costs of current products and the
incremental cost increases for higher performing products are required to complement the data
already collected.
Testing infrastructure and laboratory capacity
There is limited testing capacity for air conditioners at the national level and overall in the ASEAN
region. Economies participating in the survey reported seven independent third party testing facilities
(most government owned) and five manufacturer testing facilities. For a regional harmonization
program to succeed, governments in ASEAN would need to ensure access to competent and adequate
testing laboratories. Testing laboratory infrastructure is expensive78 so ASEAN governments can either
choose to invest in new laboratory capacity, rely on private laboratories, and/or share testing
capabilities among countries. This section focuses on activities that ASEAN economies can implement
in the short and medium term to enable access to or enhance current testing capacity.
In general, countries with no local production of air conditioners and/or no existing testing facilities
could rely on product test results from facilities in the country of origin or other economies in the
region (China and/or other ASEAN economies) where testing facilities are available. Countries with
local production and/or existing testing facilities could ensure that such facilities are competent,
accredited by a national accreditation body and seek recognition by other accreditation bodies in
ASEAN countries.
There are two primary recommendations for improving the access and credibility of testing
laboratories in ASEAN:
A. Build testing capacity in existing facilities, enhance capability and reduce differences in
laboratory testing conditions.
B. Encourage mutual recognition agreements (MRA) to access regional infrastructure and resources
more effectively.
Building laboratory capacity
Following harmonization of test methods to measure energy performance at the regional level and
alignment of testing conditions, the natural step would be to develop programs for training in existing
testing facilities in ASEAN to ensure accuracy and reliability of testing results. An effective manner
to conduct such training is through the development of a round robin testing exercise.
In round robin testing (RRT), two or more laboratories test the same or similar samples following the
same test method and testing conditions, which is followed by an evaluation of the testing process
and the results. The objective of the round robin testing is not only to check the operational
conditions of laboratory devices, but to improve the quality and testing skills of lab personnel, and
identify existing problems and disparities in the methods. It is a very effective way to build capacity
as participant laboratories identify corrective measures for improvement in their processes if
necessary, or ratify the quality of current practices.
78 Anecdotal evidence from a testing facility in Europe suggests that the cost of a new calorimeter room could reach up to
1.5 million US dollars (this estimate is for the equipment only, and doesn’t include personnel costs).
Regional Policy Roadmap for harmonization of AC standards in ASEAN economies 83
CLASP conducted an RRT exercise for air conditioners in China in 2009- 201079. The RRT included
three testing samples in six testing facilities in China. An international expert participated as witness
of the testing in various facilities. Among the results achieved by this specific exercise were:
Enhanced communication amongst participant laboratories;
Improved testing capabilities and expertise of laboratory staff;
Identification of problems and the necessary related improvements, among others.
The scheme laid out in this exercise could be used by ASEAN economies to conduct RRT at the
testing facilities identified in the region.
Use of mutual recognition agreements
Mutual recognition agreements (MRAs) are “multilateral arrangements between two or more
economies to mutually recognize or accept some or all aspects of another’s conformity test
procedures”80. There are two types of MRAs: intergovernmental and technical.
Intergovernmental MRAs are established between governments. An example of an MRA established
to facilitate trade in electrical products is the APEC Electrical Mutual Recognition Agreement. This
MRA has three components (countries in APEC can choose to sign onto one of the components or all
three):
1. Information exchange agreement
2. Mutual recognition of test results
3. Mutual recognition of certification
Technical MRAs can eliminate the need of retesting products by establishing technical equivalency
among bodies in different countries. They can include:
1. Laboratory accreditation
2. Inspection-accreditation
3. Testing-certification
International laboratories participating in this type of MRA shall at least comply with the following
criteria:
be accredited by the accreditation body of respective country and the accreditation body shall
be the member of ILAC/APLAC
be accredited under scope of IEC/ISO 17025
scope of accreditation shall cover the relevant ISO/IEC standard, as applicable
scope of accreditation shall also include all relevant tests as specified in the respective appliance
regulation (National Standard).
Examples of these MRAs already exist in ASEAN economies (see Section 1 – Regional assessment).
The development of an intergovernmental MRA could be pursued by a regional network of market
surveillance authorities, as part of the efforts to improve monitoring and verification practices in
the region.
79 Ning, Cao et al. China Energy Efficiency Round Robin Testing Results for Room Air Conditioners. April 2010.
80 Definition provided on CLASP’s S&L Guidebook: Energy-efficiency labels and standards: A guidebook for appliances,
equipment, and lighting. Second Edition.

Regional Policy Roadmap for harmonization of AC standards in ASEAN economies 84
Monitoring and Verification
Establishing an effective compliance – or Monitoring, Verification, and Enforcement (MV&E) – regime
is key to improving the impact of S&L programs, while also realizing numerous co-benefits. An
effective MV&E regime is, therefore, crucial to ensure that program participants operate in a
market that is fair, consistent and encourages investment and innovation in energy efficiency.
Benefits of achieving high rates of compliance include:
Understanding the rates of compliance is a prerequisite to accurately measuring the outcomes of
S&L programs (energy savings and reduced greenhouse gas emissions).
High compliance rates safeguard the investment made by governments by building up the
credibility of their voluntary and mandatory energy labels. High compliance rates also
safeguard the investment made by compliant industry participants in order to manufacture and
supply energy efficient products. Without adequate enforcement, the compliant industry
participant is penalized through a loss of economic returns and competitive advantage,
leading to a disincentive to invest further in innovation;
Conversely, there is a corresponding risk that a failure to address issues of non-compliance can
lead to serious long-term consequences through the erosion of consumer confidence. Instances
of non-compliance, which can mean that consumers pay for performance that they do not
receive, can seriously erode credibility. Once credibility is damaged, it will require a
considerable time and effort to re-establish consumer confidence;
A good system for ensuring compliance includes:
A legal and administrative framework,
A financial plan and budget,
A communication and reporting strategy, and, where possible,
Effective communication, collaboration, and coordination with other MVE regimes.
Annex 1 outlines possible measures to implement comprehensive “Monitoring and Verification” (M&V)
processes associated with a standards or an energy labelling program and provides examples of
international best practice. This section doesn’t provide options on “Enforcement”, as this is a
legislative issue subject to country specific laws.
Recommendations for ASEAN economies
The following recommendations are based on the policy and institutional assessments and sound
existing M&V practices discussed in Annex 1, which should operate on the regional level for regional
harmonization to succeed. These include proposals for individual S&L energy efficiency programs and
opportunities to improve M&V regimes through collaboration between economies in the ASEAN region.
Opportunities at the regional level
Recommendation 1 – Coordinated approach to verification testing
Currently verification testing is conducted at the national level by ASEAN economies, even though
there are many common AC models traded within the region. The benefits of a more coordinated
approach to testing include cost savings and the gathering of market intelligence based on larger
sample sizes. Some examples of the types of collaboration on verification testing that ASEAN member
states could consider, and their advantages, include:

Regional Policy Roadmap for harmonization of AC standards in ASEAN economies 85
Focus on individual product: An agreement between S&L programs of different economies to
undertake verification tests on the same product model at a similar time within their own
economies, and share results, to gain a greater insight into compliance issues relating to
individual product type/model.
Focus on different product types/models: An agreement between S&L programs in the region to
undertake verification tests on different categories of products over a designated period of
time, and share results, in order to maximize coverage across a range of products.
Shared costs for testing programs: An agreement between S&L programs in the region to
undertake verification tests on the same type of product at one designated laboratory, and
share results, to gain cost savings.
Mutual recognition of test reports: Where tests methodologies are technically equivalent,
country S&L programs agree to allow manufacturers/importers/suppliers to lodge the same test
reports as evidence of compliance.
The sharing of test results and/or notification of enforcement actions: Where a product
type/model has been proven to be non-compliant in one economy, this information may be
used by other economies to justify increased scrutiny and improve the targeting of limited
testing budgets.
These options and other potential ones could be further considered by governments, and developed
under the proposal for a regional network.
Recommendation 2 – Establishment of a regional network
There are considerable opportunities to rapidly improve compliance regimes through sharing of
experiences and approaches between programs. Governments should therefore, devote more
attention to establishing links with other S&L programs and exploring the transfer of expertise and
information. Coordination among market surveillance authorities in the ASEAN region could facilitate
program implementation and enforcement by increasing information sharing of compliance of
products sold at the regional level. As such, ASEAN economies should consider supporting the
establishment of, and participation in a forum on M&V. ASEAN economies can learn experiences from
the APEC MV&E Network, by participating in regular meetings or workshops to discuss common MV&E
challenges and best practices. An ASEAN MV&E Network might also build on and use the draft APEC
MV&E Network Guiding Principles, to help design a structure for communication, collaboration and
cooperation on MV&E81.
Recommendation 3 - Industry Engagement
Governments with responsibility for S&L programs need to engage with industry participants and work
together to develop more effective M&V regimes. ASEAN economies should consider engaging industry
in a constructive dialogue, to increase awareness and understanding of the objectives of
governments, and assist governments to find ways of reducing costs and increasing effectiveness.
Recommendation 4 – Reporting to increase visibility and transparency of the M&V regime
Reporting outcomes of any screening or verification tests is an important part of the compliance
regime. In addition to communication with relevant suppliers, further reporting options include:
Inform the respective trade associations: This should always be done regardless of whether the
products were found to be in conformity with the requirements. If in conformity, then the supply
side has been reminded that monitoring is taking place – something that all bona-fide trade
associations will welcome. Where not in conformity, then support from the trade association to
81 See Annex II

Regional Policy Roadmap for harmonization of AC standards in ASEAN economies 86
ensure that corrective action is taken should be sought. Peer pressure applied through trade
associations can be a very effective tool for improving conformity;
Inform other verification authorities: Such information can provide useful intelligence authorities
in neighboring jurisdictions;
Publish the results: This significantly increases the visibility of the verification action. It
demonstrates to all stakeholders that monitoring activity is taking place and increases pressure
on manufacturers and suppliers to ensure that they only market products which are in conformity
with the requirements.
Recommendation 5 – Development of a regional product database
Ensuring that all products within the scope of mandatory S&L programs meet program requirements
is a complex and on-going task that involves several related processes. While there are different
approaches to how this is achieved, the effectiveness of a program’s compliance regime would likely
be improved considerably with the availability of a national or regional centralized listing of product
models that are part of the program. Such information can be gained through the use of market entry
conditions involving registration or certification processes, and be used to increase the effectiveness
of market surveillance checks. This database can be a useful tool to track impacts of the program
and also to provide the regulator with valuable information regarding the market and product
performance for future standard revisions. Where the same products are available on different
markets, economies should consider either aligning database criteria or establishing a regional
database to facilitate cross-border M&V.
Recommendation 6 – Increase access to competent laboratories
In ASEAN there is limited testing capacity for air conditioners at the national level and overall in the
region. As reported by participating economies on the surveys, there are seven independent third
party testing facilities (most government owned) and five manufacturer testing facilities. This
presents an opportunity to develop a regional approach to improve and increase access to testing
facilities on a regional basis. The use of mutual recognition agreements can grant access to competent
test facilities to those countries with limited resources, while the development of round robin testing
exercises can improve the competency of the already existing capacity at the regional level (as
discussed in a previous section).
Opportunities at the national level
Recommendation 1 – Awareness Raising
Ensuring that participants are aware of their obligations within S&L programs is an important first
step to facilitating compliance and supports any future enforcement actions. Educating stakeholders
on their S&L requirements is not only a key first preventative step towards ensuring compliance, it is
also a very resource efficient way of doing so. Well targeted information provision and regular surveys
of industry awareness can maintain the integrity of S&L programs.
Recommendation 2 – Regulatory framework review and program resource
All S&L energy efficiency programs need to periodically review their M&V enabling legislation,
processes and activities to identify ways of making sustained improvements. Such reviews should take
into account the views of key stakeholders and international experience. Governments should invest
sufficient funds in the development and on-going implementation of robust M&V processes to ensure
the integrity of their S&L programs. The budget for M&V activities should also include the provision
of an adequate number of appropriately trained staff.
Recommendation 3 – Operational Guidelines

Regional Policy Roadmap for harmonization of AC standards in ASEAN economies 87
Providing transparent operational guidelines that detail the main elements of a program’s
administrative and M&V procedures decreases the opportunities for misunderstandings and disputes,
while facilitating compliance. Governments should ensure that S&L programs have developed such
guidelines and made them available to stakeholders.
Recommendation 4 - Communications
Communications play a vital role in signaling the importance that governments place on compliance
and making the risks (by way of enforcement) obvious to stakeholders in S&L programs. For example;
the lack of readily available records on M&V surveillance and verification activities might suggest
that no compliance process were undertaken. Governments should maintain records of M&V
surveillance and verification activities and make them publically available in order to highlight the
risks of non-compliance. Similarly, governments should keep better records of enforcement actions
and make them publically available in order to make stakeholders aware of the range and frequency
of enforcement activities.
Other policy measures to enhance market transformation
In order to ramp up the regional effort of promoting high efficiency ACs among ASEAN countries,
incentive policies could be used to overcome the barrier of higher first cost that often restricts the
purchase of energy-efficient ACs. Regional energy labels and standards provide a verified baseline
for judging enhanced performance and pull the market towards higher efficiencies while incentive
programs can accelerate the market by encouraging consumers, manufacturers and suppliers to
switch to high efficiencies ACs. The most common incentives are consumer rebates, tax credits or
accelerated depreciation, loan financing (including shared-savings or performance-based
contracting), and equipment replacement. The policy makers in ASEAN countries could consider the
following incentive policies in their effort to foster high efficiency AC markets in the region.
Subsidies
In most cases, either a government agency or a utility offers financial incentives directly to end users.
Sometimes incentives are provided to manufacturers or builders to encourage them to supply more-
efficient products with the assumption (or requirement) that at least some of the incentive will be
reflected in a lower price to the final buyer. Subsidies or rebates are widely used by policy makers
around the world to promote high efficiency products. For example in China, the State Council
committed 26.5 billion RMB ($4.26 billion) to its Promoting Energy-Efficient Appliance for the Benefit
of People Program in 2012. This program aimed to subsidize energy-efficient appliances. It covered
six categories of household appliances, including air conditioners, TVs, refrigerators, clothes washers,
water heaters and desktop computer. Both non-inverter and inverter ACs were subsidized and the
size of the subsidy was between 4% and 9% of the average retail prices (Table 16). Consumers who
purchased the qualified products can use their receipt, bar code of the product and their personal
identity document to claim the subsidy.
Table 16: Average prices and subsidies for fixed and variable speed air conditioners in China Cooling capacity
(W) Fixed speed air conditioner Variable speed air conditioner
Subsidy Size (RMB)
Ave. Price (RMB)
Subsidy/Price Ratio
Subsidy Size (RMB)
Ave. Price (RMB)
Subsidy/Price Ratio
Tier 1
Tier 2
Tier 1 Tier 2
Tier 1 Tier 2 Tier 1
Tier 2
CC≤4500 180 240 2551 7% 9% 240 300 3596 7% 8%
4500<CC≤7100 200 280 5461 4% 5% 280 350 6942 4% 5%
CC>7100 250 330 6611 4% 5% 330 400 8878 4% 5%
Public Sector Procurement

Regional Policy Roadmap for harmonization of AC standards in ASEAN economies 88
Public sector procurement is another very effective means to promote energy efficient products. The
scale of public sector procurement is large enough to significantly influence the market as in most
countries the expenditure for public sector procurement is reported to be between 12% and 20% of
national gross domestic product. The adoption of high efficiency products by the government will
also have symbolic significance by exemplifying the positive environmental impact of high efficiency
products. As such, if governments in ASEAN countries prioritize the procurement of efficient ACs, it
is likely that the market will respond and more manufacturers will produce those products to meet
the demands of the public sector. In theory, this will expand the market for those products and in
turn drive down prices for all consumers.
China started their public procurement program in 2009 and the program is still ongoing today. The
Ministry of Finance and the National Development and Reform Commission jointly published a
catalogue for energy efficient products for public procurement. Priorities must be given to products
appearing in the catalogue when a government entity procures products. In government procurement
activities, the procurement officer must specify the required standards for product qualification, and
priority of energy efficiency procurement in all tender documents.
Tax incentives
Some countries have reduced import duties or sales taxes on energy-efficient equipment, sometimes
distinguishing between locally produced and imported products. Because import duties or
sales/excise taxes may be an important source of revenue for a country, another approach that should
be considered is a “revenue-neutral” tax incentive or “feebate” for efficient products. The idea is to
keep the total amount of tax revenue about the same but to vary the tax rate so that the import or
excise tax is lower on an efficient product and higher on a less-efficient one.

Regional Policy Roadmap for harmonization of AC standards in ASEAN economies 89
ANNEX 1
The section discusses the scope for an M&V framework and draws on the best practice guidebook
published by CLASP in 2010: “Compliance Counts: A Practitioner’s Guidebook on Best Practice
Monitoring, Verification and Enforcement for Appliance Standards & Labeling”82.
Monitoring
Monitoring comprises the collection and analysis of data to give an accurate picture of program
progress and compliance, and is usually an on-going process. It provides the opportunity to identify
and act on any implementation issue, as well as to collect data for program evaluation.
Most programs will need to monitor a range of requirements to be able to determine whether all the
rules of the program are being met. The requirement to provide information when a product supplier
joins the program or offers models for sale under the program are referred to as Entry Conditions
(e.g., self-declaration about product performance). Compliance monitoring that occurs once a
particular product is in the retail (or wholesale) marketplace is known as Market Surveillance.
Since most programs place different obligations on participants, there is no list of monitoring
activities common to all programs; however the design of Entry Conditions and Market Surveillance
activities needs to be adequate to track compliance with all the requirements of a particular program.
These do not always relate directly to energy performance, but also to processes that help to ensure
the integrity of the program; such as whether the right information has been provided by suppliers,
or if labels are being placed on products correctly.
Entry conditions can provide an invaluable source of information to the program administrator, including:
- The number and type of products within the scope of the program; - The energy performance of these products; - The sales volume or market share of models; - The details of suppliers responsible for placing individual products on the market, providing
traceability for compliance purposes. This information is most valuable when collected, stored and updated in a registration or certification database. A manufacturer should only be able to place their products on the market once the entry condition data has been registered in the database. This information is also valuable because:
- It establishes a claim of performance for individual models that can be verified; - Knowing what products have entered the program enables the program administrator to
identify products in the marketplace that may be avoiding mandatory requirements; - Linking individual models to suppliers is vital for enforcement; - Collecting performance data supports an evaluation of the program’s achievements -
required in order to maintain the support of governments, industry and consumers; - Continuous monitoring of this data enables policy makers to conduct analysis on policy and
product trends, which can inform future revisions to MEPS and labels.
Market surveillance is particularly applicable to energy labelling programs since there is a significant amount of declared information provided directly on the label itself, or available indirectly via registration or self-certification schemes (subject to the specific requirements of the appropriate
82 Available at: http://www.clasponline.org/en/Resources/MVEResources/MVEGuidebook.aspx#MVEGuidebook

Regional Policy Roadmap for harmonization of AC standards in ASEAN economies 90
regulations or scheme rules). In the first instance, market surveillance comprises a check that the product in the shop, brochure or internet site carries a label that is compliant with the applicable regulations or scheme rules. Market surveillance of MEPS regimes ensures that all products in the marketplace are compliant with whatever entry conditions are applicable; usually by law.
Verification
Verification is the process of determining whether a product actually performs according to its
claimed energy performance value. Unless there is a means of checking the accuracy of energy label
claims or minimum energy performance levels, there can only be limited enforcement following on
from market surveillance activity. Verification testing checks whether the claims made for the energy
performance of individual products by their suppliers are accurate under the conditions stipulated in
the program rules. Verification testing thus forms part of the process which begins with market
surveillance and ends with an enforcement action. A full description of the various verification tests
is provided in the box below.
Since the success of enforcement actions involving performance requirements is determined by
product test results, it is essential that these results are reliable and will be found accurate if
challenged. Assuming that the specified procedure is technically sound and provides acceptable levels
of repeatability83 and reproducibility84, then the best way to ensure the competence of the test
laboratory is to require that it be accredited.
A verification regime is the process specified by the standards and labels program, sometimes in
law, to determine whether the declared energy performance of equipment available on the market
is accurate. Testing normally forms the core of the determination of whether energy performance
claims have been met. There are three main forms of verification testing listed below in order of
ascending stringency:
- Screening tests in which the specified procedure may not necessarily be followed precisely,
in order to provide a reasonable indication of energy performance at a lower cost and more
quickly than in a full verification test. These tests are typically used to provide a
preliminary assessment of products which are likely to fail a full verification test. Typical
departures from the full procedure are that fewer replicate tests are made, laboratory or
staff undertaking the tests may not be accredited, or not all of the test requirements are
undertaken. These screening tests are sometimes referred to as check tests;
- Full procedure verification tests where the specified procedure is followed precisely in an
accredited laboratory and where all measurements and records stipulated in the procedure
have been followed. Full procedure verification testing would normally be the process
followed in support of subsequent enforcement action;
- Third party certification in which the manufacturer or suppliers’ claim of conformity to the
specified procedure is verified by an independent and competent third party.
Testing of products to the standards necessary to ensure a successful enforcement action requires a
high level of skill and access to a suitably equipped test laboratory. Consequently, such facilities are
a prerequisite for any effective compliance regime. These facilities will usually exist either as
government establishments or as independent commercial enterprises. It is rare that individual
manufacturers’ facilities will be able to satisfy requirements for independence. The skills and
equipment required to undertake tests represent a substantial financial investment, therefore, it
may be necessary for programs to identify future testing budgets and even to undertake tendering
processes to encourage the development of new facilities. With regards to mandatory programs, the
administrator may be legally required to use a specific accreditation body, or may have to implement
83 Repeatability: that repeated measurements on the same product in the same laboratory have similar values.
84 Reproducibility: that the same measurements conducted in different laboratories have similar values.

Regional Policy Roadmap for harmonization of AC standards in ASEAN economies 91
its verification process according to some existing legal framework. Another option is to access or
help to establish a regionally funded and managed test facility, which is especially useful for countries
that have limited resources and may be challenged in finding qualified personnel locally.
There are a number of advantages in soliciting testing services from or collaborating with other
regional or even global partners:
Time saving: Existing laboratories can implement testing tasks immediately upon request;
Increased competition: Putting national testing out to tender increases potential for competition
between providers, whilst reducing costs for the tenderer;
Standards alignment: Regional testing supports alignment of MEPS and test standards;
Collaboration on MV&E: Partnering countries may find commonalities between their MV&E
programs and wish to collaborate on additional efforts, further reducing costs their costs;
Laboratory mutual recognition: Collaboration experience can help establish MRAs;
Resource sharing: Allows for more efficiently used resources.
International Best Practices
MV&E responsibilities defined in EU Ecodesign directive85
The Framework Directive for the Ecodesign of Energy Using Products (EuP) came into force in 2005.
It provides a legal framework for establishing minimum Ecodesign requirements for energy using
products by defining conditions and criteria for setting such requirements through subsequent
implementing measures. Since October 2009, its scope has been widened to include energy related
products. These implementing measures are targeted at individual product groups such as white
goods, motors, televisions or lighting equipment. Once approved as European Regulations, the
implementing measures do not need to be transposed into national legislation.
The Framework Directive requires Member States to put in place a Market Surveillance Authority
(MSA), which has powers to carry out checks on products, request relevant information from
manufacturers, and request the withdrawal from the market of non-compliant products. It also
requires that penalties shall be “effective, proportionate and dissuasive, taking into account the
extent of non-compliance and the number of units of non-complying products placed on the
Community market”. Specifically, the Directive states that:
Member States shall take all appropriate measures to ensure that products covered by
implementing measures may be placed on the market and/or put into service only if they comply
with those measures and bear the CE marking.
Member States shall designate the authorities responsible for market surveillance.
They shall arrange for such authorities to have and use the necessary powers to take the
appropriate measures incumbent upon them under this Directive.
Member States shall define the tasks, powers and organizational arrangements of the competent
authorities which shall be entitled to:
o organize appropriate checks on product compliance, on an adequate scale, and oblige
the manufacturer or its authorized representative to recall non-compliant products
from the market;
85 http://www.ecopliant.eu/wp-content/uploads/2013/10/Final-Draft-Best-Practice-Guidelines-Delivery-Sept-2014.pdf

Regional Policy Roadmap for harmonization of AC standards in ASEAN economies 92
o require the parties concerned to provide all necessary information, as specified in
the implementing measures;
o take samples of products and subject them to compliance checks.
Member States shall keep the Commission informed about the results of the market surveillance,
and where appropriate, the Commission shall pass on such information to the other Member
States.
Member States shall ensure that consumers and other interested parties are given an opportunity
to submit observations on product compliance to the competent authorities.
Co-ordination amongst European market surveillance authorities
The Ecodesign Administrative Cooperation group (ADCO) comprises Market Surveillance Authorities
(MSAs) of all EU Member States and has been established to improve cooperation in the
implementation and enforcement of S&L programs across Europe. The ADCO is the first serious
attempt to build effective linkages between MSAs with responsibility for energy efficiency in Europe.
Recognizing that many common products are sold in Member States, the ADCO encourages regular
communication between MSAs on compliance issues, and facilitates collaboration and cooperation on
compliance activities, especially where the same product is sold across multiple markets. The ADCO
has also initiated several projects that consider a joint strategy for product testing, enabling the
development of a consistency in testing and enforcement. This has led to the sharing of test results
amongst Member States in order to help determine which products placed on the EU market may be
at risk of non-compliance.
Harmonised product database for market surveillance in Europe
A well-designed database can support a systematic and comprehensive collection of information.
Through a harmonized database tool, the quality of the information exchange is increased as the data
can be unambiguously understood, compared and aggregated. Centralization of information also
facilitates comparability, limits the burden on data providers and avoids duplication. In particular,
harmonized product databases can assist in reconciling the identification of products, especially when
the same product is sold under different names or references in different countries. This facilitates
subsequent enforcement actions in respective countries. The collection of information in a
centralized database helps organize the accessibility to the information, and improves the cost-
effectiveness of market surveillance activities by contributing to synergies in the area. For example,
two centralized databases of this nature have been set up at EU level, namely RAPEX86 and ICSMS87.
86 http://ec.europa.eu/consumers/archive/safety/rapex/index_en.htm
87 http://ec.europa.eu/enterprise/policies/single-market-goods/internal-market-for-products/icsms/index_en.htm

Regional Policy Roadmap for harmonization of AC standards in ASEAN economies 93
RAPEX is the EU rapid alert system
that facilitates the rapid
exchange of information
between Member States and the
Commission on measures taken
to prevent or restrict the
marketing or use of products
posing a serious risk to the
health and safety of consumers.
However, the RAPEX system is
still essentially focusing on
direct risks to health (from toys,
textiles, etc.) and has not been
put to use to report on non-
compliance related to other
aspects, such as energy
performance.
ICSMS (Information and
Communication System for
Market Surveillance) has been in
operation in 12 EU/EFTA
Member States since 2003. This
European database has been
designed to exchange
information on products tested
by official market surveillance
authorities. ICSMS consists
essentially of an on-line
database which is divided into
two areas, one open (public),
and the other password-
protected (for authorities) and it
makes available information on products that have been withdrawn from the market due to non-
compliance with EU regulations.
The benefits of maintaining databases of this nature in terms of market surveillance can be
substantial, for example; they can be used to monitor the program, prepare verification activities
and eventually flag out products for which a declared characteristic is proven to be incorrect.
India S&L program
India’s S&L program is administered by the Bureau of Energy Efficiency (BEE), a statutory body under
the Ministry of Power, Govt. of India. The BEE uses comparative energy performance labels for most
labelled products with the exception of notebooks/laptops, which are covered by an endorsement
label. For the labelling program, BEE works through committees of experts and stakeholders,
including representatives from industry, consumer organizations, and industrial associations, test
laboratories, government and regulatory bodies who determine how a program should be
implemented on an appliance-by-appliance basis.
The MV&E system for the BEE energy labelling program is based on a registration system for product
suppliers, including a self-declaration of model performance. BEE conducts a verification testing
program of the labeled products, called check testing, in independent registered laboratories to
ensure that product models meet their performance claims. BEE and state government agencies (SDA)
Example of sharing inspection programs:
The Nordic countries (Denmark, Finland, Iceland,
Norway and Sweden) have established close
cooperation in Ecodesign and Energy labelling
market surveillance since 2011. Since the Nordic
markets for products are quit homogenous, often
with the same manufacturers, importers and
products, the conditions for market surveillance
cooperation are good. All market surveillance
officers in all five countries are more or less
involved in the cooperation. As a part of this
cooperation, the countries exchange their yearly
market surveillance plans through regular
meetings, by e-mails, and through a web-service
for sharing information. By communicating and
cooperating on market surveillance programs,
common inspection areas are identified at an
early stage. If two or more countries have
decided to test the same product category,
reconciliations are done in order not to select the
same product models. When inspections are done,
the results are also shared. Because of the Nordic
market being fairly homogenous, there have been
cases where non-compliant products have been
withdrawn in several Nordic countries based on a
test result from one country.

Regional Policy Roadmap for harmonization of AC standards in ASEAN economies 94
have a range of powers to enforce the energy labelling requirements under the provisions of the
Energy Conservation (EC) Act, 2001.
Check testing
Check testing can be initiated by BEE or
by SDAs, at a NABL88 accredited
independent laboratory registered with
BEE. BEE uses a 2-part verification
process, beginning with an initial check
test paid for by BEE. If the model under
test is shown not to comply, suppliers
may voluntarily de-register the product
and withdraw this model from the
market. The suppliers may also seek a full
verification test, in which case a further
two samples of the model are tested at
the registrants cost in a different
registered laboratory to the one used for
the check test. Manufacturers are
allowed to witness the second round of
testing. If one of the second samples is
found to fail, then the model is deemed
to be non-compliant.
Challenge testing
The BEE’s MV&E program allows a third-party to lodge a complaint that the performance of an energy
labelled product is not as claimed by the supplier. On receipt of a complaint, the Standards and
Labelling Implementation Committee are required to examine the complaint and to recommend to
BEE whether to conduct a challenge test. In the case of challenge testing, all costs incurred (the cost
of samples, testing charges and the transportation cost) must be paid for by the party making the
complaint. If the product is deemed to be non-compliant, the supplier must refund these costs to the
claimant via BEE.
88 The National Accreditation Board for Testing and Calibration Laboratories (NABL) is an autonomous body under
Government of India.
Check testing in Australia and India: Australian & Indian authorities have developed a cost efficient form of screening test, known locally as check-testing. This procedure begins with a stage-1 check test, which requires a full or part test to the relevant test Standard, to be performed on one sample of the model. The sample is generally independently purchased (usually from a retail outlet) and tested by a laboratory accredited for check testing on behalf of the regulatory authorities. If that first sample fails the stage 1 check test, then the onus is on the manufacturer or importer to either provide evidence that the sample tested was defective or to fund a more elaborate stage-2 process requiring the testing of replicate samples.

Regional Policy Roadmap for harmonization of AC standards in ASEAN economies 95
Figure 85: Bureau of Energy Efficiency’s approach to monitoring and verification in India
Collaboration Efforts and Opportunities in the APEC Region
Over the past few years, the APEC Expert Group on Energy Efficiency and Conservation (EGEE&C) has
been working to increase the consistency and effectiveness of M&VE within the APEC economies.
Building on lessons learned from the EU’s ADCO and from APEC MV&E workshops89, the APEC EGEE&C
has recognised the value of establishing a network for sharing MVE experiences, test plans, and where
possible, market data. In October 2014, the APEC EGEE&C discussed a draft set of voluntary and
informal Guiding Principles that are intended to steer the direction of the APEC MV&E Network. These
principles propose the formation of a secretariat to support the network, whose role will consist of
organising regular meetings of the Network, maintaining contact information for all participating
enforcement authorities or policy makers, and to support regional MVE information sharing. In
addition, the Network will establish a platform for potential pilot projects for coordinated testing
activities within sub-groups of the Network, to see how coordinated testing and sharing test results
might work in practice. The Guiding Principles are yet to be agreed by the APEC EGEE&C, but could
serve as an interesting example for establishing cross-border and regional collaboration on MV&E.90
89 http://clasponline.org/en/Resources/MVEResources/MVEPublicationLibrary/2014-APEC-Workshop-Facilitates-
Collaboration-on-Compliance.aspx
90 See Annex II.

Regional Policy Roadmap for harmonization of AC standards in ASEAN economies 96
ANNEX 2
The APEC MV&E Regional Collaboration Guiding Principles
January 2015 - DRAFT
This document expresses an intention by willing APEC economies to collaborate on a regional
network focusing on sharing monitoring, verification and enforcement (MV&E) information and best
practices, in support of national energy efficiency Standards & Labelling (S&L) programs in the Asia
Pacific region. The principles below define the background and the needs for such a network.
Furthermore, the principles can serve as the basis for future cooperation and coordination between
the APEC economies, under the auspices of the APEC Expert Group Energy Efficiency & Conservation
(EGEE&C), and strategic partners.
A. Background for the Network
1.1. Standards and Labeling (S&L) programs are a proven policy approach for economies to save
energy, improve productivity and address climate change by mitigating emissions of greenhouse
gases;
1.2. Robust national and regional MV&E frameworks help ensure the benefits of S&L policies are
achieved and the risks to attaining program targets are mitigated;
1.3. MV&E information, market intelligence, and best practices exchange among economies in
the region can help programs improve product compliance, quality, consumer confidence, reduce
barriers to trade, and mitigate greenhouse gas emissions;
1.4. A peer-to-peer network can serve as a secure channel for the communication of, and
provide access to, discussions regarding program successes, issues, resource needs, and to share
market intelligence among and between economies;
1.5. Economies’ participation to the Network is on a voluntary basis. Economies are encouraged
to work collaboratively to define and identify activities to be undertaken by the Network for
leveraging and maximizing compliance resources and activities in the region.
B. Network activities could include, but are not limited to, the following:
2.1. Organisation or appointment of an administrative unit serving as the Secretariat for the
Network. The Secretariat would provide any necessary administrative support, to be agreed by the
Network, such as maintenance of a roster of primary contacts of MV&E agencies and officials or
personnel among the APEC economies participating in the network, and identification of other
practitioners that could participate in or contribute to the network.
2.2 Regular annual meetings for market surveillance authorities to meet their counterparts to
share recent compliance-related developments and program work plans, and to address common
compliance challenges.
2.2. Development and maintenance of communication mechanisms for network participants to
support and facilitate coordination and collaboration on MV&E activities.

Regional Policy Roadmap for harmonization of AC standards in ASEAN economies 97
2.3 An agreed upon mechanism for participants to share data, results, and provide support to
others while maintaining the need to preserve confidentiality of information where needed.
2.4. Ways to share product check-testing experiences, and to explore cost-effective methods for
check-testing and other market sampling techniques, as well as regional cooperation on such
efforts.
2.5. Exploration of potential collaboration with other APEC working groups and any related
international initiatives, such as the Sub-Committee on Standards and Conformance, the Asia
Pacific Laboratory Accreditation Cooperation (APLAC), and the International Laboratory
Accreditation Cooperation (ILAC), for issues related to laboratory capacity and testing accreditation
schemes, and to develop or recommend common/regionally-suited factors for consideration among
network participants.
2.6. Identification of and engagement with energy efficiency projects in the APEC, focused on
aligning or harmonizing product standards, to inform potential collaborative and coordinated MV&E
activities for the network participants.
2.7. Identification of possible funding sources to support the development of a long-term
regional framework and activities identified by the members for the network, such as
implementation of a regional product test registry, a web-based system that may be used to record
and track product S&L compliance and testing information for participants.
The principles above were initiated by the participants of the APEC Compliance Best Practice
Workshop, held on 24 October 2014 in Beijing China, with support from the APEC EGEE&C, CLASP,
ICA, and UL as part of their joint efforts to promote energy-efficiency in the APEC region.
Economies that agree to the principles above will collaborate and agree on a roadmap for potential
activities undertaken by the Network.
Regional Policy Roadmap for harmonization of AC standards in ASEAN economies 98
APPENDIX
APPENDIX 1: Letter of Department of Alternative Energy
Development and Efficiency
APPENDIX 2: Harmonization of Energy Performance Standards for Air
Conditioners - A Regional Policy Roadmap
APPENDIX 3: Joint ministerial statement The Thirty Third ASEAN
Ministers on Energy Meeting (33rd AMEM)

Regional Policy Roadmap for harmonization of AC standards in ASEAN economies 99
APPENDIX 1

Regional Policy Roadmap for harmonization of AC standards in ASEAN economies 100
APPENDIX 2
Harmonization of Energy Performance Standards for Air
Conditioners - A Regional Policy Roadmap
Introduction:
Air conditioning represents a large proportion (up to 50%91) of electricity demand in the
residential and commercial sectors in ASEAN economies. The market of room air conditioners
is expected to grow at a pace of at least 10% per year over the next 5 years92, further increasing
energy demand. The economies of the ASEAN countries are moving towards a common market
by 2016. It becomes imperative that the product performance standards are harmonized. A
number of efforts have already taken place for harmonizing electro technical standards for
various products. This paper describes the policy roadmap for the harmonization of energy
performance standards of small and medium residential air conditioners. This regional policy
roadmap closely follows the ASEAN Plan of Action for Energy Cooperation (APAEC).
The policy roadmap herein, enumerates various components that have been recommended by
the policy and technical working groups of the ASEAN SHINE project and where concrete
action is required.
Objectives:
To provide clear guidelines in the adoption of policies to promote the use of more efficient air
conditioning equipment and define the targets to be achieved by all ASEAN countries with
regards to the adoption of harmonized energy performance standards of ACs by 2020.
Components:
1) Harmonization of Testing Methods: On the basis of various recommendations the ASEAN countries have agreed for a uniform testing method derived from ISO 5151- 2010. The testing method is to be adopted and notified by countries by 2016, with the exception of Cambodia, Laos, Myanmar to be adopted and notified by 2018. The countries also need to agree to take into consideration metrics to measure part-load energy performance, and any revision to ISO 5151- 2010 in the future. Any revision of the harmonized testing standards at the national level should be informed at the EE&C SSN.
2) Harmonization of Evaluation Methods: For fixed speed and inverted based ACs the ASEAN countries will report the performance as EER or CSPF. A common evaluation method namely CSPF using ISO 16358-1 may be considered by 2020.
91 International Copper Association, “Market Study for Harmonization of Energy Efficiency Standards for Air-conditioners and
Refrigerators in South-east Asia”, Research report, ICA, 15th November 2010. 92 Source: Euromonitor.

Regional Policy Roadmap for harmonization of AC standards in ASEAN economies 101
3) Harmonization of MEPS: The ASEAN countries will notify a minimum EER (also refers to weighted EER) of 2.9W/W or CSPF of 3.08W/W by 2020 as mandatory MEPS for all fixed and variable drive ACs below 3.52kWcapacities. The MEPS would be periodically reviewed and revised at an interval of 5 years or less
4) Testing Infrastructure: Establish an appropriate framework for round robin testing (RRT) and evaluation process for testing facilities by 2020.
5) Mutual recognition Agreements (MRA): The ASEAN countries would evaluate feasibility of incorporating energy performance testing into existing MRA (AHEEERR), or establish new MRAs if necessary by 2020 which would encompass the following elements:
Information exchange agreement Mutual recognition of test results Mutual recognition of certification Laboratory accreditation Inspection accreditation Testing certification Verification/Challenge/check testing
6) Reporting: By 2020 the ASEAN Center for Energy would establish a regional product database for collection of product information, starting with the EMTIPS programme. This would enhance information exchange between member countries and could help in providing alerts to non-compliance related cases. This tool could be specifically used to exchange information on products tested by official market surveillance authorities. The database can also be used to monitor programmes, prepare verification activities and eventually flag out products for which a declared characteristic is proven incorrect.

Regional Policy Roadmap for harmonization of AC standards in ASEAN economies 102
Figure 86: MEPS stringency and coverage (cooling capacity) in ASEAN economies for single split ACs and Harmonized MEPS
EER 2.9

Regional Policy Roadmap for harmonization of AC standards in ASEAN economies 103
APPENDIX 3

Regional Policy Roadmap for harmonization of AC standards in ASEAN economies 104
Regional Policy Roadmap for harmonization of AC standards in ASEAN economies 105

Regional Policy Roadmap for harmonization of AC standards in ASEAN economies 106

Regional Policy Roadmap for harmonization of AC standards in ASEAN economies 107

Regional Policy Roadmap for harmonization of AC standards in ASEAN economies 108

PROMOTION OF HIGHER EFFICIENCY AIR CONDITIONERS IN ASEAN: A REGIONAL POLICY ROADMAP