promisia integrative limitednzx-prod-s7fsd7f98s.s3-website-ap-southeast-2.amazonaws.com/...products...
TRANSCRIPT

Promisia Integrative Limited
Annual Report
31 December 2017

1
THE COMPANY
Promisia Integrative Limited is a company focused on developing and marketing unique natural
therapeutic products with proven safety and efficacy based on robust research. Our goal is to add
scientific methodology and validity to a sector that is often perceived to be unscientific.
FINANCIAL SUMMARY
31 December
2017
$ 000
31 December
2016
$ 000
Change
%
Revenue 2,332 2,665 (13)
Total comprehensive income attributable to
shareholders
(876) (450) 95
Total Assets 2,295 3,192 (28)
Earnings per share (0.002) (0.001) -
Net Tangible Asset Backing ($ per share) $0.004 $0.006 -
SIGNIFICANT EVENTS
November 2017 Marketing of Arthrem to pharmacies in Australia commenced with a
full television advertising campaign held in January 2018.
October 2017 Artevite (the canine equivalent to Arthrem) is released to distributors
with a full television advertising campaign held in January 2018 as
part of the group’s further product development.
October 2017 Appointment of a new CEO Rene de Wit.

2
Table of Contents
THE COMPANY ...................................................................................................................................... 1
FINANCIAL SUMMARY ......................................................................................................................... 1
SIGNIFICANT EVENTS .......................................................................................................................... 1
ANNUAL REPORT OF THE CHAIRMAN ............................................................................................. 3
PEOPLE – BOARD OF DIRECTORS ...................................................................................................... 6
GOVERNANCE ....................................................................................................................................... 7
INDEPENDENT AUDITOR’S REPORT ................................................................................................ 11
CONSOLIDATED FINANCIAL STATEMENTS .................................................................................... 14
NOTES TO THE CONSOLIDATED FINANCIAL STATEMENTS ......................................................... 18
SHAREHOLDER AND STATUTORY INFORMATION ........................................................................ 39
CORPORATE DIRECTORY AND SHAREHOLDER INFORMATION .................................................. 43

3
ANNUAL REPORT OF THE CHAIRMAN
On behalf of your directors I have pleasure in presenting the Annual Report for Promisia Integrative
Limited and its subsidiaries (“the Group”) for the year ended 31 December 2017.
Promisia Integrative Group Results
The financial result for the year was a loss of $876,000. This was a major disappointment to the
board and for shareholders after the promising outcome in 2016.
The directors had budgeted for a breakeven result for the year but this was not to be due to several
factors:
• The arrival in the market of several competitors had an impact on sales which were down 14%
on 2016
• A change of contracted sales force that proved to be less effective than expected.
• The delay in the launch of Artevite, the canine product, resulted in the expensing of significant
prelaunch costs of $153,000, including preparation of television advertisement, but very low
revenue
• The delay in entering the Australian market also incurred pre-launch costs of $87,000
without any offsetting revenue
New Zealand
The Arthrem sales of $2,293,000 in New Zealand was a good outcome considering the change in
marketing representatives and the advent of competition from two large competitors.
The contracted sales force engaged in late 2016 did not perform as expected and the arrangement was
terminated in December 2017. The success of Arthrem in 2016 generated interest from well-
established producers of dietary supplements and the release of well supported competing products
was not unexpected. Arthrem remained the bestselling product in its product category and was
generally the largest selling product in pharmacies each month by dollar value throughout 2017.
The new Chief Executive introduced a new sales and marketing strategy late in the year, including the
use of a telemarketer that called every pharmacy in the country and generated significant sales. The
directors considered that it was now appropriate for the company to employ its own dedicated sales
team. It is important that the company strengthens its relationships with its pharmacy customers and
a direct connection will provide better opportunities to respond to the market.
Australia
The launch of Arthrem in Australia took considerably longer than expected. Registration as a Listed
Complementary Medicine by the Therapeutic Goods Administration was achieved in April. By year
end a distribution agreement had been concluded with Pharmabroker Sales Pty Ltd to represent
Arthrem to pharmacies in the state of New South Wales. This state was chosen as the launch point for
Arthrem in Australia because of the high number of independent pharmacies in the state. Supporting
agreements with warehousing and distribution parties also needed negotiation and completion. This
process proved to be considerably more difficult and time consuming than expected.
Pharmabroker commenced marketing activities in November but the cost of television advertising was
prohibitive prior to Christmas. Promotion of Arthrem did not commence until late January and
therefore no revenue was received from Australia in 2017 to offset the not inconsiderable costs and
time expending during the year on this exercise. Arthrem is now available from over 600 pharmacies
in NSW.
Artevite
Finalisation of the formulation of Artevite also took considerably longer than anticipated and it was
only the efforts of our in-house team that resulted in the formulation being finalised in a stable form

4
late in the year. Brooklands Pet Products Ltd of New Plymouth was appointed in August as the
wholesaler and distributor for Artevite. Brooklands began the process of filling the retail pipeline in
November. Pre-Christmas advertising was not possible at an economical cost and therefore
promotion of Artevite did not commence until late January 2018. Pre-launch costs of $153,000,
including the cost of preparing a television advertisement, were incurred during the year without any
offsetting revenue.
New Chief Executive
On 9 October 2017 the company welcome Mr Rene de Wit as the new Chief Executive Officer of the
company. Rene has an extensive commercial background and has already added considerable value to
the management team.
In the period between the departure of the former CEO and the appointment of Rene de Wit the
company was fortunate to have the services of Tom Brankin, a director of the company and one of its
largest shareholders, in the role of Acting CEO. Tom made a significant commitment to the company
and pushed through the launch of both Arthrem in Australia and Artevite in New Zealand. The only
cost to the company for Mr Brankin’s time was his out of pocket travel and related expenses. On
behalf of his fellow directors and shareholders I wish to acknowledge and thank Tom for his input
over several months as Acting CEO.
Events since Balance Date
Share Placement
In January 2018 the company completed a placement of 47.75 million shares at a price of 2 cents per
share to raise $955,000 of additional capital. The directors wish to thank those participating in the
placement for their confidence in the company.
Medsafe Alert
On 15 February 2018 Medsafe issued an Alert advising that there was a risk of harm to the liver from
taking Arthrem. This Alert generated a high level of media coverage which did not provide any
context about the very low level of adverse reaction relative to the number of bottles of Arthrem sold
in the same period. The company has noted that Arthrem is one of a number of soft gel capsule
products containing Artemisia annua extract and grape seed oil and that it was unreasonable to single
out Arthrem when competing products are alleged by their manufacturers to be the same as Arthrem.
A total of 14 adverse reactions in the form of liver toxicity have been reported to Medsafe in the period
from February 2016 until December 2017, a period of 23 months. During that same period well in
excess of 200,000 bottles of Arthrem were sold. The reported adverse reaction rate is approximately 1
in 14,000 or 0.007%. The World Health Organisation describes an adverse reaction at a rate of 1 in
10,000 as being very rare.
Arthrem is sold in a 150 mg capsule and the recommended dose is one capsule to be taken twice daily,
morning and night. Competing products are sold in a single 300mg capsule to be taken once a day.
It is important to acknowledge that many thousands take Arthrem every day and experience only
beneficial outcomes. The company takes adverse reactions seriously but notes that the rate of adverse
reaction is extremely low.
Arthrem is one of the very few dietary supplements that has been subject to a placebo controlled
double blind clinical trial (results published in the December 2015 issue of Clinical Rheumatology)
and a follow up safety study (results published in the October 2016 issue of the New Zealand Medical
Journal).
In response to the Medsafe Alert the company has undertaken the following:
• Responded to both Medsafe and the Centre of Adverse Reactions Monitoring (CARM)
• Provided additional information to the Australian Therapeutic Goods Authority

5
• Worked closely with its pharmacy retailers in both New Zealand and Australia to provide
assurance about the safety of Arthrem
• Revised product labelling and point of sale material
The company has requested more details of the adverse reaction reports to determine if there is a
batch or other specific issue that has been responsible for a recent increase in the number of reported
incidents.
A significant majority of pharmacies contacted by the company have been supportive and continue to
stock and sell Arthrem.
Priorities for 2018
There will undoubtedly be an impact on sales as a result of the Medsafe Alert and budgets have been
revised accordingly. The priorities for 2017 will be:
• Restoring pharmacy and consumer confidence in Arthrem
• Creation of an in-house sales and marketing team. A Marketing Manager has joined the
company based in the Wellington office. A sales representative to service pharmacies in the
lower North Island has been appointed. An appointment is being negotiated for an Auckland
based representative.
• Building Arthrem as a credible brand in Australia where the product is sold as a Listed
Complementary Medicine with considerably greater freedom to describe its benefits
• Build the Artevite brand as a credible and effective product providing joint support to dogs
• Two new products have been finalised but the launch of those products will be cash flow
dependant and may be deferred until late in 2018 or sometime in 2019.
The company is well funded and has amended its budgets to reflect recent events. The directors are
confident that the setback of the last few weeks can be overcome and thank you for your continued
support.
Stephen Underwood
Chairman

6
PEOPLE – BOARD OF DIRECTORS
Mr S. Underwood BCA LLB (VUW) Chairman
Stephen Underwood is a business and management consultant with an extensive background in
venture capital investment. He is a director of a number of private companies.
Mr M.D. Priest
Duncan Priest has a long association with the New Zealand capital markets, equity financing and
investment banking. He has considerable experience in raising capital from both the retail and
wholesale markets.
Mr T.D. Brankin Dip Agriculture & Dip Farm Management (Lincoln)
Thomas Brankin is a New Plymouth based businessman with significant interests in rest homes,
hospitals and retirement villages. His other interests include commercial and residential property and
farm management software.
Ms H. Down BCA (VUW) FCIM
Helen Down is a well known Wellington-based subject matter expert in both marketing and
governance. Helen is recognised for being instrumental in the growth of innovative and exciting small
and medium sized businesses, especially across the STEMM sectors.
MANAGEMENT
Mr Rene de Wit MSc Chem/MBA (Otago) CEO
Rene de Wit is an accomplished CEO and Change Manager with 25 years’ experience in FMCG, Food
Manufacturing, Printing, Packaging, Import/Export, Financial Services and Logistics. He has worked
in corporate, privately owned and own business, specialising in turnarounds and change management.

7
GOVERNANCE
The overall responsibility for ensuring that the Company is governed appropriately rests with the
Board of Directors, ensuring that they enhance investor confidence through good corporate
governance practice and accountability in accordance with the Promisia Group Corporate Governance
Code – refer to www.promisia.com for the full document.
THE BOARD OF DIRECTORS
A key responsibility of the Board is to formulate the Company’s strategic direction. In addition, the
Board must have oversight of the financial and operational controls of the business including its risk
management policies and strategies.
The Board also has responsibility for fostering corporate culture, the appointment and remuneration
of its senior executives, the adoption of corporate policies and plans and the approval of major
transactions.
Selection and Role of Chairman
The Chairman is selected by the Board from the non-executive directors. The Chairman’s role is to
manage the Board in an effective manner and provide leadership in the conduct of the Board’s
business and to facilitate the Board’s interaction with the Company’s CEO.
Board Membership
The Board consists currently of three independent directors and one non-independent director as
defined under NZX Rules. All four directors are non-executive directors and were appointed by the
Board and have been confirmed in the role by shareholders at a duly constituted meeting. Their
selection has been based on the value they bring to the Board table including their skills, commercial
experience, strategic thinking and general business acumen.
As at 31 December 2017 the Board was as follows:
Stephen Underwood Chairman and Non-Executive Director
Duncan Priest Non-executive Director
Thomas Brankin Non-executive Director
Helen Down Non-executive Director – appointed 30 May 2017
Brief profiles of the current board members are detailed on page 6 of this report.
Director Independence
In order for a director to be independent, the Board has determined that he or she must not be an
executive of Promisia Integrative Limited and must have no disqualifying relationship. The Board
follows the guidelines of the NZX Listing Rules.
The Board has determined that Helen Down, Duncan Priest, and Stephen Underwood are
independent directors.
Thomas Brankin and associated interests hold a 9.66% shareholding in Promisia Integrative Limited.
He also acted as Acting CEO of the group during the year until October 2017. He is therefore not
independent.
Nomination and Appointment of Directors
The Board is responsible for identifying suitable director candidates for consideration by the Board.
Directors may also be nominated by shareholders under Listing Rule 3.2.2.

8
A director may be appointed by an ordinary resolution of shareholders and all directors are subject to
removal by ordinary resolution.
The Board may, at any time, appoint additional directors. However, a director shall only hold office
until the next annual meeting of the Company, but shall be eligible for election at that meeting.
One third of directors shall retire from office at the annual meeting each year. The directors to retire
shall be those who have been longest in office since they were last elected or deemed to be elected.
Directors’ Meetings
The number of meetings attended by directors during the year is detailed in the table below.
Board Meeting Audit Committee
Director Held Attended Held Attended
Stephen Underwood 9 9 - -
Duncan Priest 9 9 - -
Thomas Brankin 9 9 - -
Helen Down 9 7 - -
Disclosure of Interests by Directors
The Company maintains an Interests Register in which particulars of certain transactions and matters
involving directors must be recorded. The Interests Register for Promisia Integrative Limited and
subsidiaries is available for inspection at its registered office.
Details of matters entered into the register by individual directors are outlined on pages 41 and 42 of
this report.
Directors’ Share Dealings
As part of its corporate governance code of practice and charter development the Company has
adopted a formal share dealing policy which sets out the procedure to be followed by directors and
staff in the event of trading in Promisia Integrative Limited shares to ensure that no trades are
affected while that person is in possession of price sensitive information. Details of director and staff
share transactions are outlined on page 41.
Indemnification and Insurance of Directors and Officers
The Company holds Directors and Officers liability insurance.
BOARD COMMITTEES
Presently the Board operates only one committee, being the Audit Committee. Matters concerning
nominations to the Board of Directors and remuneration are dealt with by the full Board in keeping
with the size of the Company.
Audit Committee
The role of the Audit Committee is to assist the Board in carrying out its responsibilities under the
Companies Act 1993 as it concerns accounting practices, policies and controls relative to the
Company’s financial position and to make appropriate enquiry into any audit of the Company’s
financial statements. This responsibility includes providing the Board with additional assurance about
the quality and reliability of any financial information issued publicly by the Company from time to

9
time. Ultimately the Board as a whole is responsible for the accuracy and relevance of the Company’s
financial statements. The Audit Committee provides additional and more specialised oversight. The
Audit Committee also reviews the operation of internal controls together with the quality and cost of
the external audit undertaken by the Company’s auditors.
The Audit Committee comprises two non-executive directors one whom which has special expertise in
financial matters. The Audit Committee members are Stephen Underwood (Chair) and Duncan Priest.
The Audit Committee did not meet during the financial year, attending to all matters through the full
board meetings.
Remuneration Committee
During the 2017 financial year the full Board dealt with the functions of the Remuneration Committee.
Matters considered related to the remuneration, benefits and terms of employment of senior
executives of the Company, including the staff unpaid share scheme.
Nominations Committee
During the 2017 financial year the full Board dealt with the functions of the Nominations Committee.
Its function is to identify and recommend candidates for the position of director of the Company
taking into account the skills, experience and qualifications necessary to ensure that the Board works
as an effective unit.
REMUNERATION
Remuneration of both directors and Company executives is a responsibility of the Remuneration
Committee, being the full board. Details of director and executive remuneration, including
entitlements, are set out on page 41.
Remuneration of Directors
The amount paid currently to all non-executive directors is $17,000 per annum (other than the
Chairman). The Chairman is paid $49,000 per annum. Under NZX Listing Rule 3.5.2, the Board may
only make a payment to a director upon cessation or retirement from office with shareholder
approval. The Company’s policy is in line with best practice guidelines from the New Zealand Institute
of Directors and no directors are entitled to retirement payments.
Remuneration of Executives and Employees
Executive remuneration consists of a salary with the ability to participate in share options being
granted from time to time as an additional incentive.
During 2016 a staff bonus and unpaid share scheme was set up to remunerate the executive and staff
for their performance. As of April 2017, all staff are employed on a contracted salary or hourly rate
with entitlements to kiwi saver contributions.
Market Disclosure
The Board is committed to the promotion of investor confidence by ensuring that trading of its shares
takes place in an efficient, competitive and informed market.
The Company has in place procedures designed to ensure compliance with the NZX Listing Rules so
that:
• All investors have equal and timely access to material information concerning the Company,
including its financial situation, performance, ownership and governance.
• Company announcements are factual and presented in a clear and balanced form.
Accountability for compliance with disclosure obligations is with the Chairman and the Chief
Executive Officer. Significant market announcements, including the preliminary announcement of the
half year and full year results, the accounts for those periods and any advice of a change in earnings
forecast are approved by the Board.

10
Diversity
As at 31 December 2017 the gender balance of the Company’s directors and senior management was
as follows:
Directors Management
Male 3 1
Female 1 1
Total 4 2

11
Independent auditor’s report To the Shareholders of Promisia Integrative Limited Opinion We have audited the consolidated financial statements of Promisia Integrative Limited and its subsidiaries (the Group), which comprise the consolidated balance sheet as at 31 December 2017 and the consolidated statement of comprehensive income, consolidated statement of changes in equity and consolidated statement of cash flows for the year then ended, and a summary of significant accounting policies and other explanatory information. In our opinion, the accompanying consolidated financial statements present fairly, in all material respects, the consolidated financial position of the Group as at 31 December 2017, and its consolidated financial performance and its consolidated cash flows for the year then ended in accordance with New Zealand Equivalents to International Financial Reporting Standards (NZ IFRS). Basis for Opinion We conducted our audit in accordance with International Standards on Auditing (New Zealand) (ISAs (NZ)). Our responsibilities under those standards are further described in the ‘Auditor’s responsibilities for the audit of the consolidated financial statements’ section of our report. We are independent of the Group in accordance with Professional and Ethical Standard 1 (Revised) ‘Code of ethics for assurance practitioners’ issued by the New Zealand Auditing and Assurance Standards Board, and we have fulfilled our other ethical responsibilities in accordance with these requirements. We believe that the audit evidence we have obtained is sufficient and appropriate to provide a basis for our opinion. Other than in our capacity as auditor we have no relationship with, or interests in, Promisia Integrative Limited or any of its subsidiaries. Other Information The Directors are responsible for the other information. The other information comprises the annual report (but does not include the consolidated financial statements and our auditor’s report thereon). Our opinion on the consolidated financial statements does not cover the other information and we do not express any form of audit opinion or assurance conclusion thereon. In connection with our audit of the consolidated financial statements, our responsibility is to read the other information and, in doing so, consider whether the other information is materially inconsistent with the consolidated financial statements or our knowledge obtained in the audit or otherwise appears to be materially misstated. If, based on the work we have performed, we conclude that there is a material misstatement of this other information, we are required to report that fact. We have nothing to report in this regard. Key audit matters Key audit matters are those matters that, in our professional judgement, were of most
significance in our audit of the consolidated financial statements of the current period. These
matters were addressed in the context of our audit of the consolidated financial statements as a
whole and in forming our opinion thereon, and we do not provide a separate opinion on these
matters.
Moore Stephens Wellington Audit is a partnership of MP Czudaj and MK Rania. Moore Stephens Wellington Audit is an independent member firm of Moore Stephens International Limited - an association of independent member firms in principal cities throughout the world. Moore Stephens independent member firms in New Zealand are located in Auckland - Christchurch - Dunedin - Hawke’s Bay - Wairarapa - Wanganui - Wellington.

12
Key audit matter How our audit addressed the key audit matter 1. Valuation of inventory Refer to notes 2.d.(xiii) & 14. Inventory has been recognised in the consolidated financial statements with a value of $1,383,000. Valuation of inventory is considered a key audit matter due to the nature and significance of the asset to the Group’s consolidated statement of financial position. Inventory is stated at the lower of cost and net realisable value after making due allowance for obsolescence and degradation. Due to the nature of the raw material and finished inventory product, there is a risk that the carrying value of the inventory may not be recoverable due to degradation. Whether a write down in the inventory value is required involves judgement. Key judgements are considered in relation to sale forecasts, current sales performance, sale prices and inventory ageing.
• We reviewed and questioned management’s significant assumptions regarding the extent of any degradation of the raw material and finished Inventory product.
• We reviewed forecasted sales figures compared with actual for the current year and the Group’s on-going sales forecasts.
• We performed ratio analysis on both how quickly inventory is sold and the amount of inventories on hand relative to cost of sales and we considered inventory yields and ageing.
• We discussed the key assumptions with the directors and senior management and obtained written representations.
• We evaluated the related financial statement note disclosures.
2. Valuation of intangible assets Refer to notes 2.d.(xv) & 16. Intangible Assets have been recognised in the consolidated financial statements with a value of $125,000. Intangible Assets relate primarily to the website development and trademarks. Judgement is involved in terms of deciding whether website related expenditure should be expensed or capitalised as well as whether there is any impairment in the assets value. For these reasons, valuation of intangibles is considered a key audit matter. Research and Development Costs not meeting the criteria for capitalisation as required by NZ IAS 38 – Intangible Assets, are expensed. At each reporting date the Group reviews the carrying amounts of its intangible assets to determine whether there is any indication that those assets have suffered an impairment loss. The cash generating unit identified by the Group to which the Intangible asset is allocated for impairment testing is the sale of the Group’s product - Arthrem. The impairment assessment requires judgement. The key judgement is considered to be in relation to sales forecasts and sale history. The website is amortised over a 5 year period. Trademarks are not amortised.
• We reviewed all significant supplier invoices relating to website expenditure and assessed the accounting treatment in accordance with NZIAS 38.
• We requested and reviewed the reasonableness of the assumptions in the Group’s impairment assessment.
• We assessed the Group’s earnings forecasts with reference to actual historical earnings and post balance date earnings.
• We considered if the amortisation of website costs was appropriate
• We questioned the directors’ assumptions used in the company’s impairment model on intangibles, described in note 2.d (xv) to the consolidated financial statements. We verified the reliability of the information on which the expectations have been based and assessed the reasonableness, relevance and consistency of the assumptions applied.
• We evaluated the related financial statement note disclosures.

13
Director’s responsibilities for the consolidated financial statements The directors are responsible on behalf of the Group for the preparation and fair presentation of the financial statements in accordance with New Zealand Equivalents to International Financial Reporting Standards (NZ IFRS), and for such internal control as the directors determine is necessary to enable the preparation of financial statements that are free from material misstatement, whether due to fraud or error. In preparing the financial statements, the directors are responsible on behalf of the Group for assessing the Group’s ability to continue as a going concern, disclosing, as applicable, matters related to going concern and using the going concern basis of accounting unless the directors either intend to liquidate the Group or to cease operations, or have no realistic alternative but to do so. Auditor’s responsibilities for the audit of the consolidated financial statements Our objectives are to obtain reasonable assurance about whether the consolidated financial statements as a whole are free from material misstatement, whether due to fraud or error, and to issue an auditor’s report that includes our opinion. Reasonable assurance is a high level of assurance, but is not a guarantee that an audit conducted in accordance with ISAs (NZ) will always detect a material misstatement when it exists. Misstatements can arise from fraud or error and are considered material if, individually or in the aggregate, they could reasonably be expected to influence the decisions of users taken on the basis of these consolidated financial statements. A further description of the auditor’s responsibilities for the audit of the consolidated financial statements is located at the XRB’s website at http://www.xrb.govt.nz/standards-for-assurance-practitioners/auditors-responsibilities/audit-report-1/ The engagement leader on the audit resulting in this independent auditor’s report is Darren Wright. This report is made solely to the shareholders of the Group. Our audit has been undertaken so that we might state to the shareholders those matters we are required to state to them in an auditors’ report and for no other purpose. To the fullest extent permitted by law, we do not accept or assume responsibility to anyone other than the shareholders, for our audit work, for this report, or for the opinions we have formed. Moore Stephens Wellington Audit | Wellington, New Zealand 21 March 2018

14
FINANCIAL STATEMENTS
PROMISIA INTEGRATIVE LIMITED
CONSOLIDATED STATEMENT OF COMPREHENSIVE INCOME
For the year ended 31 December 2017
GROUP Note
2017 $000
2016 $000
Revenue
2,332
2,665
Cost of Goods Sold 3 (642) (773)
1,690 1,892
Other income 76 -
Expenses
Administration 4 (923) (661)
Operating 4 (1,379) (1,432)
Research 4 (258) (191)
Amortisation and depreciation 4 (23) (23)
Total Expenses (2,583) (2,307)
OPERATING LOSS (817) (415)
Finance costs – interest paid (64) (55)
Finance income – interest received 22 11
LOSS BEFORE INCOME TAX (859) (459)
Income tax expense 5 - -
NET LOSS FOR YEAR (859) (459)
OTHER COMPREHENSIVE INCOME
Items that may be subsequently reclassified to profit or loss
- -
Currency translation differences 9 (17) 9
TOTAL COMPREHENSIVE LOSS FOR YEAR ATTRIBUTABLE TO SHAREHOLDERS
(876)
(450)
EARNINGS PER SHARE
Basic earnings per share 11 $(0.002) $(0.001)
Diluted earnings per share 11 $(0.002) $(0.001)
All revenue, expenses and the net loss relate to the continuing operations of the Group. The net loss and
comprehensive loss were all allocated to company shareholders.
This statement should be read in conjunction with the notes to the financial statements

15
PROMISIA INTEGRATIVE LIMITED
CONSOLIDATED STATEMENT OF CHANGES IN EQUITY
For the year ended 31 December 2017
GROUP SHARE CAPITAL
FOREIGN CURRENCY
RESERVE
SHARE OPTION
RESERVE
ACCUM LOSSES
TOTAL
$000 $000 $000 $000 $000
Equity at 31 December 2015 54,225 185 57 (53,932) 535
Total comprehensive loss for the year
- - - (459) (459)
Other comprehensive income - 9 - - 9
Share Issue 1,557 - - - 1,557
Share based payment - - 43 - 43
Expired/Retired share options 17 - (17) - -
Equity at 31 December 2016 55,799 194 83 (54,391) 1,685
Total comprehensive loss for the year
- - - (859) (859)
Other comprehensive income - (17) - - (17)
Share Issue 167 - - - 167
Share based payment - - 43 - 43
Expired/Retired share options 75 - (75) -
Equity at 31 December 2017 56,041 177 51 (55,250) 1,019
This statement should be read in conjunction with the notes to the financial statements.

16
PROMISIA INTEGRATIVE LIMITED
CONSOLIDATED STATEMENT OF FINANCIAL POSITION
As at 31 December 2017
GROUP Note 2017 $000
2016 $000
Equity
Share Capital 6 56,041 55,799
Accumulated Losses 7 (55,250) (54,391)
Other Equity Reserves 8 228 277
TOTAL EQUITY 1,019 1,685
Represented By :
Current Assets
Bank 324 1,827
Receivables 12 238 258
Inventory 14 1,383 811
Prepayments 13 137 84
Tax Receivable 6 5
TOTAL CURRENT ASSETS 2,088 2,985
Non-Current Assets
Other Assets 17 75 75
Intangible Assets 16 125 127
Property, Plant & Equipment 15 7 5
TOTAL NON CURRENT ASSETS 207 207
TOTAL ASSETS 2,295 3,192
Current Liabilities
Payables and Accruals 18 316 468
Employee benefits 41 -
Loan 19 480 120
TOTAL CURRENT LIABILITIES 837 588
NON CURRENT LIABILITIES
Loan 19 439 919
TOTAL LIABILITIES 1,276 1,507
NET ASSETS 1,019 1,685
Authorised for issue on behalf of the Board
Stephen Underwood Tom Brankin Wellington Chairman Director 21 March 2018
This statement should be read in conjunction with the notes to the financial statements.

17
PROMISIA INTEGRATIVE LIMITED
CONSOLIDATED STATEMENT OF CASH FLOWS
For the year ended 31 December 2017
GROUP Note 2017 $000
2016 $000
OPERATING ACTIVITIES
Cash was provided by (applied to):
Receipts from customers 2,926 2,848
Payments to suppliers and employees (4,410) (3,468)
Net interest paid (42) (44)
NET CASH USED IN OPERATING ACTIVITIES
24
(1,526)
(664)
INVESTING ACTIVITIES
Cash was provided from (applied to):
Purchase property, plant & equipment (5) (5)
Purchase intangible assets (19) (35)
NET CASH USED IN INVESTING ACTIVITIES (24) (40)
FINANCING ACTIVITIES
Cash was provided from (applied to):
New share capital 167 1,510
Repayment of loan 25 (120) -
NET CASH FROM FINANCING ACTIVITIES
47
1,510
NET CHANGE IN CASH HELD (1,503) 806
Bank at beginning of year 1,827 1,021
BANK AT END OF YEAR 324 1,827
This statement should be read in conjunction with the notes to the financial statements.

18
NOTES TO THE CONSOLIDATED FINANCIAL STATEMENTS
1. General Information
The financial statements presented are those of Promisia Integrative Limited (the company) and its
subsidiaries (the group). The Group’s principal activities are focused on developing and marketing
unique therapeutic natural products with proven safety and efficacy based on robust scientific
research.
The company is registered under the Companies Act 1993 and is a Financial Markets Conduct 2013
reporting entity in terms of the Financial Reporting Act 2013. The group is profit-oriented.
Promisia Integrative Limited is a company domiciled and incorporated in New Zealand. The
registered office of the company is Level 4, 22 Panama Street, Wellington.
2. Statement of Accounting Policies
(a) Basis of Preparation
The financial statements have been prepared under the historical cost convention.
These financial statements have been prepared in accordance with generally accepted accounting
practice in New Zealand, which is the New Zealand equivalent to International Financial Reporting
Standards (NZIFRS). They also comply with International Financial Reporting Standards.
The financial statements are presented in New Zealand dollars which is the group’s functional and
presentation currency and rounded to the nearest thousand dollars unless stated otherwise.
(b) Going concern
The Promisia Group has generated sales of $2,332,000 (2016: $2,665,000) and net losses of
$876,000 (2016: $450,000) during the year ended 31 December 2017. At year end the consolidated
statement of financial position records a position of positive working capital and equity.
It is the continuing opinion of the board of directors that there are reasonable grounds to believe that
operational and financial plans in place are achievable and accordingly the group is able to continue as
a going concern and meet its debts as and when they fall due. Accordingly, use of the going concern
assumption remains appropriate in these circumstances.
In arriving at this position the directors have considered the following pertinent matters:
1. The group raised additional capital in January 2018 of $955,000 – see note 31.
2. The additional capital raised is being used to support the launch of Arthrem into the Australian market and fund market development in New Zealand for Artevite (the canine equivalent of Arthrem).
3. The directors are continuously assessing new options in the Group and together with the initiatives undertaken in 2016 and 2017 this will assist the Company in its next phase of growth with the development and commercialisation of its other products.
4. The loan from Wells Investments Ltd – see Note 19.
5. Considered the impact of the Medsafe announcement - see Note 31.
(c) Significant accounting estimates and judgements
The preparation of the financial statements in conformity with NZIFRS requires the use of certain
critical accounting estimates. It also requires management to exercise judgment in the process of
applying the Group’s accounting policies. Estimates and judgments are continually evaluated and are
based on historical experience and other factors, including expectations of future events that are
believed to be reasonable under the circumstances. The Group makes estimates and assumptions
about the future. The resulting accounting estimates will by definition seldom equal related actual

19
results. The estimates and assumptions that have a risk of causing a material adjustment to the
carrying value of assets and liabilities within the next financial year are discussed below:
Share based payments
The significant estimates and assumptions involved in measuring the cost of equity settled
transactions with directors and management (Note 6.4).
Impairment of intangible assets
Intangible assets are amortised and are tested for impairment when events or changes in
circumstances indicate the carrying value may not be recoverable (Note 16).
Inventory
Inventory has been reviewed for obsolescence and all old inventories have been fully written off in
accordance with the group’s inventory policy.
(d) Specific accounting policies
The following specific accounting policies which materially affect the measurement of profit and the
financial position have been applied.
(i) Basis of consolidation — purchase method
The consolidated financial statements include the company and its subsidiaries accounted for using the
purchase method. All significant inter-company transactions are eliminated on consolidation.
(ii) Statement of Cash flows
For the purpose of the cash flow statement, cash includes cash on hand, deposits held at call with
banks, and investments in money market instruments, net of bank overdrafts.
Cash flows are presented in the statement of cash flows on a GST inclusive basis, except for the GST
components of investing and financing activities, which are disclosed as operating cash flows.
(iii) Foreign currencies
Transactions in foreign currencies are initially recognised in the functional currency of the relevant
operating unit. At balance date, foreign monetary assets and liabilities are translated at the closing rate,
and exchange variations arising from these translations are recognised in the income statement. The
assets and liabilities of foreign operations, whose functional currency is not the New Zealand dollar, are
translated at the closing rate. Revenue and expense items are translated at the spot rate at the
transaction date or a rate approximating that rate. Foreign currency exchange differences are
recognised in the foreign currency translation reserve.
(iv) Goods and Services Tax (GST)
The statement of comprehensive income has been prepared exclusive of GST. All items in the
statement of financial position are stated net of GST with the exception of receivables and payables
which include GST invoiced. Operating cash flows are presented on a GST inclusive basis.
(v) Revenue
Revenue on sales of goods is recognized when they are delivered and ready for use by the customer and
recorded at net of discounts allowed.
(vi) Government Grants
Government and other grants are recognised where there is reasonable assurance that the grant will be
received and all attached conditions will be complied with. When the grant relates to an expense item,
it is recognised as income on a systematic basis over the periods that the related costs, for which it is
intended to compensate, are expensed. When the grant relates to an asset, it is recognised as income in
equal amounts over the expected useful life of the related asset.

20
(vii) Taxation
The income tax expense charged to the statement of comprehensive income includes both the current
year’s provision and the income tax effect of (i) Taxable temporary differences, except those arising
from initial recognition of goodwill and other assets that are not depreciated; and (ii) Deductible
temporary differences to the extent that it is probable that they will be utilised. Temporary differences
arising from transactions, other than business combinations, affecting neither accounting profit nor
taxable profit are ignored.
Tax effect accounting is applied on a comprehensive basis to all timing differences. A deferred tax asset
is only recognised to the extent that it is probable there will be future taxable profit to utilise the
temporary differences.
(viii) Share capital
Ordinary shares are classified as equity. Direct costs of issuing shares are shown as a deduction from
the proceeds of the issue. Where share options issued have expired then share capital includes an
adjustment for the expired share option cost as transferred from the option reserve.
(ix) Share based payments
The Group measures the cost of equity-settled transactions with directors and management by
reference to the fair value of the equity instruments at the date at which they are granted. Estimating
fair value for share-based payment transactions requires determination of the most appropriate
valuation model, which is dependent on the terms and conditions of the grant. This estimate also
requires determination of the most appropriate inputs to the valuation model including the expected
life of the share option, volatility and dividend yield and making assumptions about them. The
assumptions and models used for estimating fair value for share-based payment transactions are
disclosed in Note 6.4.
All share-based remuneration is ultimately recognised as an expense in profit or loss with a
corresponding credit to share option reserve. If vesting periods or other vesting conditions apply, the
expense is allocated over the vesting period, based on the best available estimate of the number of
share options expected to vest.
Upon exercise of share options, the proceeds received net of any directly attributable transaction costs
are allocated to share capital.
(x) Financial instruments
Non-derivative financial instruments comprise trade and other receivables, cash and cash equivalents,
other assets (being the NZX listing bond), loans and advances to others, trade and other payables and
term borrowings. They are all classified as loans and receivables and are recognised initially at fair
value plus any directly attributable transaction costs.
Subsequent to initial recognition, these financial instruments are measured at amortised cost using
the effective interest method, less any impairment losses. Due to their short-term nature, the carrying
value of cash and cash equivalents, trade and other receivables, trade and other payables
approximates their fair value.
A financial instrument is recognised if the Group becomes a party to the contractual provisions of the
instrument. Financial assets are derecognised if the Group’s contractual rights to the cash flows from
the financial assets expire or if the Group transfers the financial asset to another party without
retaining control or substantively all risks and rewards of the asset. Financial liabilities are
derecognised if the Group’s obligations specified in the contract expire or are discharged or cancelled.
Cash and cash equivalents comprise cash balances and deposits. Bank overdrafts that are repayable on
demand and form an integral part of the Group’s cash management are included as a component of
cash and cash equivalents for the purpose of the Consolidated Statement of Cash Flows.

21
The Group does not have any derivative financial instruments or any other financial assets or
liabilities that are classified as instruments at fair value through profit and loss under NZ IFRS.
(xi) Receivables and payables
Receivables and payables are initially recorded at fair value and subsequently carried at amortised cost
using the effective interest method. Due allowance is made for impaired receivables (doubtful debts).
(xii) Employee benefits
A liability for short-term employee benefits accruing to employees in respect of salaries and annual
leave other than termination benefits, that are expected to be settled wholly within 12 months after the
end of the reporting period are accrued and recognised in the consolidated statement of financial
position. Short-term employee benefits as a result of employee services are measured at the
undiscounted amounts expected to be paid when the liabilities are settled.
The group has no long term benefits.
(xiii) Inventories
Inventories are stated at the lower of cost, determined on a first-in first-out basis, and net realisable
value after making any allowance for obsolescence or degradation. In particular, certain inventory
which is older than 6 years is discounted by 30%. The cost of work in progress and finished goods
includes the cost to purchase the inventory and transport it to its current location.
(xiv) Investments
Investments are valued at the lower of cost and market value. Where in the opinion of the directors
there has been a permanent diminution in the value of investments this has been recognized in the
current period. Shares in unlisted companies cannot be valued reliably. They are therefore carried at
cost less any impairment losses. Should any impairment losses be suffered they will not be reversed
even if the circumstances leading to the impairment are resolved.
(xv) Intangible Assets
Acquired computer software licences are capitalised on the basis of the costs incurred to acquire and
install the specific software. Costs that are associated directly with the development of software are
recognised as intangible assets where the following criteria are met:
For external developed software - expenditure on the research phase of a project to develop new
customised software for e-commerce platforms is recognised as an expense as incurred. Costs that are
directly attributable to a project’s development phase are recognised as intangible assets, provided
they meet the following recognition requirements: (i) the development costs can be measured reliably
(ii) the project is technically and commercially feasible (iii) the Group intends to and has sufficient
resources to complete the project (iv) the Group has the ability to use or sell the software (v) the
software will generate probable future economic benefits.
Development costs not meeting these criteria for capitalisation are expensed as incurred.
The useful lives of the Group’s intangible assets excluding trademarks are assessed to be finite. Assets
with finite lives are amortised over their useful lives and tested for impairment whenever there are
indications that the assets may be impaired. Trademarks are not amortised and are reviewed
annually to ensure they are still applicable and registered.
Amortisation is recognised in the statement of comprehensive income on a straight-line basis over the
estimated useful life of the intangible asset of 3 to 5 years, from the date it is available for use.
(xvi) Plant and equipment
Plant and equipment is initially recorded at cost. When an item of property, plant and equipment is
disposed of any gain or loss is recognised in the Consolidated Statement of Comprehensive Income
and calculated as the difference between the sale price and the carrying value of the item.

22
Depreciation is provided for on a diminishing value basis on all plant and equipment at depreciation
rates calculated to allocate the assets’ cost or valuation less estimated residual value over their
estimated useful lives.
Major depreciation periods are plant and equipment 5 to 15 years.
Assets are fully written off when no longer in use by the Group.
(xvii) Impairment
At each reporting date, the group reviews the carrying amounts of its tangible and intangible assets to
determine whether there is any indication that those assets have suffered an impairment loss. If any
such indication exists, the recoverable amount of the asset is estimated in order to determine the extent
of the impairment loss (if any).
Recoverable amount is the higher of the fair value less costs to sell and value in use.
If the recoverable amount of an asset is estimated to be less than its carrying amount, the carrying
amount of the asset is reduced to its recoverable amount. An impairment loss is recognised in profit or
loss immediately, unless the relevant asset is carried at fair value, in which case the impairment loss is
treated as a revaluation decrease.
Where an impairment loss subsequently reverses, other than for goodwill, the carrying amount of the
asset is increased to the revised estimate of its recoverable amount, but only to the extent that the
increased carrying amount does not exceed the carrying amount that would have been determined had
no impairment loss been recognised for the asset in prior years. A reversal of an impairment loss is
recognised in the statement of comprehensive income immediately, unless the relevant asset is carried
at fair value, in which case the reversal of the impairment loss is treated as a revaluation increase.
(xviii) Changes in accounting policies
The group has changed the basis of presenting its cash flows in the statement of cash flows to the direct
method where cash flows are presented in the statement of cash flows on a gross basis, except for the
GST components of investing and financing activities, which are disclosed as operating cash flows.
Previously cash flows were presented on a net of GST basis. Cash flows for the 2017 and 2016 year
have been restated on this new basis. The change in this accounting policy results in no overall change
to the net cash used in or from operating activities and is only the applicable to the restatement of
the individual components of the operating activity cash flows being receipts from customers and
payment to suppliers.
There have been no changes to the accounting policies for the year ended 31 December 2017.
Adoption status of relevant new financial reporting standards and interpretations:
(i) There were no new standards or interpretations effective for the first time for periods beginning
on or after 1 January 2017 that had a significant effect on the Group’s financial statements as at
31 December 2017, although an amendment to NZ IAS 7 Statement of Cash Flows has resulted in
a reconciliation of liabilities arising from finance liabilities disclosed for the first time in Note 25.
(ii) A number of new standards and amendments to standards became effective for early adoption
for annual periods beginning after 1 January 2017. The standards relevant to the Group are as
follows: NZ IFRS 9 Financial Instruments (effective 1 January 2018) , NZIFRS 15- Revenue from
Contracts with Customers (effective 1 January 2018) and NZ IFRS 16: Leases (Effective for
periods beginning on or after 1 January 2019). The group’s assessment of the impact of adopting
these standards is expected to be immaterial. All standards will be adopted at the appropriate
date required.

23
3. Cost of Goods Sold
GROUP 2017 $000
2016 $000
At 1 January -inventory 811 591
Purchases 1,214 993
At 31 December - inventory (1,383) (811)
Cost of goods sold 642 773
4. Analysis of Expenses
GROUP 2017 $000
2016 $000
Administration
Auditor’s remuneration 26 38
Directors’ fees 93 74
Foreign exchange (gain) loss (16) 10
NZX listing & registry 97 42
Rental 43 13
Share based payment 43 43
Staff & employment costs 388 180
Other 249 261
Total Administration 923 661
Operating
Distribution 248 210
Marketing 1,131 1,172
Other operating costs - 50
Total Operating 1,379 1,432
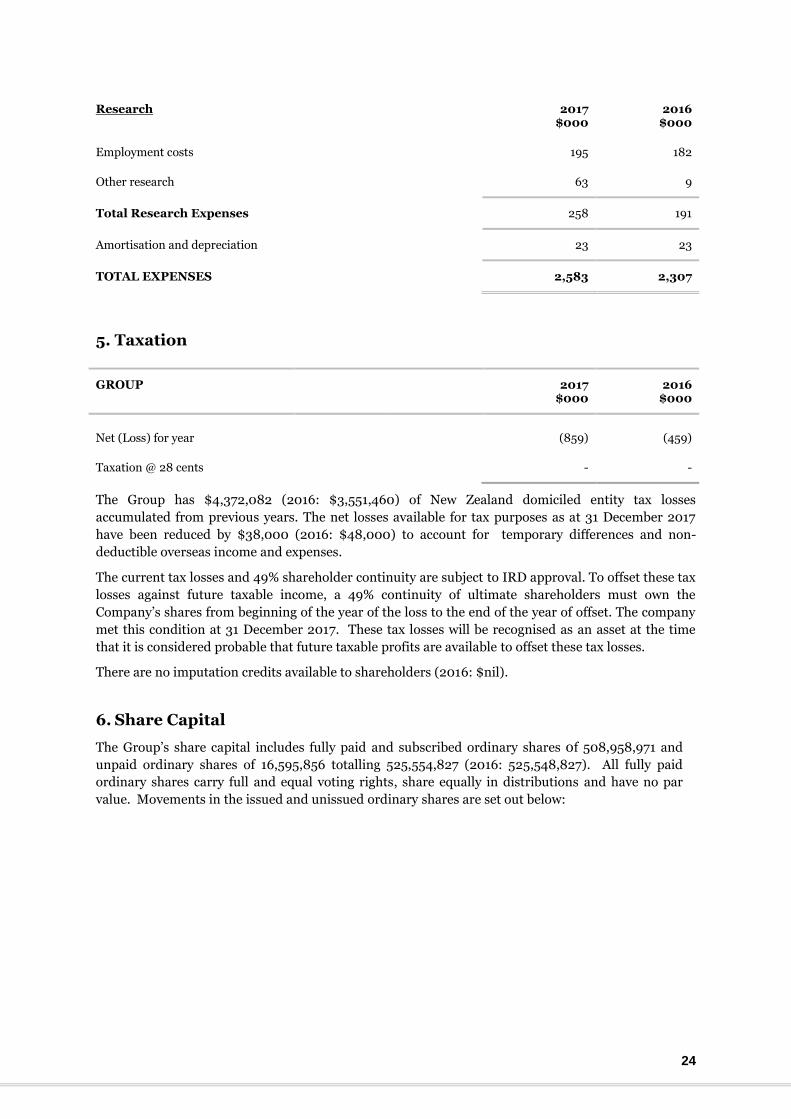
24
Research 2017 $000
2016 $000
Employment costs 195 182
Other research 63 9
Total Research Expenses 258 191
Amortisation and depreciation 23 23
TOTAL EXPENSES 2,583 2,307
5. Taxation
GROUP 2017 $000
2016 $000
Net (Loss) for year
(859) (459)
Taxation @ 28 cents - -
The Group has $4,372,082 (2016: $3,551,460) of New Zealand domiciled entity tax losses
accumulated from previous years. The net losses available for tax purposes as at 31 December 2017
have been reduced by $38,000 (2016: $48,000) to account for temporary differences and non-
deductible overseas income and expenses.
The current tax losses and 49% shareholder continuity are subject to IRD approval. To offset these tax
losses against future taxable income, a 49% continuity of ultimate shareholders must own the
Company’s shares from beginning of the year of the loss to the end of the year of offset. The company
met this condition at 31 December 2017. These tax losses will be recognised as an asset at the time
that it is considered probable that future taxable profits are available to offset these tax losses.
There are no imputation credits available to shareholders (2016: $nil).
6. Share Capital
The Group’s share capital includes fully paid and subscribed ordinary shares 0f 508,958,971 and
unpaid ordinary shares of 16,595,856 totalling 525,554,827 (2016: 525,548,827). All fully paid
ordinary shares carry full and equal voting rights, share equally in distributions and have no par
value. Movements in the issued and unissued ordinary shares are set out below:

25
6.1 Fully paid ordinary shares
There were 508,958,971 (2016: 498,510,841) fully paid ordinary shares on issue at balance date.
The ordinary shares do not have a par value.
2017 Number of
shares (000)
2016 Number of
shares (000)
2017 $000
2016 $000
At 1 January 498,511 435,532 55,799 54,225
New subscribed and paid capital 10,448 62,979 167 1,585
Expired/Retired options - - 75 17
Issue costs - - - (28)
At 31 December 508,959 498,511 56,041 55,799
During the year 10,488,130 ordinary shares were issued and purchased by staff as part of the Staff
Unpaid Share Scheme for a total of $167,000 ($0.16 per share). See Note 21.2 (e).
During 2016, 62,978,711 shares were issued for $0.25 per share as part of a rights issue for total
capital of $1,585,000 before directly related costs.
6.2 Unpaid ordinary shares – Treasury shares
There were 16,595,856 of unpaid ordinary shares (2016: 27,043,986) available for issue at balance
date as part of the Staff Unpaid Share Scheme for eligible staff, being employees or contractors, to
purchase.
During the year 10,448,130 unpaid ordinary shares were allocated and purchased by staff as part of
this scheme.
The unallocated and unpaid ordinary shares are held by a nominee company, Promisia Trustee
Limited - see Note 21.2 (e).
2017
Number of shares
2016
Number of shares
2017
$000
2016
$000
At 1 January 27,043,986 - - -
Unpaid subscribed shares (transferred)/ acquired to fully paid shares
(10,448,130) 27,043,986 - -
At 31 December 16,595,856 27,043,986 - -

26
6.3 Option Scheme
On 1 September 2014 the company granted further options totalling 17.08 million to the directors and
management of the company. See note 21.2 (c) for other details.
Movements in the number of share options outstanding and their related weighted average exercise
prices are as follows:
2017
Number of
options
2017 Weighted
average of exercise price
2016 Number of
options
2016 Weighted
average of exercise price
Outstanding at 1 January 15,310,000 $0.06 17,080,000 $0.06
Expired/Retired (8,000,000) $0.06 (1,770,000) $0.06
Outstanding at 31 December 7,310,000 $0.06 15,310,000 $0.06
The terms of issue of the options are -
The options (i) may be converted to ordinary shares by payment of $0.08 per share up to the expiry
date of 29 May 2018. (ii) may be transferred at any time provided the board approves the transfer. (iii)
will not give any right to participate in dividends or any new pro rata entitlement issues of securities of
the company until shares are allotted pursuant to the exercise of the options. (iv) shall vest annually
based on a prorated calculation over the life of the option from grant to expiry date.
Should the option holder cease to hold office, employment, provide consulting services, (except where
such cessation occurs as a result of a change in control of the company, with a change in control being
where a shareholder or group of associated shareholders become entitled to sufficient shares in the
company to give it or them the ability to replace all or a majority of the board of the company) the
relevant outstanding options of the option holder shall be forfeited and all rights and/or benefits in
relation to those options shall also be forfeited after a period of 30 days from the date of cessation of
holding office, employment and/ or consulting as the case may be.
6.4 Share based payments & options granted
During the year the share based payment expense recognised for options granted by the company
amounted to $42,707 (2016 $42,707.) See Note 10 for further details.
The fair value of the services rendered in exchange for the grant of the options are recognised as an
expense and the amount expensed is determined by reference to the fair value of the options granted.
There are no market or non-market performance conditions attached to the options granted.
When the options are exercised the company issues new shares and the proceeds received, net of any
directly attributable transaction costs are credited to the share capital and share premium accounts.
The fair value of the share options are estimated at the grant date using the Black - Scholes option
pricing model taking into account the terms and conditions upon which the share options were
granted.
The volatility was measured based on a statistical analysis of share prices over the last year and a
comparison of volatilities to other similar operating companies.

27
The inputs into the share option pricing model are as follows:
Options granted Issue
Grant date 1 Sept 2014
Vesting period ends 29 May 2018
Share price at date of grant 0.o42 cents
Volatility 50%
Option life 3.7 years
Risk free investment rate 3.61%
Fair value at grant date 0.0094 cents
Exercise price at date of grant 0.08 cents
Weighted average remaining contractual life
3.4 years
The sensitivity analysis of fair value of the options to volatility is presented in the following table:
Range of volatility
Volatility change by
Fair value will change by
Options 50% to 99% 1% 0.03
Options 100 to 149% 1% 0.02
Options 150% & more 1% 0.01
7. Accumulated Losses
GROUP 2017 $000
2016 $000
At 1 January (54,391) (53,932)
Net loss for the year (859) (459)
At 31 December (55,250) (54,391)

28
8. Other Equity Reserves
GROUP 2017 $000
2016 $000
Foreign currency – Note 9 177 194
Share option – Note 10 51 83
228 277
9. Foreign Currency Reserve
GROUP 2017 $000
2016 $000
At 1 January 194 185
Movement in foreign currency translation (17) 9
At 31 December – Note 8 177 194
This reserve comprises the foreign currency translation differences arising from the translation of the financial statements of the Group’s foreign entities into New Zealand dollars.
10. Share Option Reserve
GROUP 2017 $000
2016 $000
At 1 January 83 57
Share options granted to CEO/Directors 43 43
Expired and transferred to share capital (75) (17)
At 31 December – Note 8 51 83
All share based remuneration is ultimately recognised as an expense in the statement of comprehensive income with a corresponding credit to the share option reserve. At the time of any expiry or exercise of options, the amount of the reserve relating to the expiry or exercise of options is transferred to share capital.

29
11. Earnings per share
GROUP
2017 $000
2016 $000
Net Loss attributable to ordinary shareholders (876) (450)
Basic earnings per share $(0.002) $(0.001)
Diluted earnings per share $(0.002) $(0.001)
2017 2016
Number of shares
Number of shares
Weighted average number of shares for basic EPS 505,871 454,715
Weighted average number of shares for diluted EPS 514,515 456,594
The calculation of basic earnings per share is based on the loss from continuing operations
attributable to ordinary shareholders and the weighted average of total ordinary shares on issue
during the year. The calculation of diluted earnings per share is based on the loss from continuing
operations attributable to ordinary shareholders and the weighted average number of ordinary shares
assuming that the share options were exercised in full as at 31 December 2017 - see Note 6.3 for
further details
12. Receivables
GROUP
2017 $000
2016 $000
Current Receivables
Trade receivables 189 258
Sundry receivables 5 -
Other taxes 44 -
Total other receivables 49 -
Total current receivables 238 258
No provision for impairment over receivables was required during 2017.
13. Prepayments
GROUP 2017 $000
2016 $000
Overseas contractors 137 71
Other - 13
Total Prepayments 137 84

30
14. Inventory
GROUP 2017 $000
2016 $000
Raw materials and extract 736 715
Finished product 647 96
Total Inventory 1,383 811
No provision for impairment of inventory was required during 2017.
15. Property Plant & Equipment
GROUP 2017 $000
2016 $000
Plant & Equipment Gross carrying amount
At 1 January 5 -
Additions 4 5
At 31 December `9 5
Accumulated depreciation
At 1 January - -
Depreciation (2) -
At 31 December (2) -
Carrying amount at 31 December 7 5
16. Intangible Assets
GROUP 2017 $000
Website
2017 $000
Trademarks
2017 $000
Total
Gross carrying amount
At 1 January 142 22 164
Additions - 19 19
At 31 December 142 41 183
Accumulated amortisation
At 1 January (37) - (37)
Amortisation (21) - (21)
At 31 December (58) - (58)
Carrying Amount at 31 December 84 41 125

31
GROUP 2016 $000
Website
2016 $000
Trademarks
2016 $000
Total
Gross carrying amount
At 1 January 129 - 129
Additions 13 22 35
At 31 December 142 22 164
Accumulated amortisation
At 1 January (14) - (14)
Amortisation (23) - (23)
At 31 December (37) - (37)
Carrying Amount at 31 December 105 22 127
17. Other Assets
GROUP 2017 $000
2016 $000
NZX Listing Bond 75 75
18. Payables and Accruals
GROUP 2017 $000
2016 $000
Current
Trade payables 267 253
Other payables - 40
Accruals 49 175
Total Payables and Accruals 316 468
19. Loan
2017 $000
2016 $000
Current liability
Loan 480 120
Non-current liability
Loan 439 919
Total 919 1,039
On 22 October 2015, the Group entered into an updated loan agreement with Wells Investments Limited. Prior to this date the loan was fully repayable during 2015. At 31 December 2017 the balance of the loan was $918,718. The loan is to be repaid according to a fixed monthly repayment schedule that means it will be fully repaid by August 2019, with $50,000 monthly payments being made from May 2018. The loan is repayable by 1 December 2019 or earlier. Interest is charged at a rate of 5% per annum until 31 December 2016 and 6.5% from then until 1 December 2019.

32
Refer to note 31 - subsequent events for an update on the terms of the loan. Details of the security granted over the loan are set out in Note 20.
20. Securities Granted
Wells Investments Limited holds security over the assets of the Group in priority to all or any other
lender until such time the loan is repaid.
21. Related Party Information
The Group has related party relationships with its controlled entities, and key management as follows:
21.1 Investments in Subsidiaries
The subsidiaries (controlled entities) held by the parent company were as follows:
PRINCIPAL ACTIVITIES
COUNTRY OF
INCORPORATION
COST
$
INTEREST HELD BY
GROUP %
Promisia Limited Distribution &
Manufacture New Zealand - 100
Benefit Arthritis Limited Distribution New Zealand - 100
Promisia Trustee Limited Trustee New Zealand - 100
Promisia Australia Pty Limited Distribution Australia 113 100
Promisia LLC Distribution USA - 100
21.2 Related Party Transactions and Balances
(a) As at 31 December 2017, directors’ fees and expenses are owed to:
GROUP 2017 $
2016 $
S. Underwood 57,150 57,150
M.D. Priest - 411
Total 57,150 57,561
E.M.M. Johnson who resigned as a director on 3 June 2016 had director fees and expenses
owing to him of $92,748 at 31 December 2016.
During the year the company entered into related party transactions, consulting fees, of
$31,422, (2016 $nil ) with Helen Down, a director and shareholder of the company. All
transactions were conducted on normal trading terms.
(b) No debts with related parties have been written off or forgiven during the year. The loan and
advance balances by the directors are not secured and interest is not charged. One director has
undertaken not to demand settlement of these balances for a period of 12 months.

33
(c) As at 31 December 2017, the number of options granted to directors and management and outstanding:
Position Granted Outstanding Granted Outstanding
2017 000
2017 000
2016 000
2016 000
S. Underwood Director - 1,770 - 1,770
M.D. Priest Director - 1,770 - 1,770
T.D. Brankin Director - 1,770 - 1,770
Management - 2,000 - 10,000
Total - 7,310 - 15,310
(d) Transactions with key management
GROUP 2017 $000
2016 $000
Short term benefits - 100
Key management remuneration 177 180
Share based payment 43 43
(e) Staff Unpaid Share Scheme (“scheme”)
The company has established a Staff Unpaid Share Scheme which offers eligible employed and contracted staff (‘‘staff”) an entitlement to purchase unpaid shares in the company at a specified price on a one-off basis, with no assurance being given that any entitlement will arise in future years. The continued operation of the scheme and any further entitlements will be at the sole discretion of the company directors. Terms and conditions of the offer are as follows:
During 2016 27,043,986 unpaid shares were transferred at nil consideration to Promisia Trustee Limited, the company’s “nominee” company and offered to eligible staff at an issue price of $0.16 cents per share with future vesting and payment dates.
The unpaid shares will be allocated to staff on acceptance of an offer to them and held on their behalf by the nominee company. No payment is required immediately for the unpaid shares issued until they have been vested and called on by the company. Fully or partly paid shares allocated to staff will rank equally or on a proportionate basis to all other shares issued by the Company.
The company has also set up a bonus scheme for staff with bonuses being paid to staff net of tax based on achieving agreed sales and other targets as set by the board on an annual basis for the financial years ending 31 December 2016 and 31 December 2017.
During the year 10,488,130 (2016: nil) of the unpaid ordinary shares were purchased and paid up
in full by staff as part of the Staff Unpaid Share and Bonus Scheme for $167,000. (See note 6.1) If
staff do not make payment on the call dates for the unpaid shares allocated to them, then the
shares will revert to the nominee company.

34
22. Financial Instruments
The following financial assets and liabilities by categories are as follows:
GROUP 2017
Carrying Amount
$000
2017
Fair Value $000
2016
Carrying Amount
$000
2016
Fair Value $000
Cash 324 324 1,827 1,827
Receivables 238 238 258 258
Investments 75 75 75 75
Payables (357) (357) (468) (468)
Loan/Advances Payable (919) (919) (1,039) (1,039)
All carrying amounts of all financial assets are classified under the category of loans and receivables.
All financial liabilities are categorised at amortised cost.
Fair value measurement
The Group does not have any derivative financial instruments or any other financial assets or
liabilities that are classified as instruments at fair value through profit and loss under NZ IFRS.
The fair value of the financial assets and liabilities approximates their carrying value.
Interest Rate Risk
Interest rate risk is the risk that interest rates will change, increasing or decreasing the cost of
borrowing or lending. The holding company’s long term loans are at fixed interest rates. The interest
payable on the loan is fixed and set over a range at 6.5% per annum (2016: 5.0% per annum) for the
remainder of the term of the loan- see Note 19.
Credit Risk
Credit risk is the risk that an outside party will not be able to meet its obligations to the holding
company or group. Financial assets which will potentially subject the Group to concentrations of
credit risk consist principally of cash and receivables. The cash is placed with high credit quality
financial institutions with a minimum short term Standard and Poor’s credit rating of A-1. In the
normal course of its business, the Group incurs credit risk from receivables and transactions with
financial institutions. The maximum credit risk is the carrying amounts of trade receivables of
$189,000 which have an ageing duration of less than 6 months and no defaults - (2016 $258,000) –
see Note 12.
The Group does not require any collateral or security to support financial instruments as it only
deposits with, or loans to, banks and other financial institutions with high credit ratings. The Group
does not expect the non-performance of any obligations at balance date.
Currency Risk
Exposure to currency risk arises in the normal course of the Group’s business. The Group monitors
exchange rate movements in foreign currencies and will take any action necessary to reduce currency
risks where possible.
Liquidity Risk
The Group manages its liquidity risk by maintaining availability of sufficient cash and funding via
adequate credit and bank facilities. Owing to the nature of the underlying business, the Group aims to
maintain funding flexibility through committed credit lines. The Group manages liquidity risk by
monitoring actual and forecast cash flows on a regular basis and rearranging banking and credit
facilities where appropriate.

35
The table below analyses the Group’s non derivative financial liabilities into maturity groupings based
on the remaining period from balance date to the contractual maturity date if applicable. The amounts
disclosed are the contractual undiscounted cash flows.
GROUP Current Current Non-Current
Total
Within 6 months
6-12 months
1 to 5 years
$000 $000 $000 $000
Interest bearing loans 180 300 439 919
Payables and accruals 316 - - 316
Total 496 300 439 1,235
23. Segmental Reporting
The Group primarily derives its revenue from the sale of two products, with all revenue and assets
accounted for in New Zealand. The Group has a wide range of customers with no single customer
contributing more than 10% of the Group’s revenue. It only has one operating segment which has
been determined and based on financial information that is regularly reviewed by senior
management.
NZ IFRS 8 Operating Segments: permits the aggregation of operating segments into reportable
segments. This has been adopted as the Group has only one operating segment with similar economic
characteristics being the production processes, customers and distribution channels for its product.
Based on this analysis, no additional disclosure is required in the annual financial statements as the
Group has one reportable segment.
24. Reconciliation of Cash Flows from Operating Activities
GROUP 2017 $000
2016 $000
NET (LOSS) for the year (859) (459)
Adjustments for non-cash items:
-Amortisation 21 22
-Depreciation 2 -
-Foreign exchange differences (17) 9
-Share based payment benefits 43 43
Net changes in working capital:
Change in inventories (572) (249)
Change in payables and accruals (154) 113
Change in receivables, GST and prepayments 11 (143)
NET CASH FROM OPERATING ACTIVITIES (1,526) (664)

36
25. Reconciliation of Cash Flows from Financing Activities
The movement in loan liabilities to 31 December 2017 and the effect of non-cash transactions arising
from financing these cash flow activities is shown below.
GROUP Loan
2017 $000
2016 $000
At 1 January 1,039 1,039
Loan repayments (120) -
Non cash flows
Effects of foreign exchange - -
At 31 December 919 1,039
26. Capital Management
For the purpose of the Group’s capital management, capital includes issued capital and all other
equity reserves attributable to the equity holders of the parent. Net debt includes borrowings less bank
funds.
The group’s capital management objectives are to safeguard the group's ability to continue as a going
concern in order to provide returns for shareholders and benefits for other stakeholders and to
maintain an optimal capital structure to reduce the cost of capital.
The Group is maintaining its capital base by prudent spending on operations, research and
development in order to generate new revenue streams and sales activity. The directors anticipate
being able to raise additional equity funds as and when required - see Note 31.
The amount of capital, cash and net debt that the Group has for the year is summarised as follows:
2017 $000
2016 $000
Total Equity 1,019 1,685
Borrowings (919) (1,039)
Bank 324 1,827
Net (debt) cash (595) 788
27. Contingent Liabilities
There were no contingent liabilities at year end (2016: $nil).
28. Operating Commitments
The group has the following operating commitments:
(1) Operating: Leaf purchase of $210,800 and an advertising commitment of $210,000.
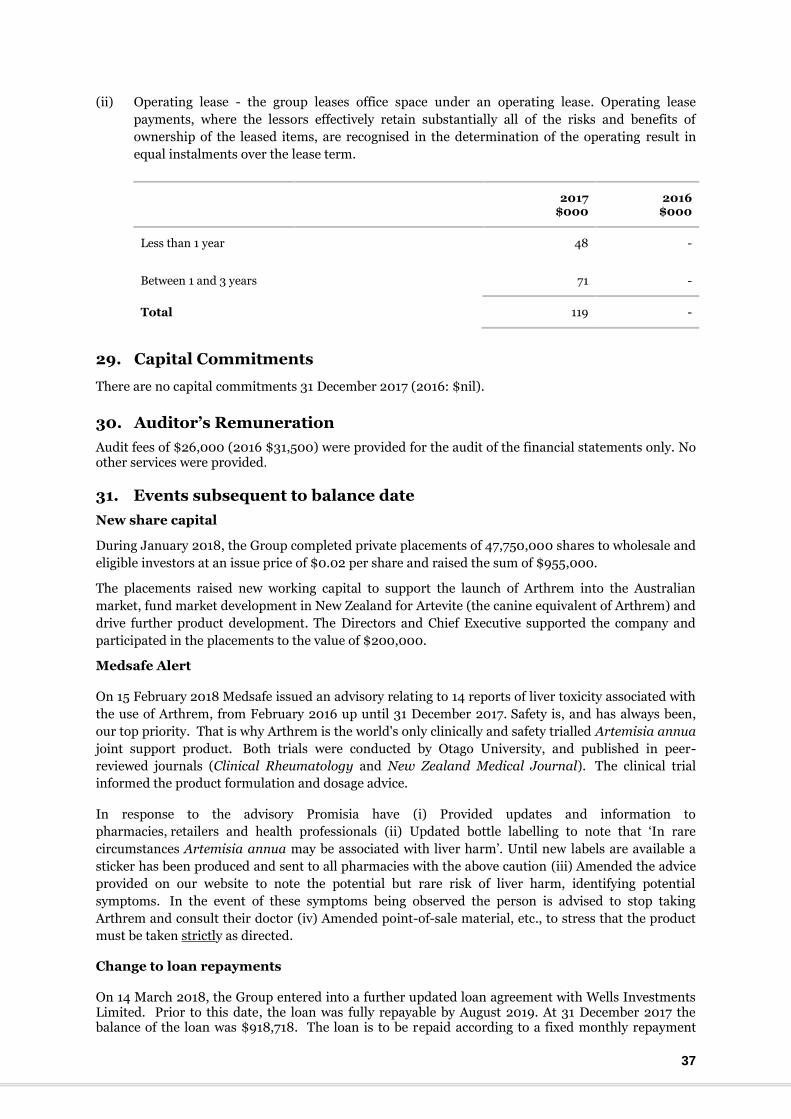
37
(ii) Operating lease - the group leases office space under an operating lease. Operating lease
payments, where the lessors effectively retain substantially all of the risks and benefits of
ownership of the leased items, are recognised in the determination of the operating result in
equal instalments over the lease term.
2017 $000
2016 $000
Less than 1 year 48 -
Between 1 and 3 years 71 -
Total 119 -
29. Capital Commitments
There are no capital commitments 31 December 2017 (2016: $nil).
30. Auditor’s Remuneration
Audit fees of $26,000 (2016 $31,500) were provided for the audit of the financial statements only. No other services were provided.
31. Events subsequent to balance date
New share capital
During January 2018, the Group completed private placements of 47,750,000 shares to wholesale and
eligible investors at an issue price of $0.02 per share and raised the sum of $955,000.
The placements raised new working capital to support the launch of Arthrem into the Australian
market, fund market development in New Zealand for Artevite (the canine equivalent of Arthrem) and
drive further product development. The Directors and Chief Executive supported the company and
participated in the placements to the value of $200,000.
Medsafe Alert
On 15 February 2018 Medsafe issued an advisory relating to 14 reports of liver toxicity associated with
the use of Arthrem, from February 2016 up until 31 December 2017. Safety is, and has always been,
our top priority. That is why Arthrem is the world's only clinically and safety trialled Artemisia annua
joint support product. Both trials were conducted by Otago University, and published in peer-
reviewed journals (Clinical Rheumatology and New Zealand Medical Journal). The clinical trial
informed the product formulation and dosage advice.
In response to the advisory Promisia have (i) Provided updates and information to
pharmacies, retailers and health professionals (ii) Updated bottle labelling to note that ‘In rare
circumstances Artemisia annua may be associated with liver harm’. Until new labels are available a
sticker has been produced and sent to all pharmacies with the above caution (iii) Amended the advice
provided on our website to note the potential but rare risk of liver harm, identifying potential
symptoms. In the event of these symptoms being observed the person is advised to stop taking
Arthrem and consult their doctor (iv) Amended point-of-sale material, etc., to stress that the product
must be taken strictly as directed.
Change to loan repayments
On 14 March 2018, the Group entered into a further updated loan agreement with Wells Investments Limited. Prior to this date, the loan was fully repayable by August 2019. At 31 December 2017 the balance of the loan was $918,718. The loan is to be repaid according to a fixed monthly repayment

38
schedule that means it will be fully repaid by December 2021 or earlier, with monthly payments in the range of $12,500 to $30,000 commencing in April 2018. Interest is charged at a rate of 5% per annum until 31 December 2016 and 6.5% from then until 31 December 2021. Details of the previous loans are set out in note 19 and the security granted over the loan are set out in Note 20.
There have been no other matters or circumstances since the end of the financial year not otherwise
dealt with in these financial statements that have significantly or may significantly affect the Group’s
operations.

39
SHAREHOLDER AND STATUTORY INFORMATION
Stock Exchange Listing
The Company’s fully paid ordinary shares are listed on the main board equity security market
operated by NZX Limited under the call sign (PIL).
Principal Ordinary Shareholders as at 13 March 2018
The following table lists the names and holdings of the 20 largest holding parcels of quoted ordinary
shares of the Company as at 13 March 2018.
Holder Number Held % Held
T.D. Brankin & M. J. Lay 53,804,210 9.66
E. M.M. Johnson & K. Johnson & E. Wright 44,570,320 8.01
Daily Global Enterprises Limited 20,669,767 3.71
S.P. Ward & J.P. Ward & J.M. Ward 18,597,771 3.34
S. Underwood 15,193,890 2.73
Bank of America Merrill Lynch International Limited 12,854,532 2.31
Aotearoa Investment Company Pty Limited ATF 12,351,498 2.22
E.M.M. Johnson 12,204,680 2.19
G.R. Wells 11,915,613 2.14
M.D. Priest 10,836,315 1.95
S.A. Armstrong 10,020,779 1.80
Templar Investments Limited 8,400,000 1.51
C.K. Mooi 8,400,000 1.51
Wells Investments Limited 8,295,068 1.49
New Zealand Central Securities Depository Limited 6,812,976 1.22
J. M. O’Brien 6,471,899 1.16
P. McVeigh 6,350,000 1.14
D. J. Robinson 5,853,571 1.05
Ballynagarrick Investments Limited 5,060,706 0.91
Central Nominees Limited 5,025,908 0.90
P.D. Wells 4,400,000 0.79
Top Twenty shareholders 288.089,503 51.75

40
Total Shares on Issue
No Holders Shares Held % Held
Top 20 20 288,089,503 51.75
Other Investors 1,448 268,619,468 48.25
Total 1,468 556,708,971 100.00
Spread of Ordinary Shareholders as at 14 March 2017
Holding Range No of Holders Total Shares %
1-1,000 8 4,364 0.0
1,001-5000 369 1,155,301 0.21
5001-10,000 195 1,547,263 0.28
10,001 -50,000 361 9,188,905 1.65
50,001-100,000 154 11,767,683 2.11
100,001 or more 378 533,045,455 95.75
Total 1,465 556,708,971 100.00
Substantial Security Holders as at 13 March 2018
The Company’s register of substantial security holders, prepared in accordance with section 35F of the
Securities Markets Act 1988 disclosed the following information.
Name Class of Shares No Shares % Held
T.D. Brankin & M.J. Kirwin Lay Ordinary 53,804,210 9.66
E.M.M. Johnson & K. Johnson & E. Wright
Ordinary 44,570,320 8.01
Directors’ Security Holdings including beneficial interests as at 13 March 2018
Name No Shares % Held
T.D. Brankin Director 53,804,210 9.66
S. Underwood Director 20,219,798 3.63
M.D. Priest Director 10,836,315 1.95
H. Down Director 500,000 0.00
The directors did not hold any shares in the capacity of non-beneficiaries or associates.

41
Particulars of Directors’ Share Transactions in Promisia Integrative Limited
Dealing in Securities
The following table shows transactions recorded in respect of those securities during the year 1
January 2017 to 31 December 2017.
Director Date of transaction
No of shares purchased/(sold)
Cost $
T.D. Brankin – off market transfer 27 March 2017 2,500,000 $100,000
M.D. Priest-off market transfer 27 March 2017 500,000 $20,000
S. Underwood – off market transfer 19 March 2017 (254,092) ($7,623)
Share Transactions and Holdings
The share transactions effected by various directors are recorded in the Interests Register as set out
above and their holdings are shown on page 41.
Directors’ Remuneration and Other Benefits
The names of the directors of the Company at 31 December 2017 and the details of their remuneration
and the value of other benefits received for services to Promisia Integrative Limited for the year ended
on that date are:
Director Nature of Remuneration
S. Underwood $49,000 Director’s fee
M.D. Priest $17,000 Director’s fee
T.D. Brankin $17,000 Director’s fee
H. Down $ 9,917 Director’s fee
Share options have been provided to the Directors as set out in note 21 2(c).
Employee Remuneration
There was only one employee, or former employee, who received remuneration and other benefits
valued at or exceeding $100,000 during the year to 31 December 2017, that being in the range of
$120,000 to 130,000.
Entries in the Interests Register
The Company has an Interests Register which records various disclosures as required by the
Companies Act 1993 and in accordance with good governance practice.
Other Directorships or Trusteeships
The following represents the interests of directors in other companies or trustees of organisations as
disclosed to the Company and entered into the Interests Register. The designation ** indicates the
director also holds an equity interest in the company.
Stephen Underwood
Promisia Integrative Limited – Group, Central Nominees Limited**, Central Securities Limited**,
Decisive Securities Limited**, Insolvency Associates Limited, Normandy Holdings Limited**,
Nalokua Holdings Limited**, Panama Direct Limited**, Renouf Corporation Limited**, The Renouf
Quay Company Limited**, 138 The Terrace Limited, Tuff Lite Limited, Benefit Arthritis Limited.

42
Duncan Priest
Promisia Integrative Limited - Group, Trans- Tasman Resources Limited.
Thomas Brankin
Promisia Integrative Limited – Group, Eileen Mary Age Care Limited**, Eileen Mary Age Care
Property Limited**, i.Agri Limited, OTB Property Limited, Ranfurly Manor Limited**, Ranfurly
Manor No.1 Limited**, Design Care Group Limited **, i.Agri 2003 Limited**, Benefit Arthritis
Limited.*
Helen Down
Promisia Integrative Limited - Group, Advisory Boards New Zealand Limited, Synthesis Marketing
Limited.
Auditors’ Remuneration
Audit fees of $26,000 (2016: $31,500) are payable to the auditors for the audit of the statutory
financial statements only.
Donations
There were no donations made during the year ended 31 December 2017 (2016: $nil) by the Company
or any if its subsidiaries.
Information Used by Directors
There were no notices from Directors of the Group or any of its subsidiaries requesting to use
company information received in their capacity as a director which would not otherwise have been
available to them.

43
CORPORATE DIRECTORY AND SHAREHOLDER INFORMATION
Registered office and address for service
Level 4, 22 Panama Street Wellington 6011 P O Box 25-396 Wellington 6146 Telephone: +64 4 4995563 Mobile: +64 22 0430634 Facsimile: +64 4 8318688 Email: [email protected] Website: http://arthrem.co.nz/ or http://promisia.com/
Directors
Stephen Underwood, Chairman
Duncan Priest
Thomas Brankin
Helen Down
Auditor
Moore Stephens Wellington Audit Level 11, Sovereign House 34/42 Manners Street, Te Aro Wellington 6011
Share Registrar
Link Market Services Level 7, Zurich House 21 Queen St Street P O Box 91976 Auckland 1142
Telephone: +64 9 375 5998
Facsimile: +64 9 375 5990
Email: [email protected]
Bankers Kiwibank
Solicitors
Oakley Moran Leaders Building 15 Brandon Street Wellington 6011
Company publications
The Company seeks to inform investors regarding
its business operations through issuing an Annual
Report, an Interim Report and Newsletters as is
appropriate.
Financial Calendar
Half year results announced August
Half year report September
End of financial year 31 December
Annual results announced February
Annual report March
Enquiries
Shareholders with enquiries about transactions,
change of address or dividend payments should
contact Link Market Services on +64 9 375 5998
or by email on
Other questions may be directed to the Company
at its registered address.
Stock Exchange
The Company’s shares trade on the New Zealand
Exchange under the code PIL. The minimum
parcel on the NZX is 50 shares.