projections of outdoor riwreation participation to …
TRANSCRIPT

PROJECTIONS OF OUTDOOR RiWREATIONPARTICIPATION TO 2050
. . . . . . . . . . . . . . . .
J. M. BowkerlDonald B. K. English
H. Ken Cordell
Acknowledgments:The authors acknowledge the valuable suggestions of Dr. David Newman and Dr. Christopher McIntosh. Theauthors-also thank Dr. Gajanan Bhat and Jo Anne Norris for technical assistance.
INTRODUCTION
Outdoor recreation in various forms has been and continues to be an important component of Ameri-cans’ lives. Chapter V focused on the present situation, based primarily on descriptive findings from the Na-tional Survey on Recreation and the Environment (NSRE) (Cordell, McDonald, Lewis, Miles, Martin, & Bason,1996). In addition, where possible, long-term trends in recreation participation were assessed by comparingNSRE findings with those of national recreation surveys dating back to 1960.
The intent of this chapter is to project future outdoor recreation participation and consumption, in daysand trips, well into the next century as mandated by the Renewable Resources Planning Act @PA). The chap-ter begins with a brief description of the data and methods used. Next, we report indexed projections of futurerecreation participation (by millions of participants aged 16 and over) and consumption (by millions of daysannually and by millions of primary purpose trips taken) across the four assessment regions (see Figure II.1 inChapter II) at lo-year intervals beginning in 2000 and ending in 2050. For convenience, we place projectionsfor specific activities in the following groups: winter, water, wildlife, dispersed land, and developed land. Fi-nally, we discuss some important findings, implications, and limitations of the analysis.
METHODS AND DATA
For projections, we developed two types of regional cross-sectional models. The first is a logistic regres-sion model similar to those frequently used in recreation, economics, political science, and various other fieldswhere individuals provide yes or no responses to behavioral questions (Greene, 1995). In this application, weused the model to estimate the probability that an individual will participate in a given recreation activitybased on the individual’s characteristics and the recreation opportunities near the individual’s primary resi-
’ J. M. Bowker and D. B. K. English are both research social scientists and H. Ken Cordell is a regional forester and project leader, USDAForest Service, Athens, GA.

3 2 4 Outdoor Recreation in American Life
dence. We obtained a separate model for each activity across each of the four assessment regions. Model resultswere then combined with population information to obtain estimates of the total number of participants in anactivity per region. These results were then indexed on the 1995 base year. A number of previous RPA studieshave used logistic regression models to estimate activity participation including those by Hof & Kaiser (1983)and Walsh, Jon, McKean, and Hof (1992). In both of these studies, national rather than regional models wereconstructed.
The second type of model used in this analysis is a negative binomial form of a count data model. We usedthis model to measure consumption levels through reported days and reported primary purpose trips. Thistype of model is very popular in recreation and labor market research (Greene, 1995). It is designed to takeinto account the quantitative aspect of trip-taking behavior-i.e., the fact that people spend a countable num-ber of days or trips per year participating in recreation activities. Here we used the model to estimate annualdays an individual will spend in a given outdoor recreation activity and the number of annual trips an indi-vidual will take for the primary reason of participating in a selected activity. As with the logistic regressionparticipation models, we combined the results of our models with population estimates to project the numberof primary purpose trips for a given activity originating in each assessment region and the number of daysparticipants from a given region would be involved in any given activity. We report these estimates in indexedform relative to the base year. A more detailed explanation of both logistic and negative binomial regressionmodels is provided by Greene (1993).
To develop projections of future recreation activity, we created a structure based on today’s behavior. Wecreated models to explain today’s behavior in terms of measurable factors. If the structure of today’s behavioris a good indicator of future behavior, the models can be used to estimate future recreation participation, days,and trips by activity and region. While this assumption is not always accurate, it is a reasonable alternativewhen adequate cross-sectional time-series data are unavailable.
Recreation research shows that demographic factors such as age, age squared, race or ethnicity, sex,wealth or income, education, and previous experience influence recreation behavior (Hof & Kaiser, 1983;Walsh, Jon, McKean, & Hof, 1992; Cordell, Bergstrom, Hartman, & English, 1990). In Table VI.l, we provideindexed projections of demographic variables used in this analysis. These projections are based on U.S. Censusestimates of population (Day, 1996) and macroeconomic estimates from the USDA Economic Research Service(Torgerson, 1996).
Table VI.l: Indexed Explanatory Variable Projections for Regional Model RPA Forecasts*
VARIABLE YEAR1995 2000 2010 2020 2030 2040 2050
4%Age-squaredReal IncomePercent WhitePercent MalePopulation NorthPopulation SouthPopulation Rocky MtnPopulation PacificPopulation Nation
1 1.02 1.056 1.089 1.114 1.126 1.1261 1.033 1.07 1.103 1.128 1.141 1.1411 1.067 1.209 1.357 1.515 1.691 1.8881 0.989 0.97 0.952 0.935 0.917 0.9011 1.002 1.002 1.002 1.004 1.004 1.0061 1.013 1.064 1.138 1.197 1.241 1.3041 1.062 1.168 1.271 1.371 1.461 1.5341 1.064 1.17 1.272 1.369 1.457 1.531 1.077 1.207 1.318 1.425 1.527 1.6041 1.042 1.126 1.217 1.299 1.4 1.439
I l Ref: Census publication ~25-1130 (1996) and USDA-ERS mimeo (Torgerson, 1996).
The biggest changes expected to take place in factors influencing recreation behavior over the next half-century relate to increases in population and real income. Using the mid-level growth scenario from the U.S.Census, population increases in the continental United States through 2050 will range from a low of 30 percentin the North to a high of 60 percent along the Pacific Coast. Average income, after accounting for inflation, isexpected to grow 88 percent over the same time period. This projection makes no attempt to identify changesin the distribution of income, which may have a profound influence on recreation behavior. Population, age,and sex ratio are expected to change relatively little, while percentage of whites in the population shoulddecline somewhat as other racial groups grow at faster rates.

Projections of Outdoor Recreation Participation to 2050 325
It has also been established that supply factors such as proximity and availability of recreation resourcesare important in determining whether and to what degree individuals recreate (Walsh, Jon, McKean, & Hof,1992). Previous research has shown that the amount of outdoor recreation settings or opportunities availableto an individual will affect the individual’s choice and intensity of participation in given activities (Walsh, Jon,McKean, & Hof, 1992). For example, whether an individual skis and how often that individual skis can in partbe explained by the proximity of skiing opportunities. Likewise, most dispersed outdoor recreation activities,such as viewing wildlife, require access to wildlife habitat on private and public forests, ranges, and wetlands.However, the supply of this habitat is finite. Thus, as population and participation in activities requiring itsavailability increase, relative scarcity of the habitat increases. Because there are no readily available and reli-able measures of future land and water availability, we followed convention and assumed a fixed amount ofhabitat for the various outdoor recreation activities modeled herein.
Past efforts at predicting recreation participation have used fairly general resource availability measures(Cordell, Bergstrom, Hartmann, & English, 1990; Walsh, Jon, McKean, & Hof, 1992). The resource variablesthat are included in our availability measure are described briefly in Table VI.2. This set of resource variablescovers the primary resource base for all of the recreation activities for which projections are made. For anygiven location, the availability measure for each of these variables equaled the sum of all acres within a 200-mile straight-line radius, divided by the total population within that area. The 200-mile limit has been observedto approximate the maximum market area for many types of recreation (Cordell, Bergstrom, Hartman, &English, 1990). By adjusting for population, we accounted for relative increases in the scarcity of recreationopportunities that occur with population increases from any combination of congestion, reduction in quality,loss of access, and physical conversion due to development.
Table VI.2: Resource Recreation Variables Used in Projection Models’
RUNWATER = acres of running water area including river, stream, or any running water.FLATWATER = acres of standing water which includes lakes, ponds, and reservoirs.BAYEST = acres of bay area and estuary area.WILDALL = acres of federally designated wilderness area.NONWILDAC = acres of federally-owned nonwilderness area including rangeland.NRIFOR = acres of nonfederal land with forest cover.NRIWETL = acres of nonfederal wetland area.PVTAGAC = acres of nonfederal agricultural land including rangeland.SPACRES = acres of State Park area.DSKIACRE = acres of downhill ski slopes.SNOWFOR = acres of forests covered with snow during winter season.SNOWMTN = acres of mountains covered with snow during winter season.SNOWAG = acres of agricultural land covered with snow during winter season.BLYMTN = acres of mountains classified under Bailey’s ecological classification.CGSITES = number of developed camp-sites.PUBFOR = WILDALL+ NONWILDAC + SPACRES.SUMWATER = RUNWATER+FLATWATER.SUMSNOW = DSKIACRE+SNOWAG+SNOWFOR.FLATBAY = FLATWATER+BAYEST.ALWATER = SUMWATER+FLATBAYALFRAGWT= PUBFOR + PVTAGAC+NRIFOR+NRIWETL
? All units are represented as the physical quantity within a 200-mile radius of the individual’s origindivided by the population within the area defined by the same radius. Ref: Norsis Data Base (1997) USDAForest Service, Athens, GA

326 Outdoor Recreation in American Life
RESULTS
Indexed values for recreation activity participation, annual days, and annual trips are presented in thissection. The indexes represent changes from the 1995 baseline totals for millions of participants, millions ofdays, and millions of trips at lo-year intervals to the year 2050. Activity groupings include: winter, water,wildlife, dispersed land, and developed land. Indexed projections are reported by activity and assessmentregion as well as for the nation.
Model parameter estimates for all activities and regions and their asymptotic standard errors are avail-able from the author.” Common to all models are the explanatory variables age (age in years of respondent),age squared, income (household annual pretax income), race (white or nonwhite), sex (male or female), andpopulation density of the respondent’s county. The latter variable serves as a continuous proxy for rural/nonruralvariables commonly encountered in recreation demand models. In addition, each model contains up to twosupply-type variables as listed in Table VI.2. Means by region for these explanatory variables are available fromthe author.
Projections for explanatory variables follow the indexes reported in Table VI.1. For example, mean in-come in any given region increases by 88 percent over the X-year simulation time horizon, while the percentof whites decreases by about 10 percent over the same time frame. Population density increases in proportionto population growth, while relevant supply is discounted by population growth for any region. Projected changesin the explanatory variables are then combined at lo-year intervals with the static parameter estimates (avail-able from the author) to arrive at the projections reported in this section.
Winter Activities
Three winter-based activities, cross-country skiing, downhill skiing, and snowmobiling were modeled bythe methods described above. Model parameter estimates are available from the author.
Cross-Country SkiingNationally, participation in cross-country skiing is expected to increase by 95 percent by the year 2050
(Table VI.3). The Rocky Mountain region will have the biggest increase at approximately 144 percent. A con-siderable decrease in the number of participants in this activity is projected for the South, however this willhave little effect on the national projection because of the small number of Southerners currently participatingin this sport.
Table VI.3. Baseline Estimates in Millions and Projected Indexes of Change in Days, Trips, andParticipants for Cross-Country Skiing, by Region and Decade 19952050
Unit RegionCross Country Skiing
1995 2000Projection Index
2010 2020 2030 2040 2050
Days North 35.70 0.92 0.90 0.91 0.93 0.98 1.10South 1.40 0.89 0.66 0.49 0.39 0.34 0.32Rocky Mountain 4.20 1.08 1.44 1.89 2.42 2.92 3.42Pacific 7.80 0.99 0.96 0.93 0.89 0.85 0.81National 49.00 0.94 0.94 0.96 1.00 1.06 1.18
Trips North 23.90 1.02 1.06 1.13 1.22 1.33 1.49South 0.70 1.08 0.66 0.55 0.46 0.48 0.29Rocky Mountain 3.30 1.09 1.45 1.93 2.48 2.64 3.57Pacific 5.90 1.03 1.00 0.97 0.96 1.02 0.97National 33.50 1.02 1.05 1.12 1.21 1.30 1.44
“Appendix tables and technical information are available upon request from the USDA Forest Service, Outdoor Recreation, 320 GreenSt., Athens, GA 30602-2044. Technical appendices herein shall be abbreviated to TAs.

Projections of Outdoor Recreation Participation to 2050 3 2 7
Table VI.3 Cont.
Unit RegionCross Country Skiing
1995 2000Projection Index
2010 2020 2030 2040 2050
Participation North 4.40 1.03 1.15 1.23 1.49 1.67 1.91South 0.40 0.91 0.77 0.66 0.59 0.54 0.52Rocky Mountain 0.70 1.07 1.31 1.41 1.88 2.16 2.44Pacific 1.10 1.06 1.23 1.33 1.57 1.74 1.90National 6.50 1.04 1.18 1.26 1.54 1.73 1.95
Activity days of cross-country skiing are estimated to increase by 18 percent over the next half century. Unlikeparticipation, the estimated increase in days is less than the rate of growth of the population in general. HOW-ever, the projected increase in the Rocky Mountain region is 242 percent, which is far greater than the 53percent population growth projected for that region. Primary-purpose trips follow a pattern between participa-tion and activity days. The national increase closely follows national population growth. Very large growth isprojected in the Rocky Mountain region and growth greater than that of the population is projected in theNorth. The South and Pacific Coast regions will have sharp and moderate decreases, respectively, in primary-purpose trips for cross-country skiing. However, there are few significant parameter estimates for cross-coun-try skiing models for these two regions. This result is not surprising given the small percentage of people inthese regions partaking of this sport. Hence, the index projections for the South and Pacific Coast regionsshould be viewed cautiously.
Downhill SkiingAs reported in Chapter V, downhill skiing annually accounts for the most days (126.5 million) and pri-
mary-purpose trips (78.9 million) of all the major winter sports. Projections of days, trips, and participants arereported in Table VI.4. Following trends of recent years, participation in downhill skiing is expected to increaseby 93 percent nationally over the next half century. Regional percentage increases in participants range from82 percent in the North to 111 percent in the Pacific Coast region. Because the North currently accounts for asmany skiers as all other regions combined, the North will continue to account for far and away the mostparticipants in this sport.
Table VI.4: Baseline Estimates and Projected Indexes of Change in Days, Trips, and Participants forDownhill Skiing, by Region and Decade, 19952050
Projection IndexJnit Region 1995 2000 2010 2020 2030 2040 2050
downhill SkiingDays North 67.20 1.00 1.09 1.21 1.36 1.55 1.86
South 13.00 1.07 1.36 1.47 1.78 2.22 2.90Rocky Mountain 14.90 1.01 1.16 1.14 1.25 1.42 1.67Pacific 31.50 1.06 1.36 1.46 1.70 2.00 2.35National 126.50 1.03 1.22 1.31 1.51 1.75 2.10
l-rips North 40.90 1.03 1.12 1.28 1.48 1.53 2.15South 6.10 1.04 1.11 1.21 1.36 1.58 1.94Rocky Mountain 10.70 1.03 1.07 1.15 1.27 1.44 1.70Pacific 21.40 1.09 1.29 1.53 1.81 2.13 2.48National 78.90 1.06 1.18 1.36 1.58 1.85 2.22
Participation North 8.40 1.00 1.09 1.16 1.36 1.54 1.82South 3.10 1.03 1.14 1.26 1.43 1.67 2.01Rocky Mountain 1.70 1.04 1.14 1.15 1.29 1.58 1.84Pacific 3.60 1.06 1.21 1.31 1.55 1.80 2.11National 16.80 1.03 1.13 1.22 1.43 1.63 1.93
328 Outdoor Recreation in American Life
Downhill skiing days for the nation, as well as for residents of each of the four assessment regions, areexpected to increase much more than the general increase in population. The national increase in annualskiing days is expected to be about 110 percent, or an increase from 126.5 million in 1995 to over 265 milliondays annually by 2050. While the biggest proportional increase will come from the Rocky Mountain region,residents of the North will account for the most annual skiing days at about 125 million by the year 2050.
Trips by Americans for the primary-purpose of downhill skiing will also continue to increase faster thanpopulation growth. Nationally, an increase of 122 percent is expected by 2050. As with participation and days,each assessment region shows an increase, with the greatest increase expected in the Pacific Coast, 148 per-cent, followed by the North at 115 percent. A major factor accounting for the increase in downhill skiingappears to be the strong positive relationship to personal income and the rather large expected increase in realpersonal income over the next 55 years (see Table VI.1).
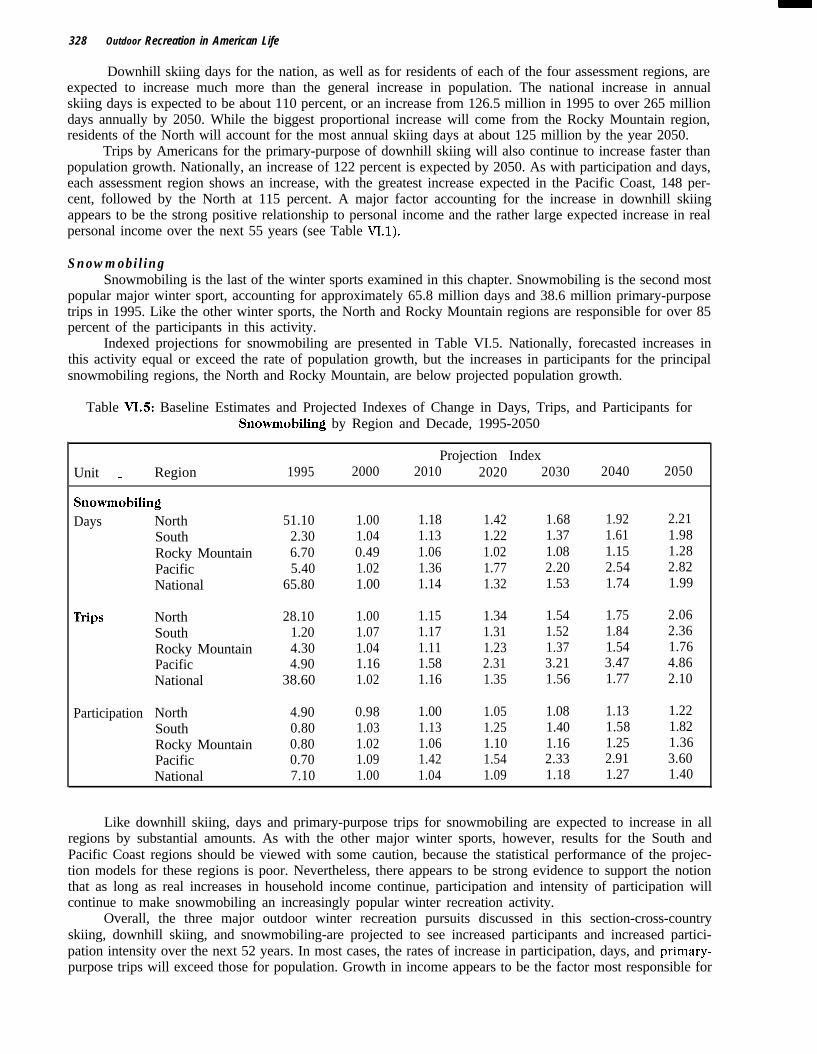
SnowmobilingSnowmobiling is the last of the winter sports examined in this chapter. Snowmobiling is the second most
popular major winter sport, accounting for approximately 65.8 million days and 38.6 million primary-purposetrips in 1995. Like the other winter sports, the North and Rocky Mountain regions are responsible for over 85percent of the participants in this activity.
Indexed projections for snowmobiling are presented in Table VI.5. Nationally, forecasted increases inthis activity equal or exceed the rate of population growth, but the increases in participants for the principalsnowmobiling regions, the North and Rocky Mountain, are below projected population growth.
Table VI.5: Baseline Estimates and Projected Indexes of Change in Days, Trips, and Participants forSnowmobihng by Region and Decade, 1995-2050
Projection IndexUnit _ Region 1995 2000 2010 2020 2030 2040 2050
SnowmobihngDays North
SouthRocky MountainPacificNational
51.10 1.00 1.18 1.42 1.68 1.92 2.212.30 1.04 1.13 1.22 1.37 1.61 1.986.70 0.49 1.06 1.02 1.08 1.15 1.285.40 1.02 1.36 1.77 2.20 2.54 2.82
65.80 1.00 1.14 1.32 1.53 1.74 1.99
Trips North 28.10 1.00 1.15 1.34 1.54 1.75 2.06South 1.20 1.07 1.17 1.31 1.52 1.84 2.36Rocky Mountain 4.30 1.04 1.11 1.23 1.37 1.54 1.76Pacific 4.90 1.16 1.58 2.31 3.21 3.47 4.86National 38.60 1.02 1.16 1.35 1.56 1.77 2.10
Participation North 4.90 0.98 1.00 1.05 1.08 1.13 1.22South 0.80 1.03 1.13 1.25 1.40 1.58 1.82Rocky Mountain 0.80 1.02 1.06 1.10 1.16 1.25 1.36Pacific 0.70 1.09 1.42 1.54 2.33 2.91 3.60National 7.10 1.00 1.04 1.09 1.18 1.27 1.40
Like downhill skiing, days and primary-purpose trips for snowmobiling are expected to increase in allregions by substantial amounts. As with the other major winter sports, however, results for the South andPacific Coast regions should be viewed with some caution, because the statistical performance of the projec-tion models for these regions is poor. Nevertheless, there appears to be strong evidence to support the notionthat as long as real increases in household income continue, participation and intensity of participation willcontinue to make snowmobiling an increasingly popular winter recreation activity.
Overall, the three major outdoor winter recreation pursuits discussed in this section-cross-countryskiing, downhill skiing, and snowmobiling-are projected to see increased participants and increased partici-pation intensity over the next 52 years. In most cases, the rates of increase in participation, days, and primary-purpose trips will exceed those for population. Growth in income appears to be the factor most responsible for

Projections of Outdoor Recreation Participation to 2050 329
the projected increases. It is expected to offset both reductions in per-capita supply of opportunities due toincreased population, and increasing proportions of nonwhites in the general population who are currently lesslikely to participate in winter sports.
Water-based Activities
The water-based activities for which indexed projections of participants, days, and trips are reportedinclude canoeing, motorboating, nonpool swimming, and rafting. With the exception of pool swimming, theseare the most popular of the water-based outdoor recreation activities, accounting for about 2,093 million activ-ity days and 1,429 million primary-purpose trips annually. In addition, we include the more generic activity ofvisiting a beach or waterside, which is paramount to participating in any of the more specific activities listed.This activity is currently undertaken by over 124 million people each year in 1,667 million primary-purposetrips and 3,188 million activity days. Indexed projections for the water-based activities are reported below.
CanoeingNationally, participation in canoeing is projected to increase slightly more than population growth over
the next 55 years, with the largest percentage increase in the Pacific Coast region. However, the North and theSouth will continue to account for the majority of canoeing given the current large numbers of participants inthose regions (Table VI.6).
Table VI.6: Baseline Estimates and Projected Indexes of Change in Days, Trips, and Participants forCanoeing by Region and Decade 19952050
Projection IndexUnit Region 1995 2000 2010 2020 2030 2040 2050Canoein
Days North 44.70 1.00 1.14 1.33 1.51 1.64 1.78South 17.60 1.04 1.09 1.13 1.21 1.35 1.57Rocky Mountain 2.90 1.04 1.14 1.25 1.36 1.47 1.59Pacific 9.70 1.08 1.18 1.29 1.42 1.59 1.80National 74.60 1.02 1 . 1 4 1.28 1.43 1.57 1.73
Trips North 25.50 0.98 0.93 0.90 0.89 0.89 0.90South 14.20 1.02 1.07 1.12 1.18 1.25 1.36Rocky Mountain 2.10 1.07 1.12 1.20 1.29 i.37 1.52Pacific 7.60 1.11 1.15 1.24 1.33 1.41 1.41National 49.30 1.02 1.07 1.14 1.22 1.29 1.29
Participation North 8.00 1.00 1.06 1.13 1.24 1.33 1.48South 4.20 1.03 1.07 1.11 1.16 1.23 1.34Rocky Mountain 0.70 1.03 1.11 1.20 1.25 1.32 1.39Pacific 1.20 1.06 1.21 1.30 1.51 1.69 1.89National 14.10 1.02 1.08 1.15 1.24 1.33 1.46
The number of days spent canoeing is expected to increase about 30 percent more than the populationgrowth through the year 2050. The biggest increases, on the order of 80 percent, will be in the North andPacific Coast regions. Currently, over half of the canoeing days nationally originate in the North, and thisproportion should continue if not increase over the next half century.
Nationally, the number of primary-purpose canoeing trips is projected to increase by 29 percent over thesame time period. Oddly, the number of trips by Northern residents is expected to decline by about 10 percent,while the number of days increases. These changes could mean that trips will be of longer duration or thatcanoeing will be done as a complementary or secondary activity within a multipurpose trip.

3 3 0 Outdoor Recreation in American Life
MotorboatingMotorboating currently is the most popular recreational boating activity with 47 million participants
nationally, more than tripling its nearest competition. Projected changes in motorboating participation, days,and primary-purpose trips are reported in Table VI.7.
Table VI.7: Baseline Estimates and Projected Indexes of Change in Days, Trips, and Participants forMotorboating, by Region and Decade, 19952050
Unit RegionMotorboating
1995Projection Index
2000 2010 2020 2030 2040 2050
Days North 292.30 1 .oo 1.03 1.07 1.11 1.15 1.20South 294.00 0.99 1 .oo 1.02 1.05 1.10 1.16Rocky Mountain 31.10 1.06 1.19 1.34 1.50 1.68 1.90Pacific 82.20 1.11 1.38 1.69 2.06 2.52 3.09National 6 9 9 . 9 0 1 .Ol 1.07 1.14 1.23 1.32 1.45
Trips North 208.50 1.02 0.99 1.01 1.04 1.06 1.06South 190.10 1.04 1.07 1.15 1.23 1.31 1.42Rocky Mountain 24.20 1.08 1.21 1.37 1.55 1.64 2.02Pacific 58.90 1.14 1.35 1.63 1.98 2.40 2.94National 480.40 1.05 1.08 1.16 1.26 1.36 1.48
Participation North 22.00 1.01 1.06 1.13 1.21 1.29 1.40South 15.50 1.04 1.13 1.24 1.33 1.45 1.59Rocky Mountain 3.20 1.06 1.17 1.26 1.40 1.54 1.70Pacific 6.30 1.07 1.22 1.32 1.52 1.69 1.88National 47.00 1.03 1.11 1.21 1.31 1.42 1.55
Nationally, participation, days, and trips are projected to increase slightly more than population growthup to 2050. The rate of increase in trips is expected to be greatest in the Pacific and Rocky Mountain regions atmore than 194 percent and 102 percent, respectively. Likewise, these regions will account for the biggest ratesof increase in activity days devoted to motorboating. However, because of the current popularity of the sport inthe North and South, even a moderate increase like that reported in Table VI.7 will mean that the preponder-ance of motorboating activity will continue to be generated by people of the North and South.
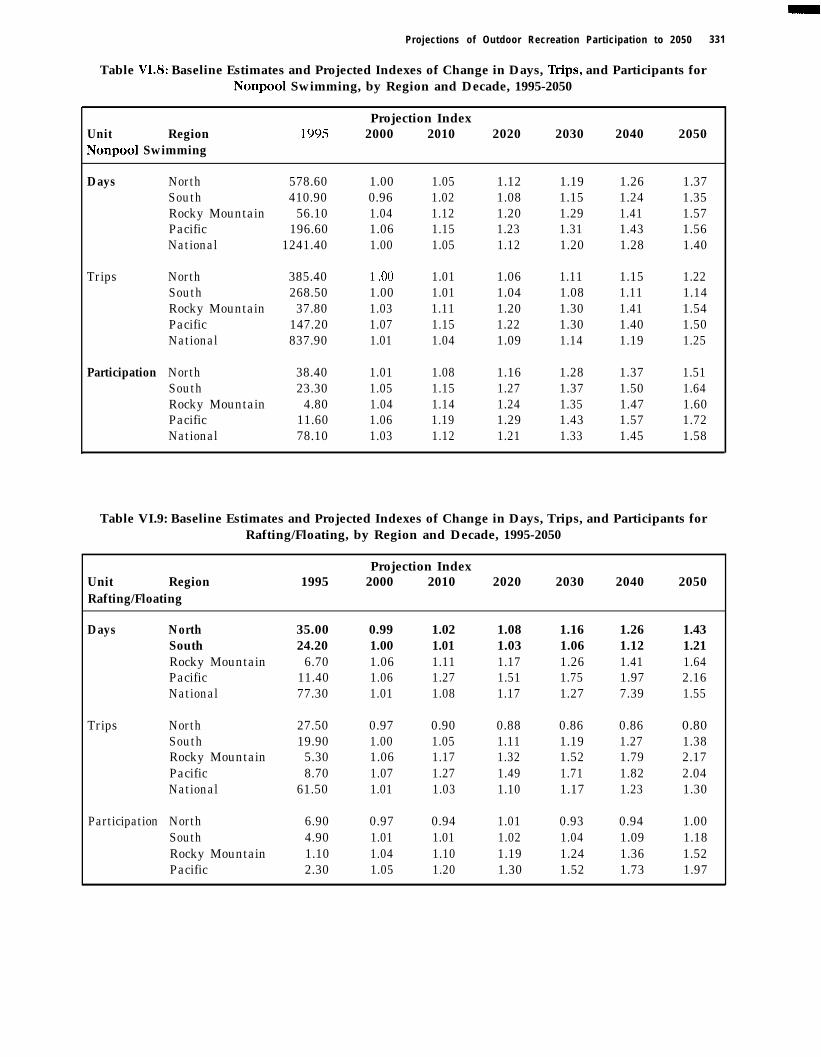
Nonpool SwimmingNonpool swimming is and will continue to be the single most popular water-based recreation activity
taking place in natural settings, but the rate of growth in this activity will be more modest than motorboating.As reported in Table VI.8, participation and annual days of nonpool swimming should mostly keep pace withpopulation growth, while primary-purpose trips for nonpool swimming should lag somewhat behind populationgrowth, increasing only 25 percent out to 2050.
Examination of the model parameter estimates indicates that perhaps the biggest single factor slowingthe growth of nonpool swimming is the importance of race in the model and the declining proportion of whitesin the population expected over the next half century.
Projections of Outdoor Recreation Participation to 2050 331
Table VI.& Baseline Estimates and Projected Indexes of Change in Days, Trips, and Participants forNonpool Swimming, by Region and Decade, 1995-2050
Unit RegionNonpool Swimming
199sProjection Index
2000 2010 2020 2030 2040 2050
Days North 578.60 1.00 1.05 1.12 1.19 1.26 1.37South 410.90 0.96 1.02 1.08 1.15 1.24 1.35Rocky Mountain 56.10 1.04 1.12 1.20 1.29 1.41 1.57Pacific 196.60 1.06 1.15 1.23 1.31 1.43 1.56National 1241.40 1.00 1.05 1.12 1.20 1.28 1.40
Trips North 385.40 1 .oo 1.01 1.06 1.11 1.15 1.22South 268.50 1.00 1.01 1.04 1.08 1.11 1.14Rocky Mountain 37.80 1.03 1.11 1.20 1.30 1.41 1.54Pacific 147.20 1.07 1.15 1.22 1.30 1.40 1.50National 837.90 1.01 1.04 1.09 1.14 1.19 1.25
Participation North 38.40 1.01 1.08 1.16 1.28 1.37 1.51South 23.30 1.05 1.15 1.27 1.37 1.50 1.64Rocky Mountain 4.80 1.04 1.14 1.24 1.35 1.47 1.60Pacific 11.60 1.06 1.19 1.29 1.43 1.57 1.72National 78.10 1.03 1.12 1.21 1.33 1.45 1.58
Table VI.9: Baseline Estimates and Projected Indexes of Change in Days, Trips, and Participants forRafting/Floating, by Region and Decade, 1995-2050
Unit RegionRafting/Floating
1995Projection Index
2000 2010 2020 2030 2040 2050
Days North 35.00 0.99 1.02 1.08 1.16 1.26 1.43South 24.20 1.00 1.01 1.03 1.06 1.12 1.21Rocky Mountain 6.70 1.06 1.11 1.17 1.26 1.41 1.64Pacific 11.40 1.06 1.27 1.51 1.75 1.97 2.16National 77.30 1.01 1.08 1.17 1.27 7.39 1.55
Trips North 27.50 0.97 0.90 0.88 0.86 0.86 0.80South 19.90 1.00 1.05 1.11 1.19 1.27 1.38Rocky Mountain 5.30 1.06 1.17 1.32 1.52 1.79 2.17Pacific 8.70 1.07 1.27 1.49 1.71 1.82 2.04National 61.50 1.01 1.03 1.10 1.17 1.23 1.30
Participation North 6.90 0.97 0.94 1.01 0.93 0.94 1.00South 4.90 1.01 1.01 1.02 1.04 1.09 1.18Rocky Mountain 1.10 1.04 1.10 1.19 1.24 1.36 1.52Pacific 2.30 1.05 1.20 1.30 1.52 1.73 1.97

332 Outdoor Recreation in American Life
For decades recreationistshave combed the beaches ofFire Island NationalSeashore, located ulong theNew York City coastline. Ofthe coustline surnxmding thecity. only Fire Island remainsrehhbely witi, roudless. andisobted. Photo courtesy ofUSDI Nutiomxl Purk Service.Photo by Rickurd Frear.
RaftingRafting and floating projections are reported in Table VI.9. Nationally, the number of annual days spent
rafting should increase about 10 percent faster than the population. The number of participants and primary-purpose trips, while increasing, will fall short of increases in population, indicating that fewer primary-purposetrips willbe taken per capita and that the proportion of people rafting and floating will diminish somewhat.
These results are somewhat contrary to an apparent dramatic increase in this sport in recent years andmay suggest a leveling after recent rapid growth. Nevertheless, fairly sizable increases are expected in theRocky Mountain and Pacific Coast regions.
Visiting Beaches and WatersidesThe final activity in the water-based section is visiting a beach or waterside. This activity is extremely
popular and an essential ingredient for partaking of other activities in this section. Currently, an estimated124.4 million people above the age of 16 report at least one visit annually to a beach or waterside. Moreover,this participation led to approximately 3,187.9 million days and 1,667.l million primary-purpose trips in 1995.Not surprisingly, highest per-capita day and trip numbers are from the Pacific Coast region, but the North andSouth regions are fairly close behind and, because of greater populations, account for the majority of days andtrips to a beach or waterside.
Indexed projections for beach and waterside participation, days, and trips are reported in Table VI.10.Nationally, participation is expected to outstrip population increases to 2050, and all regions will experienceincreases in participation at rates faster than population growth. Interestingly, by 2050 over 75 percent of thepopulation 16 and over will make at least one visit per year to recreate at a beach or waterside.

Projections of Outdoor Recreation Participation to 2050 333
Table VI.10: Baseline Estimates and Projected Indexes of Change in Days, Trips, and Participants forVisiting a Beach or Waterside, by Region and Decade, 19952050
Unit RegionVisiting a Beach or Waterside
1995Projection Index
2000 2010 2020 2030 2040 2050
Days North 1319.70 1.01 1.07 1.15 1.22 1.28 1.36South 1037.50 1.05 1.16 1.28 1.41 1.55 1.69Rocky Mountain 128.00 1.06 1.17 1.29 1.42 1.54 1.67Pacific 706.20 1.08 1.24 1.39 1.55 1.73 1.92National 3187.90 1.03 1.10 1.17 1.25 1.47 1.59
Trips North 673.50 1.00 1.01 1.05 1.08 1.11 1.17South 536.80 1.05 1.11 1.18 1.27 1.33 1.44Rocky Mountain 80.00 1.06 1.23 1.40 1.58 1.68 1.96Pacific 382.10 1.08 1.22 1.35 1.49 1.59 1.80National 1667.10 1.03 1.10 1.17 1.25 1.31 1.42
Participation North 57.70 1.01 1.09 1.17 1.28 1.35 1.45South 37.70 1.07 1.20 1.30 1.48 1.62 1.76Rocky Mountain 8.30 1.07 1.20 1.30 1.48 1.62 1.75Pacific 20.70 1.08 1.21 1.33 1.46 1.60 1.72National 124.40 1.05 1.15 1.24 1.38 1.49 1.61
Days and primary-purpose trips to beaches or watersides will also increase faster than population growth,with the exception of trips originating in the North. The biggest relative increase in days, 92 percent, will be inthe Pacific Coast. The largest relative increase in primary-purpose trips will be 96 percent in the Rocky Moun-tain region.
Overall, the four major water recreation pursuits discussed in this section-canoeing, motorboating,nonpool swimming, and rafting-will experience an increase in the number of participants and an increase inparticipation intensity over the next 55 years. In most cases, the increase in participation, days, and primary-purpose trips will proceed at about the rate of population growth. Rafting will experience overall nationalgrowth but a slight decline in per capita participation in the populous North and South. Motorboating andnonpool swimming will remain the most popular water sports. The biggest relative increase in days of partici-pation will occur in canoeing. Primary-purpose trips will, in general, lag population growth. Combined withincreases in participation and days, this may indicate a trend to more multipurpose trips or a tendency towardlonger trips.
Growth in income appears to be the factor most responsible for the projected increases in water recre-ation. Sex is also an important factor, but has little effect on projections because of the long-term stability of thesex ratio in the population. Growth is buffered by decreasing relative availability of water recreation venuesand the increase of nonwhite members of the population who, in terms of current behavior, appear to preferalternative outlets for recreation.
Wildlife-related ActivitiesIn this section, we combine a number of smaller categories of wildlife-related recreation into three main
groups-fishing, hunting, and nonconsumptive wildlife activity. Fishing and hunting are traditional consump-tive forms of wildlife recreation, although an increasing number of people are participating in catch and releasefishing. Nonconsumptive wildlife activity includes various forms of wildlife viewing such as birdwatching andwildlife photography.
FishingFishing as a general category includes warm and cold freshwater species, saltwater and anadromous
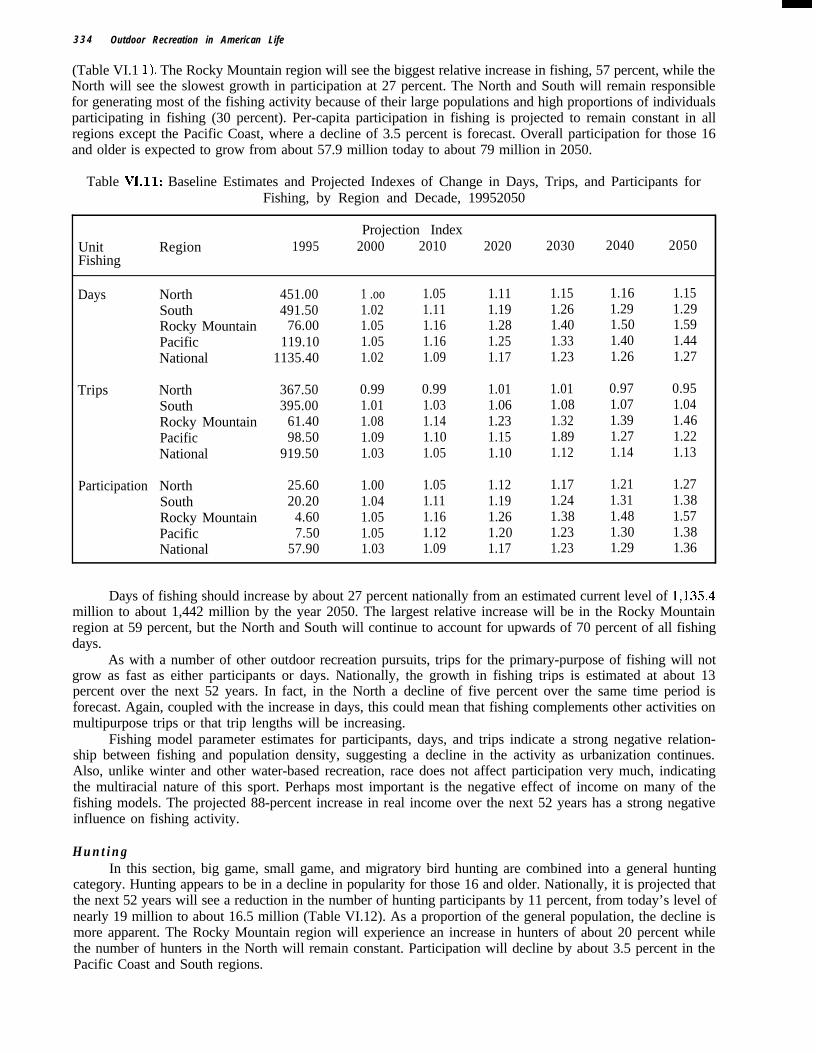
species, and catch-release fishing. Ice fishing, with about a two-percent participation rate nationally, was notincluded as day and trip data were unavailable in the NSRE. Nationally, participation in fishing is expected toincrease 36 percent over the next 52 years, marginally less than projected population growth of 44 percent
3 3 4 Outdoor Recreation in American Life
(Table VI.1 1). The Rocky Mountain region will see the biggest relative increase in fishing, 57 percent, while theNorth will see the slowest growth in participation at 27 percent. The North and South will remain responsiblefor generating most of the fishing activity because of their large populations and high proportions of individualsparticipating in fishing (30 percent). Per-capita participation in fishing is projected to remain constant in allregions except the Pacific Coast, where a decline of 3.5 percent is forecast. Overall participation for those 16and older is expected to grow from about 57.9 million today to about 79 million in 2050.
Table VI.11: Baseline Estimates and Projected Indexes of Change in Days, Trips, and Participants forFishing, by Region and Decade, 19952050
UnitFishing
Region 1995Projection Index
2000 2010 2020 2030 2040 2050
Days North 451.00 1 .oo 1.05 1.11 1.15 1.16 1.15South 491.50 1.02 1.11 1.19 1.26 1.29 1.29Rocky Mountain 76.00 1.05 1.16 1.28 1.40 1.50 1.59Pacific 119.10 1.05 1.16 1.25 1.33 1.40 1.44National 1135.40 1.02 1.09 1.17 1.23 1.26 1.27
Trips North 367.50 0.99 0.99 1.01 1.01 0.97 0.95South 395.00 1.01 1.03 1.06 1.08 1.07 1.04Rocky Mountain 61.40 1.08 1.14 1.23 1.32 1.39 1.46Pacific 98.50 1.09 1.10 1.15 1.89 1.27 1.22National 919.50 1.03 1.05 1.10 1.12 1.14 1.13
Participation North 25.60 1.00 1.05 1.12 1.17 1.21 1.27South 20.20 1.04 1.11 1.19 1.24 1.31 1.38Rocky Mountain 4.60 1.05 1.16 1.26 1.38 1.48 1.57Pacific 7.50 1.05 1.12 1.20 1.23 1.30 1.38National 57.90 1.03 1.09 1.17 1.23 1.29 1.36
Days of fishing should increase by about 27 percent nationally from an estimated current level of 1,135.4million to about 1,442 million by the year 2050. The largest relative increase will be in the Rocky Mountainregion at 59 percent, but the North and South will continue to account for upwards of 70 percent of all fishingdays.
As with a number of other outdoor recreation pursuits, trips for the primary-purpose of fishing will notgrow as fast as either participants or days. Nationally, the growth in fishing trips is estimated at about 13percent over the next 52 years. In fact, in the North a decline of five percent over the same time period isforecast. Again, coupled with the increase in days, this could mean that fishing complements other activities onmultipurpose trips or that trip lengths will be increasing.
Fishing model parameter estimates for participants, days, and trips indicate a strong negative relation-ship between fishing and population density, suggesting a decline in the activity as urbanization continues.Also, unlike winter and other water-based recreation, race does not affect participation very much, indicatingthe multiracial nature of this sport. Perhaps most important is the negative effect of income on many of thefishing models. The projected 88-percent increase in real income over the next 52 years has a strong negativeinfluence on fishing activity.
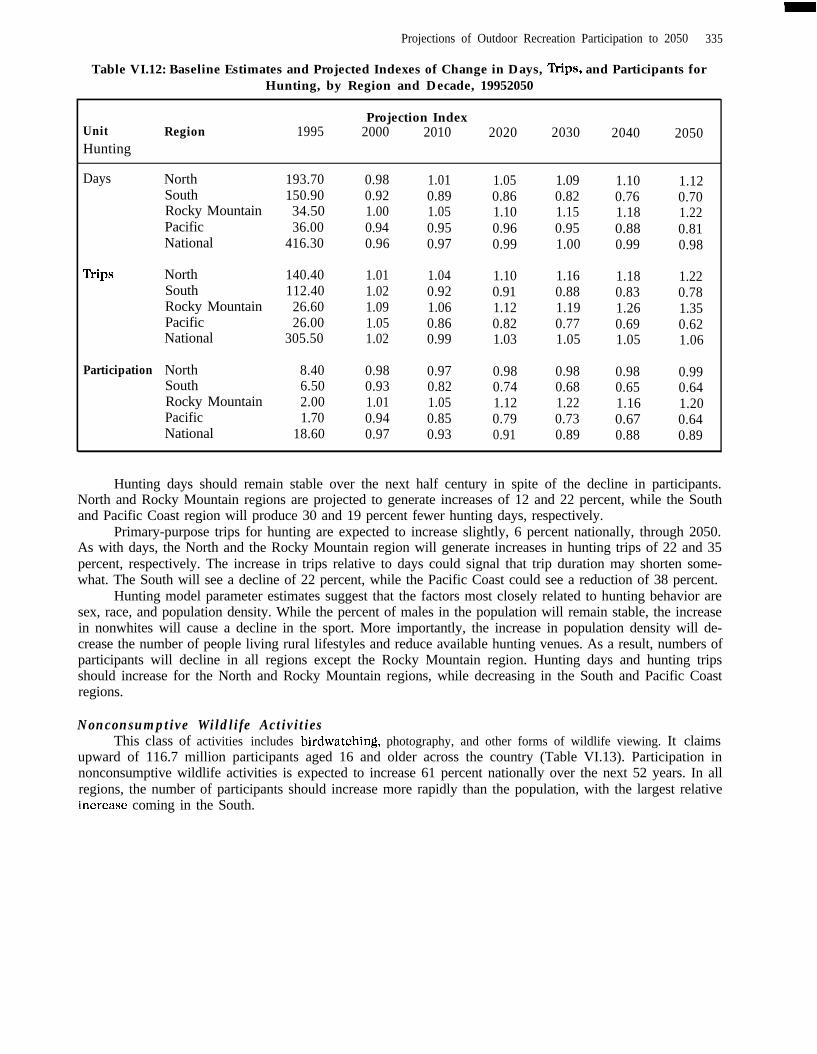
HuntingIn this section, big game, small game, and migratory bird hunting are combined into a general hunting
category. Hunting appears to be in a decline in popularity for those 16 and older. Nationally, it is projected thatthe next 52 years will see a reduction in the number of hunting participants by 11 percent, from today’s level ofnearly 19 million to about 16.5 million (Table VI.12). As a proportion of the general population, the decline ismore apparent. The Rocky Mountain region will experience an increase in hunters of about 20 percent whilethe number of hunters in the North will remain constant. Participation will decline by about 3.5 percent in thePacific Coast and South regions.
Projections of Outdoor Recreation Participation to 2050 335
Table VI.12: Baseline Estimates and Projected Indexes of Change in Days, Trips, and Participants forHunting, by Region and Decade, 19952050
UnitHunting
Region 1995Projection Index
2000 2010 2020 2030 2040 2050
Days North 193.70 0.98 1.01 1.05 1.09 1.10 1.12South 150.90 0.92 0.89 0.86 0.82 0.76 0.70Rocky Mountain 34.50 1.00 1.05 1.10 1.15 1.18 1.22Pacific 36.00 0.94 0.95 0.96 0.95 0.88 0.81National 416.30 0.96 0.97 0.99 1.00 0.99 0.98
l-Yips North 140.40 1.01 1.04 1.10 1.16 1.18 1.22South 112.40 1.02 0.92 0.91 0.88 0.83 0.78Rocky Mountain 26.60 1.09 1.06 1.12 1.19 1.26 1.35Pacific 26.00 1.05 0.86 0.82 0.77 0.69 0.62National 305.50 1.02 0.99 1.03 1.05 1.05 1.06
Participation North 8.40 0.98 0.97 0.98 0.98 0.98 0.99South 6.50 0.93 0.82 0.74 0.68 0.65 0.64Rocky Mountain 2.00 1.01 1.05 1.12 1.22 1.16 1.20Pacific 1.70 0.94 0.85 0.79 0.73 0.67 0.64National 18.60 0.97 0.93 0.91 0.89 0.88 0.89
Hunting days should remain stable over the next half century in spite of the decline in participants.North and Rocky Mountain regions are projected to generate increases of 12 and 22 percent, while the Southand Pacific Coast region will produce 30 and 19 percent fewer hunting days, respectively.
Primary-purpose trips for hunting are expected to increase slightly, 6 percent nationally, through 2050.As with days, the North and the Rocky Mountain region will generate increases in hunting trips of 22 and 35percent, respectively. The increase in trips relative to days could signal that trip duration may shorten some-what. The South will see a decline of 22 percent, while the Pacific Coast could see a reduction of 38 percent.
Hunting model parameter estimates suggest that the factors most closely related to hunting behavior aresex, race, and population density. While the percent of males in the population will remain stable, the increasein nonwhites will cause a decline in the sport. More importantly, the increase in population density will de-crease the number of people living rural lifestyles and reduce available hunting venues. As a result, numbers ofparticipants will decline in all regions except the Rocky Mountain region. Hunting days and hunting tripsshould increase for the North and Rocky Mountain regions, while decreasing in the South and Pacific Coastregions.
Nonconsumptive Wildlife ActivitiesThis class of activities includes birdwatching, photography, and other forms of wildlife viewing. It claims
upward of 116.7 million participants aged 16 and older across the country (Table VI.13). Participation innonconsumptive wildlife activities is expected to increase 61 percent nationally over the next 52 years. In allregions, the number of participants should increase more rapidly than the population, with the largest relativeincrease coming in the South.

3 3 6 Outdoor Recreation in American Life
Table VI.13: Baseline Estimates and Projected Indexes of Change in Days, Trips, and Participants forNonconsumptive Wildlife Activities, by Region and Decade, 19952050
Unit Region 1995Nonconsumptive Wildlife Activities
Projection Index2000 2010 2020 2030 2040 2050
Days North 3319.30 1.04 1.22 1.44 1.63 1.72 1.76South 2322.10 1.09 1.32 1.59 1.85 2.06 2.20Rocky Mountain 578.90 1.09 1.28 1.49 1.68 1.84 1.94Pacific 838.50 1.10 1.33 1.58 1.82 2.01 2.14National 7057.10 1.07 1.27 1.51 1.73 1.88 1.97
Trips North 1154.40 0.96 1.02 1.09 1.09 1.02 0.90South 746.30 1.04 1.08 1.14 1.18 1.17 1.11Rocky Mountain 180.60 1.08 1.11 1.16 1.21 1.26 1.30Pacific 212.80 1.03 1.23 1.39 1.53 1.61 1.62National 2277.10 1.00 1.07 1.15 1.18 1.15 1.08
Participation North 56.00 1.01 1.10 1.21 1.30 1.35 1.40South 34.20 1.07 1.22 1.38 1.54 1.71 1.86Rocky Mountain 9.60 1.07 1.20 1.30 1.47 1.89 1.70Pacific 16.70 1.08 1.23 1.37 1.52 1.65 1.77National 116.70 1.04 1.16 1.29 1.41 1.51 1.61
Days of nonconsumptive wildlife activity are expected to increase by 97 percent nationally. The in-creases are similar across all regions but the biggest relative increases, 114 and 120 percent, are projected forthe Pacific Coast and South, respectively.
Primary-purpose nonconsumptive wildlife trips are also projected to increase nationally, but at a ratewell below population growth. In fact, in the North the number of trips is expected to decline by 10 percentover the next 52 years. The discrepancy between the tremendous increase in days and the relatively smallincrease in primary-purpose trips could be explained by the complementary or incidental nature ofnonconsumptive wildlife activity in multipurpose recreation trips (U.S. Fish & Wildlife Service, 1997).
Race is not a strong predictor of nonconsumptive wildlife activity. Sex is a strong predictor, since womenare more likely to be participants than men. The largest factor contributing to the increase in nonconsumptivewildlife recreation, however, appears to be the increasing age of the population.
Wildlife-related outdoor recreation will continue to be enjoyed by large numbers of Americans. Of thethree general forms discussed above, nonconsumptive wildlife activity should experience the greatest relativegrowth in participation over the next 52 years. Fishing should provide about the same percentage increase inprimary-purpose trips as nonconsumptive wildlife activity. Currently, fishing provides about twice as manyprimary-purpose trips as nonconsumptive wildlife activities and about three times as many trips as the variousforms of hunting combined. The biggest relative increase in days for any of the wildlife-related activities will bein nonconsumptive wildlife activity. This growth is probably due to the complementary nature of this activitywith other forms of outdoor recreation and to the year-round opportunities to observe wildlife.
Dispersed Land Activities
In this section, we report projections to 2050 for a number of dispersed land activities including back-packing, hiking, horseback riding, off-road driving, primitive camping, and rock climbing. In general, with theexception of horseback riding, these activities take place primarily in undeveloped or less developed outdoorenvironments. Except for primitive camping, these activities fall into the “Outdoor Adventure” category inChapter V.
Projections of Outdoor Recreation Participation to 2050 337
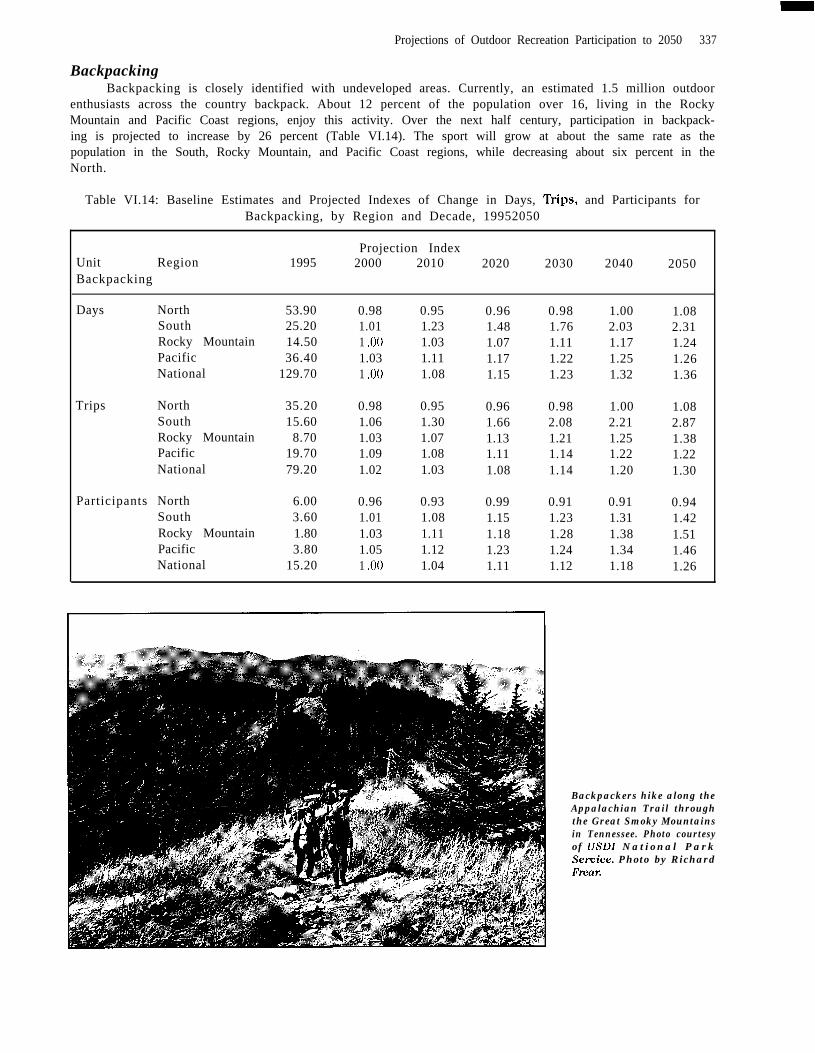
BackpackingBackpacking is closely identified with undeveloped areas. Currently, an estimated 1.5 million outdoor
enthusiasts across the country backpack. About 12 percent of the population over 16, living in the RockyMountain and Pacific Coast regions, enjoy this activity. Over the next half century, participation in backpack-ing is projected to increase by 26 percent (Table VI.14). The sport will grow at about the same rate as thepopulation in the South, Rocky Mountain, and Pacific Coast regions, while decreasing about six percent in theNorth.
Table VI.14: Baseline Estimates and Projected Indexes of Change in Days, Trips, and Participants forBackpacking, by Region and Decade, 19952050
Projection IndexUnit Region 1995 2000 2010 2020 2030 2040 2050Backpacking
Days North 53.90 0.98 0.95 0.96 0.98 1.00 1.08South 25.20 1.01 1.23 1.48 1.76 2.03 2.31Rocky Mountain 14.50 1 .oo 1.03 1.07 1.11 1.17 1.24Pacific 36.40 1.03 1.11 1.17 1.22 1.25 1.26National 129.70 1 .oo 1.08 1.15 1.23 1.32 1.36
Trips North 35.20 0.98 0.95 0.96 0.98 1.00 1.08South 15.60 1.06 1.30 1.66 2.08 2.21 2.87Rocky Mountain 8.70 1.03 1.07 1.13 1.21 1.25 1.38Pacific 19.70 1.09 1.08 1.11 1.14 1.22 1.22National 79.20 1.02 1.03 1.08 1.14 1.20 1.30
Participants North 6.00 0.96 0.93 0.99 0.91 0.91 0.94South 3.60 1.01 1.08 1.15 1.23 1.31 1.42Rocky Mountain 1.80 1.03 1.11 1.18 1.28 1.38 1.51Pacific 3.80 1.05 1.12 1.23 1.24 1.34 1.46National 15.20 1 .oo 1.04 1.11 1.12 1.18 1.26
Backpackers hike along theAppalachian Trail throughthe Great Smoky Mountainsin Tennessee. Photo courtesyof USDI National ParkSemite. Photo by RichardFrear.

3 3 8 Outdoor Recreation in American Life
Backpacking days are expected to increase faster than the rate of population growth in all regions. Pri-mary-purpose backpacking trips, like days, are expected to increase nationally at a rate faster than populationgrowth. With the exception of what appears to be a large increase in the South, growth in backpacking tripsshould be less than population growth in all other regions.
Race and income appear to be prime factors driving the backpacking forecasts. In general, an increase innonwhites in the population will retard the growth of backpacking. Income, while insignificant in many mod-els, appears to be the major factor leading to the large projected increases in days and trips in the South. Sinceincome is not as statistically significant in the South models, the large projected increases in that region shouldbe viewed with some suspicion.
HikingLike backpacking, hiking has long been a symbol of dispersed outdoor recreation. Of the “Outdoor Ad-
venture” activities reported in Chapter V, it is the most popular, accounting for close to 50 million participants,804.7 million days, and about 557.7 million primary-purpose trips in 1995 (Table VI.15). Nationally, hikingactivity can be expected to increase marginally faster than population growth. Participation in hiking willincrease from about 31 percent in the North to approximately 80 percent in the South and Pacific Coastregions.
Table VI.15 Baseline Estimates and Projected Indexes of Change in Days, Trips, and Participants forHiking, by Region and Decade, 1995-2050
UnitHiking
Region 199.5Projection Index
2000 2010 2020 2030 2040 2050
Days - North 330.30 0.99 1.04 1.11 1.17 1.19 1.23South 194.70 1.07 1.27 1.48 1.70 1.90 2.08Rocky Mountain 87.80 1.04 1.12 1.20 1.28 1.36 1.44Pacific 192.80 1.07 1.20 1.31 1.41 1.52 1.62National 804.70 1.03 1.14 1.24 1.34 1.43 1.51
Trips North 240.60 0.98 0.97 1.01 1.02 1.01 1.00South 117.60 1.14 1.30 1.53 1.78 1.92 2.32Rocky Mountain 62.90 1.04 1.12 1.21 1.30 1.37 1.50Pacific 135.90 1.07 1.25 1.42 1.58 1.70 1.87National 557.70 1.04 1.12 1.23 1.33 1.39 1.52
Participation North 20.60 0.99 1.04 1.11 1.19 1.24 1.31South 11.30 1.05 1.17 1.32 1.45 1.61 1.78Rocky Mountain 5.00 1.05 1.15 1.24 1.35 1.47 1.59Pacific 10.90 1.08 1.23 1.34 1.53 1.69 1.85National 47.80 1.03 1.13 1.23 1.34 1.45 1.57
Both days of hiking and primary-purpose trips will increase fastest in the South and Pacific Coast re-gions. The South will generate a 132-percent increase in trips by 2050, while the trips originating in the Northwill remain about constant over the next half century. In the South, hiking days will more than double. Thelarge increases expected in the South should put the region on par with the North in terms of total days andtotal trips.
Interestingly, the supply variable for this activity is not significant for either the South or Pacific Coastregions, possibly suggesting that ample opportunities near population centers exist in both regions. The largeincreases projected for the South could change this relationship. Moreover, population density in many of theregional models is insignificant or significant and positive indicating that this sport is less associated with arural lifestyle than activities like hunting, fishing, or motorboating.

Projections of Outdoor Recreation Participation to 2050 3 3 9
Horseback RidingHorseback riding may be considered a dispersed or developed land activity because it takes place in such
diverse locations as suburban riding academies and stables, rural farms and ranches, and back country forestareas. While this activity currently has about the same number of enthusiasts as backpacking (about 1.5 mil-lion), it more than doubles backpacking in terms of primary-purpose trips and activity days. It is behind onlyhiking and off-road driving among dispersed land activities.
Based on the estimated models, participation in horseback riding is expected to increase faster thanpopulation growth in all regions, with the biggest relative increase coming in the South at 82 percent by theyear 2050. Likewise, primary-purpose trips and activity days of horseback riding are expected to increasefaster than the population in all regions (Table VI.16)
Table VI.16: Baseline Estimates and Projected Indexes of Change in Days, ‘Dips, and Participants forHorseback Biding, by Region and Decade, 1995-2050
Unit RegionHorseback Riding
199sProjection Index
2000 2010 2020 2030 2040 2050
Days North 108.50 1.03 1.14 1.30 1.48 1.70 2.03South 104.10 0.97 1.06 1.15 1.23 1.26 1.27Rocky Mountain 48.20 1.00 1.06 1.14 1.22 1.34 1.51Pacific 76.70 1 .oo 1.10 1.21 1.34 1.49 1.70National 336.30 1.00 1.10 1.22 1.35 1.49 1.69
Trips North 68.70 1.02 1.10 1.22 1.33 1.39 1.47South 55.00 1.02 1.20 1.43 1.67 1.78 1.97Rocky Mountain 23.00 1.01 1.05 1.11 1.21 1.38 1.66Pacific 38.00 1.00 1.18 1.37 1.59 1.82 2.09National 185.10 1.01 1.14 1.29 1.46 1.60 1.77
Participation North 5.60 1.00 1.07 1.18 1.28 1.39 1.54South 4.70 1.04 1.15 1.28 1.42 1.60 1.82Rocky Mountain 1.70 1.04 1.13 1.23 1.34 1.46 1.60Pacific 2.40 1.05 1.18 1.29 1.46 1.61 1.77National 14.30 1.02 1.12 1.23 1.35 1.49 1.66
Forecast increases in this activity run somewhat contrary to trends reported in Chapter V. There is astrong positive relationship between income and riding. The forecast 88-percent increase over the 52-yearperiod (Torgerson, 1996), suggests a large increase in horseback riding. A factor that may have led to theforecast of somewhat higher horseback riding than past trends would suggest is the lack of a buffering effect inthe models from reduced availability of places to ride. In fact, for the populous North and South, no appropriatesupply variable could be identified. Yet, horse riding groups make the point that trails for riding are increas-ingly scarce. Race influences the likelihood of horseback riding, but unlike many other outdoor recreationactivities, sex is negative or insignificant in the majority of models. Horseback riding is not a male-dominatedsport.
Off-Road DrivingOff-road driving is currently practiced by about 28 million Americans accounting for 522.6 million pri-
mary-purpose trips and 685.5 million activity days annually. Over 20 percent of Rocky Mountain region resi-dents and close to 15 percent of Southern and Pacific Coast residents are involved in this activity.
Participation in this activity is expected to grow in all regions over the next half century. However, thenational rate, at 16 percent, should be slower than that of population growth. The biggest increase, at 37percent, will be in the Rocky Mountain region (Table VI.17).

340 Outdoor Recreation in American Life
Table VI.17: Baseline Estimates and Projected Indexes of Change in Days, Trips, and Participants for Off-Road Driving by Region and Decade 1995-2050
Unit RegionOff-Road Driving
1995Projection Index
2000 2010 2020 2030 2040 2050
Days North 308.30 0.94 0.87 0.82 0.76 0.70 0.66South 219.00 1.03 1.08 1.13 1.19 1.27 1.38Rocky Mountain 57.30 1.04 1.12 1.20 1.29 1.40 1.54Pacific 98.90 1.05 1.09 1.13 1.18 1.28 1.42National 685.50 0.99 0.99 0.99 1.00 1.03 1.07
Trips North 211.40 0.92 0.79 0.69 0.60 0.52 0.45South 201.60 1.01 0.93 0.88 0.84 0.88 0.79Rocky Mountain 47.90 1.04 1.08 1.14 1.20 1.26 1.40Pacific 61.60 1.06 1.15 1.27 1.38 1.48 1.60National 522.60 0.98 0.91 0.86 0.82 0.82 0.78
Participation North 11.20 0.99 0.99 1.06 1.03 1.04 1.09South 9.00 1.00 0.99 1.03 1.01 1.04 1.10Rocky Mountain 3.00 1.04 1.09 1.17 1.19 1.27 1.37Pacific 4.70 1.04 1.10 1.20 1.20 1.26 1.33National 27.90 1 .OO 1.02 1.05 1.06 1.10 1.16
Days of off-road driving should increase in all regions except the North, where a 34-percent decline isexpected. The Rocky Mountain region will see the biggest increase in days at about 54 percent, followed by thePacific Coast and South regions, at about 40 percent each. Nationally, the increase should be around sevenpercent.
Trips specifically for off-road driving are expected to increase in the Rocky Mountain and Pacific Coastregions, while decreasing by more than 50 percent in the North and by about 22 percent in the South. Overall,a 16-percent decrease is forecast nationally.
The two most apparent factors causing declining numbers of trips in the North and South appear to beage and income (TA V1.A). In the North, this sport appears to be more popular among lower income people.Hence, in a forecasting model, increasing income causes a drop in the number of trips. The activity also ap-pears more popular with people who are younger than average. Thus as average age increases, the predictednumber of trips decreases. The same is true for the South, but to a lesser extent.
Primitive CampingCamping in primitive areas, while more popular than backpacking, lags behind many of the other dis-
persed land activities. It accounts for around 258.6 million days and 146.6 million primary-purpose trips annu-ally. The number of participants in primitive camping should increase about 10 percent nationally through2050. Increases will occur in the Rocky Mountain and Pacific Coast regions, while the North will experience al6-percent decline from current levels (Table VI.18).
Projections of Outdoor Recreation Participation to 2050 341
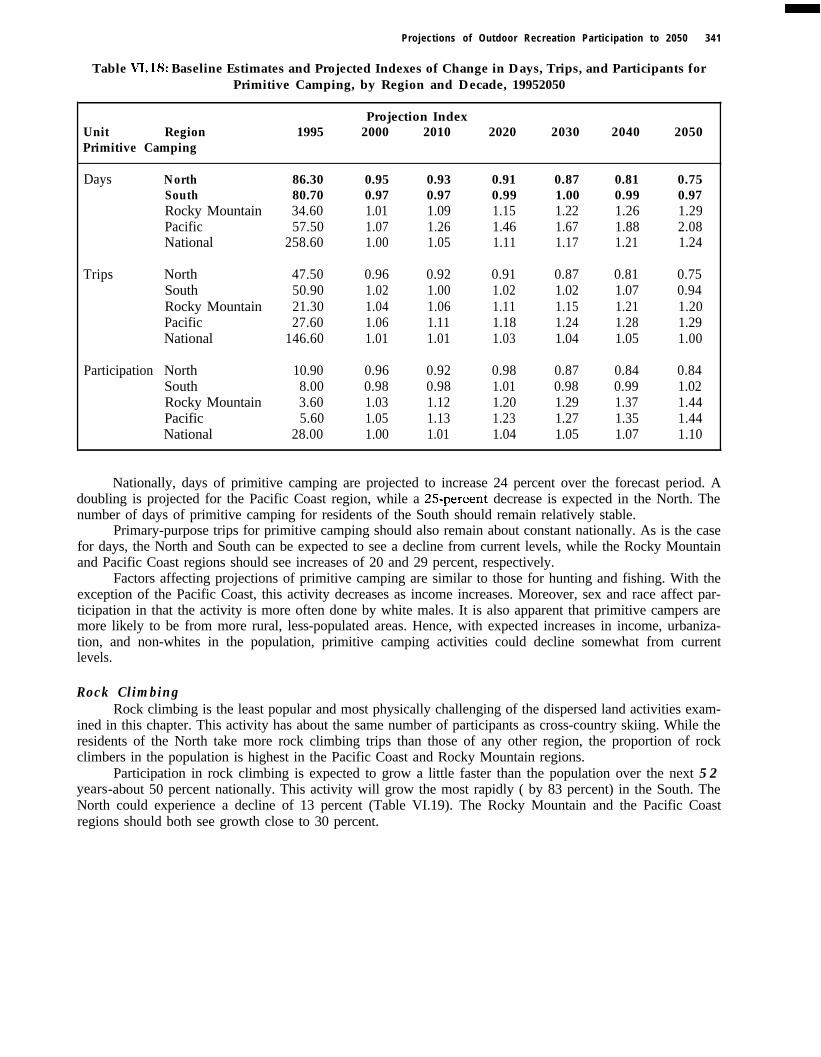
Table VI.18: Baseline Estimates and Projected Indexes of Change in Days, Trips, and Participants forPrimitive Camping, by Region and Decade, 19952050
Unit RegionPrimitive Camping
1995Projection Index
2000 2010 2020 2030 2040 2050
Days North 86.30 0.95 0.93 0.91 0.87 0.81 0.75South 80.70 0.97 0.97 0.99 1.00 0.99 0.97Rocky Mountain 34.60 1.01 1.09 1.15 1.22 1.26 1.29Pacific 57.50 1.07 1.26 1.46 1.67 1.88 2.08National 258.60 1.00 1.05 1.11 1.17 1.21 1.24
Trips North 47.50 0.96 0.92 0.91 0.87 0.81 0.75South 50.90 1.02 1.00 1.02 1.02 1.07 0.94Rocky Mountain 21.30 1.04 1.06 1.11 1.15 1.21 1.20Pacific 27.60 1.06 1.11 1.18 1.24 1.28 1.29National 146.60 1.01 1.01 1.03 1.04 1.05 1.00
Participation North 10.90 0.96 0.92 0.98 0.87 0.84 0.84South 8.00 0.98 0.98 1.01 0.98 0.99 1.02Rocky Mountain 3.60 1.03 1.12 1.20 1.29 1.37 1.44Pacific 5.60 1.05 1.13 1.23 1.27 1.35 1.44National 28.00 1.00 1.01 1.04 1.05 1.07 1.10
Nationally, days of primitive camping are projected to increase 24 percent over the forecast period. Adoubling is projected for the Pacific Coast region, while a 25-percent decrease is expected in the North. Thenumber of days of primitive camping for residents of the South should remain relatively stable.
Primary-purpose trips for primitive camping should also remain about constant nationally. As is the casefor days, the North and South can be expected to see a decline from current levels, while the Rocky Mountainand Pacific Coast regions should see increases of 20 and 29 percent, respectively.
Factors affecting projections of primitive camping are similar to those for hunting and fishing. With theexception of the Pacific Coast, this activity decreases as income increases. Moreover, sex and race affect par-ticipation in that the activity is more often done by white males. It is also apparent that primitive campers aremore likely to be from more rural, less-populated areas. Hence, with expected increases in income, urbaniza-tion, and non-whites in the population, primitive camping activities could decline somewhat from currentlevels.
Rock ClimbingRock climbing is the least popular and most physically challenging of the dispersed land activities exam-
ined in this chapter. This activity has about the same number of participants as cross-country skiing. While theresidents of the North take more rock climbing trips than those of any other region, the proportion of rockclimbers in the population is highest in the Pacific Coast and Rocky Mountain regions.
Participation in rock climbing is expected to grow a little faster than the population over the next 52years-about 50 percent nationally. This activity will grow the most rapidly ( by 83 percent) in the South. TheNorth could experience a decline of 13 percent (Table VI.19). The Rocky Mountain and the Pacific Coastregions should both see growth close to 30 percent.

3 4 2 Outdoor Recreation in American Life
Table VI.19: Baseline Estimates and Projected Indexes of Change in Days, Trips, and Participants forRock Climbing, by Region and Decade, 19952050
Unit RegionRock Climbing
199.5Projection Index
2000 2010 2020 2030 2040 2050
Days North 13.50 0.98 1.00 1.06 1.12 1.20 1.34South 6.10 1.07 1.24 1.45 1.72 2.10 2.64Rocky Mountain 8.30 1.01 1.04 1.06 1.09 1.14 1.19Pacific 9.90 1.03 1.07 1.09 1.14 1.25 1.42National 37.70 1.01 1.07 1.15 1.24 1.39 1.60
Trips North 10.90 0.96 0.87 0.83 0.79 0.77 0.78South 5.90 1.12 1.27 1.51 1.86 2.43 3.40Rocky Mountain 8.70 1.05 1.05 1.07 1.11 1.16 1.24Pacific 8.30 1.06 1.09 1.14 1.23 1.40 1.65National 34.00 1.02 1.00 1.03 1.09 1.19 1.38
Participation North 3.00 0.96 0.91 0.97 0.86 0.85 0.87South 1.80 1.06 1.19 1.32 1.47 1.64 1.83Rocky Mountain 1.00 1.03 1.06 1.15 1.13 1.19 1.28Pacific 1.70 1.03 1.06 1.16 1.12 1.21 1.34National 7.50 1.03 1.10 1.21 1.26 1.36 1.50
Nationally, days and primary-purpose rock climbing trips should both increase about 60 percent and 38percent, respectively, over the coming half century. Major increases for both trips and days are forecast for theSouth, while the North may see a decrease in the number of trips by around 20 percent. The Pacific Coastregion will also see an increase in trips that exceeds population growth.
The statistical models project growth in the Pacific Coast and South because of positive relationshipbetween income and involvement in this activity. These relationships do not appear to hold in the North or theRocky Mountain region. As with a number of other outdoordispersed land activities, race is a strong explana-tory variable.
Developed Land Activities
Participation projections are reported for seven land-based activities that occur in developed settings.These activities include developed camping, biking, family gathering, visiting historical places, picnicking,sightseeing, and walking. Four of these (family gathering, picnicking, sightseeing, and walking) are among thefive most popular activities in the nation. Together, these seven developed land activities account for over 20billion activity days.
BikingNationally, the number of biking participants is expected to grow by 70 percent by the middle of the next
century. In the South, the percentage growth in participants is expected to be greatest, with the number ofparticipants nearly doubling in the next 52 years (Table VI.20). Although percentage growth in the North willbe the lowest among the regions (58 percent increase), the greatest increase in absolute number of participantswill occur in that region.

Projections of Outdoor Recreation Participation to 2050 3 4 3
Table VI.20: Baseline Estimates and Projected Indexes of Change in Days, Trips, and Participants forBiking, by Region and Decade, 1995-2050
UnitBiking
Region 1995Projection Index
2000 2010 2020 2030 2040 2050
Days North 1055.20 1.01 1.09 1.19 1.29 1.40 1.55South 599.60 1.08 1.21 1.36 1.53 1.74 1.98Rocky Mountain 180.30 1.04 1.13 1.21 1.29 1.36 1.42Pacific 400.90 1.06 1.16 1.24 1.33 1.43 1.55National 2237.00 1.04 1.14 1.25 1.36 1.49 1.66
Trips North 656.20 1.03 1.17 1.35 1.52 1.67 1.85South 362.00 1.12 1.33 1.59 1.88 2.20 2.54Rocky Mountain 115.30 1.05 1.10 1.17 1.26 1.36 1.48Pacific 250.40 1.14 1.34 1.60 1.89 2.23 2.60National 1386.80 1.08 1.24 1.45 1.67 1.90 2.16
Participation North 27.90 1.01 1.10 1.17 1.33 1.43 1.58South 15.20 1.07 1.22 1.38 1.55 1.74 1.95Rocky Mountain 4.50 1.05 1.17 1.26 1.40 1.53 1.65Pacific 9.80 1.06 1.19 1.29 1.41 1.53 1.65National 57.40 1.04 1.15 1.28 1.41 1.54 1.70
The national number of days of biking participation is expected to increase by nearly 70 percent between1998 and 2050. Regionally, the percentage growth in days of participation will be slightly less than growth inparticipants for all regions except the South. In the South, since participation is possible year-round for themost part, participation days will increase slightly faster than participant growth. Nevertheless, residents of theNorth will continue to account for more days of participation than will residents of any other region.
Trips for biking are expected to more than double in the next 52 years for the nation as a whole. In boththe South and Pacific Coast regions, the number of trips taken for biking in 2050 is expected to be more than2.5 times the current level. By comparison, an increase in the number of trips of fewer than 50 percent isexpected for Rocky Mountain region residents. Residents of the North and South will continue to account forover two-thirds of all biking trips.
Developed CampingIn 1995, about 41.5 million people participated in developed camping (see Chapter V). Over the next 52
years, this number is expected to increase by about 50 percent (Table VI.21). Participant growth will be veryuneven across regions. The number of participants will nearly double in the South, while increasing less than10 percent in the North. These regional differences in rates are directly tied to differences in the estimatedrelation between income and participation. For example, in the South and Pacific Coast, income has a strongand positive relationship on the likelihood of participation. As income rises, therefore, so does participation. Inthe North, however, income growth exerts a slightly downward influence on participation projections. Cur-rently, there are more participants in the North than in any other region. By 2050, it is expected that moreparticipants will live in the South than in any other region.

3 4 4 Outdoor Recreation in American Life
Table VI.21: Baseline Estimates and Projected Indexes of Change in Days, ‘Ikips, and Participants forDeveloped Camping, by Region and Decade, 1995-2050
Developed CampingUnit Region 1995
Projection Index
2000 2010 2020 2030 2040 2050
Days North 195.00 1.00 1.09 1.19 1.27 1.31 1.32South 115.50 1.10 1.37 1.68 2.03 2.41 2.82Rocky Mountain 39.30 1.04 1.14 1.25 1.35 1.43 1.50Pacific 92.90 1.07 1.23 1.39 1.56 1.73 1.88National 442.40 1.04 1.19 1.36 1.53 1.68 1.83
Trips North 88.50 0.99 1.06 1.16 1.24 1.28 1.34South 56.70 1.09 1.38 1.74 2.16 2.66 3.28Rocky Mountain 19.10 1.04 1.14 1.25 1.35 1.44 1.51Pacific 45.30 1.03 1.11 1.19 1.26 1.33 1.41National 209.60 1.03 1.15 1.30 1.46 1.62 1.80
Participation North 18.00 0.98 1.11 1.04 1.06 1.07 1.09South 10.70 1.06 1.22 1.34 1.58 1.77 1.97Rocky Mountain 4.00 1.03 1.16 1.17 1.23 1.29 1.34Pacific 8.80 1.06 1.19 1.32 1.45 1.59 1.73National 41.50 1.02 1.12 1.19 1.30 1.39 1.49
Days of participation in developed camping are expected to increase by over 80 percent from 1995 to2050. This rise is led by an increase of over 2.8 times current levels in the South. In all regions, activity dayswill increase more rapidly than numbers of participants. This growth is especially true in the eastern regions.In the North, percentage growth in activity days is more than three times the rate of participant growth. In theSouth, activity days are expected to grow twice as fast as participants. This comparison indicates that peoplewho camp in developed campgrounds will do so more often in the future than they do now.
The number of trips for developed camping is expected to increase 80 percent from 1995 to 2050. In theSouth, the number of trips is expected to triple in the next 52 years. In all other regions, trips will grow between34 and 51 percent during the same time period. Since the number of trips grows at the same rate as the numberof days, we expect the average length of a camping trip will remain stable in the future.
Family GatheringFamily gathering in the outdoors ranks among the four most popular outdoor recreation activities in the
country. Between now and 2050, about a 60-percent increase is expected in the number of people who partici-pate in this activity (Table VI.22). In each region, the percentage increase in participation outpaces populationgrowth, indicating that the proportion of the population that participates in this activity will increase in thefuture. There is expected to be a 41-percent increase in the number of participants who live in the North, a 65-percent increase in both western regions, and a 76-percent increase in participants from the South. Eventhough percentage growth will be slowest in the North, in 2050 that region will still be the home for over 40percent of all participants in this activity.

Projections of Outdoor Recreation Participation to 2050 345
Table VI.22: Baseline Estimates and Projected Indexes of Change in Days, ‘Dips, and Participants forFamily Gathering, by Region and Decade, 19952050
Family GatheringUnit Region 1995
Projection Index
2000 2010 2020 2030 2040 2050
Days North 500.80 1.01 1.07 1.15 1.21 1.27 1.34South 311.20 1.06 1.18 1.30 1.43 1.58 1.75Rocky Mountain 92.30 1.06 1.18 1.30 1.42 1.54 1.65Pacific 180.40 1.07 1.19 1.29 1.40 1.54 1.71National 1084.50 1.04 1.13 1.23 1.32 1.42 1.54
Trips North 400.70 0.92 0.76 0.65 0.55 0.46 0.40South 240.40 1.01 0.92 0.85 0.81 0.86 0.77Rocky Mountain 70.40 1.04 1.08 1.14 1.20 1.26 1.40Pacific 144.20 1.07 1.17 1.30 1.43 1.53 1.66National 855.60 0.98 0.89 0.83 0.79 0.79 0.75
Participation North 58.10 1.02 1.09 1.16 1.26 1.33 1.41South 37.00 1.07 1.20 1.34 1.48 1.62 1.76Rocky Mountain 9.40 1.07 1.19 1.29 1.43 1.54 1.65Pacific 19.30 1.07 1.20 1.30 1.42 1.54 1.65National 123.80 1.04 1.14 1.24 1.36 1.46 1.57
Activity days for family gathering are projected to increase at about the same rate, both nationally andregionally, as participant growth. Nationally, activity days are expected to grow by 54 percent over the next 52years. Growth in activity days is expected to be about 75 percent in the South, 71 percent in the Pacific Coast,65 percent in the Rocky Mountain region, and 34 percent in the North.
Despite projected growth in participation and activity days, the models indicate a steady decline in thenational number of trips for this activity. Curiously, there are dramatic differences between projections forwestern and eastern regions. In the Pacific Coast and Rocky Mountain regions, trips for the primary purpose ofa family gathering are projected to increase by 66 and 40 percent, respectively. In the North and South, tripsfor the primary purpose of a family gathering are expected to decline by 60 and 23 percent, respectively. Thisdifference may indicate that in the eastern regions, family gathering activities will increasingly be incidentalparts of longer or multipurpose recreation trips.
PicnickingPicnicking is enjoyed by more than half of the population over the age of 16 in the United States. Over
the next 52 years, that percentage will continue to increase. The projected .54-percent increase in number ofparticipants exceeds population growth in that age category (Table VI.23). As is the case with most developedland activities, percentage growth in participants will be the greatest in the South (80 percent), and the least inthe North (35 percent).

346 Outdoor Recreation in American Life
Table VI.23: Baseline Estimates and Projected Indexes of Change in Days, Trips, and Participants forPicnicking, by Region and Decade, 19952050
Projection IndexUnit Region 1995 2000 2010 2020 2030 2040 2050Picnicking
Days North 500.80 1 .OO 1.07 1.16 1.22 1.24 1.23South 311.20 1.07 1.19 1.32 1.47 1.64 1.83Rocky Mountain 92.30 1 .os 1.17 1.29 1.40 1.48 1.54Pacific 180.40 1 .O6 1.21 1.35 1.48 1.57 1.62National 1084.50 1.03 1.14 1.26 1.35 1.42 1.49
rrips North 400.70 0.91 0.72 0.58 0.48 0.40 0.30South 240.40 0.94 0.76 0.65 0.57 0.52 0.49Rocky Mountain 70.40 1 .Ol 0.99 1.00 1.03 1.08 1.16Pacific 144.20 1.06 1.15 1.26 1.38 1.47 1.57National 855.60 0.94 0.79 0.70 0.63 0.59 0.55
Participation North 47.00 1.01 1.08 1.15 1.25 1.29 1.35South 27.40 1.06 1.21 1.38 1.52 1.67 1.80Rocky Mountain 8.10 1.06 1.18 1.28 1.42 1.53 1.62Pacific 15.80 1.07 1.20 1.31 1.44 1.54 1.63National 98.30 1.04 1.14 1.25 1.37 1.45 1.54
Growth in activity days for picnicking is projected to be about the same as participant growth. Nation-ally, a 49percent growth in activity days is projected by 2050. In the South, the growth rate is expected to beabout 83 percent during that time period. By comparison, growth in activity days for western residents isexpected to be about 60 percent, and only about 23 percent for the North.
Like family gath-erings, a sharp decline inthe number of primary-purpose trips for pic-nicking is predicted forboth of the eastern re-gions. For both of theseregions, the number ofprimary purpose tripsfor picnics in 2050 willbe less than half of thecurrent levels, despiteincreases in both par-t ic ipants and act iv i tydays. In contrast, bothwestern regions are pro-jected to have increasesin the number of tripstaken by residents forthe primary purpose ofpicnicking, including a16-percent increase byresidents of the RockyMountain region, andnearly a 60-percent in- Picnicking remuins one of the most pop&r outdoor activities. Photo courtesy of the USDA
crease by residents ofForest Service.
the Pacific Coast region.

Projections of Outdoor Recreation Participation to 2050 347
SightseeingFor the nation and for each region, the growth in number of sightseers is expected to be between 50 and
96 percent (Table VI.24). Overall, a 71-percent increase in the number of participants is expected between nowand 2050. Percentage growth is expected to be nearly twice as high in the South as in the North.
Table VI.24: Baseline Estimates and Projected Indexes of Change in Days, Trips, and Participants forSightseeing, by Region and Decade, 1995-2050
Projection IndexUnit Region 1995 2000 2010 2020 2030 2040 2050Sightseeing
Days North 904.80 1.04 1.27 1.38 1.55 1.68 1.80South 605.40 1.07 1.23 1.40 1.58 1.78 1.99Rocky Mountain 163.30 1.08 1.24 1.41 1.58 1.73 1.85Pacific 363.50 1.12 1.38 1.67 1.98 2.29 2.59National 2036.30 1.06 1.27 1.43 1.63 1.81 1.98
Trips North 511.20 1.03 1.14 1.29 1.43 1.48 1.62South 379.50 1.08 1.19 1.53 1.79 1.90 2.31Rocky Mountain 95.00 1.07 1.23 1.40 1.57 1.66 1.90Pacific 225.20 1.11 1.36 1.62 1.89 2.03 2.38National 1209.50 1.06 1.20 1.43 1.63 1.72 1.98
Participation North 52.30 1.02 1.11 1.23 1.33 1.41 1.50South 33.90 1.08 1.25 1.43 1.61 1.79 1.96Rocky Mountain 8.70 1.07 1.21 1.32 1.49 1.63 1.74Pacific 18.50 1.09 1.26 1.42 1.58 1.74 1.87National 113.40 1.05 1.18 1.32 1.47 1.59 1.71
The number of activity days for sightseeing is expected to double in the U.S. by 2050. Activity days byresidents of the Pacific Coast region will increase 260 percent. However, the relatively small number of partici-pants in that region means that the national average will be closer to the growth rate in the North and South.Even in the slower-growing North, however, activity days are expected to increase by about 80 percent.
Sightseeing trips are also expected to double nationally over the next 52 years. Trips taken by residentsof the North and Rocky Mountain regions will not quite double in that period. However, in the South and PacificCoast regions, the number of trips taken by residents for sightseeing will increase by more than 130 percent ofcurrent levels.
Visiting Historic PlacesThe number of people who visit historical places is expected to increase steadily by 13 to 17 percent of
the 1995 total during each lo-year period from the turn of the century to 2050 (Table VI.25). By 2050, the totalnumber of participants will be more than 75 percent above 1995 levels. Both the South and Rocky Mountainregions will show growth above the national average. Even in the North and Pacific Coast regions, which willhave the lowest levels of growth, rates of increase in numbers of participants will be greater than populationgrowth.

348 Outdoor Recreation in American Life
Table VI.25: Baseline Estimates and Projected Indexes of Change in Days, ‘IYips, and Participants forVisiting Historic Places, by Region and Decade, 1995-2050
Visiting Historic PlacesUnit Region 1995
Projection Index
2000 2010 2020 2030 2040 2050
Days North 203.20 1.03 1.20 1.42 1.60 1.71 1.79South 172.90 1.11 1.35 1.63 1.97 2.36 2.83Rocky Mountain 38.70 1.07 1.23 1.40 1.57 1.72 1.84Pacific 68.40 1.09 1.23 1.37 1.52 1.70 1.89National 482.40 1.07 1.26 1.48 1.71 1.93 2.16
Participation North 40.80 1.02 1.13 1.20 1.38 1.47 1.59South 26.90 1.08 1.28 1.48 1.70 1.90 2.09Rocky Mountain 6.90 1.08 1.23 1.34 1.54 1.69 1.83Pacific 13.80 1.08 1.22 1.33 1.46 1.58 1.68National 88.40 1.06 1.19 1.32 1.49 1.63 1.76
Across the country, activity days spent visiting historic places will increase at a steady rate. In the South,growth in days of activity for visiting historic places will be much greater than for the other three regions,doubling in a little more than 35 years. Growth in the other three regions will be roughly equal-about 80percent over the next 52 years.
WalkingWalking is also among the four most popular activities in the United States, with over 140 million partici-
pants. Over the next 52 years, growth in the number of participants will be at roughly the same level aspopulation growth (Table VI.26). However, participant growth rates will not be even across regions. Participantgrowth will be about 64 percent in the Rocky Mountain region and about 73 percent in the Pacific Coast. Theselevels are about 10 percent higher than projected population growth. In the North, the increase in the numberof participants will be about equal to the increase in the total population. In contrast, in the South the numberof participants is expected to grow by about 34 percent in 52 years, while the population grows 53 percent.
Table VI.26: Baseline Estimates and Projected Indexes of Change in Days, Trips, and Participants forWaking, by Region and Decade, 1995-2050
UnitWalking
Region 1995Projection Index
2000 2010 2020 2030 2040 2050
Days North 6568.70 1.04 1.14 1.27 1.37 1.44 1.52South 4395.40 1.07 1.20 1.33 1.47 1.60 1.72Rocky 1077.70 1.06 1.15 1.24 1.32 1.37 1.40Pacific 2340.60 1.09 1.22 1.34 1.46 1.58 1.68National 14381.40 1.06 1.17 1.29 1.40 1.50 1.58
ParticipationNorth 62.60 1.01 1.07 1.15 1.22 1.27 1.33South 40.00 1.03 1.07 1.11 1.16 1.23 1.34Rocky Mountain 10.00 1.06 1.18 1.28 1.41 1.53 1.64Pacific 21.10 1.08 1.23 1.34 1.49 1.62 1.73National 133.70 1.03 1.12 1.21 1.30 1.39 1.46

Projections of Outdoor Recreation Participation to 2050 349
Activity days of walking are expected to grow by about 30 percent over the next 25 years, and by an equalamount in the subsequent 30 years. Percentage growth in activity days is expected to be above the rate ofparticipant growth for both the North (52 percent) and South (72 percent). In the western regions, the percent-age growth in activity days will be less than the growth in participants.
In general, the number of participants in developed land activities will increase at least as fast as popula-tion growth rates for the next half century. Thus, we can expect an increasing proportion of the U.S. populationto engage in this type of recreation activity. In the South the proportion will grow the fastest for most of theseactivities. Fewer primary-purpose trips for several activities combined with increases in activity days indicatethat these activities increasingly will be parts of multipurpose recreation trips. Projections for developed camp-ing indicate a continuation of the trend of the last 30 years: a departure from multiple-week vacation trips andtoward weekend and long-weekend trips for many Americans.
KEY FINDINGS
National
The five fastest growing outdoor recreation activities through the year 2050 measured in activity daysare expected to be: visiting histo?ic places (116 percent growth), downhill skiing (110 percent growth),snowmobiling (99 percent growth), sightseeing (98 percent growth), and nonconsumptive wildlife activity (97percent growth). The five slowest growing outdoor recreation activities through the year 2050 as measured inactivity days are expected to be: fishing (27 percent growth), primitive camping (24 percent growth), cross-country skiing (18 percent growth), off-road vehicle driving (seven percent growth), and hunting (minus-twopercent growth).
In terms of annual primary-purpose trips, the five fastest growing outdoor recreation activities throughthe year 2050 are expected to be: downhill skiing (122 percent growth), biking (116 percent growth),snowmobiling (110 percent growth), sightseeing (98 percent growth), and developed camping (80 percentgrowth). The five slowest growing outdoor recreation activities as measured by primary-purpose trips are ex-pected to be: hunting (six percent growth), primitive camping (zero percent growth), off-road vehicle driving(minus 22 percent growth), family gatherings (minus 2.5 percent growth), and picnicking (minus 45 percentgrowth).
The five fastest growing outdoor recreation activities through the year 2050 as measured by number ofparticipants are projected to be: cross-country skiing (95 percent growth), downhill skiing (93 percent growth),visiting historic places (76 percent growth), sightseeing (71 percent growth), and biking ( 70 percent growth).The five slowest growing outdoor recreation activities as measured by the number of participants are projectedto be: rafting (26 percent growth), backpacking (26 percent growth), off-road vehicle driving (16 percentgrowth), primitive camping (10 percent growth), and hunting (minus 11 percent growth).
Regional
Growth in activity days should be fairly consistent across regions-faster than population growth inevery region for about 60 percent of the activities. The Pacific Coast will see the greatest number of activitiesfor which primary-purpose trips grow faster than the population, about 13 out of 22. The North will see thefewest, about seven out of 22. Participants should increase in all regions faster than the population growth forat least 60 percent of the activities. The Pacific Coast will have the most activities (75 percent), growing at arate faster than the population.
Activities
Days spent and numbers of participants in winter, water-based, and developed land activities will, ingeneral, grow faster than the population. Hunting and fishing, along with other dispersed land activities, are notexpected to increase in activity days or participation numbers as fast as the population is growing.Nonconsumptive wildlife activity is an exception to this trend; however, it is not limited to dispersed settings.With the exception of winter sports, there appears to be a general shift toward fewer primary-purpose trips percapita while at the same time more days and participants per capita.

350 Outdoor Recreation in American Life
Factors
Race and sex are important predictors of behavior for a number of outdoor activities. White males are, ingeneral, more likely to engage in winter, water-based, hunting, and dispersed land activities, females are morelikely to engage in horseback riding, picnicking, and nonconsumptive wildlife activity. Race is not an importantfactor in describing fishing, walking, picnicking, and nonconsumptive wildlife activity.
Population density has a strong negative effect on more rural activities like fishing, horseback riding,hunting, motorboating, off-road vehicle driving, and primitive camping. Income has a strong positive effect onactivities generally considered expensive to participate in, such as downhill skiing, snowmobiling, horsebackriding, motorboating, and sightseeing. Projected reductions in indexes of available supply have noticeablenegative effects on the growth of land-intensive activities like hunting, hiking, off-road vehicle driving, andprimitive camping.
REFERENCES
Cordell, H. K., Bergstrom, J. C., Hartmann, L. A., & English, D. B. K. (1990). An unalysis of the outdoorrecreution und wilderness situution in the United Stutes: 1989-2040. General Technical Report RM-189. FortCollins, CO: USDA Forest Service, Rocky Mountain Forest and Range Experiment Station.
Cordell, H. K., McDonald, B. L., Lewis, B., Miles, M., Martin, J., & Bason, J. (1996). United States ofAmerica. In G. Cushman, A. J. Veal, & J. Zuzanek (Eds.), World leisure purticipution: Free time in the glob&vil@e. Oxford, England: CAB International.
Day, J. C. (1996). Populution projections of the United Stutes by age, sex, ruce, und Hispunic origin:199.5 to 2050. U.S. Bureau of the Census, Current Population Reports, P251130. Washington, D.C.: U.S. Gov-ernment Printing Office.
Greene, W. H. (1993). Econometric unulysis (2nd ed.). Englewood Cliffs, NJ: Prentice Hall.Greene, W. H. (1995). LIMDEP version 7.0 user’s munuul. Bellport, NY: Econometric Software, Inc.Hof, J. G., & Kaiser, I-I. F. (1983). Long-term outdoor recreation participation projections for public land
management agencies. Journul of Leisure Reseurch, 15(l), l-14.Torgerson, D. (1996, May). [Macroeconomic projections]. Unpublished memo. USDA Economic Research
Service, Macroeconomics Team, Commercial Agriculture Division 1996.U.S. Fish & Wildlife Service. (1997). 1996 nutionul survey offishing, hunting, und wildl$e-ussociuted
recreution: Nucionul overview. Washington, D.C.: U.S. Government Printing Office.Walsh, R. G., Johnson, D. M., & McKean, J. R. (1992). Benefit transfer of outdoor recreation demand
studies, 1968-1988. Wuter Resources Research, 28(3), 707-713.Walsh, R. G., Jon, K. H., McKean, J. R., & Hof, J. (1992). Effect of price on forecasts of participation in fish
and wildlife recreation: An aggregate demand model. Journul of Leisure Reseurch, 21, 140-156.