projections and trade may 2018 - center for dairy excellence
TRANSCRIPT

May 2018 Projections and Export Opportunities
Projections of Prices, Farm Profitability and US Dairy Product Exports for 2018 to 2025 and Implications for Pennsylvania Farms and Processors
Chuck Nicholson, Cornell University1 Mark Stephenson, University of Wisconsin
Executive Summary
This component of the Study to Support Dairy Growth and Competiveness assesses likely future outcomes for milk prices, farm profitability and the potential for expansion of US dairy product exports. We use a simulation model of the global dairy supply chain to project these values from 2018 to 2025. Although these projections (and any projections of dairy industry outcomes over this time horizon) are rather uncertain, the results suggest general trends and possible opportunities that should be monitored going forward. These projections can provide a basic context for farm-level planning, processing capacity investments and programmatic efforts to achieve a greater degree of growth and competitiveness for the Pennsylvania dairy industry.
Our key findings are:
• Milk and dairy product prices are expected to have markedly higher average values during 2018 to 2025 than during 2015 to 2017;
• Milk and dairy product prices will vary throughout the period 2018 to 2025, with a cycle of about three years in length, consistent with the average of previous cycles;
• The pattern of milk prices projected for the next eight years is roughly consistent with the pattern observed during 2010 to 2017, except that it projects higher prices in 2022 to 2025 than those observed during 2016 and 2017;
• Higher average milk prices, combined with projected relatively stable feed costs and growth in average cows per farm will result in higher levels of average profitability as measured by Net Farm Operating Income (NFOI), and this is true for all four of the farm sizes analyzed;
• The value of US dairy product exports is predicted to grow during 2018 to 2025 compared to 2017, but with fluctuations related to the relative prices of US dairy products due the cyclical behavior noted above;
• Domestic butterfat values—which underlie much of the projected farm milk price strengthening—are projected to be higher than those in global dairy markets, consistent with observed patterns in 2014 to 2016. This provides incentives that could alter the mix of US dairy product exports from products with higher butterfat content (for example, butter and cheese) and towards protein products (including MPCs and casein products);
• Despite overall growth in the value of US dairy product exports, products for which PhilaPort has larger export market shares among Northeast ports (for example, ice cream) are not indicated to provide major growth opportunities.
1 Chuck Nicholson is former Clinical Associate Professor of Supply Chain Management at Penn State University, now Adjunct Associate Professor at Cornell University. Mark Stephenson is Director of Dairy Policy Analysis at the University of Wisconsin, Madison.

May 2018 Projections and Export Opportunities
Overview and Study Objectives
This component of the Study to Support Dairy Growth and Competiveness assesses likely future outcomes for milk prices, farm profitability and the potential for expansion of US dairy product exports. We use a simulation model of the global dairy supply chain to project these values from 2018 to 2025. Although these projections (and any projections of dairy industry outcomes over this time horizon) are rather uncertain, the results suggest general trends and possible opportunities that should be monitored going forward. These projections can provide a basic context for farm-level planning, processing capacity investments and programmatic efforts to achieve a greater degree of growth and competitiveness for the Pennsylvania dairy industry. The specific objectives for this component include: • Evaluate the likely patterns of US farm milk prices, dairy product prices and dairy farm profitability
from 2018 to 2025;
• Assess likely volume and value of US dairy product exports from 2018 to 2025 for a selected number of major dairy product categories;
• Discuss the implications of these projections for farm-level and processor decision making and programmatic efforts.
Historical Overview
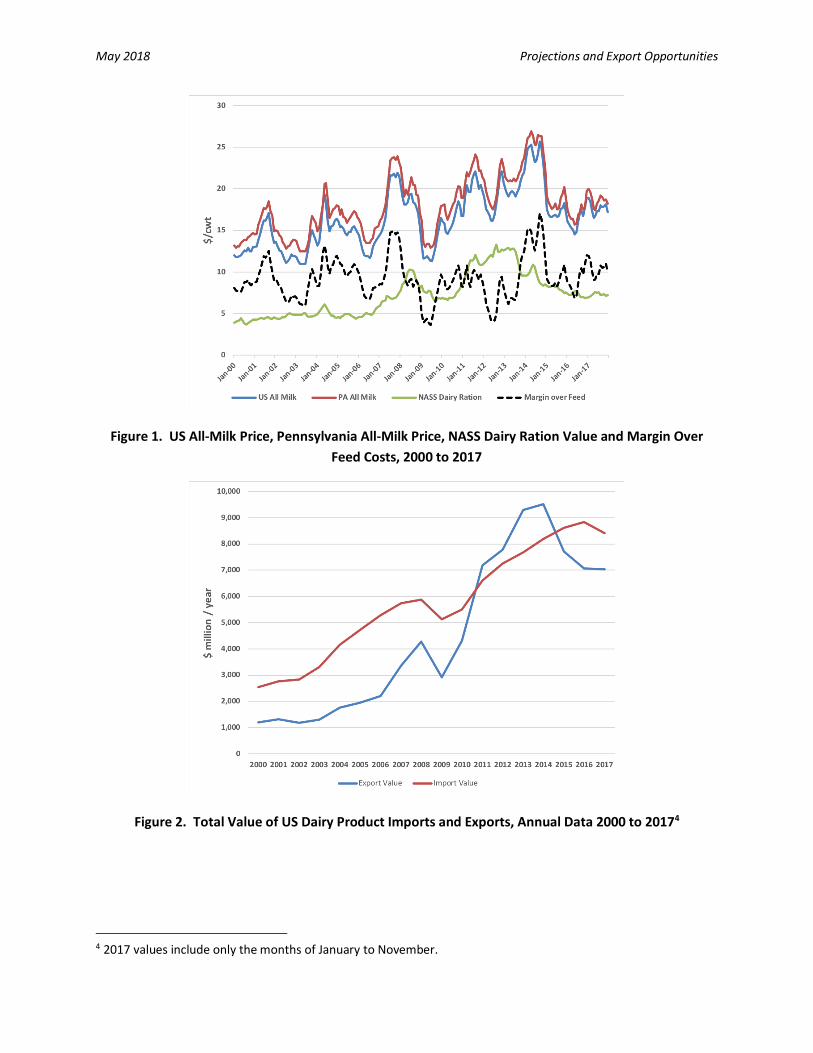
U.S. farm milk prices and margins have been cyclical for at least the past twenty years, with a typical cycle lasting a bit longer than three years2 (Figure 1). The length and amplitude (high-to-low spread) of each cycle will differ—and the current low farm-milk-price period indicates a longer than average cycle. However painful the past few years have been for US dairy farmers, it is important to keep in mind that low-price part of the cycle will come to an end—and key questions are when that will occur and what will the higher-price part of the cycle look like? Although the answers to these questions are always somewhat uncertain, projections of future price patterns can be helpful for planning purposes for both dairy producers and processors.
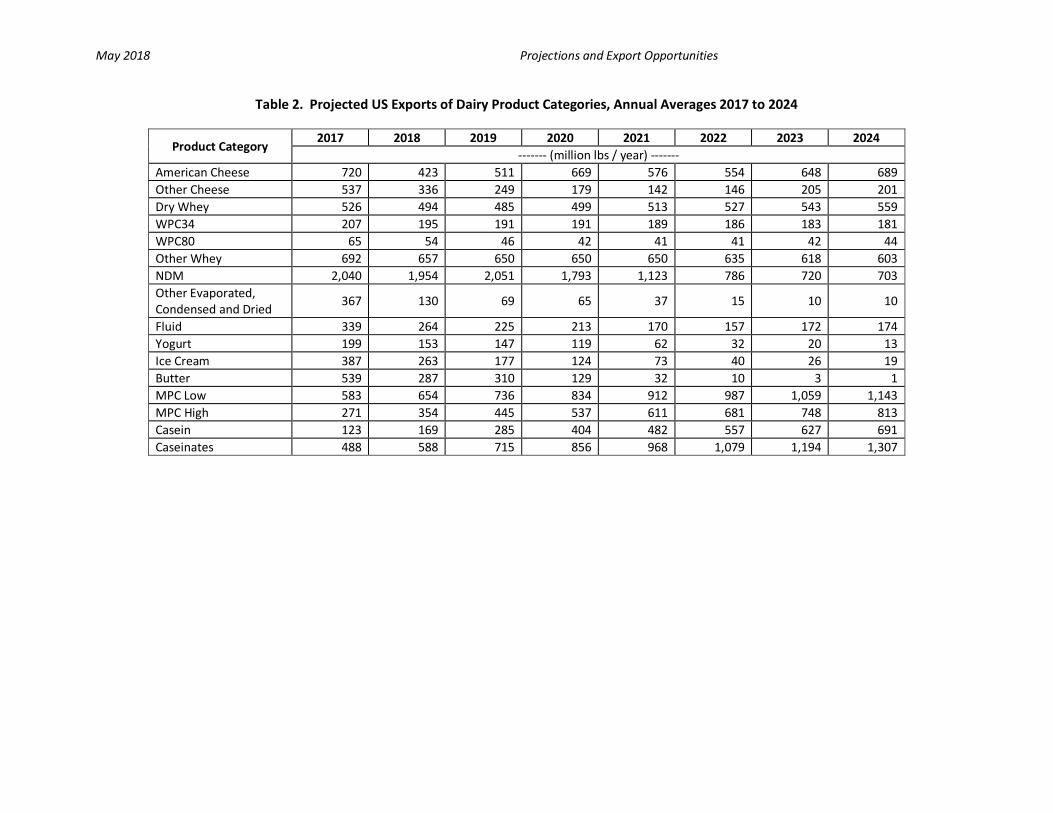
Although U.S. dairy product exports are not really a driver of price cycles3, dairy exports have been increasing markedly in value since 2000 (Figure 2). They reached a peak value of nearly $10 billion per year in 2014, before declining somewhat since then. This growth in export sales has supported the overall growth of the US dairy industry and has enhanced prices, at least in the short term. The growth of the US role in export markets presents both opportunities and challenges for the US, and it is thus important to consider the overall magnitude of future export sales and the mix of products that are most competitive in global dairy product markets.
2 The pattern of recent price cycles is explored further in Nicholson, C. F. and M. W. Stephenson. 2015. “Margins During the Dairy Price Cycle: Will This Time Be Different?” Program on Dairy Markets and Policy, June. [Information Letter 15-03] http://dairymarkets.org/PubPod/Pubs/IL15-03.pdf 3 Nicholson and Stephenson’s 2015 article “Price Cycles in the U.S. Dairy Supply Chain and Their Management Implications” in Agribusiness indicates that trade quantities were not statistically associated with cyclical US farm milk price behavior.
May 2018 Projections and Export Opportunities
Figure 1. US All-Milk Price, Pennsylvania All-Milk Price, NASS Dairy Ration Value and Margin Over Feed Costs, 2000 to 2017
Figure 2. Total Value of US Dairy Product Imports and Exports, Annual Data 2000 to 20174
4 2017 values include only the months of January to November.

May 2018 Projections and Export Opportunities
Methods for Projections and Caveats
Our assessment of future prices, profitability and trade uses a detailed empirical system dynamics model of the global dairy supply chain adapted from the commodity supply chain model described in Sterman (2000), which builds on an initial formulation by Meadows (1970). This model has been developed and adapted to the U.S. dairy industry during the past 15 years, extended to global coverage beginning in 2015. More detailed description of the model is provided in the Appendix, but the model covers 15 regions (covering all countries) and incorporates 23 total products (20 “final” products that have explicit demand curves and 13 “intermediate” products that are used in the manufacture of other dairy products). The base year for the model is 2013, meaning that 2013 data on milk production and dairy product consumption and trade are used to initialize the model. The model simulates monthly outcomes from 2013 to the end of 2025. The model comprises modules that represent farm milk supply, farm milk pricing, dairy product processing, inventory management and trade, and dairy policies including the margin insurance implemented in the US in 2014 and the phase-out of European Union quotas through 2015. Model development was supported in part by the U.S. International Trade Commission (USITC). Model refinement and calibration is still underway, but the model is sufficiently developed and tested to provide projections of basic trends in prices, profitability and trade.
As with all models and projections (particularly for more than five years into the future and for a complex global dairy industry), the precise values are less important than the indicated general trends. Our analysis also assumes continuation of existing domestic US support policies (e.g., MPP-Dairy) and trade policies (e.g., those under NAFTA) that may be changed in the reasonably near future. We also do not include analysis of supply or demand “shocks” (such as the combined effects of high milk prices in 2014 followed by a global fall-off in dairy product demand). Such changes and shocks could be substantive enough to modify the future patterns predicted here, as could other events such as drought in major production regions.
Price and Profitability Projections
The projections of the global dairy supply chain model suggest that recovery from the current low-price (low-margin) part of the cycle will be slow through 2018 but begin to strengthen more substantively during 2019 (Figure 1 and Table 1). The model projects cyclical behavior of the US All-milk price through 2025—with a more muted three-year cycle—but with overall higher average prices than in recent years. In fact, the pattern of prices is reminiscent of prices during 2010-2017 (Figure 2), although without the drop-off in prices that has characterized the period after the 2014 price peak and demand shock. The higher US prices arise in part from growing global demand, but also from domestic demand—particularly for butterfat—which results in higher US butter prices.
With higher longer-term price projections and projected relatively stable feed prices, farm profitability as measured by Net Farm Operating Income5 (NFOI) is projected to improve substantially in the years 2018 through 2024 (Table 1). US Farms will also grow in average size over the eight-year period, which also contributes to larger NFOI values for all farm size categories. As for milk prices, NFOI values fluctuate during the period, largely due to the cycle in milk prices.
5 Net Farm Operating Income is defined as gross revenues from sales of milk and livestock plus any program payments less operating costs for feed, labor, replacements and other. Thus, it assumes cash-based accounting and does not include fixed or administrative costs. Positive NFOI values do not necessarily mean that farms are covering all costs or would be considered profitable based on other measures such as Return on Assets (ROA).

May 2018 Projections and Export Opportunities
Although caution is appropriate with any longer-term projection of prices and profitability, our results suggest marked and reasonably well sustained improvements overall in farm financial performance compared to the current market situation.
Figure 3. Projected All-Milk Price 2017-2025, and Historical Comparison Data from 2010 to 2017
10
12
14
16
18
20
22
24
26
28
30
Jan-17 Jan-18 Jan-19 Jan-20 Jan-21 Jan-22 Jan-23 Jan-24 Jan-25
$/cw
t
Projected All-Milk Historical Comparison 2010-2017

May 2018 Projections and Export Opportunities
Table 1. Projected Price and Profitability Outcomes for the US Regions Other than California6, Annual Averages 2017 to 2025
Financial Outcome 2017 2018 2019 2020 2021 2022 2023 2024 All-Milk Price, $/cwt 16.88 20.19 18.83 18.27 21.06 22.69 22.24 22.19 NFOI, $/farm/year
Smalla 58,265 34,080 33,657 65,819 103,335 103,927 113,896 183,067 Mediuma 168,769 67,951 67,956 177,491 298,301 302,034 332,123 523,668 Largea 690,542 385,579 382,156 617,356 822,136 799,842 830,222 1,127,413 Extra Largea 3,059,438 2,045,845 1,831,162 2,287,570 2,646,087 2,268,056 2,125,970 2,406,780
Product Prices, $/lb
Butter NDM 1.76 1.54 1.56 1.94 2.09 2.08 2.08 2.15 American Cheese 1.52 1.40 1.32 1.45 1.53 1.40 1.29 1.30 Dry Whey 1.77 1.71 1.66 1.86 2.00 1.96 1.91 1.96
0.59 0.56 0.53 0.53 0.54 0.54 0.55 0.55 Class Prices, $/cwt
Class I Class II 21.61 20.29 19.62 21.88 23.26 22.72 22.21 22.72 Class III 18.94 17.22 16.36 19.03 20.53 19.41 18.47 18.83 Class IV 18.09 17.26 16.60 18.69 20.17 19.79 19.33 19.89
a Small farms averaged 73 cows, medium farms averaged 248 cows, large farms averaged 597 cows and extra-large farms averaged 1992 cows during the
simulation period from 2013 to 2025, although there is growth in average number of cows per farm for all categories through 2025.
6 The global dairy supply chain model includes two regions for the US, California the “rest of the US”. This was done to represent California’s state milk marketing order provisions, which differ from those in the other Federal Milk Marketing Orders. The all-milk and NFOI values above are for the “rest of the US” region.

May 2018 Projections and Export Opportunities
Export Projections
The value of US exports is highly variable for individual products and for the overall value, so it is challenging to make accurate projections for the longer term. Thus, our results are more usefully considered as general tendencies over time rather than as values for each specific year. The volume of exports indicates potential sales volumes. The value is determined by both the US selling price and the volume, so values can change in a manner different than export volumes.
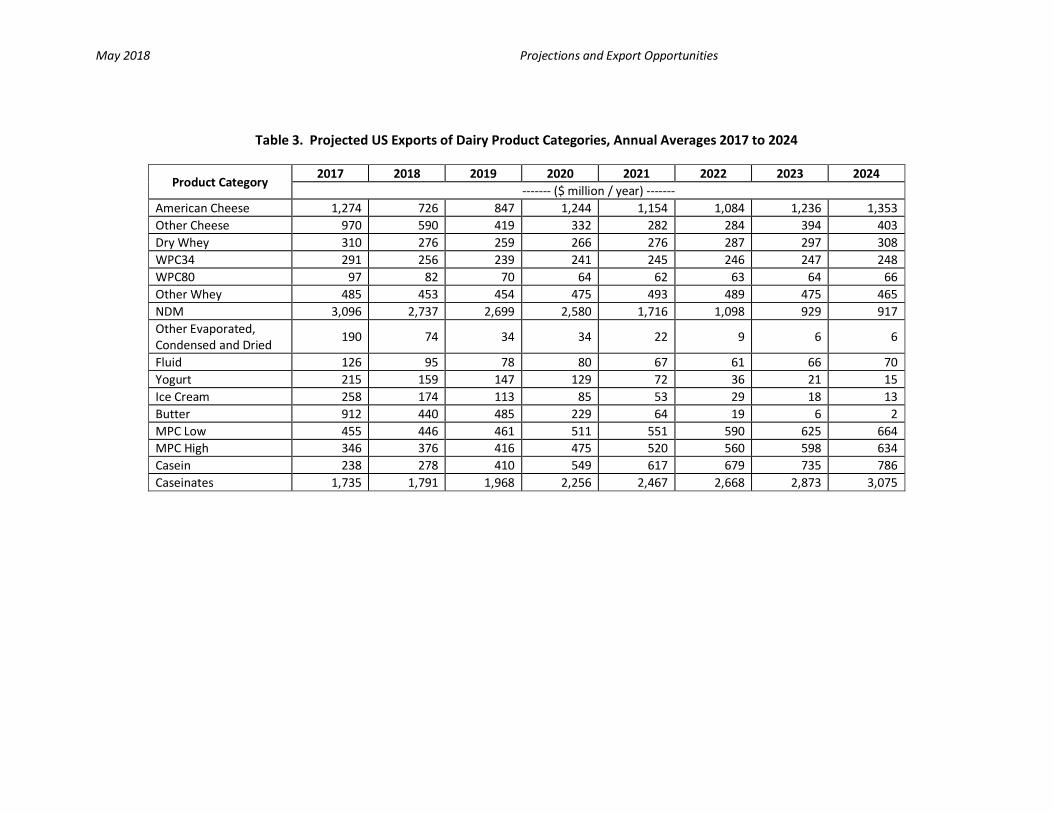
Our projections indicate generally stable export volumes for whey products (a key US export), growing volumes for fluid, and generally lower volumes of cheese, NDM and butter exports (Table 1). The lower export volumes in later years for cheese, NDM and butter are driven by the higher prices in the US relative to export market competitors, particularly due to higher butterfat values7. The higher prices for butterfat are a key driver of higher milk prices, which ultimately results in higher milk production. This additional milk provides nonfat solids that are more cost competitive than products with butterfat, which suggests increasing opportunities for exports of milk protein products (MPC, casein, caseinates) from the US. Although our projections show exports of some products as reaching very low levels, this is better thought of as indicating reduced incentives for exports of these products8.
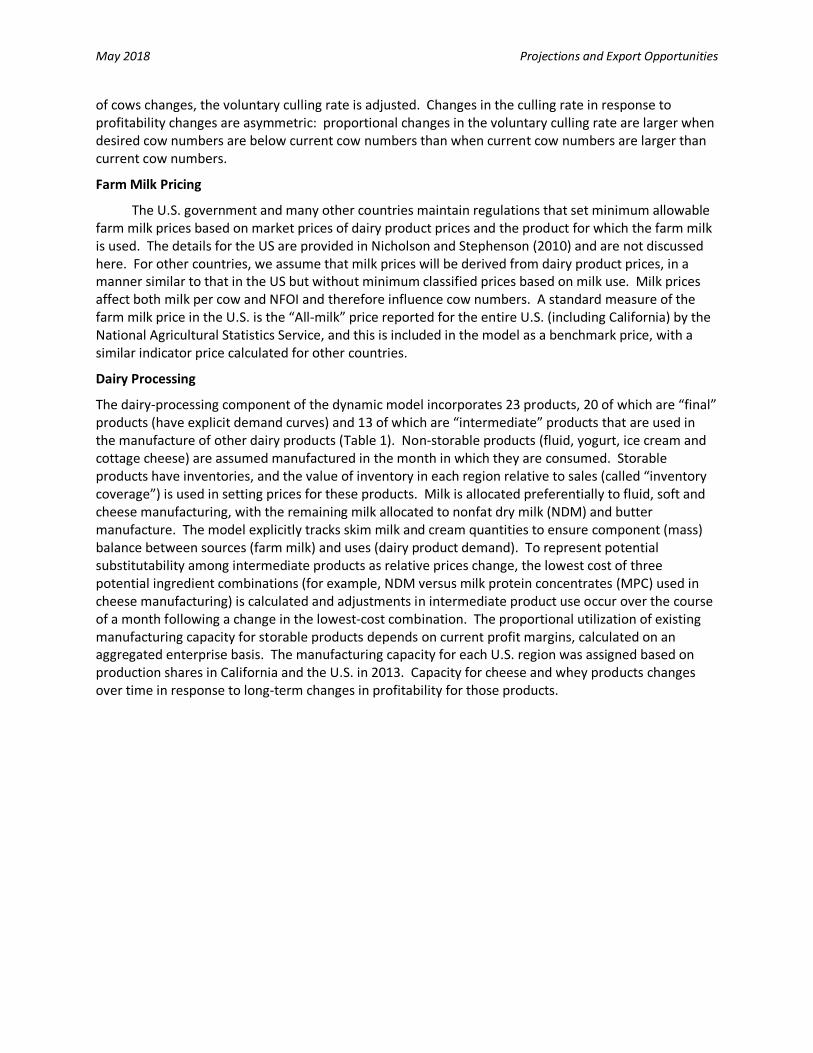
The overall value of US exports is projected to increase during 2017 to 2025, but consistent with the projected changes in export volumes described above, the share of value arising from different product categories will change over time. In 2017, our projected values indicate that NDM, cheese and butter provide more than 50% of total dairy export values. By 2025, the share of export value in protein products is projected to grow, consistent with the projected increase in export volumes. As might be expected, the overall value of exports fluctuates with US milk and product prices, with smaller export values in years with higher milk prices.
7 US trade policy maintains the strictest import controls on products with butterfat (butter, AMF, cream), which allows for large differences between US and world market prices for these products. This phenomenon was observed during 2014 to 2016, when US butter prices were sometimes more than double those in the European Union and Oceania. 8 Trade in branded dairy products (such as yogurt and ice cream) will be driven by factors other than relative prices as is assumed in our modeling framework. Thus, very low values are unlikely to occur, although our results likely indicate less attractive future opportunities for these products.
May 2018 Projections and Export Opportunities
Table 2. Projected US Exports of Dairy Product Categories, Annual Averages 2017 to 2024
Product Category 2017 2018 2019 2020 2021 2022 2023 2024
------- (million lbs / year) ------- American Cheese 720 423 511 669 576 554 648 689 Other Cheese 537 336 249 179 142 146 205 201 Dry Whey 526 494 485 499 513 527 543 559 WPC34 207 195 191 191 189 186 183 181 WPC80 65 54 46 42 41 41 42 44 Other Whey 692 657 650 650 650 635 618 603 NDM 2,040 1,954 2,051 1,793 1,123 786 720 703 Other Evaporated, Condensed and Dried
367 130 69 65 37 15 10 10
Fluid 339 264 225 213 170 157 172 174 Yogurt 199 153 147 119 62 32 20 13 Ice Cream 387 263 177 124 73 40 26 19 Butter 539 287 310 129 32 10 3 1 MPC Low 583 654 736 834 912 987 1,059 1,143 MPC High 271 354 445 537 611 681 748 813 Casein 123 169 285 404 482 557 627 691 Caseinates 488 588 715 856 968 1,079 1,194 1,307
May 2018 Projections and Export Opportunities
Table 3. Projected US Exports of Dairy Product Categories, Annual Averages 2017 to 2024
Product Category 2017 2018 2019 2020 2021 2022 2023 2024
------- ($ million / year) ------- American Cheese 1,274 726 847 1,244 1,154 1,084 1,236 1,353 Other Cheese 970 590 419 332 282 284 394 403 Dry Whey 310 276 259 266 276 287 297 308 WPC34 291 256 239 241 245 246 247 248 WPC80 97 82 70 64 62 63 64 66 Other Whey 485 453 454 475 493 489 475 465 NDM 3,096 2,737 2,699 2,580 1,716 1,098 929 917 Other Evaporated, Condensed and Dried
190 74 34 34 22 9 6 6
Fluid 126 95 78 80 67 61 66 70 Yogurt 215 159 147 129 72 36 21 15 Ice Cream 258 174 113 85 53 29 18 13 Butter 912 440 485 229 64 19 6 2 MPC Low 455 446 461 511 551 590 625 664 MPC High 346 376 416 475 520 560 598 634 Casein 238 278 410 549 617 679 735 786 Caseinates 1,735 1,791 1,968 2,256 2,467 2,668 2,873 3,075

May 2018 Projections and Export Opportunities
Implications and Limitations
Our dynamic simulation modeling analysis suggests a number of positive developments for farm profitability, and enhanced dairy product exports (albeit with a change in the product mix) over the next eight years. Although our farm-level results do not apply specifically to Pennsylvania farms (being a composite of farms in the US outside of California), the projected improvements in farm milk prices and profitability would likely benefit farms in Pennsylvania also. The most important implications of this are the ability of farms to recover from the recent low-profitability years, recoup farm equity and reduce debt. If the projected improvements in profitability occur, these would provide welcome breathing space and financial resources for business planning decisions to improve future productivity and profitability. Thus, this higher-margin period would provide a strategic opportunity to individual farm businesses to define their plans for the years after 2025. It would likely also facilitate the ability to discuss and implement modifications to the support provided to Pennsylvania’s dairy industry, as producers would have less need to focus on addressing the challenges that come with low profitability.
Our export market projections suggest a growing but fluctuating opportunity for US dairy product exports, with greater opportunities for protein products than exist currently. A crucial condition for these projections to represent future realities is the increased value of butterfat in US markets and the existing US import restrictions for butterfat. As these are both rather uncertain, it is difficult to reach conclusions about appropriate next steps based on these projections. Although our projections do not suggest strong growth in products that have been exported through PhilaPort (such as ice cream, see the complementary project report on PhilaPort export volumes) the overall growth in export markets should provide opportunities to Pennsylvania dairy product manufacturers and, thus, Pennsylvania dairy farms. It is worth noting, however, that is not so much growth in exports per se that underlies the higher milk prices and profitability—that appears to be driven primarily by policies restricting US butterfat imports.
As has been noted above, making highly accurate projections of milk prices and export volumes over the period of nearly a decade is challenging, for a variety of reasons. The patterns we indicate will undoubtedly be affected by climate events (drought) and perhaps by alterations in trade policy that are difficult to predict. The predictions still have use as general indicators of likely future outcomes, but planning decisions should be made on the basis additional monitoring of developments and with limited emphasis on the values of prices or export volumes in specific years. Our work to further refine the dynamic global dairy supply chain model is ongoing, and future work may see somewhat altered conclusions from those reported here.

May 2018 Projections and Export Opportunities
APPENDIX: Global Dairy Trade Model Description
Our assessment of the future prices, profitability and trade uses a detailed empirical system dynamics model of the global dairy supply chain adapted from the commodity supply chain model described in Sterman (2000), which builds on an initial formulation by Meadows (1970). This model has been developed and adapted to the U.S. dairy industry during the past 10 years, and the feedback structure relevant for this analysis was discussed below (Figure 1). More detailed description of the model is provided in the below, but the basic structure for key model components is described below. The base year for the model is 2013, meaning that 2013 data on milk production and dairy product consumption and trade are used to initialize the model. The model simulates monthly outcomes from 2013 to the end of 20259. The model comprises modules that represent farm milk supply, farm milk pricing, dairy product processing, inventory management and trade, and dairy policies including the margin insurance implemented in 2014). Each of these is discussed in detail below.
Model Regions
The Dynamic Global Dairy Supply Chain Model includes representations for 15 regions, two for the US (California and Rest of US), and 13 non-US regions including the ASEAN countries (10 countries), Oceania (Australia and New Zealand), the EU (28 countries), Russia, China, Mexico, India, Canada, former Soviet Union countries (11 countries), Middle East and North Africa (MENA; 19 countries), major South American milk producers (Brazil, Argentina, Uruguay), Other Net Importing Countries (described below) and Other Net Exporting Countries (described below).
Farm Milk Supply
The milk supply components of the model are based on up to four farm-type categories based per region. In the US, farm-types are based on numbers of cows owned for both the rest of U.S. and California. (California is modeled separately because it is the largest milk producing state and maintains a state-level system of milk price regulation different from the rest of the U.S.) For each farm-type category, the total number of farms is modeled10, as is the average financial situation (both elements of the income statement and the balance sheet) for each farm category. The cost structure of farms in the different herd size categories is different, as is the responsiveness to profitability signals. Based on genetic improvement rates over the past 20 years, milk per cow11 is assumed to grow at a potential rate of 2% per year, but is adjusted in the short run based on the margin between farm milk prices and feed prices. This is similar to the approach in Bozic et al., (2012), who used a linear trend in yield, but the yield increment varied with margins.
The number of cows for each farm size category is treated as a productive asset, and the evolution of cow numbers depends on heifers entering the herd (which depends on previous breeding decisions) and culling decisions (which can be voluntary or involuntary). Involuntary culling rates depend on the desired number of cows for each farm size category, which is modeled using an “anchoring and adjustment” approach based on Sterman (2000). This anchoring and adjustment mechanism assumes that desired cow numbers for each farm size category respond to expectations of future Net Farm Operating Income (NFOI) relative to a benchmark NFOI, both of which are updated over time. NFOI equals total revenues less variable costs for feed, labor, and other expenses. When the desired number
9 Because the model simulations begin with 2013, this is why 2017 values are called “projections” rather than “actual values” in the tables and discussion above. 10 For some regions, the number of farms is assumed to be one, effectively aggregating the country’s milk production response. 11 The model also represents buffalo milk production for India and Pakistan in addition to milk from cattle.
May 2018 Projections and Export Opportunities
of cows changes, the voluntary culling rate is adjusted. Changes in the culling rate in response to profitability changes are asymmetric: proportional changes in the voluntary culling rate are larger when desired cow numbers are below current cow numbers than when current cow numbers are larger than current cow numbers.
Farm Milk Pricing
The U.S. government and many other countries maintain regulations that set minimum allowable farm milk prices based on market prices of dairy product prices and the product for which the farm milk is used. The details for the US are provided in Nicholson and Stephenson (2010) and are not discussed here. For other countries, we assume that milk prices will be derived from dairy product prices, in a manner similar to that in the US but without minimum classified prices based on milk use. Milk prices affect both milk per cow and NFOI and therefore influence cow numbers. A standard measure of the farm milk price in the U.S. is the “All-milk” price reported for the entire U.S. (including California) by the National Agricultural Statistics Service, and this is included in the model as a benchmark price, with a similar indicator price calculated for other countries.
Dairy Processing
The dairy-processing component of the dynamic model incorporates 23 products, 20 of which are “final” products (have explicit demand curves) and 13 of which are “intermediate” products that are used in the manufacture of other dairy products (Table 1). Non-storable products (fluid, yogurt, ice cream and cottage cheese) are assumed manufactured in the month in which they are consumed. Storable products have inventories, and the value of inventory in each region relative to sales (called “inventory coverage”) is used in setting prices for these products. Milk is allocated preferentially to fluid, soft and cheese manufacturing, with the remaining milk allocated to nonfat dry milk (NDM) and butter manufacture. The model explicitly tracks skim milk and cream quantities to ensure component (mass) balance between sources (farm milk) and uses (dairy product demand). To represent potential substitutability among intermediate products as relative prices change, the lowest cost of three potential ingredient combinations (for example, NDM versus milk protein concentrates (MPC) used in cheese manufacturing) is calculated and adjustments in intermediate product use occur over the course of a month following a change in the lowest-cost combination. The proportional utilization of existing manufacturing capacity for storable products depends on current profit margins, calculated on an aggregated enterprise basis. The manufacturing capacity for each U.S. region was assigned based on production shares in California and the U.S. in 2013. Capacity for cheese and whey products changes over time in response to long-term changes in profitability for those products.

May 2018 Projections and Export Opportunities
Table 1. Dairy Product Categories Included in the Dynamic Global Dairy Supply Chain Model
Product Category Final Product Inter-
mediate Product
Tradable Product
Fluid Milk X X Yogurt X X Frozen Desserts X X Cottage Cheese X American-type Cheeses X X Other Cheeses X X Fluid Whey X Separated Whey X Whey Cream X Dry Whey X X X Whey Protein Concentrate 34% Protein X X X Whey Protein Concentrate 80% Protein X X X Lactose X X X Butter X X Anhydrous Milk Fat (AMF) X X Nonfat Dry Milk X X X Infant Formula X X Condensed Skim Milk X X Other Evaporated, Condensed & Dry products X X Casein X X X Caseinates X X X MPC, < 50% protein X X X MPC, >= 50% protein X X X
Dairy Product Demand
Dairy product demand for final products is represented separately for each region. U.S. fluid milk consumption is based on fluid utilization from California and sales from the Federal regulatory bodies that determine minimum regulated farm milk prices using data for 2013. Consumption of other products was calculated as national U.S. commercial disappearance (production + imports – exports – dairy industry use) and allocated on the basis of regional population. The impacts of product prices on demand are modeled using constant elasticity demand functions, which also are assumed to shift over time in response to population and income growth. Intermediate product demand is determined by the use of dairy components in the production of other dairy products, based on relative costs. Cross-price effects for intermediate products are included for NDM, MPC products, casein products and whey products but not for others. The quantity demanded adjusts over time in response to price changes, rather than instantaneously, to account for delays required for buyers to form price expectations, find substitutes, redesign products or for the expiration or renegotiation of contractual obligations with suppliers. Retail prices for fluid milk products, yogurt, cottage cheese and ice cream are modeled using

May 2018 Projections and Export Opportunities
constant proportional mark-ups over milk ingredient costs. Wholesale prices for storable products, as noted earlier, depend on inventory coverage.
Dairy Product Trade
The model includes a detailed international trade component, consistent with its purpose. Imports and exports are represented for 18 tradable dairy product categories (Table 1). Imports for each region are calculated separately for each origin (exporting region) and based on whether imports were subject to Tariff Rate Quota (TRQ) or “over-quota” restrictions. The TRQ specify a total annual amount of allowable imports at a relatively low tariff rate. We have ignored the country- and region-specific import restrictions (e.g., import licenses or TRQ allocations) associated with some products imported into the US. “Over-quota” imports are not limited in quantity but generally face higher tariff rates. Both ad valorem (percentage based on value) and specific (per unit) tariffs are represented for both categories of imports. The model uses 2013 trade data as base, and imports and exports in future years are determined based on the growth in demand in the ROW, relative prices in the importing and exporting regions, transportation costs and import restrictions. Total exports for each region and product are calculated as the sum of the product imported by all other regions from the origin region.
Dairy Policies
The post-2014 suite of U.S. dairy policies is represented in the model, including the MPP-Dairy margin insurance program. We also include U.S. policies unchanged by the Agricultural Act of 2014, such as minimum farm milk price regulation under federal and California milk marketing orders, including relevant timing of pricing decisions. For regions other than the U.S., dairy policy (other than trade policy) is represented by intervention purchase programs in the EU, and supply management programs in the EU and Canada (for which more details are provided below); other policies and programs related to dairy in other countries are ignored. We include the policy structure of the model to account for the major impacts of MPP-Dairy in the U.S.
Data Sources
The data used to develop the structure and parameter values for the model are from diverse sources, including NASS publications, U.S. Census Bureau (for trade statistics) previous modeling studies (e.g., Bishop, 2004; Pagel, 2005), other industry documents, and in some cases, judgment of dairy industry decision makers and analysts. This use of a broad range of sources is common for dynamic simulation models, and is consistent with the three types of data needed according to Forrester (1980): numerical, written and mental (professional knowledge) data.

May 2018 Projections and Export Opportunities
APPENDIX References
Bishop, P. M. (2004, August). “Dairy market impacts of U.S. milk protein imports and trade policy alternatives.” Unpublished Ph.D. dissertation, Department of Agricultural, Resource and Managerial Economics, Cornell University.
Bozic, M., C. Kanter, and Brian W. Gould. (2012). “Tracing the Evolution of the Aggregate U.S. Milk Supply Elasticity Using a Herd Dynamics Model.” Agricultural Economics, 43:515-530.
Forrester, J. W. (1980). “Information Sources for Modeling the National Economy.” Journal of the American Statistical Association, 75:555-574.
Meadows, D. (1970). Dynamics of Commodity Production Cycles. Wright-Allen Press.
Nicholson, C. F. and M. W. Stephenson. 2010. Analysis of Proposed Programs to Mitigate Price Volatility in the U.S. Dairy Industry. Project report for consortium of dairy industry organizations administered by the Milk Producers Council. September. (http://dairy.wisc.com)
Pagel, E. J. (2005). “Dynamic Patterns of Change in Structure Under Different Support Policy Regimes: An Examination of the U.S. Dairy Industry.” Unpublished MS Thesis, Department of Agricultural, Resource and Managerial Economics, Cornell University.
Sterman, J. D. 2000. Business Dynamics: Thinking and Modeling for a Complex World. Boston: Irwin/McGraw Hill.