projecting literacy skills using microsimulation models ... · • male/female lfp • literacy...
TRANSCRIPT
Projecting literacy skills using microsimulation models: tools to better inform social and immigration policies
4th International PIAAC ConferenceParallel sessions – Workshop 2 November 23 2017, Singapore
Samuel Vézina Institut national de la recherche scientifique (INRS)Alain Bélanger Institut national de la recherche scientifique (INRS) &
International Institute for Applied Systems Analysis (IIASA)
A new demographic regime
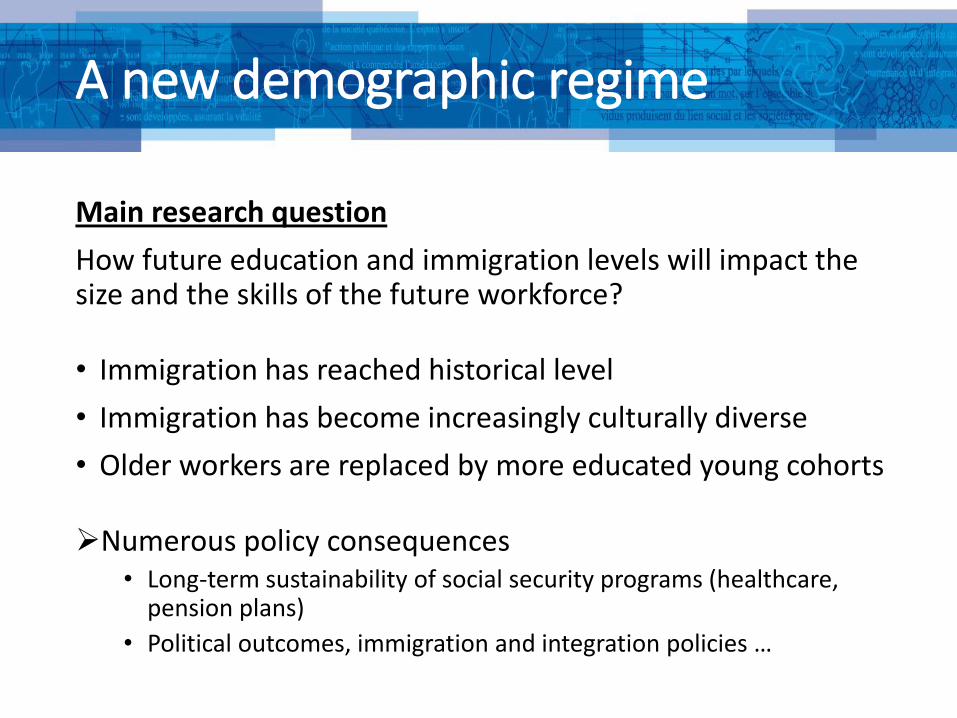
Main research question
How future education and immigration levels will impact the size and the skills of the future workforce?
• Immigration has reached historical level
• Immigration has become increasingly culturally diverse
• Older workers are replaced by more educated young cohorts
Numerous policy consequences• Long-term sustainability of social security programs (healthcare,
pension plans)
• Political outcomes, immigration and integration policies …
A new demographic regime
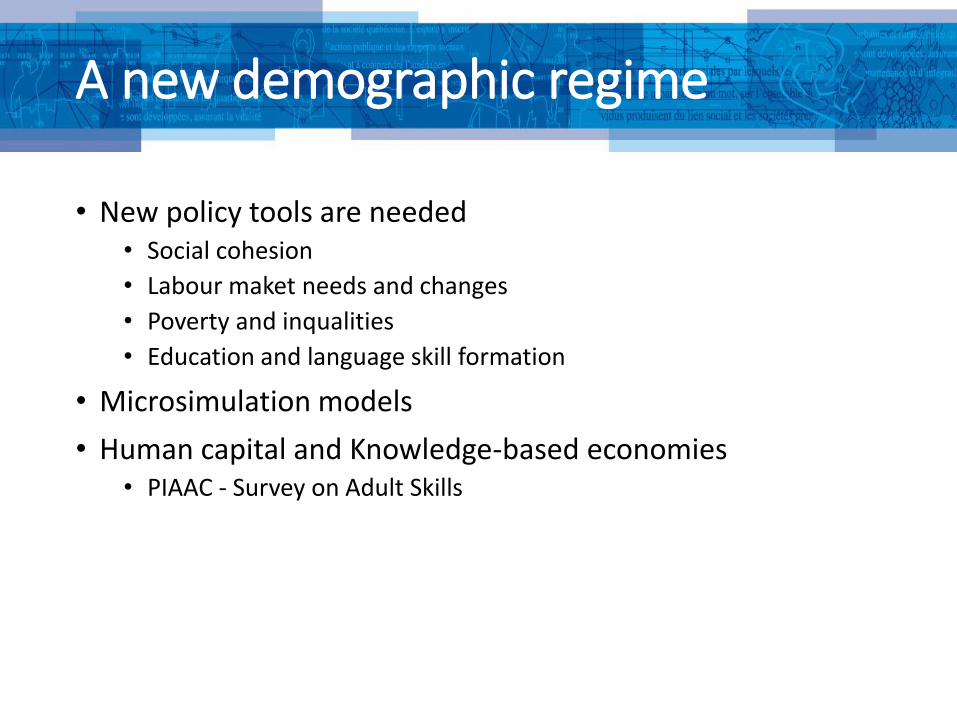
• New policy tools are needed• Social cohesion
• Labour maket needs and changes
• Poverty and inqualities
• Education and language skill formation
• Microsimulation models
• Human capital and Knowledge-based economies• PIAAC - Survey on Adult Skills

Microsimulation
• What is it?• Departure from deterministic macro models• The individual, not the aggregate, is the unit being
simulated• A population is therefore simulated one unit at a time• State transitions are determined stochastically
• Why the buzz?• A very significant technical improvement over multistate
methodology• Extremely flexible in its implementation• Though, dependent on available data
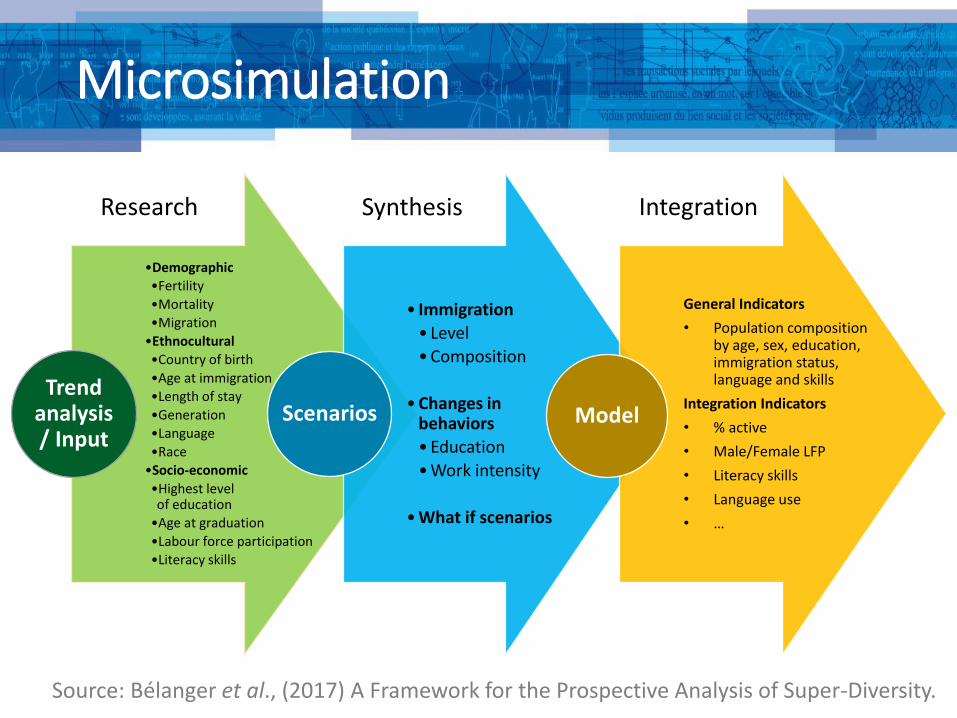
•Demographic
•Fertility
•Mortality
•Migration
•Ethnocultural
•Country of birth
•Age at immigration•Length of stay
•Generation
•Language
•Race•Socio-economic
•Highest level of education
•Age at graduation
•Labour force participation
•Literacy skills
Trend analysis/ Input
• Immigration
• Level
• Composition
• Changes in behaviors
• Education
• Work intensity
• What if scenarios
Scenarios
General Indicators
• Population composition by age, sex, education, immigration status, language and skills
Integration Indicators
• % active
• Male/Female LFP
• Literacy skills
• Language use
• …
Model
Research Synthesis Integration
Microsimulation
Source: Bélanger et al., (2017) A Framework for the Prospective Analysis of Super-Diversity.
Focus
• Two developed countries: Austria and Canada• Different immigration contexts
• Different education contexts
• Workforce: 25 to 64 years old
• Microsimulation models• PÖB (Austria)
• LSD-C (Canada)
• Projections 2011 – 2061
• Open to migration

Descriptive statistics
Austria Canada
Proportion of university graduatesNative-born 19 % 22 %
Foreign-born 24 % 35 %
Total population aged 25 to 64 years old, 2012
Proportion economically active Native-born 80 % 82 %
Foreign-born 74 % 78 %
Population (N)
Native-born 3,749,100 14,205,500
Foreign-born 914,900 4,658,600
Proficiency in literacy skills (Mean score)
Native-born 275 276
Foreign-born 245 249

Projection Scenario Assumptions
Scenario Immigration
volume
Immigration
composition
Education Activity
rates
REFERENCE Official
immigration
volume projected
by National
Statistical
agencies
Austria:
Characteristics of
immigrants arrived
in 2011-2016
Canada:
Characteristics of
immigrants arrived
between 2006-2010
Recent trends
reflecting the
observed rise of
educational
attainment of
cohorts
Recent
trends
Immigration rateCanada: 0.75% (Among the world’s highest rate)Austria: Refugee Crisis, back to 0.25% by 2026.

Projection Scenario Assumptions
Scenario Immigration
volume
Immigration
composition
Education Activity
rates
COMPARABLE Immigration rate
set at 0.35%
Characteristics of
immigrants arrived
between 2006-2010
Educational
attainment set at
observed rate in
2011
Recent
trends
ZERO No immigration Characteristics of
immigrants arrived
between 2006-2010
Educational
attainment set at
observed rate in
2011
Recent
trends
Immigration rate0.35% is equal to the US level.

Projection Scenario Assumptions
Scenario Immigration
volume
Immigration
composition
Education Activity
rates
EDUCATION Immigration rate
set at 0.35%
Characteristics of
immigrants arrived
between 2006-
2010
Recent trends
reflecting the
observed rise of
educational
attainment of
cohorts
Recent
trends
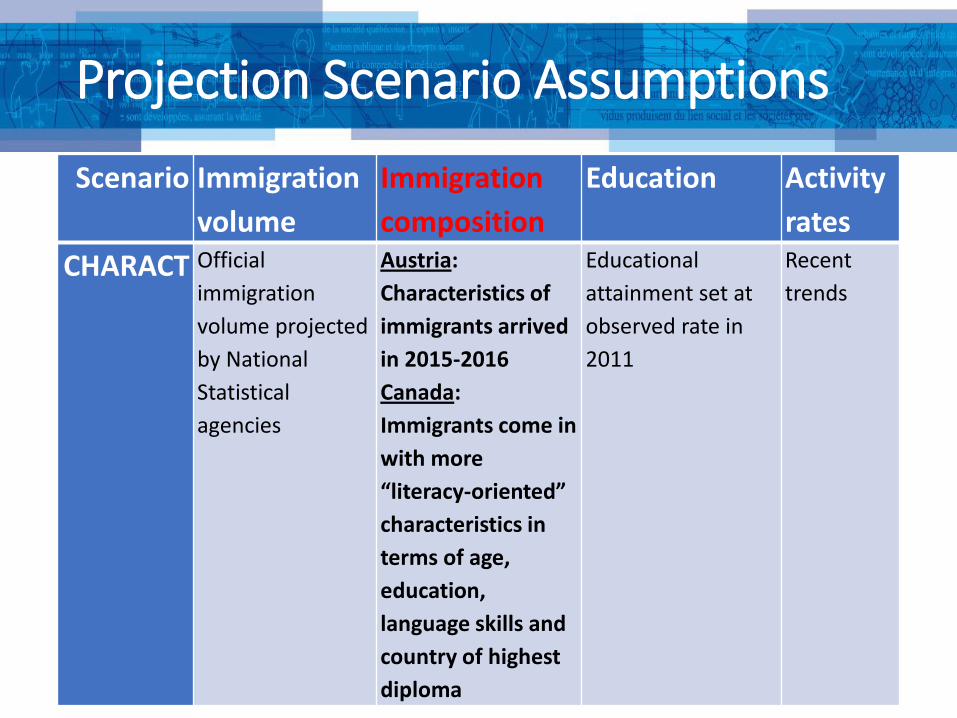
Projection Scenario Assumptions
Scenario Immigration
volume
Immigration
composition
Education Activity
rates
CHARACT Official
immigration
volume projected
by National
Statistical
agencies
Austria:
Characteristics of
immigrants arrived
in 2015-2016
Canada:
Immigrants come in
with more
“literacy-oriented”
characteristics in
terms of age,
education,
language skills and
country of highest
diploma
Educational
attainment set at
observed rate in
2011
Recent
trends
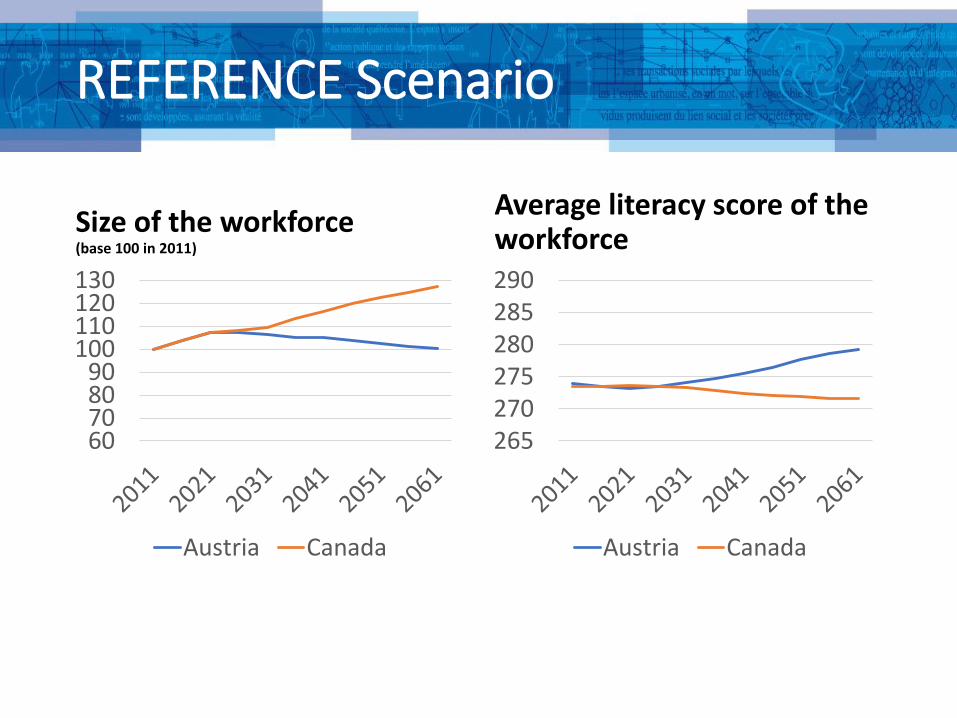
REFERENCE Scenario
Size of the workforce (base 100 in 2011)
60708090
100110120130
Austria Canada
265270275280285290
Austria Canada
Average literacy score of the workforce
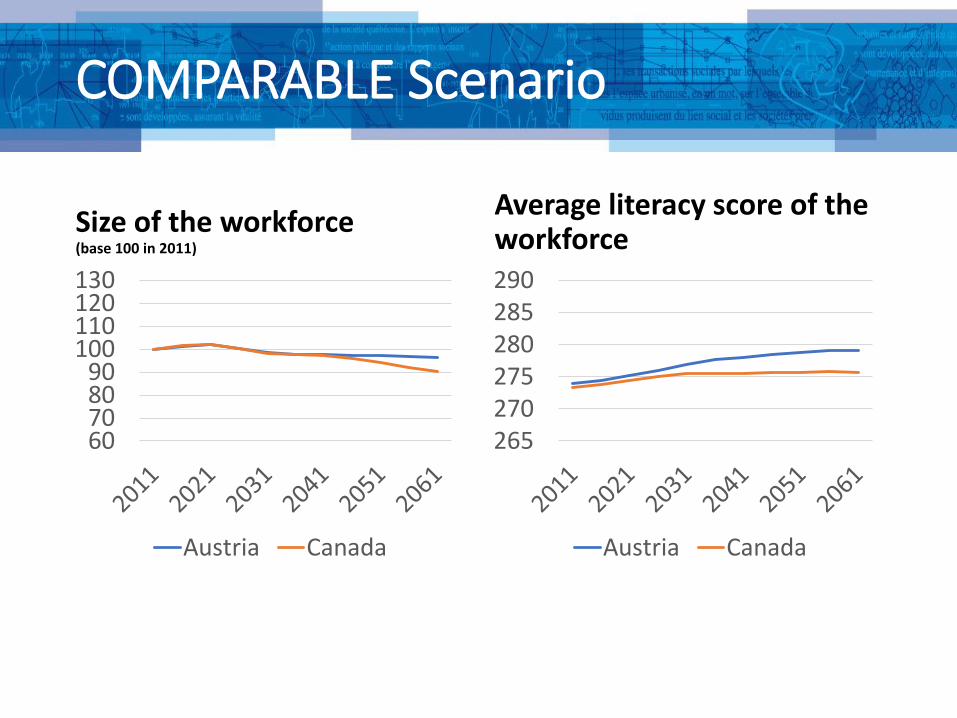
COMPARABLE Scenario
60708090
100110120130
Austria Canada
265270275280285290
Austria Canada
Size of the workforce (base 100 in 2011)
Average literacy score of the workforce

ZERO Scenario
60708090
100110120130
Austria Canada
265270275280285290
Austria Canada
Size of the workforce (base 100 in 2011)
Average literacy score of the workforce

EDUCATION Scenario
60708090
100110120130
Austria Canada
265270275280285290
Austria Canada
Size of the workforce (base 100 in 2011)
Average literacy score of the workforce
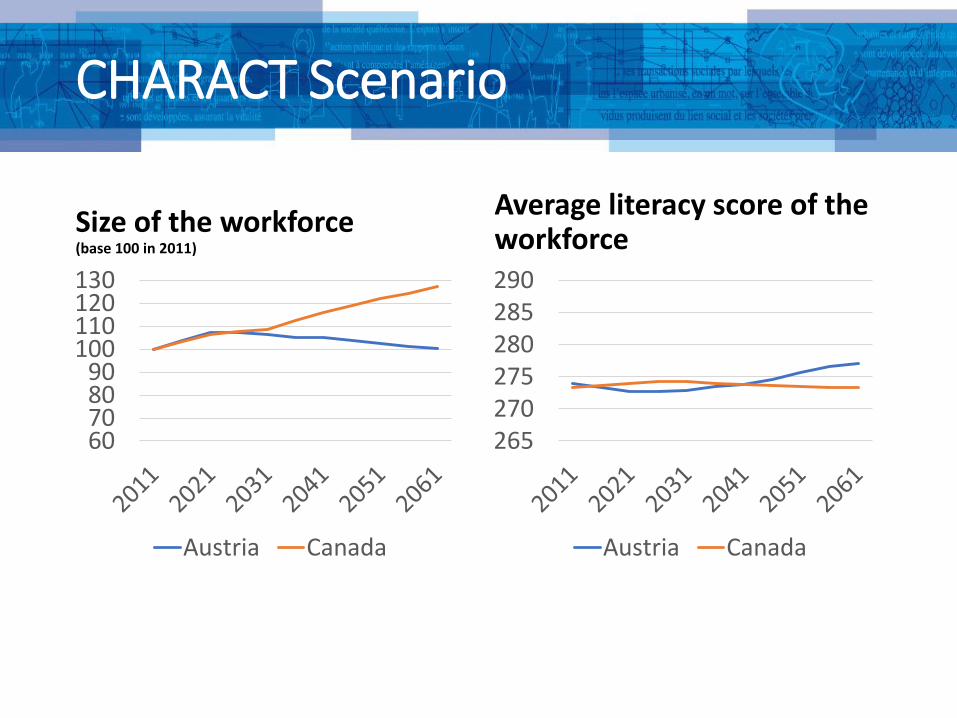
CHARACT Scenario
60708090
100110120130
Austria Canada
265270275280285290
Austria Canada
Size of the workforce (base 100 in 2011)
Average literacy score of the workforce

In a nutshell
• The demographic dynamic, the natural growth rate of the workforce is similar in both Austria and Canada
• Future positive growth of the workforce relies heavily on immigration intakes
• Immigration also impacts on average skills
• Education have no significant impact on the size of the future workforce
• Education impacts on average skills
• Divergent strategies in terms of future development of the workforce

Implications - Austria
By immigration status and country of birth By literacy level
█ Medium or high literacy level (Level 3 or over)
█ Low literacy level (Level 2 or below)
█ Foreign-born (less developed countries)
█ Foreign-born (most developed countries)
█ Native-born
Workforce aged 25 to 64 years old, 2011-2061, REFERENCE Scenario
80% 73% 69% 70% 75% 78%
7% 8% 8% 7% 4% 4%
13% 19% 23% 23% 21% 18%
0
1
2
3
4
2011 2021 2031 2041 2051 2061
Mill
ion
s
50% 49% 48% 46% 42% 39%
50%51% 52% 54% 48% 61%
0
1
2
3
4
2011 2021 2031 2041 2051 2061
Mill
ion
s
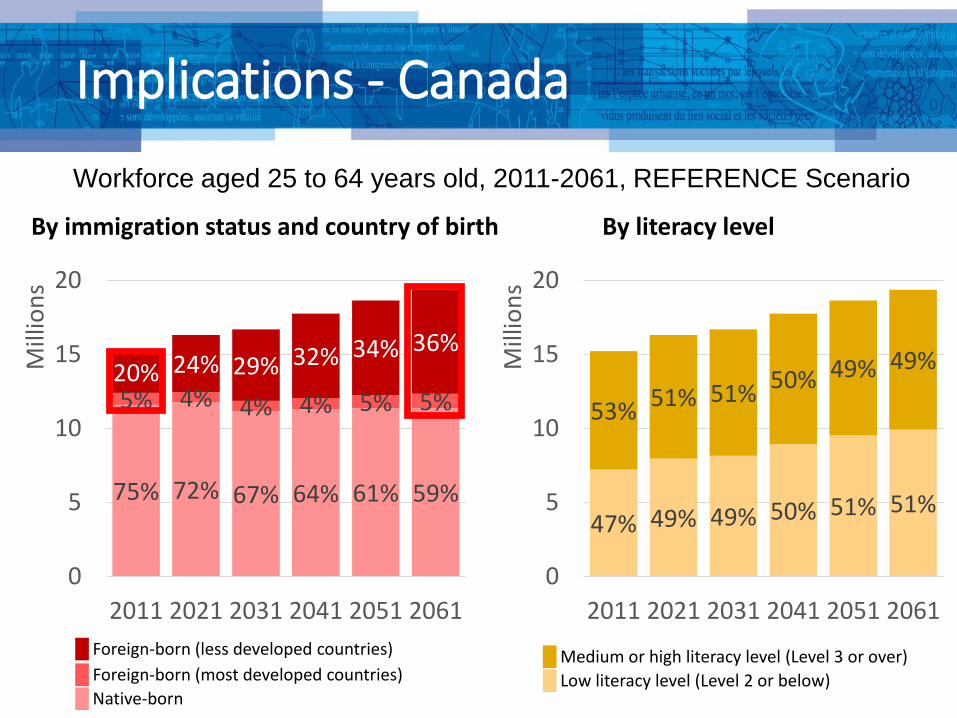
Implications - Canada
By immigration status and country of birth
75% 72% 67% 64% 61% 59%
5% 4% 4% 4% 5% 5%20% 24% 29% 32% 34% 36%
0
5
10
15
20
2011 2021 2031 2041 2051 2061
Mill
ion
s
By literacy level
47% 49% 49% 50% 51% 51%
53%51% 51%
50% 49% 49%
0
5
10
15
20
2011 2021 2031 2041 2051 2061
Mill
ion
s
█ Medium or high literacy level (Level 3 or over)
█ Low literacy level (Level 2 or below)
█ Foreign-born (less developed countries)
█ Foreign-born (most developed countries)
█ Native-born
Workforce aged 25 to 64 years old, 2011-2061, REFERENCE Scenario

Implications for policy
How to close the skill gap between foreign-born and native-born ?
1. Integration policies• Lifelong training
• Language skills
2. Immigration policies• Selection based on skills
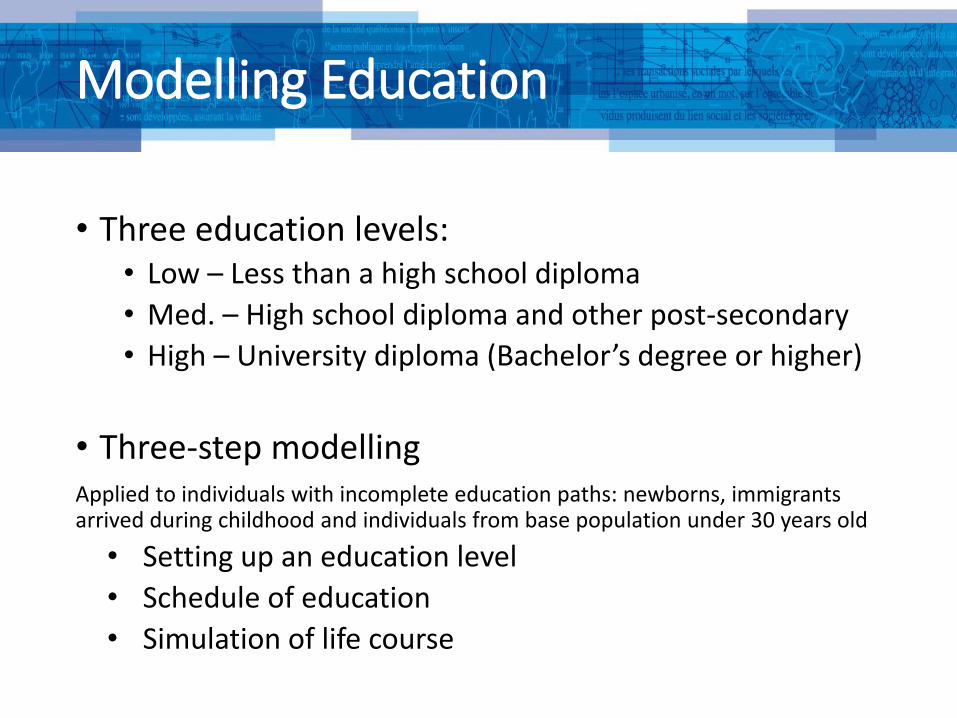
Modelling Education
• Three education levels:• Low – Less than a high school diploma
• Med. – High school diploma and other post-secondary
• High – University diploma (Bachelor’s degree or higher)
• Three-step modellingApplied to individuals with incomplete education paths: newborns, immigrants arrived during childhood and individuals from base population under 30 years old
• Setting up an education level
• Schedule of education
• Simulation of life course
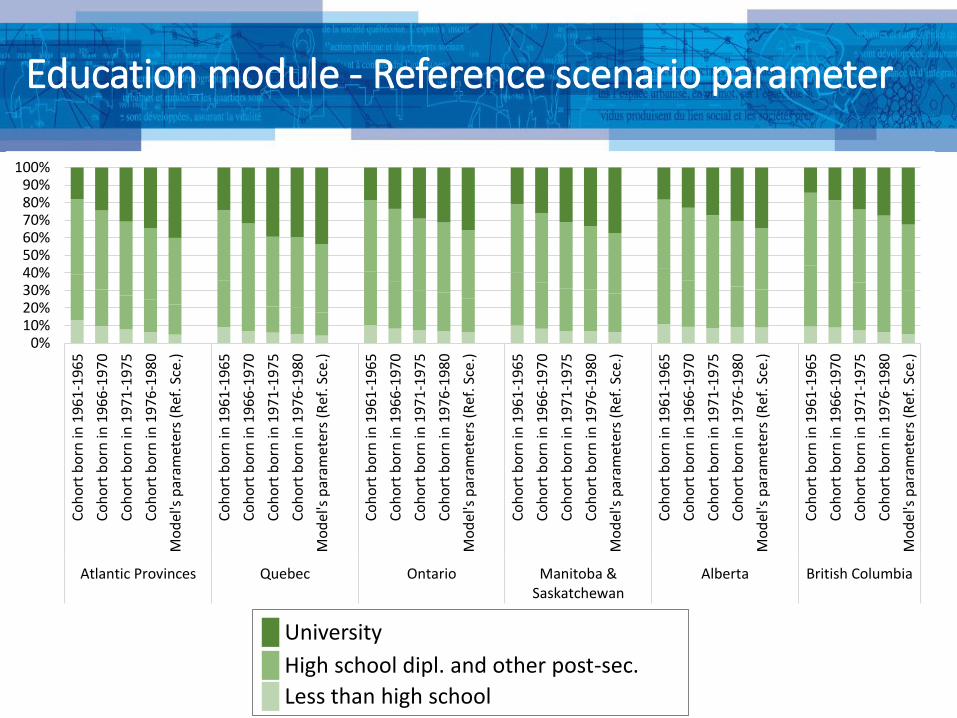
Education module - Reference scenario parameter
0%10%20%30%40%50%60%70%80%90%
100%
Co
ho
rt b
orn
in 1
96
1-1
96
5
Co
ho
rt b
orn
in 1
96
6-1
97
0
Co
ho
rt b
orn
in 1
97
1-1
97
5
Co
ho
rt b
orn
in 1
97
6-1
98
0
Mo
del
's p
aram
eter
s (R
ef. S
ce.)
Co
ho
rt b
orn
in 1
96
1-1
96
5
Co
ho
rt b
orn
in 1
96
6-1
97
0
Co
ho
rt b
orn
in 1
97
1-1
97
5
Co
ho
rt b
orn
in 1
97
6-1
98
0
Mo
del
's p
aram
eter
s (R
ef. S
ce.)
Co
ho
rt b
orn
in 1
96
1-1
96
5
Co
ho
rt b
orn
in 1
96
6-1
97
0
Co
ho
rt b
orn
in 1
97
1-1
97
5
Co
ho
rt b
orn
in 1
97
6-1
98
0
Mo
del
's p
aram
eter
s (R
ef. S
ce.)
Co
ho
rt b
orn
in 1
96
1-1
96
5
Co
ho
rt b
orn
in 1
96
6-1
97
0
Co
ho
rt b
orn
in 1
97
1-1
97
5
Co
ho
rt b
orn
in 1
97
6-1
98
0
Mo
del
's p
aram
eter
s (R
ef. S
ce.)
Co
ho
rt b
orn
in 1
96
1-1
96
5
Co
ho
rt b
orn
in 1
96
6-1
97
0
Co
ho
rt b
orn
in 1
97
1-1
97
5
Co
ho
rt b
orn
in 1
97
6-1
98
0
Mo
del
's p
aram
eter
s (R
ef. S
ce.)
Co
ho
rt b
orn
in 1
96
1-1
96
5
Co
ho
rt b
orn
in 1
96
6-1
97
0
Co
ho
rt b
orn
in 1
97
1-1
97
5
Co
ho
rt b
orn
in 1
97
6-1
98
0
Mo
del
's p
aram
eter
s (R
ef. S
ce.)
Atlantic Provinces Quebec Ontario Manitoba &Saskatchewan
Alberta British Columbia
█ University
█ High school dipl. and other post-sec.
█ Less than high school

Modelling Labour Force
• Binary variable: Active vs. Inactive
• Value derived from characteristics
• Parameters extrapolate observed trends:• Increasing female participation
• Increasing 55+ participation
• Native-born vs. Foreign-born participation gap
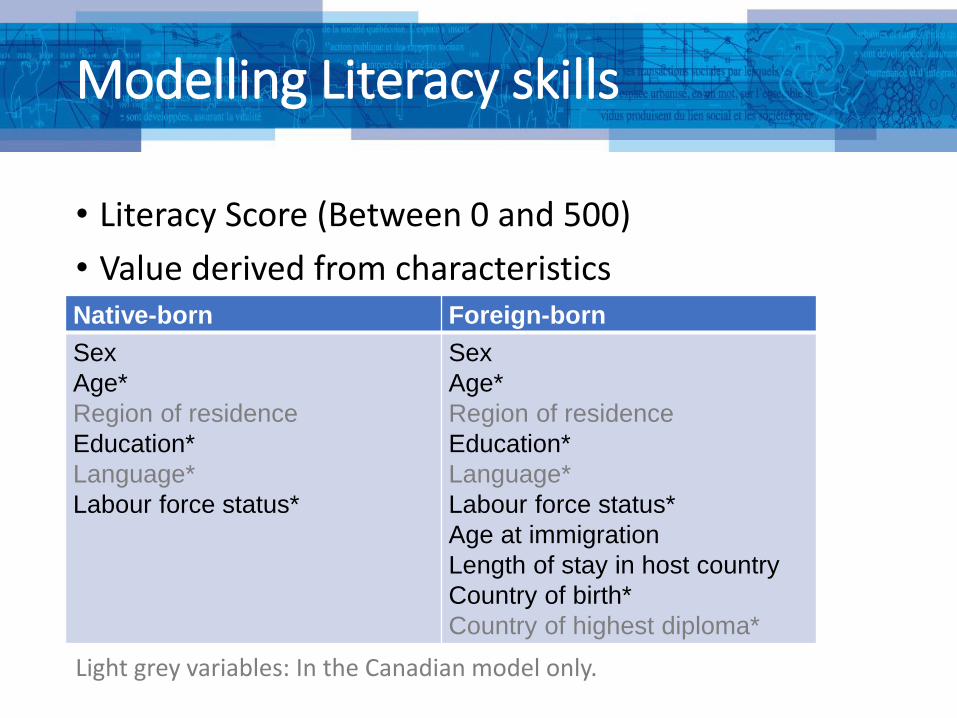
Modelling Literacy skills
• Literacy Score (Between 0 and 500)
• Value derived from characteristicsNative-born Foreign-born
Sex
Age*
Region of residence
Education*
Language*
Labour force status*
Sex
Age*
Region of residence
Education*
Language*
Labour force status*
Age at immigration
Length of stay in host country
Country of birth*
Country of highest diploma*
Light grey variables: In the Canadian model only.

PIAAC data analysis
• Regression analyses – the results• Education is the main driver.
• Language is important too
• Literacy declines with age
• Mother’s education level is a significant predictor of one’s literacy skill level
• Life-wide factors are important and significant
• Some immigrants’ characteristics are significant, such as the country of highest diploma
• No significant link between literacy and sex or region of residence (province, urban/rural)
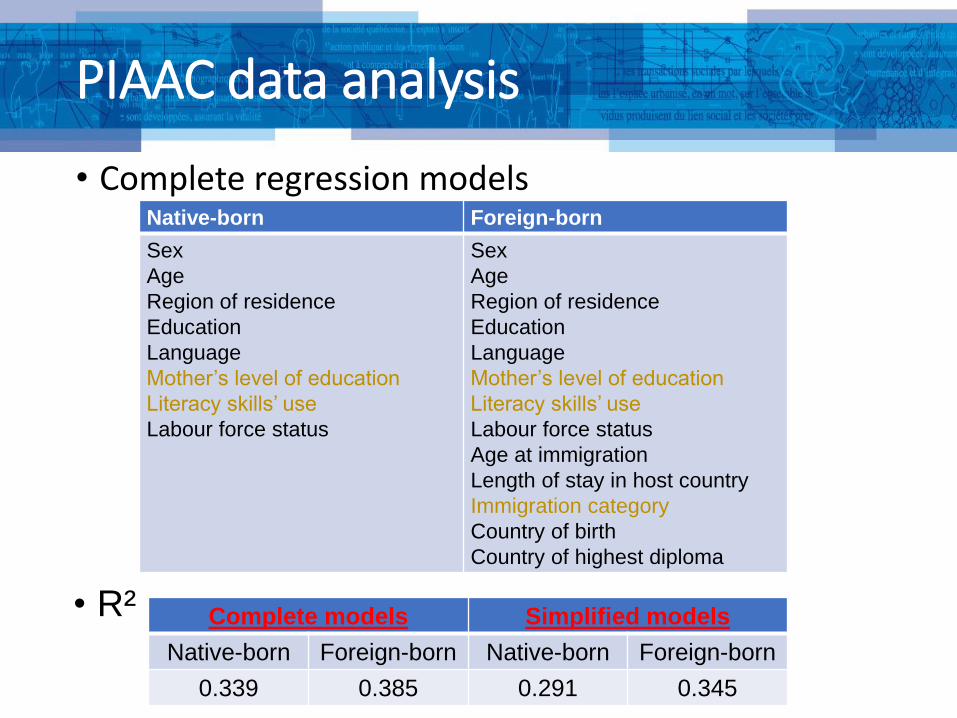
PIAAC data analysis
• Complete regression modelsNative-born Foreign-born
Sex
Age
Region of residence
Education
Language
Mother’s level of education
Literacy skills’ use
Labour force status
Sex
Age
Region of residence
Education
Language
Mother’s level of education
Literacy skills’ use
Labour force status
Age at immigration
Length of stay in host country
Immigration category
Country of birth
Country of highest diploma
Complete models Simplified models
Native-born Foreign-born Native-born Foreign-born
0.339 0.385 0.291 0.345
• R²