project title project manager: affiliation: university of
TRANSCRIPT

2020 Project Abstract For the Period Ending June 30, 2020 PROJECT TITLE: Develop a System to Assess Wildlife Health Threats in Minnesota PROJECT MANAGER: Kimberly VanderWaal AFFILIATION: University of Minnesota MAILING ADDRESS: Department of Veterinary Population Medicine, 1365 Gortner Avenue CITY/STATE/ZIP: St. Paul, MN 55108 PHONE: 612-624-9289 E-MAIL: [email protected] WEBSITE: N/A FUNDING SOURCE: Environment and Natural Resources Trust Fund LEGAL CITATION: M.L. 2018, Chp. 214, Art. 4, Sec. 02, Subd. 03f APPROPRIATION AMOUNT: $280,000 AMOUNT SPENT: $280,000 AMOUNT REMAINING: $0 Sound bite of Project Outcomes and Results The project created a dashboard and database that aggregates data from The Raptor Center and Wildlife Rehabilitation Center. Data can be visualized, mapped, and analyzed in real-time, allowing stakeholders to interact with their data in new and informative ways and facilitating earlier detection of health threats or emerging environmental issues. Overall Project Outcome and Results Identifying population health threats in wildlife over time and space is challenging, as data collection can be expensive and time-consuming. An alternative solution is to use existing primary care data from wildlife rehabilitation centers, which can act as sentinels. Establishing an information management and alert system to monitor wildlife health by merging databases of the two major wildlife rehabilitation centers of Minnesota. Use of the database to investigate environmental and land-use drivers of wildlife health. The electronic databases of The Raptor Center and Wildlife Rehabilitation Center were merged into one database, which is set to be supported by the database server of the University of Minnesota. An online dashboard platform was created to facilitate visualization and descriptive analysis of the submissions. The dashboard is comprised of location maps and temporal graphs with the option to sort according to date range, species groups, location, clinical and diagnostic characteristics, resolution, and the circumstance that lead to the wildlife submissions, including entrapment and habitat destruction. Anomalies of submissions, i.e. more submissions from a specific area within a short span of time than expected, assessment was done using spatial scan statistics. This approach of anomaly detection may help clinicians to investigate, conduct surveillance, and be vigilant about emerging threats to wildlife health. While the anomaly detection is not featured in the online dashboard, the research provides a ‘baseline’ of expected seasonality and space-time patterns of submissions. The project lead to increased collaboration between clinicians and researchers, and opportunity to use population statistics in their work. Understanding the species group-specific seasonality and space-time patterns of all species groups collectively provides a unique opportunity to monitor the population health trends, investigating drivers including environmental and land-use changes, and eventually informing Minnesotans to be in alert and take actions to improve wildlife health. Project Results Use and Dissemination The online dashboard has been shared with both the centers and a virtual meeting participating researchers of the University of Minnesota, developers of Epi Interactive of New Zealand (collaborator), and the clinicians from the two wildlife rehabilitation centers was held in May, 2020 to demonstrate the functionality of the dashboard.
Page 1 of 30
- Page 2 of 2 -
Three scientific manuscripts are in being prepared in relation to this project and they are intended to be submitted to peer-reviewed journals for publication: Dashboard development, Spatiotemporal patterns of wildlife health, and Monitoring West Nile virus in the metro area of Minnesota. Dashboard development: The manuscript would describe the importance of using existing databases as a potential passive surveillance or sentinel system to recognize wildlife health threats. The details would include database merging process, geocoding options (recognizing the submission location based on the provided address or location description), and the steps in development of the dashboard. Spatiotemporal patterns of wildlife health: The manuscript would describe time-series and spatiotemporal analytical methods that were used to determine seasonality of submissions and the ‘expected’ numbers of submissions. Moreover, the manuscript would describe a novel approach to detect space-time anomalies where multiple species groups were submitted from the same area within a short span of time compared to the expected ‘baseline’. This method of detecting ‘cluster submissions’ also supports determining the key drivers led to submissions such as habitat-destruction. The manuscript would describe the method using a subset of data from both the centers and relevant examples of temporal patterns and ‘cluster submissions’. Monitoring West Nile virus in the metro area of Minnesota: The manuscript and the data analysis intends to demonstrate spatiotemporal patterns of West Nile virus (WNV) detected in mosquito, bird, animal, and human populations focusing on the seven-county metro area of Minnesota. This disease specific research project extends the proposed utility of existing wildlife rehabilitation data and bring other parallel databases together for the analysis. The collaborators who contribute with relevant data are Minnesota Department of Health (MDH) providing human data, Minnesota Board of Animal Health (MNBOAH) providing animals detected with WNV such as horses, and Minnesota Mosquito Control District (MMCD) providing the data relevant to mosquito surveillance. The research project is currently at the analytical stage.
Page 2 of 30

Environment and Natural Resources Trust Fund (ENRTF) M.L. 2018 ENRTF Work Plan (Final Report)
Today’s Date: June 30, 2020
Date of Next Status Update Report: Final Report
Date of Work Plan Approval: 06/05/2018
Project Completion Date: June 30, 2020
PROJECT TITLE: Develop a System to Assess Wildlife Health Threats in Minnesota
Project Manager: Kimberly VanderWaal
Organization: University of Minnesota
College/Department/Division: Department of Veterinary Population Medicine
Mailing Address: 1365 Gortner Avenue
City/State/Zip Code: St. Paul, MN 55108
Telephone Number: 612-624-9289
Email Address: [email protected]
Web Address:
Location: Statewide
Total Project Budget: $280,000
Amount Spent: $280,000
Balance: $0
Legal Citation: M.L. 2018, Chp. 214, Art. 4, Sec. 02, Subd. 03f Appropriation Language: $280,000 the second year is from the trust fund to the Board of Regents of the University of Minnesota to develop a statewide information-management system that uses wildlife-rehabilitation data to identify emerging threats to wildlife health in Minnesota.
Page 3 of 30

2
I. PROJECT STATEMENT:
We propose to advance surveillance for wildlife health threats within Minnesota through the development of information management and analytical systems that utilize wildlife rehabilitation data. Threats to animal health include toxins and diseases such as avian influenza, West Nile Virus, and canine distemper. Lack of information on the occurrence of these threats in wildlife makes it challenging to identify concerning trends in wildlife population health, but sampling free-ranging wildlife is expensive, challenging, and time-consuming. In contrast, over 13,000 animals are admitted annually to wildlife rehabilitators in Minnesota. Health information routinely recorded on these animals (e.g., species, age, and location, reason for admission, and symptoms /clinical signs) could be utilized for tracking health trends. However, we lack systems to aggregate and analyze these data and thus wildlife rehabilitation data is currently a missed opportunity. This project will develop information systems to monitor wildlife health in Minnesota and provide an early warning system with the potential to detect new health threats or emerging environmental issues impacting health. This monitoring system may also identify geographic areas or species experiencing health events, which will allow for more strategic use of resources in that these populations can be targeted for more in-depth health investigations or interventions, leading ultimately to more effective control and prevention of emerging health threats.
Our specific aims are to: 1) Establish data systems that utilize wildlife rehabilitation data to monitor wildlife population health trends 2) Develop an alert system for detecting anomalies in wildlife rehabilitation data that may indicate emerging
health threats 3) Investigate environmental and land-use drivers of wildlife health trends
The Raptor Center (TRC) and Wildlife Rehabilitation Center of Minnesota (WRC) have maintained electronic medical databases on rehabilitated animals since 1990 and 1999, respectively. These animals can be used as sentinels for underlying health issues in wild populations, for detecting emerging health threats, and for monitoring the relative abundance of species across time. To maximize the utility of data, TRC, WRC, and others developed a standardized terminology for health records at wildlife care centers as part of a previous ENRTF project. These standards facilitate the integration and analysis of medical records from different wildlife rehabilitators for surveillance purposes. As a proof-of-concept, analysis of TRC rehabilitation data shows that we could have detected the arrival of West Nile Virus in Minnesota in 2002. However, for effective and timely surveillance, we urgently need systems to monitor these data in real-time rather than analyzing the data after the event has occurred. This project will enhance our ability to understand drivers of health in wildlife populations and to conduct surveillance for emerging health threats. II. OVERALL PROJECT STATUS UPDATES:
First Update January 31, 2019 Initial steps in the building a central database for the MN wildlife rehabilitation data are in progress with the collaboration from the Epi-interactive. Data from TRC and WRC were collated into two large databases and the criterion for merging the databases were recognized. Additionally, a qualified post-doctoral candidate was identified and the duties of the post-doc commences beginning February 2019. All activities are on schedule. Second Update June 30, 2019 Basic analytical components that are to be incorporated into the online visualization platform are recognized. The raptor (bird) data collected by both TRC and WRC would be eventually combined for the spatial and spatiotemporal analyses. The initial versions of the “mock-ups”, i.e. simply the web illustrations of the descriptive and analytical outputs, were generated and shared with the TRC and WRC collaborators for their feedback and further refinements of both analysis and visualization platforms. For the sustainability of the online platform, collaboration between UMN based server for continued data collection and collation is being discussed. The web platforms would facilitate visualization the following components: 1) temporal summaries of
Page 4 of 30

3
TRC and WRC submissions by week, month, and year; 2) temporal trends of submissions over the years; 3) mapping of the submission by exact or approximate location (depending on the accuracy gained by geocoding the currently collected TRC and WRC data; and 4) recognition of spatiotemporal aggregations (i.e. space-time clusters of submissions) collectively by species group would be facilitated using scan statistics. In addition to the progress being made, the process has supported recognizing the ways to improve data collection of TRC and WRC, especially related to the geographic location and clinical symptoms. This includes the use of detailed address (in the absence of geocodes) or suggestion of using an online platform such as google maps to precisely locate the case submissions. Third Update January 31, 2020 1) Establishing data systems: Databases from TRC and WRC have been standardized and the arrangements for bi-weekly sharing of data with the Epi-interactive server has been established. Relevant members of both TRC and WRC would have access to the online platform in the upcoming months. 2) Developing online platform for visualization and analysis: The essential visualization and analytical components that are to be incorporated into the online visualization platform are recognized through discussions among collaborators. The analytical steps of time-series and spatiotemporal analysis of the events to detect patterns and anomalies are ongoing. 3) Investigation of environmental and land use drivers: The primary analysis focusing on avian species (birds) related to West Nile virus infection and the environmental and land use drivers is ongoing. In addition to TRC and WRC data, this analysis involves bringing parallel databases together including databases related to West Nile virus in human, animal, and mosquito databases available from Minnesota Department of Health, Minnesota Board of Animal Health, and Minnesota Mosquito Control District respectively. Amendment Request as of [04/27/2020] Budget change: Reallocation of $487 from supplies and $1700 from travel into Service Contract – Epi-Interactive. The effort required to build the online portal for data visualization was more challenging and took more time than originally anticipated due to the level of complexity required to geocode data from the Wildlife Rehabilitation Center. Moving these funds to the service contract will allow us to complete the work without delay. No changes to the workplan are proposed.
• Amendment Approved by LCCMR 6/1/2020
Final Update June 30, 2020 The project accomplished its primary objective of establishing an information management system to monitor wildlife health by merging databases of The Raptor Center and Wildlife Rehabilitation Center, and facilitating visualization and descriptive analysis through an online dashboard. The system will be updated bi-weekly and used by clinicians at both centers. Background: Identifying population health threats in wildlife over time and space is challenging, as data collection can be expensive and time-consuming. An alternative solution is to use existing primary care data from wildlife rehabilitation centers, which can act as sentinels. Objectives: Establishing an information management and alert system to monitor wildlife health by merging databases of the two major wildlife rehabilitation centers of Minnesota. Use of the database to investigate environmental and land-use drivers of wildlife health.
Page 5 of 30

4
Methods: The electronic databases of The Raptor Center and Wildlife Rehabilitation Center were merged into one database, which is set to be supported by the database server of the University of Minnesota. An online dashboard platform was created to facilitate visualization and descriptive analysis of the submissions. The dashboard is comprised of location maps and temporal graphs with the option to sort according to date range, species groups, location, clinical and diagnostic characteristics, resolution, and the circumstance that lead to the wildlife submissions, including entrapment and habitat destruction. Anomalies of submissions, i.e. more submissions from a specific area within a short span of time than expected, assessment was done using spatial scan statistics. This approach of anomaly detection may help clinicians to investigate, conduct surveillance, and be vigilant about emerging threats to wildlife health. While the anomaly detection is not featured in the online dashboard, the research provides a ‘baseline’ of expected seasonality and space-time patterns of submissions. Significance: The project lead to increased collaboration between clinicians and researchers, and opportunity to use population statistics in their work. Understanding the species group-specific seasonality and space-time patterns of all species groups collectively provides a unique opportunity to monitor the population health trends, investigating drivers including environmental and land-use changes, and eventually informing Minnesotans to be in alert and take actions to improve wildlife health. Dissemination activities:
1. The online dashboard named “WILDLIFE/SAVI” (Appendix 3: Figure 01 and 02) has been shared with both the centers and a virtual meeting participating research-team of the University of Minnesota, developers of Epi Interactive of New Zealand (collaborator), and the clinicians from the two wildlife rehabilitation centers was held in May, 2020 to demonstrate the functionality of the dashboard.
2. Three scientific manuscripts are in being prepared in relation to this project and they are intended to be submitted to peer-reviewed journals for publication.
I. Dashboard development: The manuscript would describe the importance of using existing databases as a potential passive surveillance or sentinel system to recognize wildlife health threats. The details would include database merging process, geocoding options (recognizing the submission location based on the provided address or location description), and the steps in development of the dashboard.
II. Spatiotemporal patterns of wildlife health: The manuscript would describe time-series and
spatiotemporal analytical methods that were used to determine seasonality of submissions and the ‘expected’ numbers of submissions. Moreover, the manuscript would describe a novel approach to detect space-time anomalies where multiple species groups were submitted from the same area within a short span of time compared to the expected ‘baseline’. This method of detecting ‘cluster submissions’ also supports determining the key drivers led to submissions such as habitat-destruction. The manuscript would describe the method using a subset of data from both the centers and relevant examples of temporal patterns and ‘cluster submissions’.
III. Monitoring West Nile virus in the metro area of Minnesota: The manuscript and the data analysis
intends to demonstrate spatiotemporal patterns of West Nile virus (WNV) detected in mosquito, bird, animal, and human populations focusing on the seven-county metro area of Minnesota. This disease specific research project extends the proposed utility of existing wildlife rehabilitation data and bring other parallel databases together for the analysis. The collaborators who contribute with relevant data are Minnesota Department of Health (MDH) providing human data, Minnesota Board
Page 6 of 30

5
of Animal Health (MNBOAH) providing animals detected with WNV such as horses, and Minnesota Mosquito Control District (MMCD) providing the data relevant to mosquito surveillance. The research project is currently at the analytical stage.
III. PROJECT ACTIVITIES AND OUTCOMES:
Activity 1: Establish data systems utilizing rehabilitation data to monitor wildlife health Description: We will build a central database for MN wildlife rehabilitation data. Aggregated data will include retrospective data from the 1990s to present as well as prospective data on animals admitted for rehabilitation. Data will be used to a) quantify seasonal patterns of wildlife admissions based on species, age, and clinical signs, and b) evaluate long-term trends in wildlife rehabilitation data. Results will be used to establish baselines of what are “typical” patterns of admission. We will c) build an online platform to facilitate data aggregation across facilities, data analysis, visualization, and reporting of health trends to allow easy access and use by different stakeholders (e.g. veterinarians, researchers, policy makers). Briefly, data from the past 15 years will be compiled from TRC and WRC to assemble a single database including the date of admission, species, clinical signs, and location. A retrospective summary of the weekly admission data will be compiled using the vetsyn package in R Statistical Software. Retrospective patterns will be further analyzed using univariate and multivariate time-series analyses. These time series models allow for the establishment of baseline patterns of wildlife admission data, accounting for long-term trends and seasonal variation. The online data aggregation platform will be constructed for data visualization and analysis. We will work with IT professionals at both WRC and TRC in order to connect their databases to the central database accessed by the data platform. ENRTF BUDGET: $120,300
Amount Spent: $ 120,300 Balance: $ 0
Outcome Completion Date a. Quantify seasonal patterns of wildlife admission data 30 DEC 2018 b. Establish baselines and evaluate long-term wildlife health trends 30 DEC 2018 c. Build online platform for data aggregation, analysis, and reporting 30Jun 2020
Page 7 of 30
6
First Update January 31, 2019 Key updates from the previous report:
• Wildlife admission data from both TRC and WRC were analyzed separately to understand and quantify the seasonal patterns of admissions.
• Both TRC and WRC records indicate increasing trend of submissions during recent years. • Analytical methods are underway to quantify seasonal patterns of wildlife admissions based on species,
age, and clinical signs. • Study methodology has been further refined and a detailed timeline is established for the data analysis
and database building steps. Second Update June 30, 2019 The TRC and WRC data were subjected to timeseries analysis and to establish the “typical” patterns of submissions. This recognition of typical patterns involve fitting of timeseries models to the existing data. Example representations of timeseries analytical outputs for TRC and WRC submissions of avian species is illustrated in Fig 1. Similarly, the timeseries models fitted for each species in TRC (example models for Red-Tailed Hawk and Broad-Winged Hawk are illustrated) and WRC by animal group, i.e. Amphibian, Avian, Mammalian, and Reptile are illustrated (Figs 2 and 3). The units of analysis for timeseries was weeks. The next step of fitting models for typical patterns would enable the detection of anomalies, which is described under the activity 2 (Fig 4). The TRC data are geocoded in the database, while the WRC data are available in the format of address or the description of the place where the animals were found. Geocoding attempts are being taken to assign the location coordinates as accurate as possible for the WRC locations. Due to the inaccuracies of the descriptions, nearly 40% of the WRC past data may not be included in the space-time analyses in the current platform. However, the analytical attempts have provided the opportunity to recognize data gaps and suggestions on the potential improvements to the data entry processes. For the sustainability of the online platform, collaboration between UMN based server for continued data collection and collation is being discussed. Third Update January 31, 2020 a and b. Quantifying seasonal patterns and establishing baselines: The baselines have been discussed. The analytical steps of time-series and spatiotemporal analysis of the events to detect patterns and anomalies are ongoing. c. Building online platform: An in-person meeting was held in September 2019 with the participants from TRC, WRC, UMN research team, and Epi-interactive to further discuss the contents and configuration of the online dashboard. Based on the feedback from TRC and WRC collaborator, further refinements of both analytical and visualization platforms have been made. Final Update June 30, 2020 The planned activities under Activity 1, especially the development of online dashboard has been completed. Outcomes a and b: Time-series and spatiotemporal cluster analysis methods were used to quantify seasonal patterns and establish baselines. The analytical outputs will be discussed with TRC and WRC clinicians to identify improvements in the analysis including assumptions and parameter values used. The data collected between 01/01/2015 and 12/31/2019 from both TRC and WRC included a total of 70, 295 records. However, due to the difficulties in geocoding (i.e. assigning latitude-longitude coordinate to each location based on the description) only 4687 / (87.4%) of TRC records and 61,829 (95.2%) of WRC data were included in the spatiotemporal analysis. The analysis was focused on Minnesota. A total of 29 species groups including raptors, carnivores, deer, rabbits and hares etc. submitted due to 12 major ‘circumstances’ were analyzed. The temporal patterns of different species groups depicts the clear seasonality of the submissions over time (Appendix 3: Figure 02). The
Page 8 of 30

7
spatiotemporal clusters detected supported understanding the ‘baseline’ as well as detecting anomalies in submitting statistically significant numbers of different species groups from the same area (detecting 10% of the cases within a radius of 30km) with relatively short span of time (A time window ranging from few days to a maximum of 3-months). Numerous space-time clusters were detected every year and the significant ‘submission clusters’ will be further investigated to identify the reason for increased submissions as well as the drivers led to the increased submissions (Appendix 3: Figure 04 and 05). Outcome c. The WILDLIFE/SAVI online dashboard platform developed by Epi Interactive has been shared with clinicians of TRC and WRC. The access to the WILDLIFE/SAVI is currently available to research team of UMN, TRC and WRC clinicians. The dashboard enables both visualization and descriptive analysis of the wildlife rehabilitation data. The essential visualization and analytical components include the following:
• Summary statistics of the overall submissions, circumstances which lead to the wildlife submissions including entrapment and habitat destruction, and percentage with a resolution
• Geographical mapping of the cases with the option to sort according to date range • Temporal visualizations of submissions with the option to sort according to date range • Options to sort and visualize the submissions by species groups, location, clinical and diagnostic
characteristics as well as the circumstance (Appendix 3: Figure 01 and 02). • Option to download selected data columns from the entire database for research purposes
A virtual meeting participating research-team of the University of Minnesota, developers of Epi Interactive of New Zealand (collaborator), and the clinicians from the two wildlife rehabilitation centers was held in May, 2020 to demonstrate the functionality of the dashboard. Further feedback on the usage and feedback are being collected from the clinicians of the two centers to determine any discrepancies. . Activity 2: Develop an alert system for detecting anomalies in wildlife rehabilitation data that may indicate an emerging health threat
Using time series analysis of retrospective data, we will a) forecast expected patterns based on seasonal and long-term trends. We will then, b) develop analytical pipelines to detect aberrations in the data that deviate from forecasted patterns that may indicate a new or changing health threat (such as a new disease). We will also apply spatial tools to c) identify spatial and temporal clusters of cases that may indicate a health event is occurring. Alerts will be issued when data anomalies or case clusters are detected. Validation of alert system will focus on optimizing the sensitivity of the system to detect health concerns while minimizing “false alarms.” Once robust baselines are developed with retrospective data, expected patterns can be forecasted for each syndrome. These forecasts represent the expected or typical patterns in the data, and anomalies can be detected based on deviations from forecasted patterns. In order to optimize and validate the anomaly detection algorithms, we utilize a number of true and simulated health events to train the algorithms using the retrospective data. We do this in order to be able to compare the accuracy of the detection algorithms against a known health-related data anomaly, such as the emergence of West Nile Virus in birds. Anomaly detection algorithms to be explored and optimized include Holt-Winters and Shewart control charts, cumulative sums (CUSUM) charts, exponential weighted moving averages, and support vector machines. The threshold value for generating an alert (i.e., the magnitude in which the observed data deviates for the expected pattern) will be optimized to maximize sensitivity of the early warning system while minimizing the risk of false alarms.
Page 9 of 30

8
In addition, tools for detection of clusters cases in time and space will be applied to identify and quantify epidemiological patterns. Cases that cluster in time, space, or both are potentially epidemiologically linked, either representing potential transmission events in the population or exposure to a common set of environmental risk factors. Cluster analysis techniques will include k-functions, Knox tests, Mantel tests, Oden’s directional test, and the scan statistic. Detection of case clusters will be used as an addition method for generating alerts about emerging or changing health issues. ENRTF BUDGET: $105,300
Amount Spent: $ 105,300 Balance: $ 0
Outcome Completion Date a. Forecast expected number of animals admitted for rehabilitation based on seasonal patterns and long-term trends
30 JUN 2019
b. Develop analytics to detect anomalies in the data that may serve as an early warning for an emerging health concern
30 DEC 2019
c. Identify spatial/temporal clusters of cases that may indicate a health event is occurring
30 DEC 2019
First Update January 31, 2019 Descriptive time-series analysis was conducted to establish baselines of the admissions (Appendix), which support the pattern detection and forecasting of the expected numbers both spatially and temporally. Initial mapping of the TRC cases was completed (Appendix- Figure 1), and further steps to geocode the WRC data using the location descriptions are underway. In addition to above steps, this activity is pending completion of Activity 1. Second Update June 30, 2019 Further analysis are underway to develop a method in identifying the spatiotemporal diversities of the TRC and WRC submissions. This recognition of space-time clusters of overall cases, submissions by species group, by species would facilitate the space-time related anomalies that could have led to the increased submission of wildlife to TRC and/or WRC. The space-time specific anomalies include recognition of specific situations where habitat destruction due to human activities or accidental situations (for example chemical spills) which may have affected overall wildlife or few groups of wildlife at a certain area at a certain time, compared to the expected numbers of submissions. The detection of both temporal and spatiotemporal patterns would be tested for potential detection of emerging conditions such as public health threats including West Nile Virus and Lyme disease, effects of wildlife behavioral changes due to environmental contaminants and habitat destruction as a result of human mediated activities (This component leads to the Activity 3 eventually). Third Update January 31, 2020 a. Forecast expected numbers: Time series analysis was used to establish the baseline numbers of submissions and further analysis are underway to improve the method of forecasting the expected number of submissions ( Appendix 1: Figure 01) . Meanwhile, the plans to represent the average number of submissions with a minimum and maximum range based on past data is offered through the data visualization process (Appendix 2: Figure 01). b and c. Develop analysis to detect anomalies: There are two aspects of anomaly detection. One is the temporal aspect which detects “when” does the submission look like an anomaly compared to the baseline, based on time series analysis. The second is the detection of the anomaly in both space and time i.e. “when and where” using spatiotemporal cluster analysis. Spatiotemporal cluster analysis of TRC submissions for selected species were conducted (Appendix 2: Figure 02). The options to overcome the hurdle of incorporating the space-time cluster
Page 10 of 30

9
analysis which is powered by a third-party software (SaTScanTM: https://www.satscan.org/) and enabling the analysis through the server where databases are collated is being explored. Potential alternatives for this step are also being considered. Geocoding the WRC data (i.e. identification of exact geographical location of WRC data for mapping and analysis) has been a slow progressing step due to the fact that exact coordinates were not included in the database. The approximate locations are being derived based on the location descriptions and mailing addresses, however, this process has generated additional steps of data cleaning and hence delayed the incorporation of WRC data in the space-time analysis. Final Update June 30, 2020 Planned activities under Activity 2 has been completed. a. Forecast expected numbers: Time series analysis was used to establish the baseline numbers of submissions and the observed seasonality. Instead of forecasting for the near future, the anomalies of submissions were compared against the expected number of cases based on previous years (Appendix 3: Figure 02). The dashboard also facilitates the option to visualize the yearly submissions or focusing the submissions from several years and comparing across (Appendix 3: Figure 01). b and c. Develop analysis to detect anomalies: We focused on two aspects of anomaly detection: 1) temporal aspect, i.e.“when” did the anomaly occurred compared to the baseline, based on time series analysis and 2) space and time anomaly detection, i.e. “when and where” using spatiotemporal cluster analysis. The multivariate multinomial space-time permutation version of the Scan statistic was used to determine areas with statistically significant submissions at a given period of time. The intent of clustering analysis was to test whether the locations where the wildlife were found are spatiotemporally grouped compared to the null hypothesis of random distribution across the geographical space over time. The space-time cluster analysis was powered by a third-party software (SaTScanTM: https://www.satscan.org/), and enabling SaTScan through the server was a hurdle. As an alternative, a standalone R statistical package named ‘multinomss’ has now been developed by collaborators of UMN Biostatistics Department targeting the wildlife rehabilitation data problem. However, the package was not finalized until May 2020, and therefore, the spatiotemporal pattern recognition option has not been incorporated into the dashboard. The research component of the spatiotemporal pattern recognition will be presented to the TRC and WRC members for their inputs and a scientific publication is being prepared based on the analysis. Geocoding the WRC data (i.e. identification of exact geographical location of WRC data for mapping and analysis) posed another hurdle, and two automatic batch geocoding methods were compared using a subset of the data. Geocoding using the Google API was relatively more accurate (96.2% accurate) compared to the ESRI’s geocode database (89.4%) when each was compared to manual geocoding using the ‘location description’ data field. For this reason, WILD/SAVI dashboard and the space-time pattern analysis only includes the records with recognized latitude and longitude within the boundaries of Minnesota and part of Wisconsin (i.e. the latitude range from 43 through 50 and the longitudes range from -97 through -88). Activity 3: Investigate environmental and land-use drivers of wildlife health Using Geographic Information Systems (GIS) and ecological modeling, we will a) analyze relationships between spatial patterns in health data and landscape factors, such as roads, land cover, land use, etc. We will also b) assess relationships between temporal patterns in health data and changes in climatic and weather conditions. Results
Page 11 of 30
10
from this activity will help describe drivers of health trends, and identify high-risk areas where wildlife populations may be experiencing poor health or environmental threats to their health. Understanding the distribution and conditions associated with past animal health anomalies can help predict areas that are likely to experience similar events in the future. Such predictions can be based on environmental conditions, history of similar anomalies within an area, land use/land change, proximity to urban areas, etc. These data can be collected from available maps, GIS layers, and other databases. To determine which landscape and environmental factors are important drivers of the spatial pattern of cases in Minnesota, we will develop analytical models that can be used to identify areas most at risk for anomalies. Modeling methods include generalized linear mixed-effect modeling on the number of cases per county, kriiging, and/or ecological niche modeling using maximum entropy. These multivariate spatial models will allow us to evaluate underlying environmental factors correlated with cases, and then identify high-risk regions with similar environmental factors that may be similarly vulnerable to a given animal health concern. Additionally, time series regression will be used to assess the impact of climate change and intra- and inter-annual variation in weather on animal health. ENRTF BUDGET: $54,400
Amount Spent: $ 54,400 Balance: $ 0
Outcome Completion Date a. Analyze relationships between wildlife health data and landscape factors 30 JUN 2020 b. Assess relationships between temporal patterns in health data and changes in climatic and weather conditions
30 JUN 2020
First Update January 31, 2019 The cases admitted to TRC were from Minnesota (n=3633), Wisconsin (n=429), North Dakota (n=20), and Iowa (n=12). Majority of the TRC cases of Minnesota were brought in from the twin-cities area and its peripheral counties (Appendix – Figure 1), except for a major submission from the Saint Luis county (n=138). Majority of the WRC cases were reported from Minnesota (n=1976), and further steps to geocode the WRC data using the location descriptions are underway. Other than the above steps, this activity is pending completion of Activity 1. Second Update June 30, 2019 As described under Activity 2, the Geocoding step of WRC data, which require a tedious approach due to the current location data structure, are being conducted. Discussions on the type of analysis to be incorporated into the online platform are being recognized with the feedback from TRC and WRC collaborators, through planned in-person meetings and via email conversations. A focus of these discussions will also be creating relevant information to support primary care decision to create a system that is attractive to use for the participating clinics to ensure sustainability of the project. Both the timeseries analysis (Activity 1) and spatial data refinement (Activity 2) are essential steps to be completed before the space and space-time data can be analyzed and modeled using techniques such as generalized linear mixed-effect modeling, kriging, or ecological niche modeling. The external databases that facilitate extraction of relevant environmental data such as temperature, precipitation, land use, urbanization etc are being recognized to be used in the future steps of the analysis.
Page 12 of 30

11
Third Update January 31, 2020 a and b. Analyze relationships between space-time patterns and epidemiological factors: Considering the complexity and diversity of all different animal species submitted to TRC and WRC, the primary research component on associating the environmental and land use drivers with submissions has been initially focused on avian species (birds) that are tested for the presence of West Nile virus. In addition to TRC and WRC data, this analysis involves bringing parallel databases together. The parallel databases are related to the detection of West Nile virus in human, animal, and mosquito databases available from Minnesota Department of Health, Minnesota Board of Animal Health, and Minnesota Mosquito Control District respectively (Appendix 2: Figure 03). The environmental and land use drivers currently being considered include climatic data including temperature and precipitation, wetland areas, and characteristics of residential areas. Given the data availability for avian and mosquito data for WNV is more prominent from the Twin Cities and the 7 metro area, the primary analysis would be focused on the characteristics of this area. The study on WNV would be a prototype for similar analyses possible using the TRC and WRC data and parallel datasets to explore and find solutions for climatic, environmental, land use, and associated factors leading to habitat destruction or diseases I wild life species. A meeting is to be held between April-May 2020 to share the preliminary results with TRC, WRC and the collaborating partners of WNV project. Final Update June 30, 2020 a and b. Analyze relationships between space-time patterns and epidemiological factors: Considering the complexity and diversity of all different animal species, the Activity 3 research component on associating the environmental and land use drivers with submissions has been focused on spatiotemporal patterns of West Nile virus (WNV). Specifically, we focus on WNV detected in mosquitos, birds, animals, and human populations within the seven-county metro area of Minnesota. This extended research project brings additional and parallel databases including Minnesota Department of Health (MDH) providing human data, Minnesota Board of Animal Health (MNBOAH) providing animals detected with WNV such as horses, and Minnesota Mosquito Control District (MMCD) providing the data relevant to mosquito surveillance. A syndromic surveillance approach is used to extract relevant records from the TRC-WRC merged database. An online survey was conducted to gather information from clinicians at TRC and WRC on ‘clinical symptoms’ of WNV suspected bird species. The research project is currently at the analytical stage. Additionally, the space-time pattern recognition discussed under Activity 2 also may guide future research as the work generated hypothesis about potential drivers leading to increased submission of wildlife species from a certain area at a certain time. This may include fire, floods, storms, extreme weather events as well as man-made drivers such as construction work. IV. DISSEMINATION:
Description: Our findings will be shared with state and county agencies, as well as non-government organizations, for their use in preventing, assessing, and responding to animal health threats. Findings will be presented at state, regional, and national meetings (e. SETAC, TWS, EEID) as appropriate given the results. Publications will be produced for peer-reviewed journals, and outreach newsletters. Media outreach will also be pursued. First Update January 31, 2019 Initial meetings with TRC and WRC are being planned to share the analytical outputs related to Activity 1 and receive their input on refining the next steps of the project.
Page 13 of 30

12
Second Update June 30, 2019 The initial outputs and web interface “mock-ups” have been shared with TRC and WRC collaborators and initial feedback have been received (Fig 5). In-person meetings are scheduled to be held in July-September 2019 to discuss further on the web interface and analytical outputs as well as the expectations of TRC and WRC collaborators. This will include in detail defining desired functionality of the online portal before it is being build. Third Update January 31, 2020
• UMN research team and Epi-interactive members have discussed the contents and features of web interface extensively with TRC and WRC collaborators. In person meeting was held in September 2019.
• An abstract summarizing the current progress and the future directions of the project was submitted to the “4th International Conference on Animal Health Surveillance - Bridging Science and Policy” to be held in 12-14 May, 2020 in Copenhagen, Denmark for oral/scientific-paper presentation.
Final Update June 30, 2020
• UMN research team and Epi-interactive members have discussed the dashboard contents in May 2020 and another meeting is intended to be held to discuss the research findings of the space-time pattern recognition and the patterns of West Nile virus detection in the upcoming months.
• The project was intended to be presented at the 4th International Conference on Animal Health Surveillance - Bridging Science and Policy which was planned to held in 12-14 May, 2020 in Copenhagen, Denmark in an oral/scientific-paper presentation. However, the conference has been postponed to September 2020 due to the current COVID-19 pandemic situation.
3. Three scientific manuscripts are in being prepared in relation to this project and they are intended to be submitted to peer-reviewed journals for publication.
IV. Dashboard development: The manuscript would describe the importance of using existing databases as a potential passive surveillance or sentinel system to recognize wildlife health threats. The details would include database merging process, geocoding options (recognizing the submission location based on the provided address or location description), and the steps in development of the dashboard.
V. Spatiotemporal patterns of wildlife health: The manuscript would describe time-series and
spatiotemporal analytical methods that were used to determine seasonality of submissions and the ‘expected’ numbers of submissions. Moreover, the manuscript would describe a novel approach to detect space-time anomalies where multiple species groups were submitted from the same area within a short span of time compared to the expected ‘baseline’. This method of detecting ‘cluster submissions’ also supports determining the key drivers led to submissions such as habitat-destruction. The manuscript would describe the method using a subset of data from both the centers and relevant examples of temporal patterns and ‘cluster submissions’.
VI. Monitoring West Nile virus in the metro area of Minnesota: The manuscript and the data analysis
intends to demonstrate spatiotemporal patterns of West Nile virus (WNV) detected in mosquito, bird, animal, and human populations focusing on the seven-county metro area of Minnesota. This disease specific research project extends the proposed utility of existing wildlife rehabilitation data
Page 14 of 30
13
and bring other parallel databases together for the analysis. The collaborators who contribute with relevant data are Minnesota Department of Health (MDH) providing human data, Minnesota Board of Animal Health (MNBOAH) providing animals detected with WNV such as horses, and Minnesota Mosquito Control District (MMCD) providing the data relevant to mosquito surveillance. The research project is currently at the analytical stage.
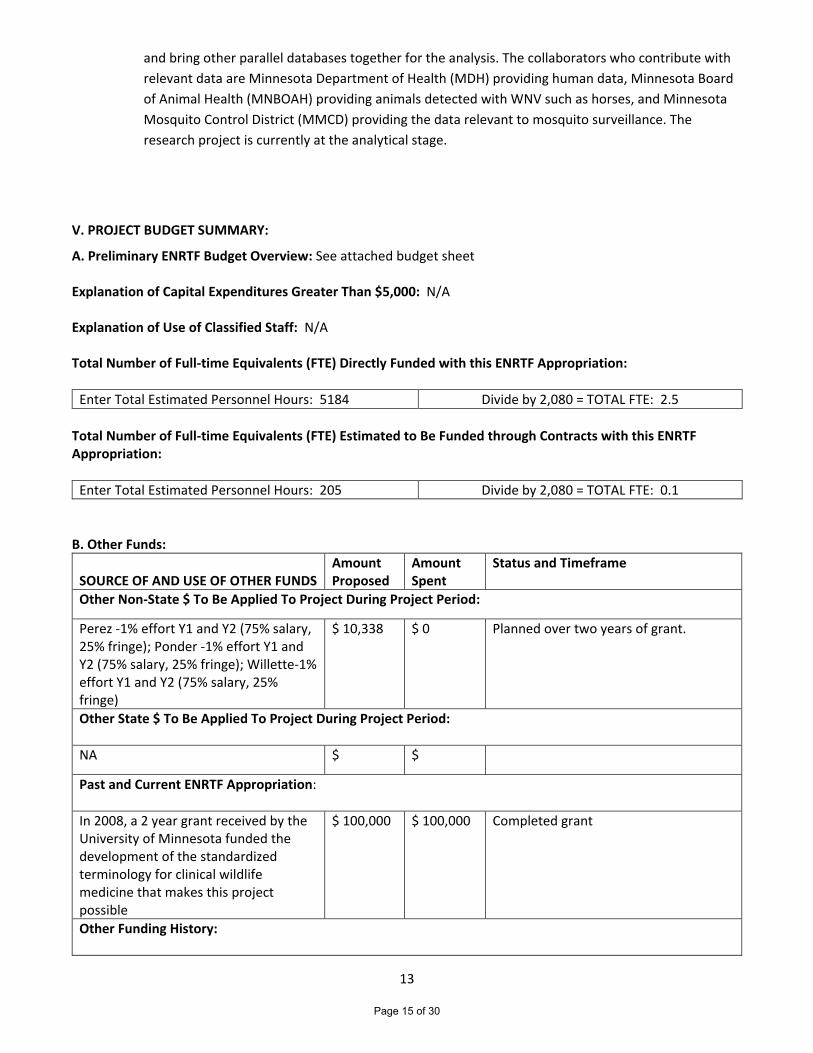
V. PROJECT BUDGET SUMMARY:
A. Preliminary ENRTF Budget Overview: See attached budget sheet Explanation of Capital Expenditures Greater Than $5,000: N/A Explanation of Use of Classified Staff: N/A Total Number of Full-time Equivalents (FTE) Directly Funded with this ENRTF Appropriation:
Enter Total Estimated Personnel Hours: 5184 Divide by 2,080 = TOTAL FTE: 2.5 Total Number of Full-time Equivalents (FTE) Estimated to Be Funded through Contracts with this ENRTF Appropriation:
Enter Total Estimated Personnel Hours: 205 Divide by 2,080 = TOTAL FTE: 0.1 B. Other Funds:
SOURCE OF AND USE OF OTHER FUNDS
Amount Proposed
Amount Spent
Status and Timeframe
Other Non-State $ To Be Applied To Project During Project Period:
Perez -1% effort Y1 and Y2 (75% salary, 25% fringe); Ponder -1% effort Y1 and Y2 (75% salary, 25% fringe); Willette-1% effort Y1 and Y2 (75% salary, 25% fringe)
$ 10,338 $ 0 Planned over two years of grant.
Other State $ To Be Applied To Project During Project Period: NA $ $
Past and Current ENRTF Appropriation: In 2008, a 2 year grant received by the University of Minnesota funded the development of the standardized terminology for clinical wildlife medicine that makes this project possible
$ 100,000 $ 100,000 Completed grant
Other Funding History:
Page 15 of 30

14
NA $ $
VI. PROJECT PARTNERS:
A. Partners receiving ENRTF funding Name Title Affiliation Role Kimberly VanderWaal Assistant Professor University of Minnesota
(UMN) Project manager
B. Partners NOT receiving ENRTF funding
Name Title Affiliation Role Julia Ponder Director of TRC, Assistant
Professor The Raptor Center UMN Avian and conservation
medicine
Michelle Willette Staff veterinarian The Raptor Center UMN Avian and conservation medicine
Philip Jenni Director, WRC MN Wildlife Rehabilitation Center
Wildlife medicine
Renee Schott Staff veterinarian, WRC MN Wildlife Rehabilitation Center
Wildlife Medicine
Andres Perez Associate Professor UMN Epidemiological methods
Petra Muellner Director Epi-Interactive Advisor on surveillance and information systems
VII. LONG-TERM- IMPLEMENTATION AND FUNDING:
Monitoring of wildlife health in free-ranging animals is costly and time-consuming. In contrast, rehabilitation data is already available and will continue to be routinely collected, though it is not currently used to systematically monitor health. Our online platform will ensure long-term sustainability of this initiative, given that data aggregation, analysis, and alerts will be automated through analytical pipelines within the system. In the future, the system can easily be scaled to surrounding states to gain additional insights about potential health threats to Minnesota wildlife. The system will also be widely accessible to health and natural resources agencies, including the MN DNR and Board of Animal Health, for management of natural resources and disease surveillance. Our monitoring and alert system will also assist wildlife managers and decision makers in targeting follow-up animal health investigations and interventions, leading to more strategic use of resources for sampling wildlife populations and ultimately improve our ability to monitor and manage the health of Minnesota wildlife. VIII. REPORTING REQUIREMENTS:
• The project is for 2 years, will begin on July/1/2018, and end on June/30/2020 • Periodic project status update reports will be submitted 1/1 and 6/1 of each year. • A final report and associated products will be submitted between June 30 and August 15, 2020.
Page 16 of 30

15
IX. SEE ADDITIONAL WORK PLAN COMPONENTS:
A. Budget Spreadsheet - attached B. Visual Component or Map - attached C. Parcel List Spreadsheet N/A D. Acquisition, Easements, and Restoration Requirements N/A E. Research Addendum Submitted, reviewed and updated
Page 17 of 30

Environment and Natural Resources Trust Fund (ENRTF) M.L. 2018 ENRTF Work Plan (Final Report)
Appendix 3 (Final Update June 30, 2020) Figure 01. WILDLIFE/SAVI dashboard components. A) Login and Home page B) Home page: Baseline statistics, maps, and time-series plots C) Clinical data tab: Clinical features of submissions D) Resolutions tab resolutions of the cases
Page 18 of 30

17
Figure 02. WILDLIFE/SAVI dashboard: Resolutions tab components. The dashboard indicating the proportion of cases that were resolved as died, euthanized, or released upon the submission to the rehabilitation centers.
Page 19 of 30

18
Figure 03. Time series plot of selected species groups. Simple moving average (sma) fitted to selected species groups from TRC and WRC data from 01/01/2015 – 12/31/2019 period. Time units are in days (y-axis) whereas; the number of cases per week are depicted on the x-axis.
Page 20 of 30
Environment and Natural Resources Trust Fund (ENRTF) M.L. 2018 ENRTF Work Plan (Final Report)
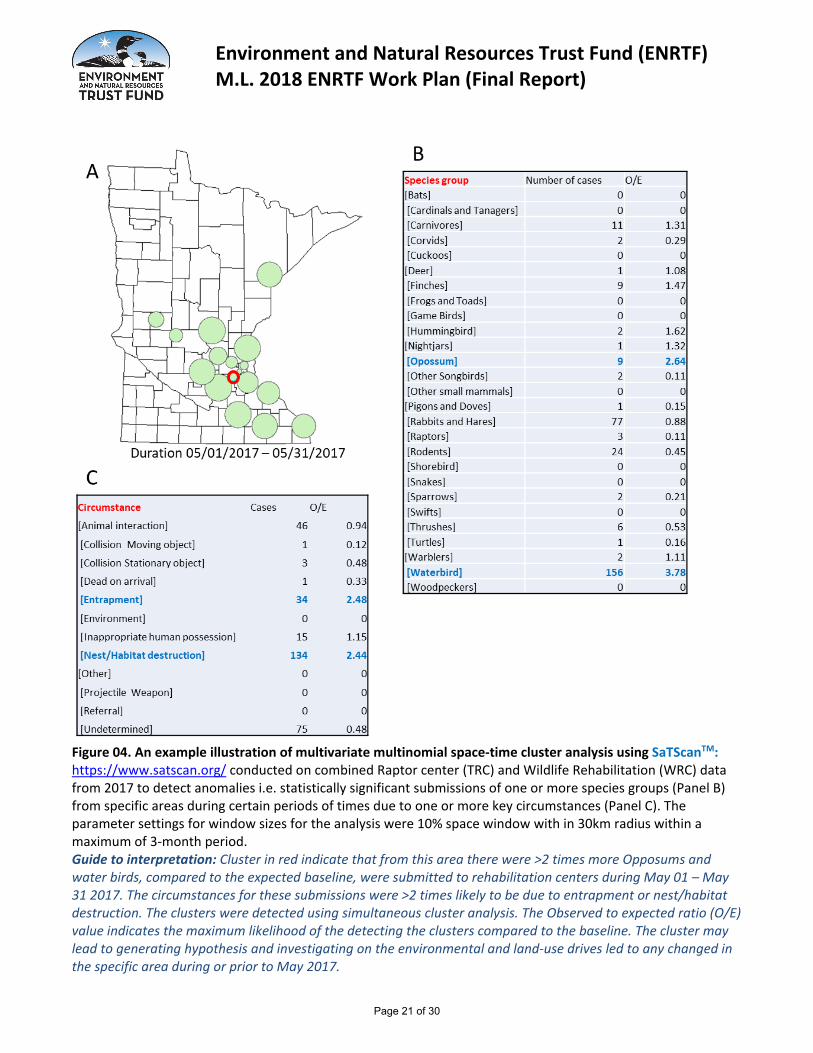
Figure 04. An example illustration of multivariate multinomial space-time cluster analysis using SaTScanTM: https://www.satscan.org/ conducted on combined Raptor center (TRC) and Wildlife Rehabilitation (WRC) data from 2017 to detect anomalies i.e. statistically significant submissions of one or more species groups (Panel B) from specific areas during certain periods of times due to one or more key circumstances (Panel C). The parameter settings for window sizes for the analysis were 10% space window with in 30km radius within a maximum of 3-month period. Guide to interpretation: Cluster in red indicate that from this area there were >2 times more Opposums and water birds, compared to the expected baseline, were submitted to rehabilitation centers during May 01 – May 31 2017. The circumstances for these submissions were >2 times likely to be due to entrapment or nest/habitat destruction. The clusters were detected using simultaneous cluster analysis. The Observed to expected ratio (O/E) value indicates the maximum likelihood of the detecting the clusters compared to the baseline. The cluster may lead to generating hypothesis and investigating on the environmental and land-use drives led to any changed in the specific area during or prior to May 2017.
Page 21 of 30

20
Appendix 2 (Third Update January 31, 2020)
Figure 01. The number of submissions for a given period. The dotted lines represent the average across years i.e. an estimate of the expected number of submissions.
Page 22 of 30

21
Figure 02. An example illustration of multinomial space-time cluster analysis using SaTScanTM: https://www.satscan.org/ conducted on Raptor center (TRC) data from 2013 through 2018 to detect anomalies i.e. statistically significant submissions of raptors from specific areas during certain periods of times. The parameter settings for window sizes for the analysis were 10% space and 10% time. Guide to interpretation: Cluster in black indicate that from this area there were 7 times more American kestrels, 3 times more Bold-winged hawks, and 2 times more Cooper’s hawks were submitted to TRC during May-September 2015 compared to the expected baseline.
Page 23 of 30

Environment and Natural Resources Trust Fund (ENRTF) M.L. 2018 ENRTF Work Plan (Final Report)
Figure 03. Preliminary data illustrations on West Nile virus (WNV): Panel A: The number of WNV tested avian species by county from both raptor center (TRC) and Wildlife rehabilitation center (WRC) during 2002 through 2018 (regardless of WNV status), and Panel B. mosquito species tested for WNV from Minnesota Mosquito Control District (MMCD) during 2009 through 2019.
Page 24 of 30

Environment and Natural Resources Trust Fund (ENRTF) M.L. 2018 ENRTF Work Plan (Final Report)
Appendix 1 (Second Update June 30, 2019)
Figure 1. Comparison of all avian submissions to TRC and WRC over the period of 2013 through 2018. Each unique case ID was accounted when generating above graphs regardless of the litter/group the submissions.
Page 25 of 30

24
Figure 2. Illustration of the timeseries data and model fits for two selected species submitted to TRC over the 6-year period.
Page 26 of 30

Environment and Natural Resources Trust Fund (ENRTF) M.L. 2018 ENRTF Work Plan (Final Report)
Figure 3. Illustration of timeseries plots and model fits for TRC data by animal groups of WRC. Graphs from left to right on each row represents 1) weekly submissions over the 6-year period; 2) weekly submissions collapsed by years; 3) timeseries model fits (without accounting for the seasonality. The time units are in weeks over the 6-year period).
Page 27 of 30

Environment and Natural Resources Trust Fund (ENRTF) M.L. 2018 ENRTF Work Plan (Final Report)
Figure 4. An example Illustration of the timeseries models fits (in purple) that may support anomaly detection after accounting for the seasonality of submissions, compared to the model fits which (in red and green lines) does not account for the seasonality.
Page 28 of 30

27
Figure 5. Illustrations of “Mock-ups”, i.e. simply an example of the web interface that would be developed to be used by both TRC and WRC for visualization of the descriptive and analytical outputs. The panels represent: A) Front/log-in page, B) First page of the descriptive and analytical options, C) Analytical outputs of timeseries data, and D) geographical maps and spatial analysis outputs.
Page 29 of 30

Attachment A:Environment and Natural Resources Trust FundM.L. 2018 Budget Spreadsheet
Project Title: Develop a System to Assess Wildlife Health Threats in Minnesota Legal Citation: M.L. 2018, Chp. 214, Art. 4, Sec. 02, Subd. 03fProject Manager: Kimberly VanderWaalOrganization: University of MinnesotaCollege/Department/Division: Department of Veterinary Population MedicineM.L. 2018 ENRTF Appropriation: $280,000Project Length and Completion Date: 2 years; June, 30 2020Date of Report: as of re budget request 4 27 20
ENVIRONMENT AND NATURAL RESOURCES TRUST FUND BUDGET BudgetRevised Budget
(04-27-2020) Amount Spent BalanceBUDGET ITEMPersonnel (Wages and Benefits) $170,813 $170,813 $170,813 $0TBD: Post-doc/grad student - 1 FTE, 2 yrs, total: $116,425 (82%- salary, 18% benefits)VanderWaal: Project manager - 15% FTE, 2 yrs, total: $45,305(75% salary, 25% fringe)TBD: TRC technician - 200hours each Y1 and Y2, total: $8,327 (78% salary, 21% fringe)Professional/Technical/Service Contracts $107,000 $109,187 $109,187 $0A consultant (Company: Epi-Interactive) will be paid to develop the on-line platform and tools required for the surveillance and alert systems. $83,000The Wildlife Rehabilitation Center- Professional/technical service contaract (205 hours@120/hr).Total $24,600Equipment/Tools/Supplies $487 $0 $0 $0Office supplies and incidentalsTravel expenses in Minnesota $1,700 $0 $0 $0Travel within MN to for meetings with wildlife health professionals$1,800 per U of M reimbursement planCOLUMN TOTAL $280,000 $280,000 $280,000 $0
Page 30 of 30