project title: brassicas: further development of a spray
TRANSCRIPT

©2005 Horticultural Development Council
Project title: Brassicas: Further development of a spray-timing model for white blister (Albugo candida) in vegetable brassica crops within the Brassicaspot system Project number: FV 53e Project leader: Dr Roy Kennedy Year of project: Final Date of report: 30.06.2005 Locations: Horticulture Research International, Wellesbourne Growers’ holdings in Lincolnshire and Lancashire Coordinator: Richard Mowbray Project commenced: 01.06.03 Completion: 31.05.05 Key words: white blister, Albugo candida, sporulation models, prediction, disease
control, brassica, disease, Brussels sprouts, cabbage, cauliflower, calabrese, broccoli, fungicide.
Whilst reports issued under the auspices of the HDC are prepared from the best available information, neither the authors nor the HDC can accept any responsibility for inaccuracy of liability for loss, damage or injury from the
application of any concept or procedure discussed.
The contents of this publication are strictly private to HDC members. No part of this publication may be copied or reproduced in any form or by any means without prior written permission of the Horticultural Development
Council.

©2005 Horticultural Development Council
The results and conclusions in this report are based on an investigation conducted over one year. The conditions under which the experiment was carried out and the results obtained have been reported with detail and accuracy. However, because of the biological nature of the work it must be borne in mind that different circumstances and conditions could produce different results. Therefore, care must be taken with interpretation of the results especially if they are used as the basis for commercial product recommendations.

©2005 Horticultural Development Council
CONTENTS PAGE Page 1. GROWER SUMMARY 1 1.1 Headline 1 1.2 Background and expected deliverables 1
1.3 Summary of year one and two work on FV53e 2 1.3.1 Development of the white blister spray timing model 2 1.3.2 Testing the white blister spray timing model in the field 3 1.4 Action points for growers 4 1.5 Anticipated practical and financial benefits 4 SCIENCE SECTION 2. INTRODUCTION 5 2.1 Biology of Albugo candida (white blister) on brassicas 5 2.2 Control of white blister and other Brassica leaf spot pathogens 6 2.3 Environmental factors favouring white blister on vegetable brassicas 6 2.4 Forecasting Foliar diseases of Brassicas (Brassicaspot collection of models within MORPH) 6 2.5 Additional models required within the Brassicaspot system (within MORPH) 7 3. SUMMARY OF YEAR ONE RESULTS 8
3.1 Models describing the effect of temperature on white blister development 8 3.1.1 Effect of temperature on white blister symptom appearance (infected area) 8 3.1.2 Effect of temperature on white blister symptom appearance (Lesion number) 9 3.1.3 Conclusions 9 3.2 Models describing the effect of temperature on white blister development 10 3.2.1 Fitting the models 10 3.2.2 Conclusions 14 3.3 Models describing the effect of temperature on rate of white blister symptom development 14 3.3.1 Effect of temperature on time to symptom development 14 3.3.2 Conclusions 15 3.4 Validation of the white blister symptom development model using 2004 field data 16 3.4.1 Material and Methods 16 3.4.1.1 Plant production 16 3.4.1.2 Collection of white blister field inoculum 16 3.4.1.3 Plant inoculation 16 3.4.1.4 Disease assessment 16 3.4.1.5 Programming the model 17 3.4.1.6 Collection of environmental data in the field 17 3.4.1.7 Testing the model 17 3.4.2 Results 17

©2005 Horticultural Development Council
3.4.2.1 Initial comparisons of the effect of temperature on time to observed and expected white blister symptom appearance 17 3.4.3 Conclusions 19 4. RESULTS (YEAR TWO) 20
4.1 Description of the white blister symptom development model (white blister II within MORPH 4) 20 4.1.1 Programming the white blister symptom development model within MORPH 20 4.1.2 Crop Walk Model 20 4.1.3 Time to symptom appearance models 21 4.2 Testing the White blister II symptom development model (Time to 5% and 50% lesion appearance) 22 4.2.1 Comparison of MORPH (white blister II) and Microsoft visual basic white blister symptom development models using 2004 field data 22 4.2.1.1 Methods and Results 22 4.2.1.2 Results 23 4.2.1.3 Conclusions 27 4.2.2 Validation of the white blister symptom development model using 2005 field data 28 4.2.2.1 Materials and Methods 28
4.2.2.2 Results 29 4.2.2.3 Conclusions 33 5. DISCUSSION 34 5.1 Use of mathematical models within disease management systems 34 5.2 Models forecasting white blister disease occurrence and development in vegetable Brassica crops 34 5.3 Testing the white blister symptom development models programmed in different computing languages 35 5.4 Testing the white blister symptom development model on different vegetable Brassica types 36 5.5 Practical usage of the white blister II prediction system within Brassicaspot 36 5.6 Further disease forecasting criteria for foliar diseases of vegetable brassica crops 37 6. REFERENCES 38

©2005 Horticultural Development Council Page 1
1. GROWER SUMMARY
1.1 Headline A new spray timing disease forecasting model for the white blister pathogen on vegetable brassicas has been successfully tested and programmed within the MORPH system. The grower can use the system to improve the efficiency of protectant fungicides for white blister control. 1.2 Background and expected deliverables Albugo candida (white blister) is one of the three major diseases of vegetable brassicas in the U.K. It has a widespread distribution covering all vegetable brassica production areas. White blister like many leaf spot pathogens has specific requirements for its development in vegetable brassica crops. The occurrence of favourable environmental conditions can be used to predict infection but often these over estimate the real risk of disease establishment in crops. Like many other leaf spot pathogens white blister has a long latent / incubation period (time between infection and appearance of disease in the crop). This means that success or failure of control is only apparent in some cases weeks after fungicide applications. Often this leads to diseases becoming well established in crops before the disease is really visible. White blister symptoms first appear as yellow spots on leaves and these eventually become white in colour. White blister is more severe in young immature tissue and this is the reason that on some older leaves the white lesions are not readily formed. On immature tissues heavy infection can result in the systemic growth of the pathogen in the plant. The maturity of the tissue also affects the time between infection and symptom appearance. Disease forecasting systems are now being widely used to help growers control diseases in vegetable brassicas (especially long season crops such as Brussels sprouts). Disease forecasting models for other diseases of vegetable brassicas are available however there is limited useful information relating to white blister in this respect. New models predicting white blister development are available however they must be programmed (in appropriate computer language) and tested for their accuracy before they can be used. The expected deliverables from this project are: • An evaluation of the accuracy of a disease forecasting model for use in timing sprays to
control white blister in vegetable brassica crops. • Information on the development time for white blister in vegetable brassica crops and the
effect of maturity on time to symptom development.

©2005 Horticultural Development Council Page 2
• The white blister model programmed within the Brassicaspot disease forecasting suite of models (within MORPH).
Further development and testing of the system would be required by growers to adapt the information to their own growing systems. 1.3 Summary of year one and two work on FV53e 1.3.1 Development of the white blister spray timing model One of the key life cycle stages controlling white blister development in vegetable brassica crops is the time between infection and symptom appearance. By predicting the duration of this time period effective sprays can be predicted which will protect the crop against further infection by the white blister pathogen. The effect of temperature on time to symptom appearance by white blister was investigated under controlled environmental conditions within MAFF project HH1713SFV. The results were used to construct models summarizing the effect of temperature on white blister development (Figure 1).
0
10
20
30
40
50
60
70
0 5 10 15 20 25 30 35
Temperature (C)
Tim
e to
5 a
nd 5
0 %
App
eara
nce
(Day
s)
NO SYMPTO M APPEARANCE
SYMPTO M APPEARANCE
Figure 1. The effect of temperature on number of days to rate of 5 % (■) and 50 % (■) white blister symptom development.

©2005 Horticultural Development Council Page 3
1.3.2 Testing the white blister spray timing model in the field The white blister symptom development model was programmed using Microsoft visual basic and in computer programme language C compiled in C++
(as used in the Brassicaspot programme within MORPH). It was then used in field tests to determine its accuracy in predicting symptom development on inoculated plants. Sample output of the model programmed in MORPH is shown in Figure 2. Temperature data was collected from the field and used in conjunction with the model to predict the rate of white blister symptom development under field conditions. Tests were only carried out with Brussels sprout plants cv. Golfer in 2004. The results of tests indicate that the predicted time to 50 % symptom development was a good measure of the time to first observed symptom development in the field. In contrast the time to 5 % symptom appearance was not a good measure of time to symptom development in the field. Tests also demonstrated that the model programmed within C (MORPH) was more accurate than the model programmed within Microsoft Visual Basic. Field tests demonstrated a very close significant relationship between time to first observed symptom and expected time to 50 % symptom development as calculated using the new white blister model for cultivar Adonis (Brussels sprouts), cv. Rodon (Red cabbage), cv. Shogun (Broccoli), cv. Belot (cauliflower) and Tarvoy (Savoy cabbage).
Figure 2 Sample output from the MORPH white blister II model

©2005 Horticultural Development Council Page 4
This indicates that the white blister symptom development model could be used to estimate time to symptom development for a broad range of vegetable Brassica types grown in the U.K. 1.4 Action points for growers Using temperature data collected from the field the grower will be able to predict the rate of white blister development in his crop. • Growers can use the Brassicaspot system to determine when white blister infection has
occurred in the field. • By linking information on white blister infection with the white blister spray timing model
the grower will be able to predict when symptoms will appear. • Using forecasts of mean temperatures growers can determine when sprays should be
applied. • White blister forecasts can be applied by growers to all major vegetable Brassica types
grown in the U.K. 1.5 Anticipated practical and financial benefits • Optimal timings for white blister spray applications can be determined reducing the
number of sprays necessary for white blister control in any crop. • The usage of the model will improve the efficiency of the fungicide which will mean that
sprays with a protectant action will be effective in combating white blister. • There will be less need for and reliance on metalaxyl based fungicides which should
reduce the costs associated with white blister control in vegetable brassica crops. • By using the white blister spray model in conjunction with others predicting dark leaf
spot and ringspot growers will be better able to schedule fungicide applications to crops more effectively to produce cost savings.

©2005 Horticultural Development Council Page 5
2. INTRODUCTION 2.1 Biology of Albugo candida (white blister) on brassicas White blister (Albugo candida) is a member of the Peronosporales and not a true fungus. It is related to the downy mildews which are found extensively on many agricultural crops. White blister attacks at least 29 genera of crucifers (Brassicaceae) including major vegetable brassica types, common weeds and native species (Jacobson et al., 1998). At least seventeen races of the organism have been accepted (Pound & Williams, 1963, Verma et al., 1975, Gupta & Saharan, 2002). Race 9 has been designated as occurring on Brussels sprouts, Broccoli and Cauliflower ((Hill et al., 1988, Williams, 1985). The white blister pustules are comprised of sporangia which erupt under the epidermis of the plant tissue. Pustules are commonly found on any plant organ (leaves, stems, or flowers) however they do appear more frequently on immature tissues. Sporangia produce the infective stage of the organism called a zoospore. The zoospore has a flagella which enables it to be motile in water. It is extremely sensitive to drying and for this reason it is only dispersed by water. Infection of seedlings by white blister occurs over a temperature range of 6 - 24 oC although small amounts of infection also occur at 26 oC . At optimal temperatures of 16 – 24 oC only 3 – 4 h of leaf wetness was required for infection to occur. Temperatures above 24 oC restrict infection and spore production but these conditions are rarely found under field conditions. Infection at temperatures below 6 oC was not observed after 48 h wetness duration. However the effect of longer wetness durations at these temperatures has not been investigated. Sexual reproduction usually occurs in systemically infected tissues. If symptoms occur on inflorescences or very immature tissues they can result in distortion, a symptom which is often referred to as stagshead. Stagshead can result in significant yield loss in seeding crops and on Brussels sprout buttons. The distortion makes the Brussels sprout button un-saleable but the occurrence on leaf tissues also affects marketability. Oospore formation may occur on inflorescences or on tissues showing stagshead symptoms. Oospores can germinate directly on the plant by germ tube formation or by zoospore release. It is common for white blister to form systemic asymptomatic infections that are not visible for long periods of time. This period between infection and symptom appear may vary for different vegetable brassica types and for different tissue types (mature or immature). This period can be as long as 3 – 4 weeks at temperatures of 10 oC. However symptoms of white blister are usually only common on immature plant tissue. Once tissues are mature they do not appear to be susceptible to white blister infection.

©2005 Horticultural Development Council Page 6
2.2 Control of white blister and other Brassica leaf spot pathogens Applications of fungicides to the crop to control white blister and other fungal diseases in Brassica crops are not straight forward even though the products used are very effective. However with increasing restrictions on the amount of each fungicide that can be applied to crops it is important that fungicide usage is properly targeted. White blister belongs to a group of pathogens that are not generally susceptible to azole fungicides (Difenconazole and Tebuconazole). For this reason white blister requires sprays with other types of fungicides which have different modes to action in comparison to azole fungicides. Recently BASF has produced a new product (Boscalid + pyraclostrobin) which has efficacy against dark leaf spot (Alternaria brassicae and Alternaria brassicicola), ringspot (Mycosphaerella brassicicola) and white blister. These are the three most important fungal diseases affecting vegetable brassica crops. More information on risk periods associated with white blister development would aid the proper targeting of fungicide applications against this pathogen. 2.3 Environmental factors favouring white blister on vegetable brassicas White blister like other pathogens of vegetable brassicas requires free water for zoospore release, germination and infection (Kennedy & Graham, 1995). Once the disease is established relatively short dewfall periods can be very favourable for white blister development. High temperatures result in relatively short periods of time elapsing between infection and symptom appearance on the plant. This is dependant on the temperature under which the plants are grown. Mathematical relationships (models) describing the effect of temperature and wetness on important life-cycle stages have been developed by Warwick HRI. These can be used directly by the grower to provide further information on the occurrence of these critical stages in the crop. These models have been validated for use within commercial crops within HDC project FV53d. 2.4 Forecasting Foliar diseases of Vegetable Brassicas (Brassicaspot collection of
models within MORPH) Infection and sporulation models have been programmed within the Brassicaspot system which comprises of models covering ringspot (Mycosphaerella brassicicola) dark leaf spot (Alternaria brassicae) and white blister (Albugo candida) as follows: a) Dark leaf spot/ringspot infection criteria (Crop walking output) b) Dark leaf spot disease development criteria (Spray timing output) c) Ringspot sporulation criteria (Spray timing output) d) White blister infection criteria (Crop walking output)

©2005 Horticultural Development Council Page 7
The system is now widely used to identify periods when there was increased risk of disease development within vegetable Brassica crops. Weather information collected from within the crop can be used to determine the likelihood of disease occurrence or the need for fungicide applications if target diseases are present. For example the sporulation models can be used to determine when fungicides must be applied to crops to control disease. These are more useful in long season crops such as Brussels sprouts. Infection models can be used to inform users of the risk of disease occurrence. They can also be used to determine when eradicant fungicides should be applied to crops. Infection models have been found to be more useful for disease control in short season crops such as summer and autumn cauliflowers. The database within which the forecast models work is called MORPH. MORPH can be used to store weather data which is down loaded on to the same PC using Global Systems for mobile communication (GSM) and radio off-loading. The MORPH system is currently being upgraded within a recently commenced DEFRA project 2.5 Additional models required within the Brassicaspot system (within MORPH) At present the Brassicaspot system does not contain any information relating to sporulation by white blister. This is an important deficiency in the system as separate applications of fungicide are required to control this pathogen in vegetable brassica crops. However the usage of new products (Boscalid + pyraclostrobin) may mean that unified forecasts for dark leaf spot, ringspot and white blister would be advantageous. At present the white blister disease warning model can be used for white blister control however this is not optimal. In many instances, over spraying of crops results from using this information particularly in long season crops where the numbers of spray applications are limited. Over usage of metalaxyl based fungicides has also the potential to cause increased risks of fungicide resistant strains of the white blister pathogen. This has been noted in other crops notably onions where the equivalent pathogen type in onion crops (downy mildew) became more tolerant to fungicide sprays containing metalaxyl.

©2005 Horticultural Development Council Page 8
3. SUMMARY OF YEAR ONE RESULTS Programming and testing accurate white blister symptom development models which work as part of the Brassicaspot system (within MORPH) formed most of the year one work (summarised below). 3.1 Models describing the effect of temperature on white blister development 3.1.1 Effect of temperature on white blister symptom appearance (infected area) The results of one controlled environment experiment investigating the effect of temperature on the appearance of white blister infected leaf tissue is shown in Figure 3.
0
100
200
300
400
500
600
700
800
900
0 5 10 15 20
Days post inoculation
Infe
cted
are
a (c
m2)
Figure 3. The effect of temperature on the appearance of white blister infected leaf tissue at 24 Co (■ ), 20 Co (▲ ), 16 Co (♦), 12 Co (♦), 8 Co (■), 4 Co (▲ ). There was no symptom development at either 4 or 8 ˚C over the 17 day period that plants were placed under these constant temperature conditions. At 12 ˚C symptoms appeared after 10 days however the infected area developed slowly and after 17 days only 300 cm 2 of the total plant area was showing white blister symptoms. At 16 ˚C white blister symptoms appeared on the first plants after approximately 4 days and the area infected increased more rapidly to a maximum of 670 cm 2 of the total plant area inoculated. However symptom development at 20 and 24 ̊ C was very rapid and not significantly different from each other. Symptoms were observed on these treatments after approximately 2 days. White blister infected areas increased

©2005 Horticultural Development Council Page 9
rapidly in both treatments to reach a maximum of 670 – 750 cm 2 of the total plant area inoculated after 7 days at each temperature (Figure 3). 3.1.2 Effect of temperature on white blister symptom appearance (Lesion number) The results of controlled environment experiment investigating the effect of temperature on the appearance of white blister lesions on leaves is shown in Figure 4 (one experiment shown).
0
10
20
30
40
50
60
0 5 10 15 20Days post inoculation
Lesi
on N
umbe
r
Figure 4. The effect of temperature on the appearance of white blister infected leaf tissue at 24 Co (■ ), 20 Co (▲ ), 16 Co (♦), 12 Co (♦), 8 Co (■), 4 Co (▲ ). The results were similar to that shown for the effect of temperature on the appearance of white blister infected leaf tissue. Lesion numbers increased more rapidly after inoculation at temperatures of 20 and 24 ˚C after 5 days. Appearance of lesions was much slower at temperatures of 16 and 12 ˚C with maximum numbers of lesions visible after approximately 15 days. There appeared to be lower numbers of lesions visible at these temperatures in comparison to temperatures of 20 and 24 Co (Figure 4). No lesions were visible at either 8 or 4 Co. 3.1.3 Conclusions
• White blister symptoms do not develop at temperatures below 8 ˚C.
• The optimal temperature for symptom development was 20 ˚C and above.

©2005 Horticultural Development Council Page 10
• White blister epidemics are not favoured by low daily average temperatures as there was insufficient time for white blister symptom development on leaves before they senesce.
• Initial infection of transplants by white blister may be necessary for severe epidemic development in some growing areas with lower mean daily temperatures.
3.2 Models describing the effect of temperature on white blister development 3.2.1 Fitting the models Curve fitting procedures were based on data from 12̊C, 16˚C, 20˚C and 24˚C and 2 to 17 days. Separate fits were made for each temperature. At 16˚C, 20˚C and 24˚C the probit model based on rates of symptom appearance were an extremely good fit. At 12˚C a statistical test showed that the fit was rather poor but visually the fit appeared good and the apparent lack of fit was due to very low lesion numbers up to 10 days after inoculation. To build a forecasting model it was necessary to derive a relationship between the parameters of the frequency distribution and temperature. The probit model implies that the rates followed a normal distribution and so the mean rate was equal to the t50 and could be related to temperature as is standard practice. The relationship was almost linear over the 12-24 ˚C temperature range but an exponential curve was needed to better describe the lower temperatures. The standard deviation was linearly related to the mean giving rise to a constant coefficient of variation at all temperatures. This is an extremely useful property for building forecasting models. To produce robust parameter estimates, data from all temperatures between 12-24 ˚C were combined and the entire model, i.e., the frequency distributions and the temperature data, was fitted. The final model developed was:
((1/ ) / )
TR brs cRf m t R s
=== Φ −
where R and s are the mean and standard deviation of the rates at temperature T , m is the maximum number of lesions, Φ is the cumulative normal distribution and f is the
cumulative number of lesions at time t . The fit of the model is shown in Figure 5.

©2005 Horticultural Development Council Page 11
Data were also collected on the infected area (A) of each leaf. These data were closely related to lesion numbers (L) and the following equation accounted for 98.2% of the variation in the logarithms of the infected areas. log( ) 1.2602 1.23313log( )A L= +

©2005 Horticultural Development Council Page 12
20°C
16°C
4°C
12°C
24°C
8°C
Time (days)
Time (days)5
0204060
120
8080100
40
120
020100
Time (days)
120
80
40
02020 1015 01050
Time (days)
120
80
40
0
0 10 20
120100
806040
60
20
150
20
15
100
20
5
201510
100
5
20
0
5
Time (days)
20
10
15
120
60
100
15
806040
60
20
00
Time (days)
100
5
Mean
numb
er of
lesio
ns pe
r plan
t
Mean
numb
er of
lesio
ns pe
r plan
t
Figure 5. Model fit for the effect of temperature on mean number of white blister lesions per plant.

©2005 Horticultural Development Council Page 13
Using this relationship the model developed for lesion numbers was applied to infected areas. The fit of the model is shown in Figure 6.
20°C
4°C
16°C12°C
24°C
8°C
Time (days)
Time (days)
0200400600800
12001000
800
1200
400
020100
1200
800
400
02015105 200 10
Time (days)0
1000
600
200
Time (days)
1200
5
1000
15
800600400
20
2000
600
100
15
Time (days)
600
205 1510
15
50
Time (days)
1200
400
0 20
1000
5
1200
200
1000800600
800
400
10
2000
15
1000
50
200
Area
infec
ted (s
q mm)
Ar
ea in
fected
(sq m
m)
Figure 6. Model fit for the effect of temperature on white blister infected leaf area.
©2005 Horticultural Development Council Page 14
3.2.2 Conclusions
• There was a good model fit to the controlled environment data over the temperature range 12 – 24 ˚C.
• There was some difference between models based on infected area and those based on white blister lesion number.
• White blister symptom expression is affected by tissue age in that young tissues are more susceptible to infection than older tissues. This will have an impact on the use of the model at different stages in the season.
3.3 Models describing the effect of temperature on rate of white blister symptom
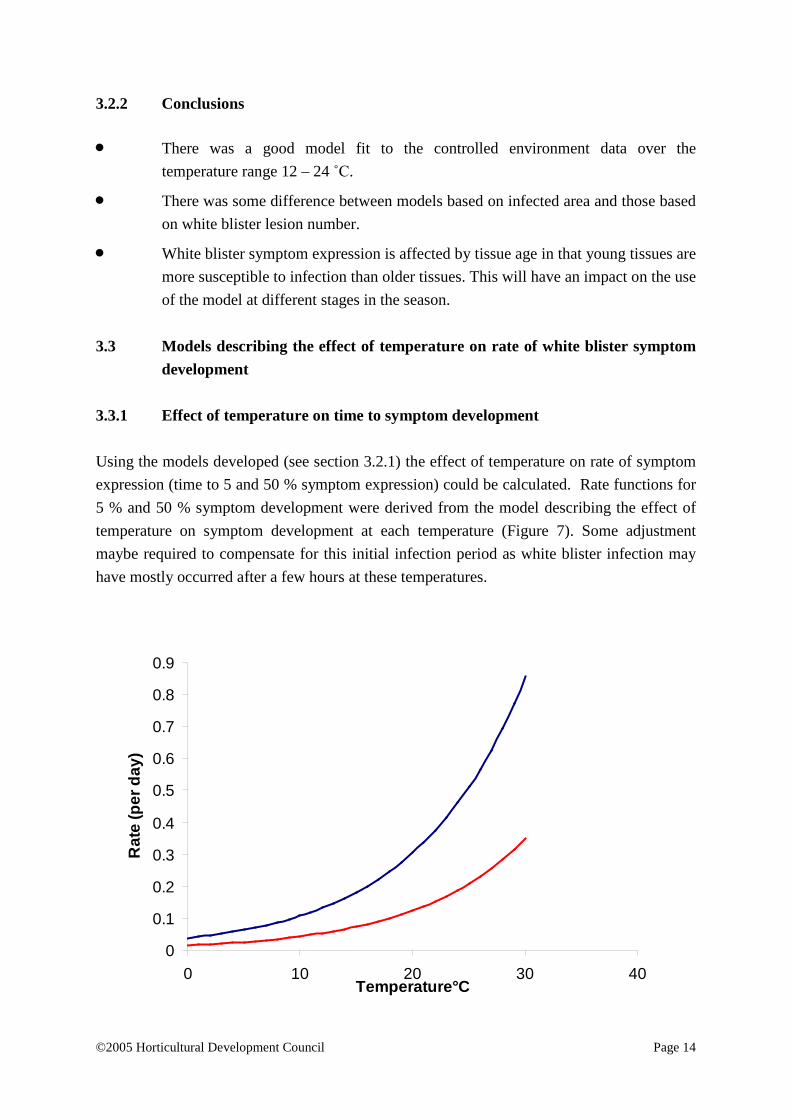
development 3.3.1 Effect of temperature on time to symptom development Using the models developed (see section 3.2.1) the effect of temperature on rate of symptom expression (time to 5 and 50 % symptom expression) could be calculated. Rate functions for 5 % and 50 % symptom development were derived from the model describing the effect of temperature on symptom development at each temperature (Figure 7). Some adjustment maybe required to compensate for this initial infection period as white blister infection may have mostly occurred after a few hours at these temperatures.
0
0.1
0.2
0.3
0.4
0.5
0.6
0.7
0.8
0.9
0 10 20 30 40Temperature°C
Rat
e (p
er d
ay)

©2005 Horticultural Development Council Page 15
Figure 7. The effect of temperature on rate of 5 % (■) and 50 % (■) white blister symptom development. The effect of temperature on time to 5 % white blister symptom development is shown in Figure 8. This analysis shows that at 4 ˚C the predicted time to 5 % symptom development was 18 days. However in controlled environment studies no symptom development occurred at 4 ˚C indicating that some adjustments may be required to the model at these temperatures. Time to 5 % white blister symptom development was approximately 12 and 9 days at 8 and 12 ˚C respectively. Relatively rapid symptom development was predicted at 16, 20 and 24 ˚C of 6, 4 and 3 days respectively (Figure 8).
0
10
20
30
40
50
60
70
0 5 10 15 20 25 30 35
Temperature (C)
Tim
e to
5 a
nd 5
0 %
App
eara
nce
(Day
s)
NO SYMPTO M APPEARANCE
SYMPTO M APPEARANCE
Figure 8. The effect of temperature on the time (days) to 5 % (■) and 50 % (■) white blister symptom. 3.3.2 Conclusions
• Expected time to white blister symptom appearance was accurate on data derived from controlled environments.

©2005 Horticultural Development Council Page 16
• Time to symptom appearance at 4 and 8 ˚C was over estimated using the model. This part of the model may need further refinement using additional data sets collected from the field.
3.4 Validation of the white blister symptom development model using
2004 field data 3.4.1 Materials and Methods 3.4.1.1 Plant production Brussels sprouts cv. Golfer were grown in FP11 pots in 70:30 Fisons F2 compost (one seedling per pot). Plants were grown in a 16/14 C day/night temperature regime. Plants were grown until the 7 true leaf stage at which point they were used within the experimental regime. Sequential sowings of plants ensured that all plants used in the experiment were at approximately the same growth stage. 3.4.1.2 Collection of white blister field inoculum At routine intervals plants were inoculated using inoculum collected from a heavily infected seeding field plot of Brussels sprouts cv. Golfer. Infected florets of seedling plants displaying stagshead symptoms of white blister were removed and placed in 200 mls of sterile distilled water. After shaking the infected florets were removed from the suspension which contained large numbers of zoosporangia. The suspension was placed at 5 C for approximately 7 hours after which time it was checked for the presence of motile zoospores (the infective stage of white blister). The concentration of the inoculum was measured using a haemocytometer. 3.4.1.3 Plant inoculation Brussels sprout plants cv. Golfer were inoculated with a white blister zoospore suspension. Plants were sprayed with a 0.05 % aqueous suspension of Tween 20 prior to inoculation. At each inoculation time approximately 6 – 8 plants (at the 6 – 8 true leaf stage) were inoculated with 70 mls of a white blister zoospore suspension. Plants were then placed in a misting chamber for 48 H before being placed outside under field conditions. Plants were routinely monitored and disease symptoms recorded when observed. 3.4.1.4 Disease assessment The number of lesions on each leaf of each plant was recorded for each inoculation date at each assessment time. Disease assessments were taken at regular intervals after each inoculation period. The number of lesions on leaves of each plant were assessed after first symptoms had appeared.

©2005 Horticultural Development Council Page 17
3.4.1.5 Programming the model The model was programmed in C and also within Microsoft Excel (Visual basic) so that weather data for testing the model tests could be used to determine the time to symptom appearance. The relationships for time to 5 and 50 % symptom development were programmed. Temperature data recorded at 30 min intervals were utilised in these tests. The model programmed within excel (Microsoft visual basic) was used for initial comparisons and for checking the validation of the model results. Further adjustments were made to the programmed model on the basis of these results from the excel spreadsheet. 3.4.1.6 Collection of environmental data in the field The air temperature was recorded at 30 min intervals at the point of exposure of inoculated plants in the field. The temperature was recorded using a Smartlog meteorological monitoring station (Aardware Design, Walton on Thames). The temperature data was downloaded daily using a GSM phone link and used for comparisons of observed and expected (using the model) symptom development. 3.4.1.7 Testing the model The programmed model (in Microsoft Excel) was used to determine the time to symptom development under field conditions. Test plants which had been inoculated and placed in the field were used in these tests (Brussels sprouts cv. Golfer only). The temperature data from the field was used in conjunction with the rate (Figure 7) which was accumulated to reach a value of 1 at which point symptoms were predicted as having occurred in the field (expected symptom appearance). The time to observed symptom appearance was plotted against expected symptom appearance (in days) and a regression function (r2 value) calculated for the fit of the relationship between the two. The closer the r2 value to 1 the better the fit between observed and predicted symptom development. It was assumed that plants became infected immediately after inoculation. 3.4.2 Results 3.4.2.1 Initial comparisons of the effect of temperature on time to observed and expected
white blister symptom appearance The relationship between time to first observed and 50 % expected symptom development is shown in Figure 9. The relationship between time to 5 % observed and 5 % expected symptom development is shown in Figure 10. There was a very good relationship between time to first observed symptom development and expected time to 50 % symptom development according to the white blister symptom development model (r2 = 0.9478). There was a poorer relationship between time to first observed symptom development and expected time to 5 % symptom development according to the white blister symptom development model (r2 = 0.3729). Tests were conducted on plants which were at the same stage in development.

©2005 Horticultural Development Council Page 18
R2 = 0.9478
0
5
10
15
20
25
0 5 10 15 20
Days to symptom Appearance (Observed)
Day
s to
50
% s
ympt
om a
ppea
ranc
e (E
xpec
ted)
Figure 9. Days to first observed and 50% expected symptom development.
R2 = 0.3729
0
2
4
6
8
10
12
0 5 10 15 20
Days to symptom Appearance (Observed)
Day
s to
5 %
sym
ptom
App
eara
nce
(Exp
ecte
d)
Figure 10. Days to first observed and 5% expected symptom development.

©2005 Horticultural Development Council Page 19
3.4.3 Conclusions
• Time to 50 % symptom development was a good measure of the time to first observed symptom development in the field.
• Further tests are required where the white blister infection model is used to determine the point of plant infection.
• The white blister symptom development model should be tested on plants of differing maturity.

©2005 Horticultural Development Council Page 20
4. Results (Year two) 4.1 Description of the white blister symptom development model (white blister II
within MORPH 4) 4.1.1 Programming the white blister symptom development model within MORPH The software model was developed using MORPH standards so that it is fully integrated into the MORPH framework. This allows the model to benefit from all of the features of the MORPH software, such as farm, field and weather data information storage and sharing to reduce data input. The integration of the model into the MORPH framework also means that it benefits from the graphical output which can either be in a HTML format or in a MORPH report file format. There are three models within the software model WhiteBlister II, one infection model (daily risk based on favourable environmental conditions) and two symptom development models. Both symptom development models use temperature only (measurements taken from the field). Time to symptom development is predicted as different measures in the symptomology of white blister in vegetable Brassica crops. One model predicts the time to 5 % and 50 % lesion number on crops. The second model predicts the time to 5 % and 50 % area of crop infected with white blister. Theoretically the measures could be used to estimate other aspects in the epidemiology of white blister on vegetable Brassica crops (e.g. plant resistance). 4.1.2 Crop Walk Model The crop walk model estimates the risk of white blister infection in the field based on “in field” weather estimates. The crop walk model is usually started from the date of planting. For the results to be applicable, weather data will be needed for periods from planting. The model predicts days when the weather conditions favour infection. Each day is categorised in terms of risk of white blister infection. Infection can only occur if there are periods of leaf surface wetness. The risk of infection is therefore based on the duration of leaf surface wetness and the corresponding temperature during these periods. Daily infection risk can be estimated and graphically plotted on a chart. Using this model can identify potential risk days for white blister infection. On the basis of this information decisions can be made about when crops will become infected and which crops are likely to be infected. Practical usage of the model will result in decisions about which crops should be checked for white blister presence.

©2005 Horticultural Development Council Page 21
Figure 11 White blister infection model output The colours of the bars indicate the risk of infection on each day. The red bars indicate a high risk, the yellow bars a moderate risk, and the green bars no risk (Figure 11). 4.1.3 Time to symptom appearance models Time to symptom appearance models work, once an infection event has been recorded using the crop walk model.
Figure 12 White blister symptom appearance model (Time to lesion appearance) The turquoise and marine coloured lines indicate the disease index for a particular day, for 5% and 50% expected symptom development respectively (Figure 12). The red arrow indicates the first occurrence of when the threshold is reached and symptoms are visible. This can be used as a guide to spray timing.
Figure 13 White blister symptom appearance model (Time to % Infected area)

©2005 Horticultural Development Council Page 22
The turquoise and marine coloured lines indicate the disease index for a particular day, for 5% and 50% expected area of infected leaf material to be visible (Figure 13). The red arrow indicates the first occurrence of when the threshold is reached. This can be used as a guide to spray timing. The model could be used to determine when potential differences between high and low infection events and their effects at different stages in crop development. Any spray events will be marked on the graph with blue annotated lines on both model outputs. 4.2 Testing the White blister II symptom development model (Time to 5% and 50 %
lesion appearance) Validation tests using the white blister II model were carried out using plants inoculated with white blister in the glasshouse and given 48 H wetting period before exposure to under field conditions (see section 3.1.1.3). Assessments were carried out at regular time intervals after exposure where the presence or absence and numbers of lesions were recorded (see section 3.1.1.4). No estimates of area of infected leaf were recorded as part of these observations. For this reason tests using the white blister II model could only be carried out on that part of the model showing expected time to lesion appearance. No validation studies were carried out on that part of the white blister II model showing expected time to % area infected. This part of the model could not be tested within validation studies conducted in 2004 and 2005 due to the time constraints in collection the required data and the need for other types of validation studies which would be more applicable to this part of the white blister II model. 4.2.1 Comparison of MORPH (white blister II) and Microsoft visual basic white
blister symptom development models using 2004 field data. 4.2.1.1 Methods and Results Data sets using plants inoculated with white blister in the glasshouse prior to exposure to under field conditions in 2004 were used to compare the white blister II model programmed within Microsoft Excel (visual basic computing language) and within MORPH (using C computing language compiled in C++). The visual basic model and the MORPH model were compared for the estimated number of days to (5 and 50 %) lesion appearance. No comparisons could be carried out for time to (5 and 50 %) infected plant area. The number of days to expected symptom appearance was then compared to the number of days to observed symptom
©2005 Horticultural Development Council Page 23
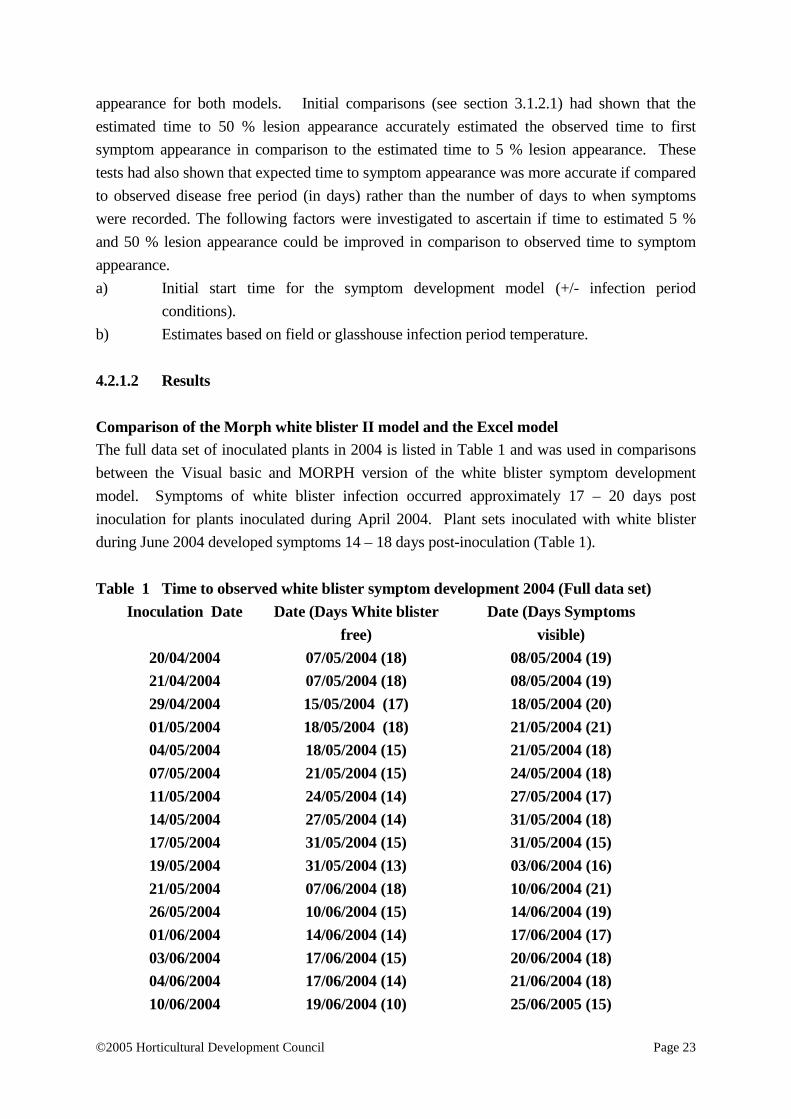
appearance for both models. Initial comparisons (see section 3.1.2.1) had shown that the estimated time to 50 % lesion appearance accurately estimated the observed time to first symptom appearance in comparison to the estimated time to 5 % lesion appearance. These tests had also shown that expected time to symptom appearance was more accurate if compared to observed disease free period (in days) rather than the number of days to when symptoms were recorded. The following factors were investigated to ascertain if time to estimated 5 % and 50 % lesion appearance could be improved in comparison to observed time to symptom appearance. a) Initial start time for the symptom development model (+/- infection period
conditions). b) Estimates based on field or glasshouse infection period temperature. 4.2.1.2 Results Comparison of the Morph white blister II model and the Excel model The full data set of inoculated plants in 2004 is listed in Table 1 and was used in comparisons between the Visual basic and MORPH version of the white blister symptom development model. Symptoms of white blister infection occurred approximately 17 – 20 days post inoculation for plants inoculated during April 2004. Plant sets inoculated with white blister during June 2004 developed symptoms 14 – 18 days post-inoculation (Table 1). Table 1 Time to observed white blister symptom development 2004 (Full data set)
Inoculation Date Date (Days White blister free)
Date (Days Symptoms visible)
20/04/2004 07/05/2004 (18) 08/05/2004 (19) 21/04/2004 07/05/2004 (18) 08/05/2004 (19) 29/04/2004 15/05/2004 (17) 18/05/2004 (20) 01/05/2004 18/05/2004 (18) 21/05/2004 (21) 04/05/2004 18/05/2004 (15) 21/05/2004 (18) 07/05/2004 21/05/2004 (15) 24/05/2004 (18) 11/05/2004 24/05/2004 (14) 27/05/2004 (17) 14/05/2004 27/05/2004 (14) 31/05/2004 (18) 17/05/2004 31/05/2004 (15) 31/05/2004 (15) 19/05/2004 31/05/2004 (13) 03/06/2004 (16) 21/05/2004 07/06/2004 (18) 10/06/2004 (21) 26/05/2004 10/06/2004 (15) 14/06/2004 (19) 01/06/2004 14/06/2004 (14) 17/06/2004 (17) 03/06/2004 17/06/2004 (15) 20/06/2004 (18) 04/06/2004 17/06/2004 (14) 21/06/2004 (18) 10/06/2004 19/06/2004 (10) 25/06/2005 (15)

©2005 Horticultural Development Council Page 24
Figure 14 Output from the MORPH white blister II models (inoculation times 20, 21 and 29 April 2004)
Figure 15 Output from the MORPH white blister II models (inoculation times 11, 14 and
17 May 2004)

©2005 Horticultural Development Council Page 25
Figure 16 Output from the Excel model inoculated on the 20 April 2004 ( 5 %, 50 % ) and 21 April ( 5 %, 50 % ) symptom development
with visible symptom threshold (------)
0
0.5
1
1.5
2
2.5
3
18/04/200400:00
23/04/200400:00
28/04/200400:00
03/05/200400:00
08/05/200400:00
13/05/200400:00
Date
Sym
ptom
dev
elop
men
t (Vi
sibl
e ab
ove
valu
e 1)
The visual basic model (output for inoculation times 20 and 21 April shown on Figure 16) and the MORPH White Blister II models (output Figures 14 and 15) were run using half hourly data from the field which included the 48 H period during which plants were inoculated and given leaf wetting conditions. Data sets from 16 different plant inoculations were used for comparisons of the observed and expected time to symptom development (days). Regression analysis was used to compare the relationship between observed and expected days to symptom development. There was a poor relationship between time to observed 5 % symptom development and time to 5 % expected symptom development using both the Visual basic model (regression coefficient r2 = 0.3729) or the Morph white blister II model (regression coefficient r2 = 0.3729) (data not presented). The relationship between time to observed time to 50 % symptom development and time to expected 50 % symptom development is shown for the visual basic model (Figure 17) and the Morph white blister II model (Figure 18). There was a good relationship between time to first observed symptom development and time to 50 % expected symptom development using both the visual basic model (r2 = 0.5397) or the Morph white blister II model (r2 = 0.6874). The Morph white blister II model gave the closer relationship between first observed symptom development and time to 50 % expected symptom development (Figure 18).

©2005 Horticultural Development Council Page 26
Figure 17 Relationship between time to observed symptom development and expected
50 % symptom development using the visual basic model.
R2 = 0.5397
0
5
10
15
20
25
0 5 10 15 20
Days to symptom Appearance (Observed)
Day
s to
50
% s
ympt
om a
ppea
ranc
e (E
xpec
ted)
R2 = 0.6874
0
5
10
15
20
25
0 5 10 15 20
Days to symptom Appearance (Observed)
Day
s to
50
% s
ympt
om a
ppea
ranc
e (E
xpec
ted)
Figure 18 Relationship between time to observed symptom development and expected 50
% symptom development using the MORPH white blister II model.
©2005 Horticultural Development Council Page 27
4.2.1.3 Conclusions
• Expected time to 50 % symptom development as calculated using the white blister II model was a good measure of the time to first observed symptom development in the field.
• The white blister II model gave better prediction of time to first symptom that the Visual basic (excel model).
• The symptom development model (white blister II) should include data collected during infection events as starting points for model calculations.

©2005 Horticultural Development Council Page 28
4.2.2 Validation of the white blister symptom development model using 2005 field data
4.2.2.1 Materials and Methods Plant production Brussels sprouts (cv. Adonis), Broccoli (cv. Shogun), Cauliflower (cv. Belot), Red cabbage (cv. Rodon) and Savoy cabbage (cv. Tarvoy) were grown in Hassey 308 trays (one seed per cell). Plants were transplanted into FP11 pots in 70:30 Fisons F2 compost (one seedling per pot). Plants were grown in a 16/14 C day/night temperature regime. Plants were grown until the 7 true leaf stage at which point they were used in white blister symptom development experiments. Sequential sowings of plants ensured that all plants used in the experimental treatments were at the same developmental stage. Collection of white blister field inoculum Brussels sprouts (cv. Golfer) were inoculated at routine intervals using a white blister zoospore/zoosporangial suspension. Plants were infected initially using inoculum collected from a heavily infected seeding field plot of Brussels sprouts cv. Golfer (see section 3.1.1.2). Fresh inoculum was collected from infected plants using a hand held cyclone sampler (Burkard Manufacturing Co., Rickmansworth) when lesions on the plants had ruptured. The zoosporangia were collected dry and then hydrated using tap water. The resulting suspension was placed at 5 C for approximately 7 hours after which time it was checked for the presence of motile zoospores (the infective stage of white blister). The concentration of zoospores (the infective stage) was measured using a haemocytometer. Plant inoculation Brussels sprouts (cv, Adonis), Red cabbage (cv. Rodon), Savoy cabbage (cv.Tarvoy), Broccoli (cv. Shogun) and cauliflower (cv. Belot) were inoculated with a white blister zoospore suspension. Plants were sprayed with a 0.05 % aqueous suspension of Tween 20 prior to inoculation. In each week of the tests 3 plants of each cultivar (at the 6 – 8 true leaf stage) were inoculated with 70 mls of a white blister zoospore suspension. Plants were then placed in a misting chamber for 48 H before being placed outside under field conditions. Plants were routinely monitored and disease symptoms and recorded when observed. Disease assessment The number of lesions on each leaf of each plant was recorded for each inoculation date at each assessment time. Disease assessments were taken at regular intervals after each inoculation period. The number of lesions on leaves of each plant were assessed after first symptoms had appeared and after for a period of 14 – 21 days.

©2005 Horticultural Development Council Page 29
Collection of environmental data in the field The air temperature was recorded at 30 min intervals at the point of exposure of inoculated plants in the field. The temperature was recorded using a Smartlog meteorological monitoring station (Aardware Design, Walton on Thames). The temperature data was downloaded daily using a GSM phone link and used for comparisons of observed and predicted (using the model) symptom development. Comparisons of observed and expected time to symptom development The model within MORPH was used to determine the expected time to symptom development under field conditions. The temperature data from the field was used in conjunction with the rate (Figure 7) which was accumulated to reach a value of 1 at which point symptoms were predicted as having occurred in the field (expected symptom appearance). The time to observed symptom appearance was plotted against expected symptom appearance (in days) and a regression function (r2 value) calculated for the fit of the relationship between the two. 4.2.2.2 Results The time (days) from inoculation to the appearance of symptoms on inoculated plants of each cultivar is shown in Table 2. Cultivar Shogun and Adonis showed consistent plant infection by white blister over all inoculation periods. Table 2 Time (Days) to observed white blister symptom development in 2005 for
cultivars Adonis, Rodon, Tarvoy, Shogun and Belot Inoculation
Date cv. Rodon cv. Adonis cv.Shogun cv. Tarvoy cv. Belot
03/02/2005 39 44 39 54 46 14/02/2005 NS 41 41 NS 54 21/02/2005 42 34 34 38 38 02/03/2005 NS 33 33 34 NS 08/03/2005 27 27 32 27 NS 14/03/2005 34 24 NS 28 NS 24/03/2005 24 24 21 24 26 06/04/2005 20 29 19 41 NS 12/04/2005 21 23 21 34 23 22/04/2005 20 24 20 NS NS 03/05/2005 28 28 28 28 28 NS – No symptoms

©2005 Horticultural Development Council Page 30
Both cultivars had on average the shortest periods between inoculation and symptom development. There was not enough data to test the relationship between cultivar and time to symptom development statistically. Data sets from 16 different plant inoculations were used for comparisons of the observed and expected time to symptom development (days). Regression analysis was used to compare the relationship between observed and expected days to symptom development. There was a very close significant relationship (regression coefficient r2 = 0.9498) between time to first observed symptom and expected time to 50 % symptom development as calculated using the white blister II model for cultivar Adonis (Figure 19a). There were very close relationship between these two measures for the other cultivars Rodon (r2 =0.7736; Figure 19b), Shogun (r2 =0.741: Figure 19c), Belot (r2 = 0.8505: Figure 19d) and Tarvoy (r2 = 0.6789: Figure 19e).
Figure 19 Relationship between time to observed symptom development on cultivars Adonis (a), Rodon (b), Shogun (c), Belot (d) and expected 50 % symptom development using the MORPH white blister II model.
(a)
R2 = 0.9498
0
5
10
15
20
25
30
35
40
0 10 20 30 40 50
Days to symptom Appearance cv. Adonis (Observed)
Day
s to
50
% s
ympt
om a
ppea
ranc
e W
hite
B
liste
r II m
odel
cv.
Ado
nis
(Exp
ecte
d)

©2005 Horticultural Development Council Page 31
(b)
R2 = 0.7736
0
5
10
15
20
25
30
35
40
0 10 20 30 40 50
Days to symptom Appearance cv. Rodon (Observed)
Day
s to
50
% s
ympt
om a
ppea
ranc
e W
hite
B
liste
r II m
odel
cv.
Rod
on (E
xpec
ted)
(c)

©2005 Horticultural Development Council Page 32
R2 = 0.741
0
5
10
15
20
25
30
35
40
0 10 20 30 40 50
Days to symptom Appearance cv. Shogun (Observed)
Day
s to
50
% s
ympt
om a
ppea
ranc
e W
hite
B
liste
r II m
odel
cv.
Sho
gun
(Exp
ecte
d)
(d)
R2 = 0.8505
0
5
10
15
20
25
30
35
40
0 10 20 30 40 50 60
Days to symptom Appearance cv. Belot (Observed)
Day
s to
50
% s
ympt
om a
ppea
ranc
e W
hite
B
liste
r II m
odel
cv.
Bel
ot (
Expe
cted
)
(e)

©2005 Horticultural Development Council Page 33
R2 = 0.6789
0
5
10
15
20
25
30
35
40
0 20 40 60
Days to symptom Appearance cv. Tarvoy (Observed)
Day
s to
50
% s
ympt
om a
ppea
ranc
e W
hite
B
liste
r II m
odel
cv.
Tar
voy
(Exp
ecte
d)
The poorest relationship between observed white blister symptom development and expected time to 50 % symptom development was observed in cv. Tarvoy (r2 = 0.6789). There was a poor relationship between observed white blister symptom development and expected time to 5 % symptom development for all cultivars tested (data not presented). 4.2.2.3 Conclusions
• Expected time to 50 % symptom development as calculated using the white blister II model was a good measure of the time to first observed symptom development in the field in tests conducted in 2005.
• There were good relationships between expected time to 50 % lesion appearance and observed symptom appearance on a range of different brassica types indicating that the model was applicable to all major vegetable Brassica types grown in the UK.
• The symptom development model (white blister II) was most accurate in its predictions of white blister symptom appearance on Brussels sprouts cv. Adonis.
©2005 Horticultural Development Council Page 34
5.0 DISCUSSION 5.1 Use of mathematical models within disease management systems
Application of mathematical modelling within crop disease management systems has become widely used often in response to the need for improvements in the efficiency of inputs. Use of mathematical models within disease forecasts enable predictions to be made about the occurrence of plant diseases at economically important levels. Within vegetable production systems economically important levels of disease are usually low as many diseases cause cosmetic damage to produce resulting in a down grading in quality. The presence of only one or two lesions, on many vegetable brassicas is enough to result in a down grading in quality. For this reason disease predictions in vegetable crops must be of a higher accuracy in comparison to other disease forecasting systems. For this reason disease forecasting models must be extensively tested for their accuracy. Often this accuracy can be comprised by the type of computer language used to programme the models and express the output. The application of disease forecasts based on mathematical models can provide this degree of accuracy especially if based on “in field” parameters such as weather conditions. However the way forecasts are applied to crops is equally important. The latter depends on the epidemiology of the host pathogen interaction while the accuracy of the forecast is more reliant on the accuracy of information about the biology of the pathogen. All of these aspects require testing before disease forecasts based on a new model can be deemed reliable. Within this project a new model used to forecast white blister development in the field has been tested and compared to the output from standard modelling language. 5.2 Models forecasting white blister disease occurrence and development in
vegetable Brassica crops Fungal diseases of vegetable brassica crops have specific environmental requirements for their development in crops. Leaf surface wetness is an important criterion for infection by many fungal pathogens of vegetable brassicas. If all diseases are to be predicted information on the environmental criteria necessary for development of each disease will be required. The occurrence of specific requirements necessary for disease development can be used to forecast their development. Forecasts, of more than one disease in the crop can be used to target disease control measures (fungicide sprays). The addition of disease development forecasts for white blister to the disease forecasting system (Brassicaspot ) within MORPH for vegetable Brassica crops has improved the use of this system within vegetable Brassica crops. White blister control in the past has depended on the application of fungicides containing metalaxyl. This chemical is combined with chlorothalonil. However other chemicals are available which are more protective in action such as azoxystrobin. Use of the white blister disease development model will enable more reliance on protectant fungicides such as Amistar. The white blister disease

©2005 Horticultural Development Council Page 35
development model enables protectant fungicides to be applied just before white blister symptoms appear in the crop reducing any further spread of disease in the crop. Fungicides containing metalaxyl are the most expensive fungicidal product applied to vegetable brassica crops. Reducing the usage of this chemical will help reduce the costs of vegetable brassica production. Metalaxyl can be applied only when disease pressure is high however by using protectants effectively it is clear that white blister can be reduced to low levels in the crop removing the need for applications of metalaxyl. The white blister infection model can also be used to determine when the crop can be checked for signs of disease. When this model is used in conjunction with the white blister disease development model the risk of disease occurrence can be computed additionally the development of symptoms resulting from infection can also be estimated. This will reduce the need for crop walking and should mean that growers and producers can determine more accurately when to walk the crop and what diseases to look for. In the current project tests indicated that time to 50 % symptom development was an accurate indicator of time to observed first symptom. This model criteria will be useful in disease control programmes for white blister. Both models (white blister infection and white blister disease development) have been programmed within the Brassicaspot (MORPH based) system which means that both pieces of information are displayed concurrently. However when models are computed in this way within new computer languages they must be tested for accuracy by comparing their output with that obtained in previous working systems. For this reason the new White Blister II model within MORPH (infection and disease development model combined) was extensively tested for its degree of accuracy.
5.3 Testing the white blister symptom development models programmed in different computing languages
The white blister symptom development model was developed using controlled environment data. This report shows how the model was produced, programmed and tested (under field conditions). A limited number of data sets were available for these tests during 2004 and in 2005 however these show when the model is used to predict the appearance of symptoms on plants with immature leaves the results are accurate to within one to two days. Validation studies reported here show that the disease development model is more accurate if the temperature during the infection period is included within the calculation of time to symptom development. The results show that the model works particularly well on plants with mostly immature tissues. When older plants were included in the 2004 data set (not available for the 2004 Annual report) the relationship between observed and expected symptom development was less accurate. Additionally the estimated time to 50 % symptom development (using the model) proved more accurate than the estimated time to 5 % symptom development. Further work is required using data using field plants of differing maturities as it appears that this is one

©2005 Horticultural Development Council Page 36
source of inaccuracy not accounted for in the model. It is possible that some manipulation of the function might make this more accurate on mature tissue. Alternatively the threshold required for visible symptoms on more mature tissues may need to be raised. The disease development model programmed in C and compiled in C++ proved more accurate than the original model programmed in Microsoft visual basic. 5.4 Testing the white blister symptom development model on different vegetable
Brassica types The disease development model was also tested for its degree of accuracy in estimating time to symptom development on a range of Brassica types inoculated with white blister and monitored in the field. These tests were conducted on a new data set collected during 2005 from young immature plants. Only the final version of the model (White blister II) was used in these tests. There was no statistical effect of cultivar on the relationship between observed and expected time to symptom development. The relationship between the two was however closer using the Brussels sprouts cultivar Adonis. This is not surprising given that the model was formulated using data derived from infected Brussels sprouts seedlings. Any likely differences between Brassica types in the relationship between observed and expected time to symptom development is possibly due to differences in the rate of maturation of leaves between Brassica types. 5.5 Practical usage of the white blister II prediction system within Brassica spot
Using information from the white blister disease development model and the white blister infection model (white blister II) will be essential if white blister is to be controlled in the field. The disease development model can be started when the white blister infection model indicates that conditions for infection have occurred. Sporulation/disease development models for ringspot and dark leaf spot are already present within Brassica spot. New information predicting white blister disease development should increase the reliability and effectiveness of disease prediction in vegetable brassica crops. New and rapid methods of detecting and quantifying pathogenic inoculum are becoming available. These tests will still require mathematical models such as the white blister disease development model to be effective. The models will effectively determine when tests for inoculum should be carried out. The long period required at low temperatures for white blister symptom development means that this disease should be easy to control in the early stage of crop development after transplanting. It is possible that much of the infection arises from infected transplant production as only immature tissues are capable of producing symptoms. Additionally oilseed rape is not susceptible to infection by white blister which means that there should be fewer reservoirs of inoculum from which crops can become infected. As a result it is possible that by using the white blister symptom development model there may be a high chance of reducing the incidence of white blister to very low or zero levels reversing the trend with this disease. This will depend on uptake and usage of the model by growers.

©2005 Horticultural Development Council Page 37
5.6 Further disease forecasting criteria for foliar diseases of vegetable brassica crops Fungicides application is the only option for controlling diseases in vegetable Brassica crops at present. With information now available on optimal timing of white blister sprays there is now a system available which covers all the major vegetable brassica diseases which occur in the U.K. With the changes in fungicide products available for vegetable brassica crops other problems which were minor in the past have become more prevalent. A good example of this is the powdery mildew pathogen Erysiphe cruciferarum. This pathogen has become more prevalent since triadimenol lost approval for use in vegetable brassica crops. This has placed more reliance on other chemicals with activity against powdery mildew notably tebuconazole and sulphur. However the advantage of forecasting systems is that they have the capability for information on new problems to be added in the future while retaining information on existing pathogens. This means that regardless of changes in fungicide regulations information exists which can be used to enhance the activity of those fungicides still available to the grower. There are also criteria within the white blister II model which have not been tested. This refers primarily to the expected time to 50 % plant area infected. It is possible that, this criteria, if accurate might have some usage for differentiating the differences in white blister infection events or the likelihood of epidemics becoming established in crops. Further work should also test if this model might have some potential for differentiating resistance to white blister in different vegetable Brassica cultivars and types.

©2005 Horticultural Development Council Page 38
6. REFERENCES Cullington, J. E. 1995. Studies into the biology and epidemiology of Mycosphaerella
brassicicola, the ringspot pathogen of brassicas. University of Birmingham (U.K.) Ph.D. Thesis 229 p.
Gupta, K. & Saharan, G.S. (2002). Identification of pathotypes of Albugo candida with stable
characteristic symptoms on Indian mustard . Journal of Mycology and Plant Pathology 32, pp 46 – 51.
Hill, C.B., Crute, I.R., Sherriff, C. & Williams, P.H. (1988). Specificity of Albugo candida and
Peronospora parasitica pathotypes towards rapid cycling crucifers. Cruciferae Newsletter 13, pp 112-113.
Humpherson-Jones, F. M. (1991). The development of weather related disease forecasts for
vegetable crops in the UK. Problems and prospects. OEPP/EPPO Bulletin 21, pp 425-429.
Humpherson-Jones, F. M. and Phelps, K. (1989). Climatic factors influencing spore production
in Alternaria brassicae and Alternaria brassicicola. Annals of Applied Biology 114, pp
449-58.
Jacobson, D. J., Lefebvre, S. M., Ojerio, R. S., Berwald, N. and Heikkinen, E. (1998).
Presistent, systemic, asymptomatic infections of Albugo candida, an oomycete parasite, detected in three wild crucifer species. Canadian Journal of Botany 76, pp 739-750.
Kennedy, R. and Graham, A. M. (1995). Brassica leaf diseases: Further development of weather
– based forecasting systems for dark leaf spot and light leaf spot. Final Report - HDC Project FV 53c, Horticultural Development Council, Petersfield, 25pp.
Kennedy, R., Wakeham, A. J. & Cullington, J. E. (1999). Production and immunodetection of
ascospores of Mycosphaerella brassicicola: the ringspot pathogen of vegetable crucifers. Plant Pathology 48, pp 297 – 307.
Pound, G.S. & Williams, P.H. (1963). Biological races of Albugo candida. Phytopathology 53,
pp 1146 – 1149. Verma, P.R., Harding, H. Petrie, G.A. & Williams, P.H. (1975). Infection and temporal
development of mycelium of Albugo candida in cotyledons of four Brassica species. Canadian Journal of Botany 53, pp 1016 – 1012.

©2005 Horticultural Development Council Page 39
Williams, P.H. (1985). Crucifers genetics cooperative (CGRGC) Resource book. Department of Plant Pathology, University of Wisconsin, U.S.A.