project summary sheet - north dakota
TRANSCRIPT
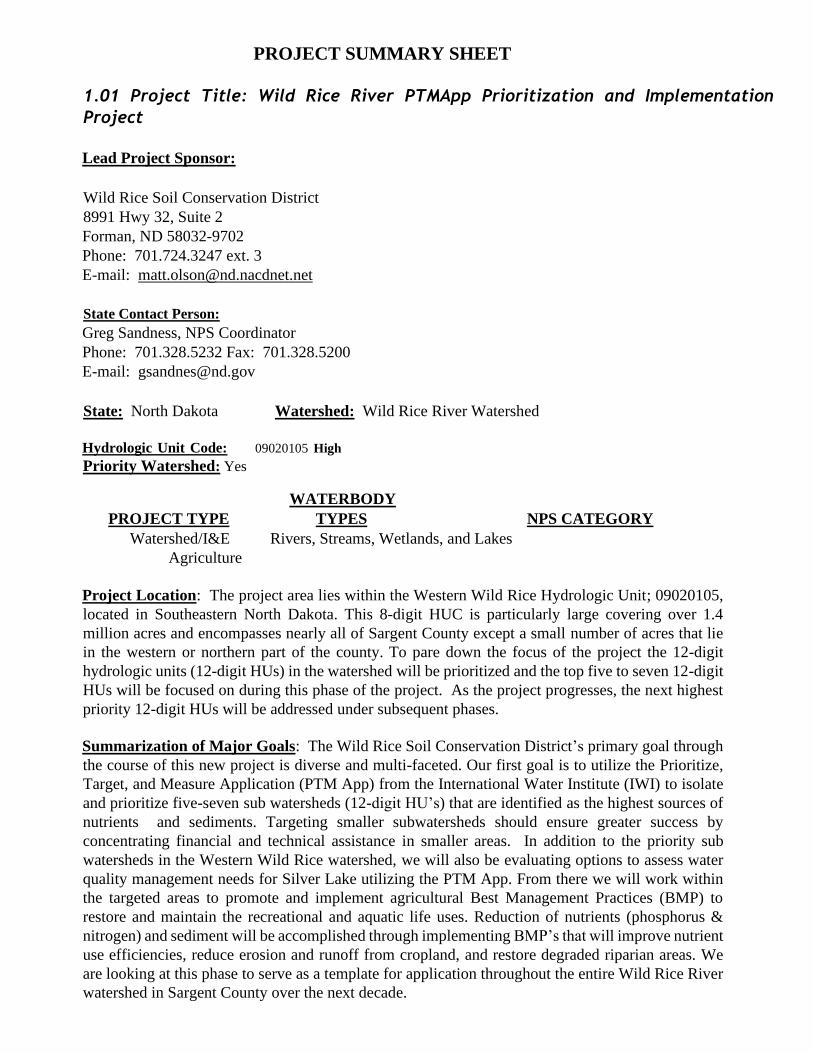
PROJECT SUMMARY SHEET
1.01 Project Title: Wild Rice River PTMApp Prioritization and Implementation
Project
Lead Project Sponsor:
Wild Rice Soil Conservation District
8991 Hwy 32, Suite 2
Forman, ND 58032-9702
Phone: 701.724.3247 ext. 3
E-mail: [email protected]
State Contact Person:
Greg Sandness, NPS Coordinator
Phone: 701.328.5232 Fax: 701.328.5200
E-mail: [email protected]
State: North Dakota Watershed: Wild Rice River Watershed
Hydrologic Unit Code: 09020105 High
Priority Watershed: Yes
WATERBODY
PROJECT TYPE TYPES NPS CATEGORY
Watershed/I&E Rivers, Streams, Wetlands, and Lakes
Agriculture
Project Location: The project area lies within the Western Wild Rice Hydrologic Unit; 09020105,
located in Southeastern North Dakota. This 8-digit HUC is particularly large covering over 1.4
million acres and encompasses nearly all of Sargent County except a small number of acres that lie
in the western or northern part of the county. To pare down the focus of the project the 12-digit
hydrologic units (12-digit HUs) in the watershed will be prioritized and the top five to seven 12-digit
HUs will be focused on during this phase of the project. As the project progresses, the next highest
priority 12-digit HUs will be addressed under subsequent phases.
Summarization of Major Goals: The Wild Rice Soil Conservation District’s primary goal through
the course of this new project is diverse and multi-faceted. Our first goal is to utilize the Prioritize,
Target, and Measure Application (PTM App) from the International Water Institute (IWI) to isolate
and prioritize five-seven sub watersheds (12-digit HU’s) that are identified as the highest sources of
nutrients and sediments. Targeting smaller subwatersheds should ensure greater success by
concentrating financial and technical assistance in smaller areas. In addition to the priority sub
watersheds in the Western Wild Rice watershed, we will also be evaluating options to assess water
quality management needs for Silver Lake utilizing the PTM App. From there we will work within
the targeted areas to promote and implement agricultural Best Management Practices (BMP) to
restore and maintain the recreational and aquatic life uses. Reduction of nutrients (phosphorus &
nitrogen) and sediment will be accomplished through implementing BMP’s that will improve nutrient
use efficiencies, reduce erosion and runoff from cropland, and restore degraded riparian areas. We
are looking at this phase to serve as a template for application throughout the entire Wild Rice River
watershed in Sargent County over the next decade.

Project Description: This watershed project will utilize comprehensive conservation planning,
PTM App, BMP implementation, monitoring/assessment, educational events and demonstration
projects in the priority watershed for the Western Wild Rice Watershed to reduce NPS pollution
impacts to aquatic life and recreational uses. Emphasis will be placed on improving vegetative
conditions, erosion control, and soil health management within the priority areas identified by PTM
App as being high nutrient and/or sediment sources.
FY21 - 319 funds requested - $304,518.00 Match: $203,012.00
Total project cost: $507,530.00 319 Funded Full Time Personnel – 1.1
The main objectives are:
1. Utilize the PTM App to prioritize 5-7 sub-watersheds (e.g., 10-digit HUs) in the Wild Rice
River watershed in Sargent County based on estimated nutrient and sediment loads at the
priority resource point. Within each sub-watershed identify the top 40-50 priority catchments
for BMP implementation to reduce the estimated loads for nutrients (N & P) and total
suspended solids at the sub-watershed priority resource point.
2. Establish a long-term schedule for addressing the identified nutrient and sediment sources in
the priority catchments in each sub-watershed in the Western Wild Rice Watershed in Sargent
Co. This schedule may extend beyond 20 years.
3. Work with landowners within these areas to assess which acres on their operation are the
biggest contributors of nutrient and sediment load. Then we can work together to provide
cost-share to implement BMP’s on those acres.
4. Document trends in water quality and beneficial use conditions (i.e. nutrient/sediment and E.
coli bacteria concentrations, estimated reduction models from PTM App, etc.) as BMPs are
applied to evaluate progress toward established goals.
5. Provide opportunities for producers, landowners, partner agencies, and the general public to
increase their understanding and awareness of NPS pollution related to agricultural
production and the potential cropping options that can be used to slow water runoff, enhance
infiltration and improve soil health to reduce the delivery of sediments and nutrients to rivers,
lakes, and streams in the project area.
2.0 STATEMENT OF NEED:
2.1 Project Reference: The Wild Rice Soil Conservation District (SCD) has worked to protect the
natural, economic, and recreational value of the Wild Rice River since watershed planning began in
1999 through the Wild Rice Watershed Restoration Action Strategy (WRAS) by providing financial
and technical assistance to reduce the effects of non-point source pollution. The SCD has received
Section 319 funding for the previous NPS pollution management efforts in the Wild Rice River
watershed. It is important to know that in the September 2017 North Dakota Department of Health
newsletter; the Wild Rice River Restoration and Riparian Project was highlighted for achieving
improved water quality in the Shortfoot Creek sub-watershed. Activities that led to these positive
results can be found in Appendix A.
The Wild Rice River PTMApp Prioritization and Implementation Project (WRRPPPIP)will be
targeted toward practices that improve the management and vegetative conditions in the riparian
corridor and lands immediately adjacent to the river and its tributaries. In many areas of the

watersheds, excessive soil erosion is associated with intensive agricultural activity and/or frequent
over land flooding due to heavy rains and abundant snowfall. These conditions are causing failing
streambanks, scalloping, and fluvial erosion. In addition to erosion, E. coli levels are a concern
throughout many of the watersheds in Sargent County causing several river reaches to be included
on the 303(d) list due to recreational use impairments. Poor manure management and outdated
residential septic systems are potential sources contributing towards elevated E. coli levels.
In order to build on the successes from previous projects we will add new technology in the PTMApp
to change our focus from 10-digit HU’s in our previous projects to 12-digit HU’s to allow us to focus
dollars in areas that will produce the greatest water quality improvements as well as develop a long
range plan to prioritize all 12-digit HU’s for future watershed projects. The Wild Rice Soil
Conservation District will use funding through the Wild Rice River PTMApp Prioritization and
Implementation Project to support the development and implementation of comprehensive
conservation plans with producers in the priority 12-digit HUs. These plans will address resource
issues such as soil erosion, livestock grazing, riparian management and soil health. Practices and
management changes implemented through the plans will restore/protect the recreational and aquatic
life uses of the Wild Rice River and its tributaries.
Outreach and education are a huge component of 319 operations in Sargent County. As social media
keeps evolving, so does the way we communicate. Over the last year we have worked with a local
web design company to improve out digital presence. With their help we have been able to merge the
Wild Rice & CCSP webpages (https://www.wildricescd.com/) , create a YouTube channel that shows
conservation videos from the district (click here for link), and incorporated a Urban Conservation tab
for our high tunnel as well as a 60” corn tab in our CCSP tab. These social media and educational
offerings will continue to be used throughout the effective period for the Wild Rice River PTMApp
Prioritization and Implementation Project.
Although we took a step back in 2020 due to COVID, in-person outreach and education will always
be a high priority going forward. In a standard year, the project’s outreach events will include; an
Eco-Ed Day in the fall, participation in Harvest North Dakota in early spring, Tom Gibson
presentations to area schools, assistance with Envirothon in May, a Ladies Ag event biennially, and
1-3 soil health workshop/field days through our Conservation Cropping Systems Project.
The Conservation Cropping Systems Project (CCSP) farm demonstrates new and innovative methods
for implementing the five soil health principles; soil armor, minimizing soil disturbance, plant
diversity, continuous plant/root, and livestock integration. Through outreach and education at the
CCSP cooperative sites, we can show producers different cropping and grazing options that can be
implemented to improve water quality by keeping more residue on the soil surface, utilizing cover
crops, and increasing water infiltration into the soil. Our CCSP cooperative sites help the project and
staff establish credibility with local farmers and provides a local showcase to encourage widespread
adoption of practices that improve water quality and soil health.
2.2Watershed Description: The Wild Rice River watershed is located in Cass, Dickey, Ransom,
Richland and Sargent Counties in Southeastern North Dakota and Marshall and Roberts Counties in
northeastern South Dakota. The Wild Rice River watershed lies within the Level III Northern
Glaciated Plains (46) and Lake Agassiz Plain (48) Ecoregions.
The Wild Rice River (HUC09020105) is identified as a Class II stream. The quality of the waters in
this class shall be the same as the quality of class I streams, except that additional treatment may be
required to meet the drinking water requirements of the Department. Streams in this classification
may be intermittent in nature which would make these waters of limited value for beneficial uses
such as municipal water, fish life, and irrigation, bathing, or swimming.

The Wild Rice River Priority Project will utilize a new mapping system from the International Water
Institute called the PTM App to prioritize areas likely to contribute the highest nutrient loads due to
soil type, topography, land use, etc.
2.3 Maps: The Prioritize, Target, and Measure Application (PTMApp) will be utilized to understand
and address nutrient/sediment loads in the 12-digit HU’s in the Western Wild Rice watershed. Figure
1. shows an example of a PTM app map that delineates all the priority catchments for nitrogen
management in the Wild Rice River Watershed. These priorities are based on the estimated amount
of nitrogen exiting the catchments. The catchments range in size from 40 to 120 acres. The dark red
areas denote catchments with higher potential nitrogen outputs than those that are light red. As
previously indicated, to pare down the number of priority catchments for this phase of the project,
similar maps to Figure 2. will be developed at the 12-digit HU scale to determine which 12-digit
HU’s are the highest priority sources of nitrogen, phosphorus and sediments. The end goal for this
process is to target technical and financial assistance to the catchments and 12-dgit HU’s that will
deliver the highest return on investment in terms of pollutant reduction.
Figure 1. PTM App Example (Nutrient Reduction @ Catchment) 8-Digit HU
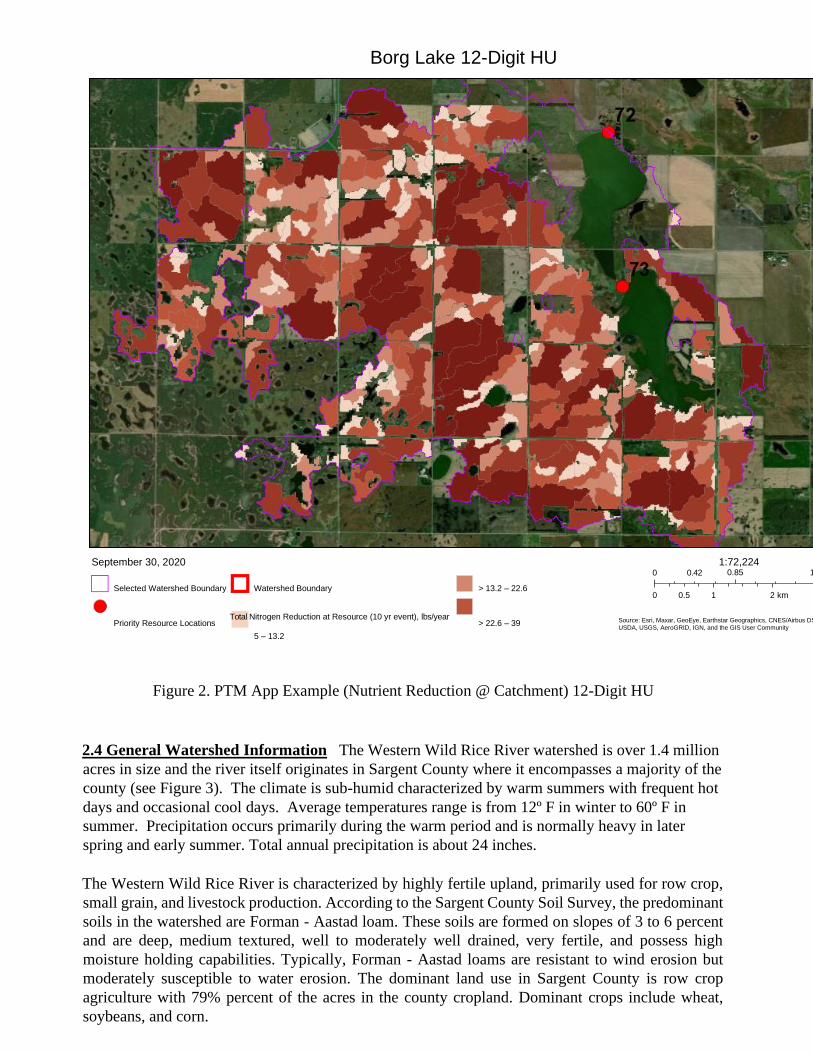
Figure 2. PTM App Example (Nutrient Reduction @ Catchment) 12-Digit HU
2.4 General Watershed Information The Western Wild Rice River watershed is over 1.4 million
acres in size and the river itself originates in Sargent County where it encompasses a majority of the
county (see Figure 3). The climate is sub-humid characterized by warm summers with frequent hot
days and occasional cool days. Average temperatures range is from 12º F in winter to 60º F in
summer. Precipitation occurs primarily during the warm period and is normally heavy in later
spring and early summer. Total annual precipitation is about 24 inches.
The Western Wild Rice River is characterized by highly fertile upland, primarily used for row crop,
small grain, and livestock production. According to the Sargent County Soil Survey, the predominant
soils in the watershed are Forman - Aastad loam. These soils are formed on slopes of 3 to 6 percent
and are deep, medium textured, well to moderately well drained, very fertile, and possess high
moisture holding capabilities. Typically, Forman - Aastad loams are resistant to wind erosion but
moderately susceptible to water erosion. The dominant land use in Sargent County is row crop
agriculture with 79% percent of the acres in the county cropland. Dominant crops include wheat,
soybeans, and corn.
Borg Lake 12-Digit HU
September 30, 2020
Selected Watershed Boundary
Watershed Boundary
> 13.2 – 22.6
0 0.42
0 0.5
1:72,224 0.85 1.7 mi
1 2 km
Priority Resource Locations Total Nitrogen Reduction at Resource (10 yr event), lbs/year
5 – 13.2
> 22.6 – 39 Source: Esri, Maxar, GeoEye, Earthstar Geographics, CNES/Airbus DS,
USDA, USGS, AeroGRID, IGN, and the GIS User Community

Figure 3. Western Wild Rice Watershed in Sargent County with TMDL and 303(d) Status
The river and its tributaries as well as the lakes connected to the river are classified as a warm water
fishery, "waters capable of supporting growth and propagation of non-salmonid fishes and associated
aquatic biota (NDDEQ). Approximately 24 fish species are found in the Wild Rice River Watershed,
offering a fishery for local fisherman, particularly in the lower reaches of the river. Documented
species include; Northern Pike, Walleye, White Sucker, Shorthead, Redhorse, Quillback, Black
Bullhead, Tadpole Madtom, Carp, Fathead Minnow, Spotfin Shiner, Common Shiner, and Iowa
Darter (NDDoH 1994-1995 test netting).
2.5 Watershed Water Quality
2.5.1 Background and Overview
The Wild Rice River is a tributary to the Red River of the North located in Cass, Dickey, Ransom,
Richland and Sargent Counties in southeastern North Dakota and Marshall and Roberts Counties in
northeastern South Dakota. The Wild Rice River sub-basin (hydrologic unit 09020105) has an aerial
extent of approximately 1.4 million acres.
The Wild Rice River PTMApp Prioritization and Implementation Project will focus on;

comprehensive conservation planning at the field scale, BMP implementation,
monitoring/assessment, and information/education to reduce NPS pollution impacts to aquatic life
and recreational uses in the watershed. Aquatic habitat degradation and deposition of fine sediments
are the primary causes of impaired aquatic life uses. Elevated nutrient concentrations may also be
negatively impacting the type and amount of macrophytes in some tributary reaches in the watershed.
Degraded riparian vegetation, reduced riparian corridor width, unstable streambanks and eroding
cropland are the likely sources of the sediments impacting aquatic life uses. Over utilization of the
riparian corridor for livestock grazing can also destabilize streambanks, reduce vegetative buffering
capabilities and increase E. coli bacteria concentrations in the river. Nitrogen, phosphorus and
sediment will be the primary NPS pollutant addressed by the project. E. coli bacteria concentrations
will also be addressed through the practices focused on improving livestock grazing management in
the riparian areas. Financial and technical assistance delivered by the project will be targeted toward
the priority areas identified with PTMApp. Within these areas, emphasis will be placed on improving
nutrient use efficiencies, soil health, riparian conditions and livestock grazing.
2.5.2 Water Quality Data
The portion of the mainstem Wild Rice River in Sargent County has four (4) STORET sampling sites and
one (1) USGS river gauging station. These four sites and one station were used to compile water quality
trends over the past two years, as a baseline for the project.
Three water quality indicators were analyzed; Total Nitrogen (TN), Total Phosphorus and Total Suspended
Solids (TSS) (all three measured as mg/L). These three indicators were graphed together with river flow
data (measured as CFS) from the USGS station. The purpose of graphing them together was to look for
correlations between concentrations and river flows.
Based on macroinvertebrate Index of Biological Integrity (IBI) scores determined by the NDDEQ, the Wild
Rice River is not supporting aquatic life uses. The macroinvertebrate IBI scores for the Wild Rice River
ranged from 36 to 55. These IBI scores all fall in the 59-0 and 58-0 ecoregion IBI scoring ranges for the
Wild Rice River watershed. IBI scores below 59 are assigned to the “Most Disturbed” biological condition
class and “Not Supporting” status for aquatic life.
Total Nitrogen and Total Phosphorus graphs include a ‘Most Disturbed’ reference line, which is based on
the Threshold Values used to determine the condition class for chemical stressors specific to the Northern
Glaciated Plains Ecoregion (46). When evaluating potential impacts to aquatic life use, the chemical
stressor threshold value for ‘Most Disturbed’ was drawn at the 75 percentile of stressor sample
concentrations. The “Most Disturbed” chemical stressor concentration thresholds established for the Wild
Rice River for total nitrogen and total phosphorus are 1.047mg/l and 0.215mg/l, respectively. Sites/reaches
with concentrations above these values have potential aquatic life use impacts due to excess vegetative
growth, channel embedment, etc. Figures 1-13 in Appendix J show graphs for nitrogen, phosphorus, and
sediment concentration trends as well as the annual stream flow trends at the 4 sampling sites on the Wild
Rice River.
2.5.3 Conclusion
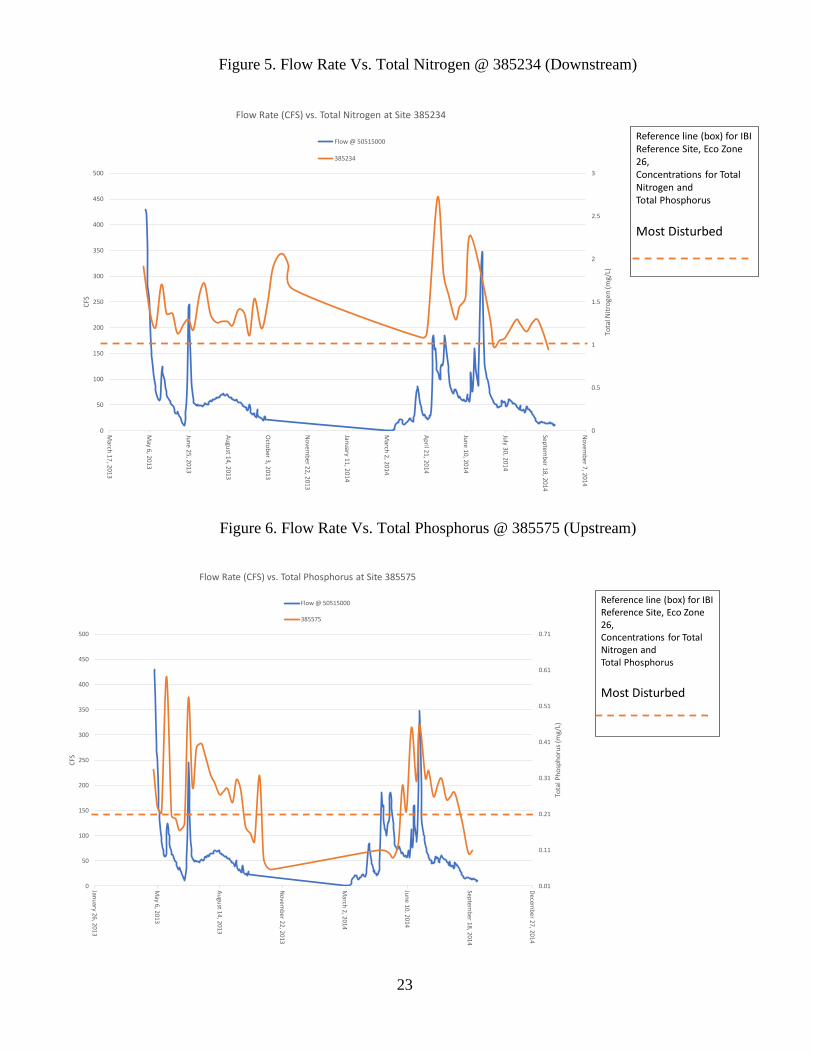
Total Nitrogen: Total Nitrogen levels tend to show similar patterns across all sites. Spikes in TN tend to
follow closely after high spikes in river flow. Major rain events and snowmelt runoff are the major factors
influencing the river flow levels. Since nitrogen is highly soluble in water, these events are also the
primary means nitrogen from the surrounding landscape is delivered to the river and its tributaries. Data
collected from all four (4) sites indicates total nitrogen concentrations were constantly above the ‘Most
Disturbed’ threshold value, even during periods of low river flow.

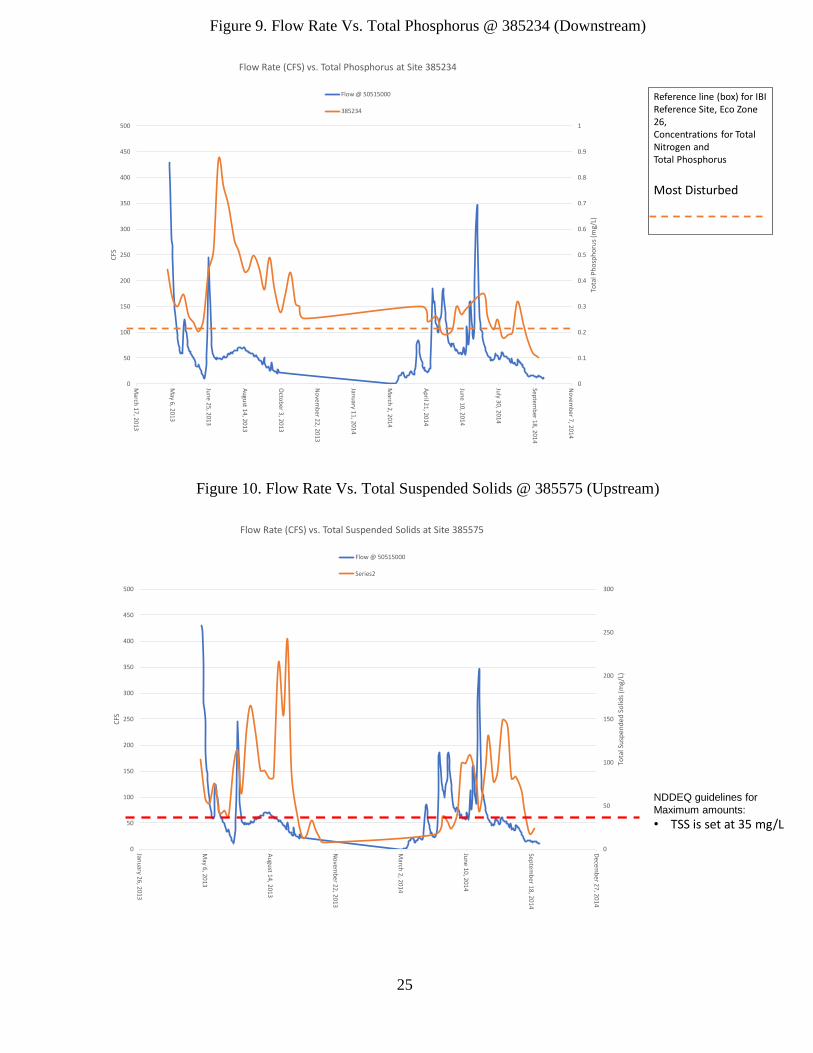
Total Phosphorus: Total Phosphorus levels tend to show similar patterns across all sites. The main
difference appears to be that once a TP spike is present, it takes a longer time period for concentrations to
return to pre-event levels. This indicates eroding stream banks may be a TP source after runoff ends and
flows slowly recede.
Total Phosphorus was also different from total nitrogen in that concentrations were above and below the
threshold reference line. This was more evident in 2014, which appears to have had more intense and
frequent rainfall events throughout the summer. Under intense rain events, phosphorus loads delivered to
the river are typically higher, but the increased water volume and corresponding dilution effects may have
been factors to reduce the TP concentrations. In 2013, river flow levels were very high in the spring and
rainfall was minimal throughout the summer and fall. This wide range of runoff volume in the spring versus
the summer/fall, may have caused higher TP concentrations throughout the summer months due to low
flows, reduced water volume and detritus (decaying vegetation, etc.) in the river. Given the variability in
the timing and delivery process for TP in the watershed, potential TP sources in the watershed likely
include eroding cropland and unstable streambanks.
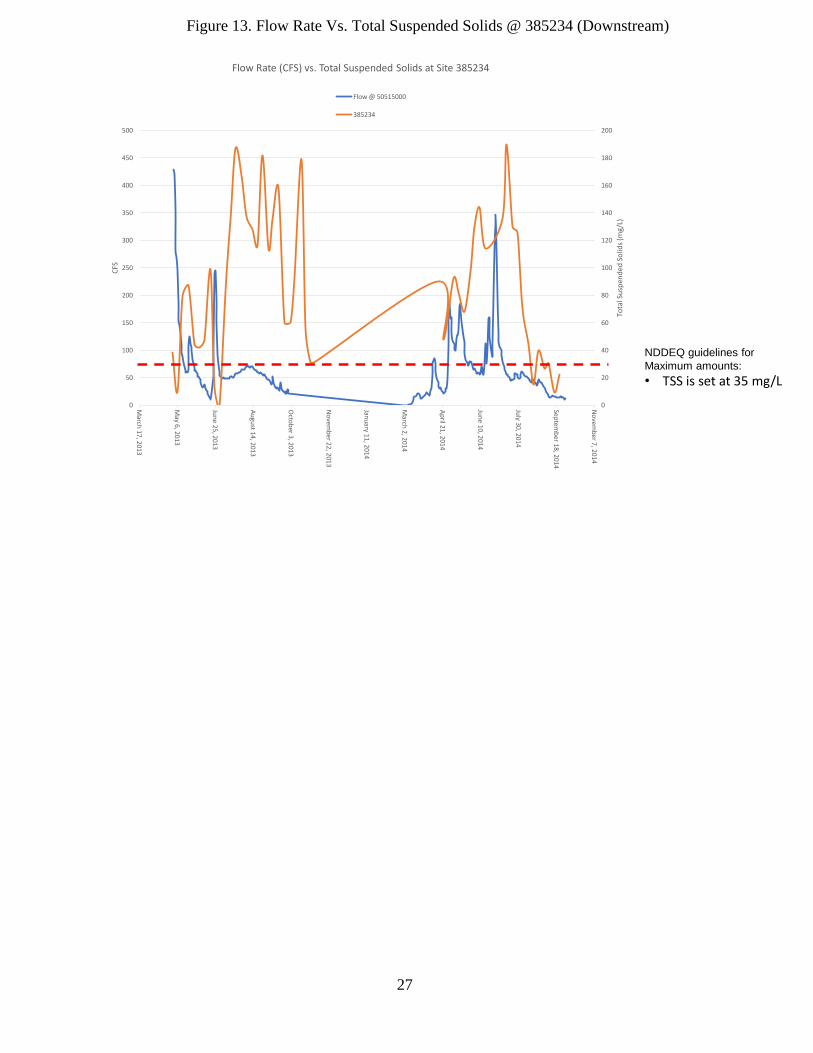
Total Suspended Solids: Average annual concentrations for Total Suspended Solids appear to increase
somewhat the further down river the site was located. This indicates a continuous contribution of
sediments throughout the length of the river that exceeds the ability of the river to reduce sediment loads
through natural deposition. Sediments delivered from low residue cropland and over-utilized grazing land
are potential sources in the watershed. However, unstable streambanks may also be a significant source for
continuous sediment and detritus contributions throughout the river. This in-channel source may cause the
TSS concentrations to persist throughout the summer and accumulate from site to site if bank erosion is
severe.
At all four (4) sites, TSS concentrations were predominantly above the NDDEQ guidance reference level.
Higher concentrations typically occurred during mid-summer to late fall, which indicates runoff from
intense rain events is the primary delivery process for TSS.
Aquatic life uses in the watershed can be improved over the long term by reducing average annual nutrient
(N & P) and TSS concentrations in the watershed. Progress toward such a project goal will take multiple
years but can be tracked over time by evaluating trends in macroinvertebrate IBI scores as well as trends in
the average annual concentrations for nitrogen, phosphorus and total suspended solids (TSS). The IBI
chemical stressor thresholds for nitrogen and phosphorus (i.e., 1.047 mg/l and 0.215 mg/l) and the TSS
target concentration (i.e., 35 mg/l) can be used to evaluate BMP success in reducing impacts to aquatic
habitats. Ultimately, attainment of the aquatic life use restoration goal will be based on the prolonged
maintenance of IBI macroinvertebrate scores above 60, which translates to an aquatic life use support status
of “Fully Supporting but Threatened.”
3.0 PROJECT DESCRIPTION
3.1 Goal for the Project: The long-term goal of the project is to restore and protect the aquatic life
use in the Wild Rice River in Sargent County by reducing the nitrogen, phosphorus and sediment
mean annual concentrations. For this initial phase, the goal is to verify the effectiveness of the
PTMApp model for establishing watershed priorities by tracking and evaluating the estimated
nitrogen, phosphorus and sediment loadings associated with practices applied within the priority sub-
watersheds (e.g., 10 digit HUs) identified with PTMApp. The estimated PTMApp load reductions
from BMP applied within the priority catchments of each sub-watershed will be used to evaluate if
the chemical stressor threshold concentrations for N and P (i.e., 1.047 mg/l and 0.215 mg/l) and the
TSS target value of 35 mg/l are reached at each sub-watershed priority resource point. During this
phase, progress towards the long-term goal will be accomplished by completing the tasks listed
below.

3.2 Objective 1: Reduce estimated nutrient and sediment loads from the priority sub-watersheds
(e.g., 10-digit HUs) to achieve the IBI chemical stressor threshold concentrations for nitrogen and
phosphorus as well as the target TSS target concentration at the sub-watershed priority resource
points.
Task 1. SCD will employ personnel to manage the project during the grant period. Responsibilities will
include BMP inventories, producer contacts, outreach/education, and water quality sampling. SCD will also
employ an Office Coordinator to assist with administrative duties associated with the watershed project.
Product: 1 Full-Time Watershed Coordinator and .1 Full-Time Office Coordinator
Cost: $380,700
Task 2: Utilize the PTM App to identify priority areas for BMP implementation at the sub-watershed/field
level.
Product: Work with the International Water Institute to prioritize sub-watershed (e.g., 10-digit HUs) and
identify priority catchments within each sub-watershed that have the highest potential contribution of
nutrients and sediments at the priority resource point. Maps will be developed depicting the priority sub-
watersheds and priority catchments. A long-term schedule will also be developed for implementing
subsequent watershed project phases according to the established sub-watershed priorities. Cost: Staffing cost
(Task 1)
Task 3: Utilize the “Scenario Builder” in PTMApp to determine the amount of additional BMP needed to
achieve the estimated N, P and TSS load reduction targets for the sub-watershed being addressed under this
phase.
Product: Location, types and amounts for the most cost-effective BMP still needed to achieve the N, P and
TSS load reduction targets for the sub-watershed.
Cost: Staffing cost (Task 1)
Task 4: Solicit additional funding to support remaining BMP needed to achieve the load reduction targets for
the sub-watershed.
Product: Additional cost share funds to be used to support remaining BMP needs identified with the PTMApp
Scenario Builder
Cost: Staffing cost (Task 1)
Task 5: Restore, protect, and maintain approximately 250 acres along the Wild Rice River and its tributaries
by installing/maintaining easements and/or implementing BMP’s such as grassed waterways, filter strips and
trees. Short term management agreements of 3-5 years or easements of 5-20 years can be created to establish
and maintain vegetation on riparian areas
Product: Riparian BMP’s on 250 acres.
Cost: $50,000
Task 6: Assist landowners with the development and implementation of cropland management plans on 1,000
acres of priority cropland acres. The plans will include BMP’s such as conservation crop rotation, cover crops,
nutrient management, residue management and soil testing.
Product: Cropland Management BMP’s on 1,000 acres
Cost: $30,000
Task 7: Assist landowners with the development and implementation of grazing management plans. These
BMP’s may include fencing, pipelines, wells, spring development, prescribed grazing, solar pumps, tanks,
troughs, portable windbreaks and/or winter grazing plans on 5 grazing systems.
Product: Technical / Financial Assistance on Grazing Management BMP’s on 5 grazing systems

Cost: $20,000
3.2: Objective 2: Increase the awareness of rural and urban residents of practices and daily
activities that can be implemented to help achieve and maintain fully supporting status of the
recreational and aquatic life uses of the Wild Rice River.
Task 8: The Watershed Coordinator and the Soil Conservation District will host/present at a variety of events
annually to educate all land users and age groups on Best Management Practices to improve soil health;
protect water quality and reduce soil erosion.
Product: 15 Outreach Events (Green Talks, Eco-Ed, Ladies Ag, Envirothon, etc.)
Cost: $1,500
3.2: Objective 3: Maintain funding support thru 2026 for the Conservation Cropping System Project
Farm (CCSP) as a demonstration site to increase producers’ awareness and understanding of: 1)
the 5 soil health principles; 2) connection between water quality and soil health; and 3) feasible
options for improving soil health under different crop rotations. See Appendix F for a list of
contributing sponsors of the CCSP Farm.
Task 9: Coordinate with up to 3 producers in the CCSP area to secure field size plots that we can utilize to
showcase BMP’s that area producers might not be aware of through field days or social media. The
demonstrations will focus on soil health improvement using winter annuals as cover and cash crops, cover
crop seeding techniques in standing crop, and establishment of a year-round “living root” crop rotations. We
will also be implementing grazing and/or haying practices on cover crops to showcase the added forage value
to cattle producers.
Product: CCSP will secure demonstration sites and host 10 events (2 events annually) (Field Day, Soil Health
Workshop, ShopTalks, or Web Based (if necessary) highlighting water quality practices that will improve
soil health being performed by CCSP
Cost: $22,000
Task 10: The CCSP Farm in conjunction with the Wild Rice Soil Conservation District has a cooperative
agreement with the Natural Resources Conservation Service to help assist with CCSP operations as well.
Product: 150 acres of cropland across 3 different operations that will host a total of 12 events by the end of
2021 with an estimated 400 attendees.
Cost: See Appendix H
Task 11: CCSP will assist cooperative producers with design and implementation of new, innovative soil
health BMP’s on 1-3 trial plots within their operation. Activities completed in past years; cover crop broadcast
seeding rate/species trial, 60” corn with cover crops, and exploring varieties of cover crops for fall grazing
that work well on flooded cropland.
Product: Cropland BMP’s on 4 plots under 100 acres per producer
Cost: $3,300
3.3 See Attached Milestone Table in Appendix B
3.4 Permits: All necessary permits will be acquired. These may include CWA (Clean Water Act)
Section 404 permits, cultural resource inventories, etc. Project sponsors will also work with NDDEQ
to determine if National Pollution Elimination System permits are needed for proposed livestock
manure management systems.

3.5 Lead Project Sponsor Wild Rice Soil Conservation District (WRSCD) is the lead sponsor. Wild
Rice SCD has sponsored three 319 projects. The WRSCD's annual and long-range plans help to
prioritize and guide the field service staff. The WRSCD has legal authorization to employ personnel
and receive and expend funds. They have a track record for personnel management and addressing
conservation issues for their constituency.
3.6 Operation and Maintenance The Wild Rice SCD will be responsible for auditing Operation and
Maintenance Agreements (O&M) for Section 319 cost shared BMP through yearly status reviews of
EPA Section 319 contracts. The lifespan of each BMP will be listed in each individual contract to
ensure longevity of the practices. The producer signs the “EPA 319 Funding Agreement Provision”
form which explains in detail the consequences of destroying a BMP before the completion of its
lifespan.
Any easements with the Wild Rice Soil Conservation District will be filed with the County Office
Recorder at the Sargent County Court House. The original document will be filed in a custody file at
the Wild Rice Soil Conservation District Office.
4.0 Coordinating Plan
4.1 Cooperating Organizations
4.1a The Wild Rice Soil Conservation District signs the Section 319 contract and is the lead agency
responsible for administration. They will provide office space, clerical assistance, access to
equipment, and supplies as well as annual financial support. The WRSCD board will oversee
implementation of the scheduled project activities and provide for staff time if feasible. The board
(WRSCD) will be the primary supervisors of the watershed coordinator and all Section 319 funded
activities.
4.1b The Sargent County Water Resource Board (SCWRB) will assist the WRSCD in project
implementation as applicable.
4.1c Sargent County Commission (SCC) - The Sargent County Commission supports the mission of
the Wild Rice Soil Conservation District and the goals of this project.
4.1d. Natural Resources Conservation Service (NRCS): NRCS has entered into a contribution
agreement with the CCSP Farm to help showcase conservation practices to producers by providing
funding to create satellite CCSP locations in southeast North Dakota within producers’ operations.
They have agreed to contribute up to $225,599 towards CCSP operations from September 2017
through December 31st of 2021 with an opportunity for an extension if deemed necessary. Current
expenditures through July 31, 2020 are $35,360.75. As far as BMP implementation goes, for areas
that are not located within the watershed or practices that are not cost-shared by 319 we will
encourage producers to utilize NRCS programs such as the Conservation Stewardship Program,
Wetland Reserve Easements, or Environmental Quality Incentive Program.
4.1e North Dakota Department of Environmental Quality (NDDEQ). The NDDEQ will oversee 319
funding as well as develop the Quality Assurance Project Plan (QAPP) for this project. NDDEQ will
provide training for proper water quality sample collection, preservation and transportation, to ensure
reliable data is obtained. The NDDEQ will provide oversight to ensure proper management and
expenditure of Section 319 funds. They will assist NRCS and SCD personnel in the review of O&M
requirements for Section 319 cost shared BMP's.

4.1f Farm Services Agency (FSA) - Programs available through FSA will be pursued for cost share
assistance.
4.1g North Dakota State University (NDSU) – Extension & Research - Local and State personnel
and educational materials will be utilized to compliment the projects I/E activities and on farm
research at demonstration sites. This will include such things as specific BMP publications and
assistance with workshops and field tours. The specific role of NDSU - Extension will be dependent
on the type of I/E activity being implemented and availability of staff and materials. Research staff
at the Oakes Irrigation Site will also coordinate with CCSP Farm on research and demonstration of
on-farm operations and may also assist with field work if time and staffing permits.
4.1h USFWS Programs and technical assistance available through USFWS will be pursued for
project assistance.
4.1i Ducks Unlimited Inc. (DU) - Programs available through DU will be pursued for cost share
assistance.
4.1j Pheasants Forever (PF) – PF has received 319 funding through the North Dakota Department of
Environmental Quality for their Precision Ag program. Watershed Coordinator will work with PF to
deliver eligible BMP’s through the Precision Ag program.
4.1k The Conservation Cropping System Project (CCSP) board – The CCSP Board will provide
oversight and guidance as to operations and mission of CCSP. The board consists of representatives
from all the participating Soil Conservation Districts (Day and Marshall in South Dakota and
Ransom, Sargent, and Richland in North Dakota as well as NDSU Extension and Ducks Unlimited.
4.2 Local Support The WRSCD Board is composed to represent concerns for the Sargent County
community at large. In addition to our board, we receive local support from a multitude of businesses
for our CCSP activities and outreach events. Whether it be goods and services or sponsoring a meal;
the people of Sargent County are always open to helping the WRSCD and our 319 Project. This is
something we take great pride in and aim to continue on with that in this new proposal.
4.3 Partnership The WRSCD will work with multiple partners (e.g., NRCS, other SCDs, WRD,
Extension Service, CCSP Farm, etc.) to increase awareness of solutions to water quality and NPS
pollution issues in the area. This will be accomplished through educational events and/or
demonstrations that focus on the benefit’s various conservation practices. Coordination with partners
will also enhance efforts to protect soil resources, improve air and water quality, expand fish and
wildlife habitat, and improve cropland and rangeland management. We are in the process of securing
letters of support now and will have them available with the PIP.
4.4 Similar Activities N/A
5.0 EVALUATION AND MONITORING PLAN
The project sponsors are currently coordinating with the ND Department of Environmental Quality
to develop the Quality Assurance Project Plan (QAPP). The QAPP will be part of the final PIP when
it is fully approved.
6.0 BUDGET
6.1 See Appendix C & E, the budget worksheet.
7.0 PUBLIC INVOLVEMENT
The Wild Rice Watershed Program has a past history of watershed projects. The success of the
program has secured public involvement on a widespread basis. The Wild Rice Restoration and
Riparian Project Phase II and Sargent County SCDs are active in youth education. The county
sponsors an ECO-ED Day every year for middle school children. The purpose of the camp is to help
stimulate the need for natural resource conservation. Public tours and demonstrations are held each
year to inform the public on various conservation issues such as no-till farming, strip tillage, cover
crops. The Wild Rice River Priority Project will be handled in a manner like that of other projects.
With this, local project staff feels that public involvement is guaranteed.
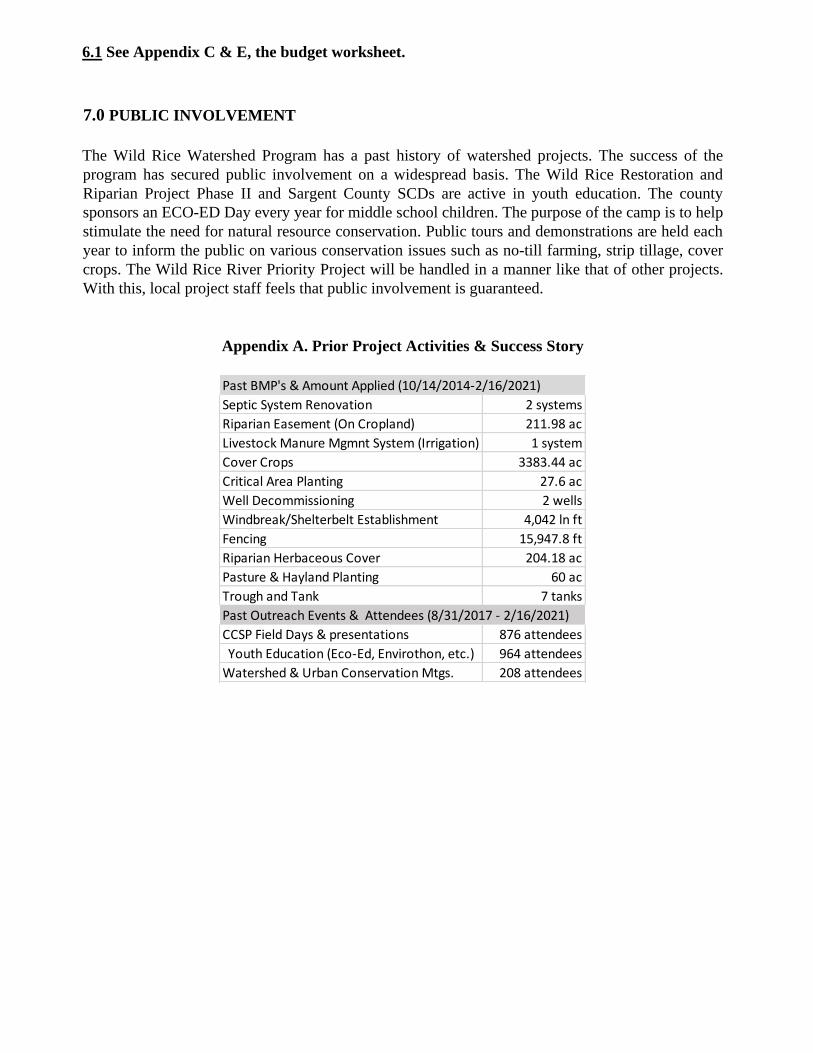
Appendix A. Prior Project Activities & Success Story
2 systems
211.98 ac
1 system
3383.44 ac
27.6 ac
2 wells
4,042 ln ft
15,947.8 ft
204.18 ac
60 ac
7 tanks
876 attendees
964 attendees
208 attendees
CCSP Field Days & presentations
Youth Education (Eco-Ed, Envirothon, etc.)
Watershed & Urban Conservation Mtgs.
Riparian Herbaceous Cover
Pasture & Hayland Planting
Trough and Tank
Past BMP's & Amount Applied (10/14/2014-2/16/2021)
Past Outreach Events & Attendees (8/31/2017 - 2/16/2021)
Cover Crops
Critical Area Planting
Well Decommissioning
Windbreak/Shelterbelt Establishment
Fencing
Riparian Easement (On Cropland)
Livestock Manure Mgmnt System (Irrigation)
Septic System Renovation
percent) (NASS, 2007b). Another
6.1 percent is in other agricultural
uses (e.g., small grains, alfalfa, and
pastureland). The remaining acreage
in the South Dakota portion of the
watershed is wetlands (10.4 percent),
grasslands (4.4 percent), and forest
(2.1 percent).
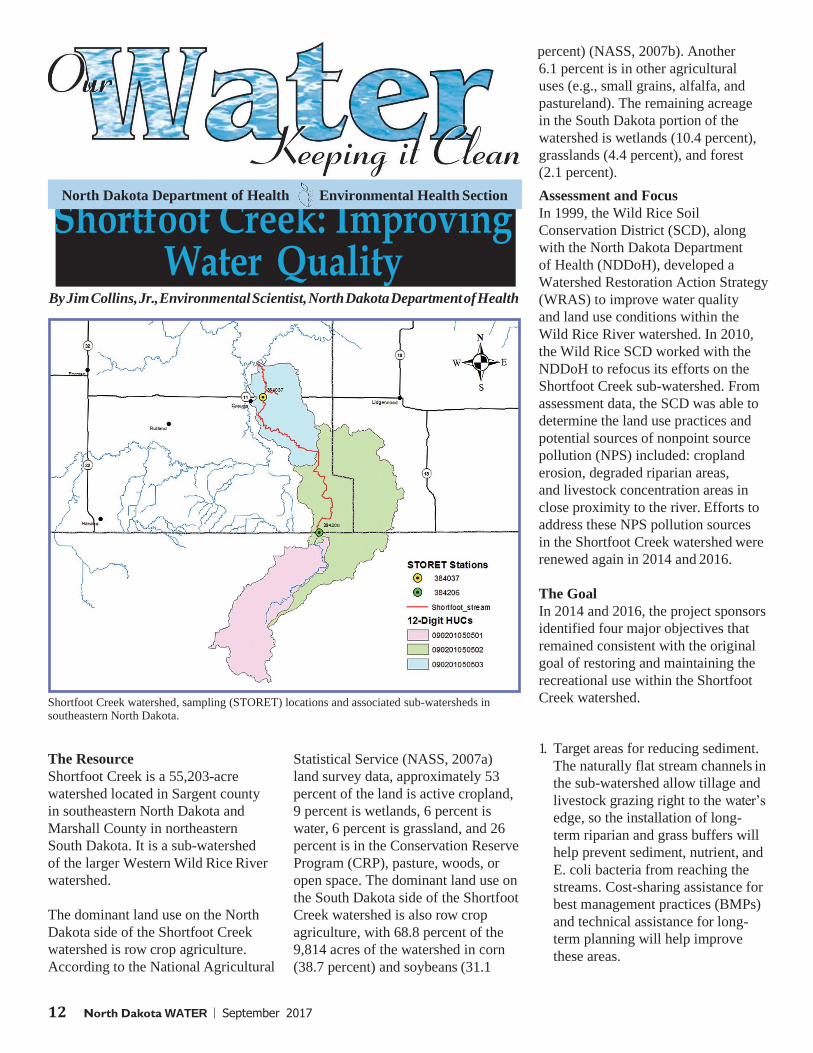
Shortfoot Creek: Improving Water Quality
By Jim Collins, Jr., Environmental Scientist, North Dakota Department of Health
Shortfoot Creek watershed, sampling (STORET) locations and associated sub-watersheds in southeastern North Dakota.
Assessment and Focus
In 1999, the Wild Rice Soil
Conservation District (SCD), along
with the North Dakota Department
of Health (NDDoH), developed a
Watershed Restoration Action Strategy
(WRAS) to improve water quality
and land use conditions within the
Wild Rice River watershed. In 2010,
the Wild Rice SCD worked with the
NDDoH to refocus its efforts on the
Shortfoot Creek sub-watershed. From
assessment data, the SCD was able to
determine the land use practices and
potential sources of nonpoint source
pollution (NPS) included: cropland
erosion, degraded riparian areas,
and livestock concentration areas in
close proximity to the river. Efforts to
address these NPS pollution sources
in the Shortfoot Creek watershed were
renewed again in 2014 and 2016.
The Goal
In 2014 and 2016, the project sponsors
identified four major objectives that
remained consistent with the original
goal of restoring and maintaining the
recreational use within the Shortfoot
Creek watershed.
The Resource
Shortfoot Creek is a 55,203-acre
watershed located in Sargent county
in southeastern North Dakota and
Marshall County in northeastern
South Dakota. It is a sub-watershed
of the larger Western Wild Rice River
watershed.
The dominant land use on the North
Dakota side of the Shortfoot Creek
watershed is row crop agriculture.
According to the National Agricultural
Statistical Service (NASS, 2007a)
land survey data, approximately 53
percent of the land is active cropland,
9 percent is wetlands, 6 percent is
water, 6 percent is grassland, and 26
percent is in the Conservation Reserve
Program (CRP), pasture, woods, or
open space. The dominant land use on
the South Dakota side of the Shortfoot
Creek watershed is also row crop
agriculture, with 68.8 percent of the
9,814 acres of the watershed in corn
(38.7 percent) and soybeans (31.1
1. Target areas for reducing sediment.
The naturally flat stream channels in
the sub-watershed allow tillage and
livestock grazing right to the water’s
edge, so the installation of long-
term riparian and grass buffers will
help prevent sediment, nutrient, and
E. coli bacteria from reaching the
streams. Cost-sharing assistance for
best management practices (BMPs)
and technical assistance for long-
term planning will help improve
these areas.
12 North Dakota WATER September 2017
North Dakota Department of Health Environmental Health Section

Livestock waste management containment pond and fencing.
Results
Through the hard work of the SCD
staff and cooperation of landowners
to install BMPs in the sub-watershed,
bacteria levels have started to show a
decreasing trend according to sample
results. While current levels still
exceed state standards for recreation,
project sponsors and the NDDoH are
encouraged by the trend. It is possible
that water quality can be improved
enough in Shortfoot Creek for it to
be removed from the 303(d) list of
impaired waters.
Future Efforts
2. Increase the index of biotic integrity
(IBI) score for the specific reaches
of the creek being addressed by the
project to achieve a fair to good
ranking (59-70 for fair and >70 for
good).
3. Evaluate progress, document trends
in water quality and beneficial use
conditions (e.g., nutrient/sediment
and E. coli bacteria concentrations,
riparian conditions, fish and macro
invertebrate diversity, etc.) as BMPs
are applied.
4. Provide opportunities for producers
and the public to increase their
understanding of (1) NPS pollution
related to agricultural production
and potential cropping options and
(2) the importance of slowing water
runoff and enhancing infiltration
using management systems to
reduce the delivery of sediments
and nutrients to water bodies in
southeastern North Dakota.
Restoration Efforts
The Wild Rice SCD has worked with
local landowners to implement the
following BMPs in the watershed:
Cover Crop 2,906.34 acres
Critical Area Planting 22.6 acres
Fencing 12,331 feet
Rural Water Hookup 1
Trough and Tank 8
Well (livestock only) 3
Manure Irrigation 1 system
Portable Windbreaks 584 feet
Waste Utilization 2,020 tons
Well Decommission 3
Riparian Easement 474.80 acres
Riparian Herb Cover 69.7 acres
Pipeline 9,917 feet
Filter Strip 80 acres
Pasture/Hay Planting 60 acres
The SCD recently hired Matt Olson
as the new watershed coordinator,
replacing Trace Hanson who retired
this past spring. Olson has an
extensive background in working with
producers to implement BMPs. With
cost-share and technical assistance
readily available, the key to continued
project success will be producer
interest throughout the watershed.
Questions?
For more information contact:
Matt Olson
Wild Rice Soil Conservation District
8991 Highway 32
Forman, ND 58032-9702
701-724-3247
Greg Sandness
NPS Program Coordinator
North Dakota Department of Health
918 E Divide Ave
Bismarck, ND 58501-1947
701-328-5232
E. coli bacteria results at sampling station 384037 indicate a decreasing trend

16
Appendix B. Milestone Table
Output Quantity Year 1 Year 2 Year 3 Year 4 Year 5
1.1 FT Employee 1.1
1.1 1.1 1.1 1.1 1.1
Priority Subwatersheds 5
5
BMP Prioritization Maps
X X
BMP Funding Needed
X X
Acres 25050 50 50 50 50
Acres 1,000
200 200 200 200 200
Systems 5
1 1 1 1 1
Outreach Events 15
3 3 3 3 3
Outreach Events 10
2 2 2 2 2
Attendees 400
80 80 80 80 80
Cooperative Sites 15
3 3 3 3 3
Group 2: Private landowners - Make land management decisions to implement BMP's
Group 3: Wild Rice SCD - Local project manager and sponsor; including responsibilites for project
Group 6: International Water Institute - Provide training and assistance on PTM App
Task 7: Grazing Mgmnt.
Groups 1, 2, 3, & 4
Task 8: Education
Groups 1 & 3
Groups 1, 2, 3, & 4
Objective 2: Watershed Outreach
Task 6: Cropland
Group 3
Task 2: PTM App Support
Group 3, 4, & 6
Task 5: RiparianGroups 1, 2, 3, & 4
Task 3: PTM App Scenario Builder
Group 3, 4, & 6
Task 4: Program Funding
Groups 3 & 4
Task 11: Soil Health BMP's
Groups 1, 2, 3, 4, 5
-Help with Scenario Builder and GIS Work in PTMApp
Group 5: CCS Farm Manager and CCSP Board Members
-Provide cash / In-Kind match for Best Management Practices
-Coordination, payments, match tracking, and progress reports to NDDEQ
Group 4: North Dakota Department of Environmental Quality - Section 319 program
-Will Assist with oversight, recommendations, securing local match and time
-Management including oversight of planning/expenditures
Group 1: NRCS - Provide technical assistance to pland, design and implement BMPs
-Also provide financial assistance to CCSP Farm through Contribution Agreement
Objective 3: CCSP Oureach
Task 9: Education
Groups 1, 3, 4, 5
Task 10: Education
Groups 1, 3, & 5
Milestone Table for WRRPPIP
Task/Responsible Organizations
Objective 1: Staff/BMP's
Task 1: 319 & Office Coordinator

17
Appendix C. Funding Sources
Appendix D. Best Management Practices
Part 1: Funding Sources 2021 2022 2023 2024 2025 Total Cost
60,759.60$ 60,759.60$ 60,759.60$ 60,759.60$ 61,479.60$ 304,518.00$
60,759.60$ 60,759.60$ 60,759.60$ 60,759.60$ 61,479.60$ 304,518.00$
1,000.00$ 1,000.00$ 1,000.00$ 1,000.00$ 1,000.00$ 5,000.00$
8,000.00$ 8,000.00$ 8,000.00$ 8,000.00$ 8,000.00$ 40,000.00$
31,506.40$ 31,506.40$ 31,506.40$ 31,506.40$ 31,986.40$ 158,012.00$
40,506.40$ 40,506.40$ 40,506.40$ 40,506.40$ 40,986.40$ 203,012.00$
101,266.00$ 101,266.00$ 101,266.00$ 101,266.00$ 102,466.00$ 507,530.00$
1) Wild Rice SCD
2) Landowners
3) CCSP (In-Kind)
Subtotal
Total
EPA Section 319 Funds
WRRPPIP - Budget Table
1) FY 2021 Funds
State/Local Match
Subtotal
19
340
342
351
380
382
390
391
393
412
512
516
550
610
614
638
642
WRRPPIP - BMP's
Projected BMP List
Cover Crops
Critical Area Planting
Well Decommissioning
Salinity & Sodic Soil Management
Trough and Tank
Well
Riaprian Forest Buffer
Septic System Renovation
Riparian Herbaceous Cover
Filter Strip
Grassed Waterway
Pasture & Hayland Planting
Pipeline
Range Planting
Windbreak/Shelterbelt Establishment
Fencing
Water & Sediment Control Basin

18
Appendix E. Budget Table
Appendix F. CCSP Background
The Conservation Cropping Systems Project (CCSP) board is composed of local producers representing
counties with the targeted region from both sides of the ND - SD border. Professionals from
agricultural research, as well as natural resources conservation agencies, and non-profit interest groups
will assist the directing board with technical advice and support. The projects activities take place on
two demonstration sites. The first is located 3 miles south of Oakes, ND and the other producer is
located 2 miles southeast of Milnor.
The mission of the Conservation Cropping Systems Project is to evaluate and demonstrate profitable
crop rotations and crop management strategies that are uniquely adapted to the local climate. These
strategies will strive to protect the natural resources of southeast North Dakota and northeast South
Dakota through research, demonstration and education. The most unique thing about the CCSP Farm is
that it is not only broadly supported by SCD’s across southeast North Dakota and northeast South
Dakota; but it is also supported by many ag-related businesses locally which really increase buy-in
from the local community. If you look at Appendix G, we have created a summary of our In-Kind and
Cash donations from 2019 for the CCSP Farm which we have used to estimate In-Kind for the CCSP
Farm over the next five years.
Year 2 Total Cost Year 3 Total Cost Year 4 Total Cost Year 5 Total Cost 319 Funds
7/22-6/23 7/23-6/24 7/24-6/25 7/25-6/26
56,000.00$ 56,000.00$ 56,000.00$ 56,000.00$ 168,000.00$
9,000.00$ 9,000.00$ 9,000.00$ 9,000.00$ 27,000.00$
500.00$ 500.00$ 500.00$ 500.00$ 1,500.00$
500.00$ 500.00$ 500.00$ 500.00$ 1,500.00$
1,200.00$ 1,200.00$ 1,200.00$ 1,200.00$ 3,600.00$
1,200.00$ 1,200.00$ 1,200.00$ 1,200.00$ 3,600.00$
500.00$ 500.00$ 500.00$ 500.00$ 1,500.00$
1,500.00$ 1,500.00$ 1,500.00$ 2,700.00$ 5,220.00$
-$ -$
500.00$ 500.00$ 500.00$ 500.00$ 1,500.00$
5,000.00$ 5,000.00$ 5,000.00$ 5,000.00$ 15,000.00$
75,900.00$ 75,900.00$ 75,900.00$ 77,100.00$ 228,420.00$
10,000.00$ 10,000.00$ 10,000.00$ 10,000.00$ 30,000.00$
6,000.00$ 6,000.00$ 6,000.00$ 6,000.00$ 18,000.00$
4,000.00$ 4,000.00$ 4,000.00$ 4,000.00$ 12,000.00$
20,000.00$ 20,000.00$ 20,000.00$ 20,000.00$ 60,000.00$
300.00$ 300.00$ 300.00$ 300.00$ 900.00$
300.00$ 300.00$ 300.00$ 300.00$ 900.00$
4,400.00$ 4,400.00$ 4,400.00$ 4,400.00$ 13,200.00$
666.00$ 666.00$ 666.00$ 666.00$ 1,998.00$
5,066.00$ 5,066.00$ 5,066.00$ 5,066.00$ 15,198.00$
101,266.00$ 101,266.00$ 101,266.00$ 102,466.00$ 304,518.00$
60,759.60$ 60,759.60$ 60,759.60$ 61,479.60$
40,506.40$ 40,506.40$ 40,506.40$ 40,986.40$
Total 319/Non-Federal Budget 101,266.00$ 507,530.00$ 203,012.00$
3,330.00$ 1,332.00$
Subtotal 5,066.00$ 25,330.00$ 10,132.00$
-$
J. Training 500.00$ 2,500.00$
K. Administration Asst. - .1 FTE 5,000.00$
BMP's : See Appendix D For Examples of BMP's
Outreach
20,000.00$
12,000.00$
Subtotal 20,000.00$ 100,000.00$
Task 5. Riparian 10,000.00$ 50,000.00$
In-Kind/Match
E. Rent/Utilities 1,200.00$ 6,000.00$
F. Communications 1,200.00$ 6,000.00$
G. Equipment 500.00$ 2,500.00$
9,000.00$ 45,000.00$
C. Travel, Food, Lodging 500.00$ 2,500.00$
D. Supplies 500.00$ 2,500.00$
WRRPPIP - Budget Table
1,000.00$
-$
1,000.00$
10,000.00$
152,280.00$
112,000.00$
18,000.00$
1,000.00$
1,000.00$
2,400.00$
2,400.00$
7/21-6/22
Sect 319/Non-Fed Year 1 Total Cost Total Cost
A. Personnel - 1 FTE 56,000.00$ 280,000.00$
B. Fringe Benefits
Personnel/Support - Tasks 1 - 4
Section 319 Funds per year
Total local match per year
60,759.60$
40,506.40$
20,000.00$
*Additional BMP Dollars may be provided through partners (NDGF, Pheasants Forever, Ducks Unlimited, etc.) or requested from NDDEQ as needed
Subtotal 300.00$ 1,500.00$
8,800.00$
600.00$
8,000.00$
40,000.00$
600.00$
Task 8. Meetings/Outreach Events 300.00$ 1,500.00$
H. Consultant/Contractual 1,500.00$ 3,480.00$ 8,700.00$
Task 11: Conservation BMP's 666.00$
25,000.00$
Subtotal 75,900.00$ 380,700.00$
Task 9: Field Demo Events 4,400.00$ 22,000.00$
Task 6. Cropland 6,000.00$ 30,000.00$
Task 7. Grazing/Manure Mgmnt 4,000.00$
CCSP Farm: See Appendix G for CCSP Estimated Match/In-Kind and Appendix H for Task 8 Budget
I. Other -$

19
Since moving away from the Forman site, the Conservation Cropping System Project has been focused
on using larger plots within producer’s active operations. This allows us to take what we have learned
in the past years on small research plots and engage producers in trying BMP’s that CCSP and the
producer feel may provide soil health and water quality benefits on their operation. The large plots will
be more efficient to work with, better for weed control, and less likely to have herbicide drift issues as
well as provide more of a real-world example for the implementation of practices. Rotations
implemented all try to towards having a 365-day living root. Rotations that have been used to
accomplish this are full season cover crops for grazing on what has been wet cropland (PP),
experimenting with broadcast seeding different cover crops at different rates on corn/soybeans, and
interseeding cover crops into corn planted on 60” corn rows.
Appendix G. CCSP Match Table
Appendix H. CCSP – NRCS Grant Table
Time Towards Project
CCSP Farm Summary of In-Kind and Cash Donations for WRRPPIP
Millborn Seed
Titan
Cooperator
Totals
Tractor
Fertilizer/Herbicide
Cover Crop Seed
5,000.00$
32,500.00$
500.00$
20,000.00$
4,500.00$ Financial Support
Donor / Organization Name Match ItemMatch Donation
Wild Rice SCD
Agtegra 2,500.00$
Projected off of Numbers from last year
Producer Match / In-Kind Total Grant
37,100.00$ 123,180.00$
33,100.00$ 115,838.00$
19,700.00$ 89,000.00$
37,100.00$ 123,180.00$
127,000.00$ 451,198.00$
Total Match/In-Kind
Grant Totals
61,590.00$
57,919.00$
44,500.00$
61,590.00$
225,599.00$
24,490.00$
24,819.00$
24,490.00$
24,800.00$
98,599.00$
CCSP Budget Table
NRCS Grant Funds Requested CCSP Cash Match / In-KInd Provided Grant Year
1
2
3
4
225,599.00$

20
Appendix I. CCSP Site Maps
Map above is site SE of Milnor; Map below is site S of Oakes
79.3 acres
Borg Lake
30 ac.
10 ac.
NDSUOakes Irrigation Research Site

21
Appendix J. Wild Rice River Water Quality Data
Figure 1. 4 STORET Locations and USGS River Gauging Station
385234
385575
380006
385573
Only 4 sites that contain data between 2010 – 2020
Data in all 4 sites were only between 2011 -2014
All 4 sites have 150+ in their data setUSGS
05051600 WILD RICE RIVER NR RUTLAND
Only 1 USGS site that contains flow data
Figure 2. Flow Rate Vs. Total Nitrogen @ 385575 (Upstream)
0
0.5
1
1.5
2
2.5
3
3.5
0
50
100
150
200
250
300
350
400
450
500
January 26, 2013
May 6, 2013
Augu
st 14, 2013
No
vember 22, 2013
March
2, 2014
June 10, 2014
Septem
ber 18, 2014
Decem
ber 27, 2014
Tota
l Nit
roge
n (m
g/L)
CFS
Flow Rate (CFS) vs. Total Nitrogen at Site 385575
Flow @ 50515000
385575 Reference line (box) for IBI Reference Site, Eco Zone 26,Concentrations for Total Nitrogen andTotal Phosphorus
Most Disturbed

22
Figure 3. Flow Rate Vs. Total Nitrogen @ 385573 (Mid-stream)
0
0.5
1
1.5
2
2.5
3
3.5
0
50
100
150
200
250
300
350
400
450
500
March
17, 2013
May 6, 2013
June 25, 2013
Augu
st 14, 2013
Octo
ber 3, 2013
No
vember 22, 2013
January 11, 2014
March
2, 2014
April 21, 2014
June 10, 2014
July 30, 2014
Septem
ber 18, 2014
No
vember 7, 2014
Tota
l Nit
roge
n (m
g/L)
CFS
Flow Rate (CFS) vs. Total Nitrogen at Site 385573
Flow @ 50515000 385573
Reference line (box) for IBI Reference Site, Eco Zone 26,Concentrations for Total Nitrogen andTotal Phosphorus
Most Disturbed
Figure 4. Flow Rate Vs. Total Nitrogen @ 380006 (Mid-stream)
0
0.5
1
1.5
2
2.5
3
3.5
4
0
50
100
150
200
250
300
350
400
450
500
March
17, 2013
May 6, 2013
June 25, 2013
Augu
st 14, 2013
Octo
ber 3, 2013
No
vember 22, 2013
January 11, 2014
March
2, 2014
April 21, 2014
June 10, 2014
July 30, 2014
Septem
ber 18, 2014
No
vember 7, 2014
Tota
l Nit
roge
n (m
g/L)
CFS
Flow Rate (CFS) vs. Total Nitrogen at Site 380006
Flow @ 50515000
380006
Reference line (box) for IBI Reference Site, Eco Zone 26,Concentrations for Total Nitrogen andTotal Phosphorus
Most Disturbed
23
Figure 5. Flow Rate Vs. Total Nitrogen @ 385234 (Downstream)
Reference line (box) for IBI Reference Site, Eco Zone 26,Concentrations for Total Nitrogen andTotal Phosphorus
Most Disturbed
0
0.5
1
1.5
2
2.5
3
0
50
100
150
200
250
300
350
400
450
500
March
17, 2013
May 6, 2013
June 25, 2013
Augu
st 14, 2013
Octo
ber 3, 2013
No
vember 22, 2013
January 11, 2014
March
2, 2014
April 21, 2014
June 10, 2014
July 30, 2014
Septem
ber 18, 2014
No
vember 7, 2014
Tota
l Nit
roge
n (m
g/L)
CFS
Flow Rate (CFS) vs. Total Nitrogen at Site 385234
Flow @ 50515000
385234
Figure 6. Flow Rate Vs. Total Phosphorus @ 385575 (Upstream)
0.01
0.11
0.21
0.31
0.41
0.51
0.61
0.71
0
50
100
150
200
250
300
350
400
450
500
January 26, 2013
May 6, 2013
Augu
st 14, 2013
No
vember 22, 2013
March
2, 2014
June 10, 2014
Septem
ber 18, 2014
Decem
ber 27, 2014
Tota
l Ph
osp
ho
rus
(mg/
L)
CFS
Flow Rate (CFS) vs. Total Phosphorus at Site 385575
Flow @ 50515000
385575
Reference line (box) for IBI Reference Site, Eco Zone 26,Concentrations for Total Nitrogen andTotal Phosphorus
Most Disturbed

24
Figure 7. Flow Rate Vs. Total Phosphorus @ 385573 (Mid-stream)
0
0.05
0.1
0.15
0.2
0.25
0.3
0.35
0.4
0.45
0.5
0
50
100
150
200
250
300
350
400
450
500
Ma
rch 1
7, 2
01
3
Ma
y 6, 2
01
3
Jun
e 2
5, 2
01
3
Au
gu
st 14
, 20
13
Octo
be
r 3, 2
01
3
No
vem
be
r 22
, 20
13
Jan
ua
ry 11
, 20
14
Ma
rch 2
, 20
14
Ap
ril 21
, 20
14
Jun
e 1
0, 2
01
4
July 3
0, 2
01
4
Sep
tem
be
r 18
, 20
14
No
vem
be
r 7, 2
01
4
To
tal P
ho
sph
oru
s (m
g/L
)
CFS
Flow Rate (CFS) vs. Total Phosphorus at Site 385573
Flow @ 50515000
385573
Reference line (box) for IBI Reference Site, Eco Zone 26,Concentrations for Total Nitrogen andTotal Phosphorus
Most Disturbed
Figure 8. Flow Rate Vs. Total Phosphorus @ 380006 (Mid-stream)
0
0.1
0.2
0.3
0.4
0.5
0.6
0
50
100
150
200
250
300
350
400
450
500
Ma
rch 1
7, 2
01
3
Ma
y 6, 2
01
3
Jun
e 2
5, 2
01
3
Au
gu
st 14
, 20
13
Octo
be
r 3, 2
01
3
No
vem
be
r 22
, 20
13
Jan
ua
ry 11
, 20
14
Ma
rch 2
, 20
14
Ap
ril 21
, 20
14
Jun
e 1
0, 2
01
4
July 3
0, 2
01
4
Sep
tem
be
r 18
, 20
14
No
vem
be
r 7, 2
01
4
To
tal P
ho
sph
oru
s (m
g/L
)
CFS
Flow Rate (CFS) vs. Total Phosphorus at Site 380006
Flow @ 50515000
380006
Reference line (box) for IBI Reference Site, Eco Zone 26,Concentrations for Total Nitrogen andTotal Phosphorus
Most Disturbed
25
Figure 9. Flow Rate Vs. Total Phosphorus @ 385234 (Downstream)
Reference line (box) for IBI Reference Site, Eco Zone 26,Concentrations for Total Nitrogen andTotal Phosphorus
Most Disturbed
0
0.1
0.2
0.3
0.4
0.5
0.6
0.7
0.8
0.9
1
0
50
100
150
200
250
300
350
400
450
500
March
17, 2013
May 6, 2013
June 25, 2013
Augu
st 14, 2013
Octo
ber 3, 2013
No
vember 22, 2013
January 11, 2014
March
2, 2014
April 21, 2014
June 10, 2014
July 30, 2014
Septem
ber 18, 2014
No
vember 7, 2014
Tota
l Ph
osp
ho
rus
(mg/
L)
CFS
Flow Rate (CFS) vs. Total Phosphorus at Site 385234
Flow @ 50515000
385234
Figure 10. Flow Rate Vs. Total Suspended Solids @ 385575 (Upstream)
0
50
100
150
200
250
300
0
50
100
150
200
250
300
350
400
450
500
January 26, 2013
May 6, 2013
Augu
st 14, 2013
No
vember 22, 2013
March
2, 2014
June 10, 2014
Septem
ber 18, 2014
Decem
ber 27, 2014
Tota
l Su
spen
ded
So
lids
(mg/
L)
CFS
Flow Rate (CFS) vs. Total Suspended Solids at Site 385575
Flow @ 50515000
Series2
NDDEQ guidelines for
Maximum amounts:
• TSS is set at 35 mg/L

26
Figure 11. Flow Rate Vs. Total Suspended Solids @ 385573 (Mid-stream)
0
50
100
150
200
250
0
50
100
150
200
250
300
350
400
450
500
March
17
, 20
13
May 6
, 20
13
Jun
e 25
, 20
13
Au
gust 1
4, 2
01
3
Octo
ber 3
, 20
13
No
vemb
er 22
, 20
13
Janu
ary 11
, 20
14
March
2, 2
01
4
Ap
ril 21
, 20
14
Jun
e 10
, 20
14
July 3
0, 2
01
4
Septem
ber 1
8, 2
01
4
No
vemb
er 7, 2
01
4
Tota
l Su
spen
ded
So
lids
(mg/
L)
CFS
Flow Rate (CFS) vs. Total Suspended Solids at Site 385573
Flow @ 50515000
385573
NDDEQ guidelines for
Maximum amounts:
• TSS is set at 35 mg/L
Figure 12. Flow Rate Vs. Total Suspended Solids @ 380006 (Mid-stream)
0
20
40
60
80
100
120
140
0
50
100
150
200
250
300
350
400
450
500
March
17
, 20
13
May 6
, 20
13
Jun
e 2
5, 2
01
3
Au
gust 1
4, 2
01
3
Octo
ber 3
, 20
13
No
vem
be
r 22
, 20
13
Janu
ary 11
, 20
14
March
2, 2
01
4
Ap
ril 21
, 20
14
Jun
e 1
0, 2
01
4
July 3
0, 2
01
4
Sep
tem
ber 1
8, 2
01
4
No
vem
be
r 7, 2
01
4
Tota
l Su
spe
nd
ed
So
lids
(mg/
L)
CFS
Flow Rate (CFS) vs. Total Suspended Solids at Site 380006
Flow @ 50515000
380006
NDDEQ guidelines for
Maximum amounts:
• TSS is set at 35 mg/L
27
Figure 13. Flow Rate Vs. Total Suspended Solids @ 385234 (Downstream)
0
20
40
60
80
100
120
140
160
180
200
0
50
100
150
200
250
300
350
400
450
500
March
17, 2013
May 6, 2013
June 25, 2013
Augu
st 14, 2013
Octo
ber 3, 2013
No
vember 22, 2013
January 11, 2014
March
2, 2014
April 21, 2014
June 10, 2014
July 30, 2014
Septem
ber 18, 2014
No
vember 7, 2014
Tota
l Su
spen
ded
So
lids
(mg/
L)
CFS
Flow Rate (CFS) vs. Total Suspended Solids at Site 385234
Flow @ 50515000
385234
NDDEQ guidelines for
Maximum amounts:
• TSS is set at 35 mg/L