project risk management basics: cost and schedule · pdf filethrough management of life cycle...
TRANSCRIPT
1
Project Risk Management Basics:Cost and Schedule Impacts
CSVA 2011 ConferenceToronto, OntarioNov 14 -16, 2011
Robert E. Rocco

Contents
• Background
• Fundamentals
• Process
• Tools/Supporting Documentation
• Risk Register
• Introduction to Quantitative Analysis
• Contingency Management
• Questions
Risk Management Background
What is Risk?
• A risk is something that may happen, and if it does, will have either apositive or negative impact on the project
• Risk is an uncertain event that, if it occurs, has an effect on at leastone project objective (e.g., time, cost, scope, quality – PMI 2004)
Consideration: There are one or more active conditions that influence the risk’sprobability of occurrence and one or more response conditions that influencethe risk’s impact

What is Risk Management?
• An intuitive process
• A “good management practice” tool to enhance the chances for anendeavor’s success
• A systematic, disciplined process that satisfies strategic objectivesthrough management of life cycle risks
Experienced Project Manager
• Risk Management?
• I’ve Always Done That!
• What do they want me to do differently?
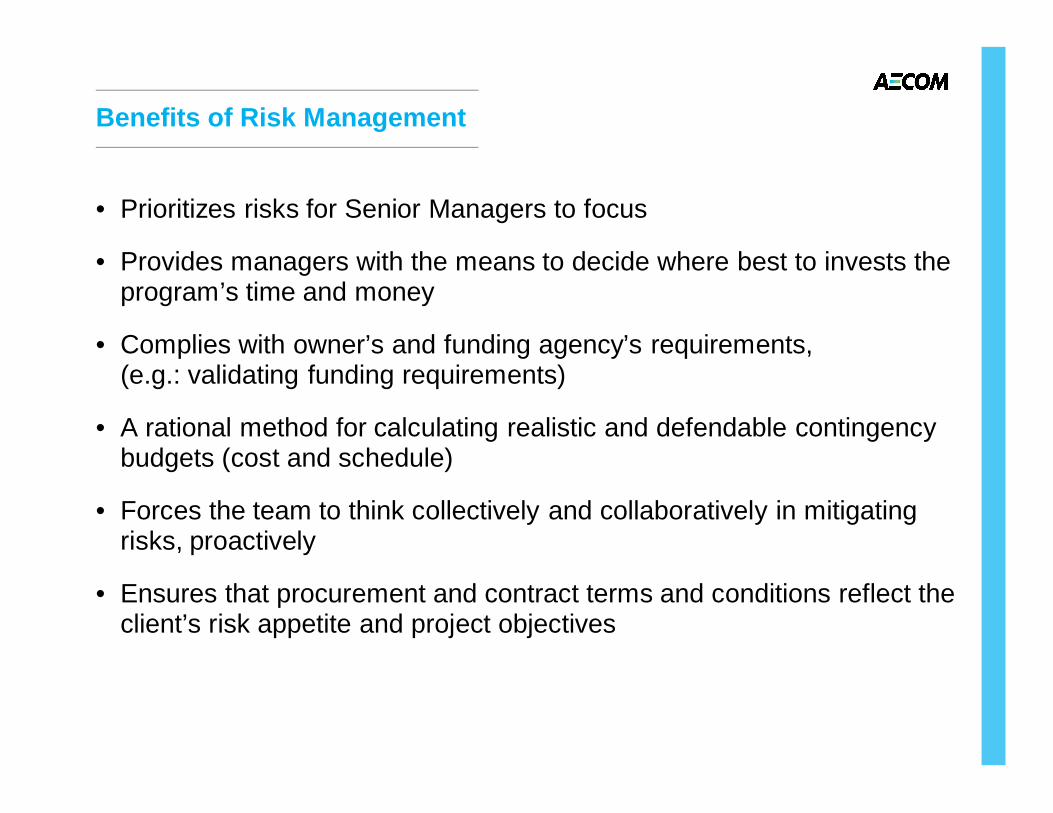
Benefits of Risk Management
• Prioritizes risks for Senior Managers to focus
• Provides managers with the means to decide where best to invests theprogram’s time and money
• Complies with owner’s and funding agency’s requirements,(e.g.: validating funding requirements)
• A rational method for calculating realistic and defendable contingencybudgets (cost and schedule)
• Forces the team to think collectively and collaboratively in mitigatingrisks, proactively
• Ensures that procurement and contract terms and conditions reflect theclient’s risk appetite and project objectives

Core to AECOM Program Management
• AECOM’s Risk Management practice is guided by:– “Practice Standard for Project Risk Management” Project
Management Institute (PMI)– ISO 31000:2009 “Risk Management - Principles and Guidelines”– Practical experience managing over 200 capital programs with total
Capex of over US$340 billion
• AECOM has applied Risk Management to capital programs with Capexvalues of approximately US$100 billion.

Risk Management Experience in Capital Programs
Program Value (US $ millions)Second Avenue Subway, New York, USA $16,000PATH Permanent World Trade Center Terminal, New York, USA $2,000Dallas Area Rapid Transit Airport Extension, Dallas, USA $300Dallas Area Rapid Transit Extension-Rowlett, Dallas, USA $300Lincoln Center Redevelopment, New York, USA $750San Diego International Airport Terminal Expansion, San Diego, USA $1,000Amtrak Vent Structures, New York, USA $100Central Corridor Light Rail Transit, Minneapolis, USA $1,000Route 9A West Reconstruction, New York, USA $100Tappan Zee Bridge Environmental Review, New York, USA $5,000Central Subway, Phase 2, San Francisco, USA $1,500Water Improvement Program, PUC, San Francisco, USA $4,500National Network of Highways Program, Trinidad and Tobago $4,000Afghanistan Infrastructure and Rehabilitation Program, Afghanistan $150Doha Port Qatar, Qatar $7,000Capital District Infrastructure Project, Abu Dhabi, UAE $20,000Saadiyat Island Cultural District, Abu Dhabi, UAE $20,000Abu Dhabi Metro, Abu Dhabi, UAE $5,000
The Fundamentals
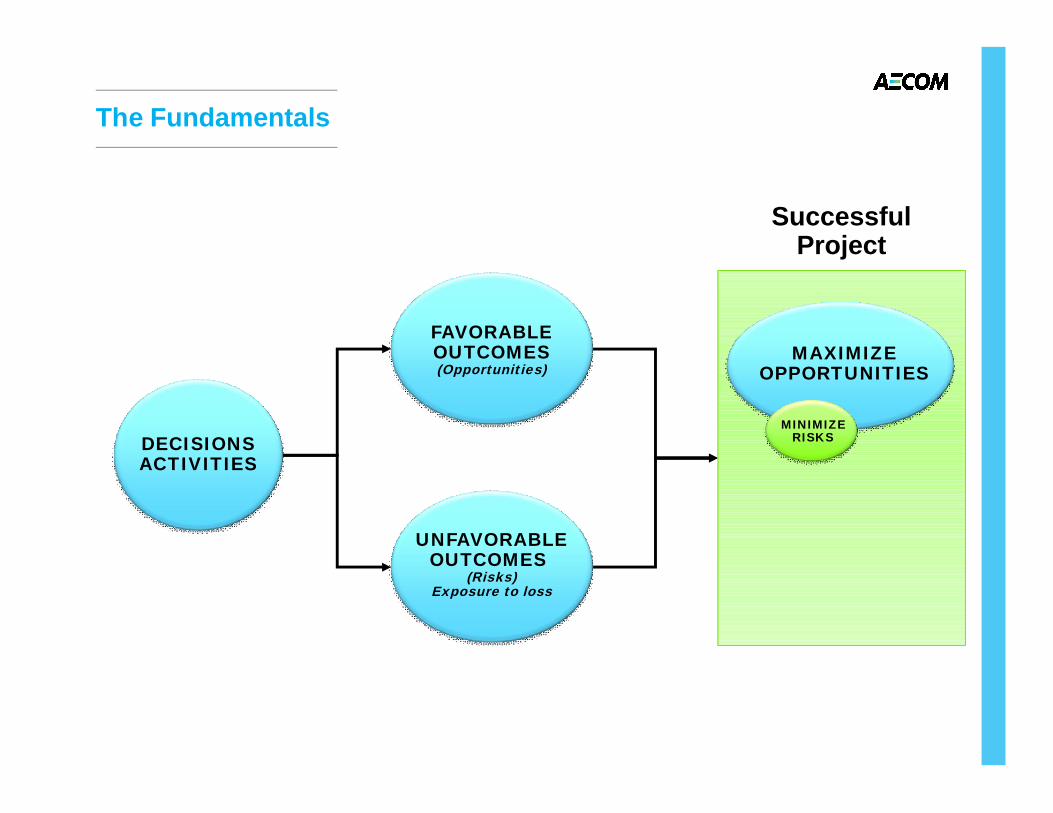
The Fundamentals
DECISIONSACTIVITIES
FAVORABLEOUTCOMES(Opportunities)
UNFAVORABLEOUTCOMES
(Risks)Exposure to loss
SuccessfulProject
MAXIMIZEOPPORTUNITIES
MINIMIZERISKS
DECISIONSACTIVITIES
FAVORABLEOUTCOMES(Opportunities)
UNFAVORABLEOUTCOMES
(Risks)Exposure to loss
SuccessfulProject
MAXIMIZEOPPORTUNIT
IESMINIMIZE
RISKS
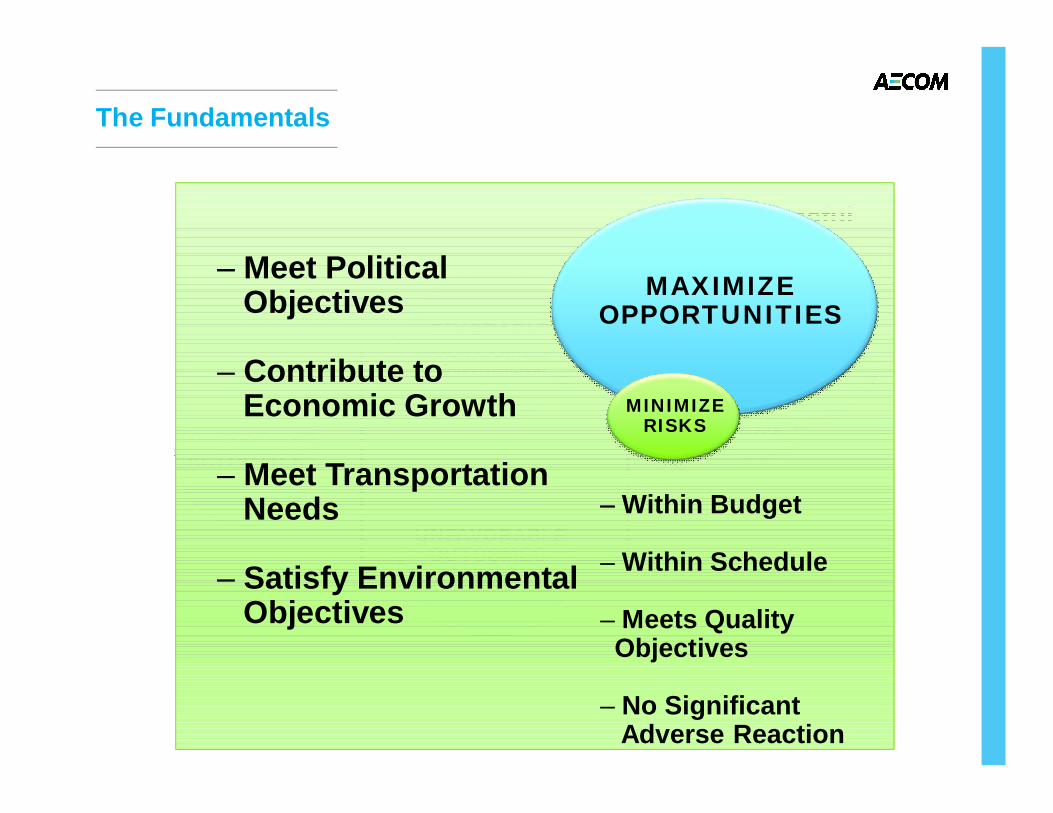
The Fundamentals
MAXIMIZEOPPORTUNITIES
MINIMIZERISKS
–– Within Budget
– Within Schedule
– Meets QualityObjectives
– No SignificantAdverse Reaction
–– Meet PoliticalObjectives
– Contribute toEconomic Growth
– Meet TransportationNeeds
– Satisfy EnvironmentalObjectives
The Process
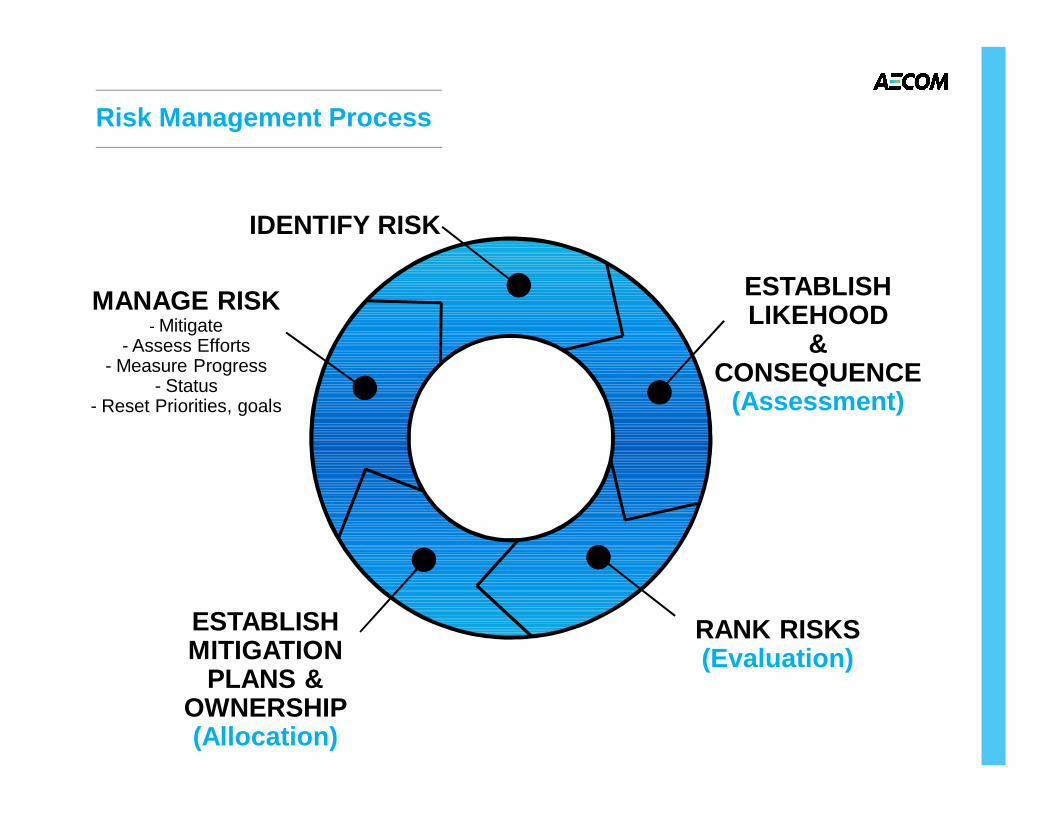
Risk Management Process
IDENTIFY RISK
ESTABLISHLIKEHOOD
&CONSEQUENCE
(Assessment)
RANK RISKS(Evaluation)
ESTABLISHMITIGATION
PLANS &OWNERSHIP(Allocation)
MANAGE RISK- Mitigate
- Assess Efforts- Measure Progress
- Status- Reset Priorities, goals
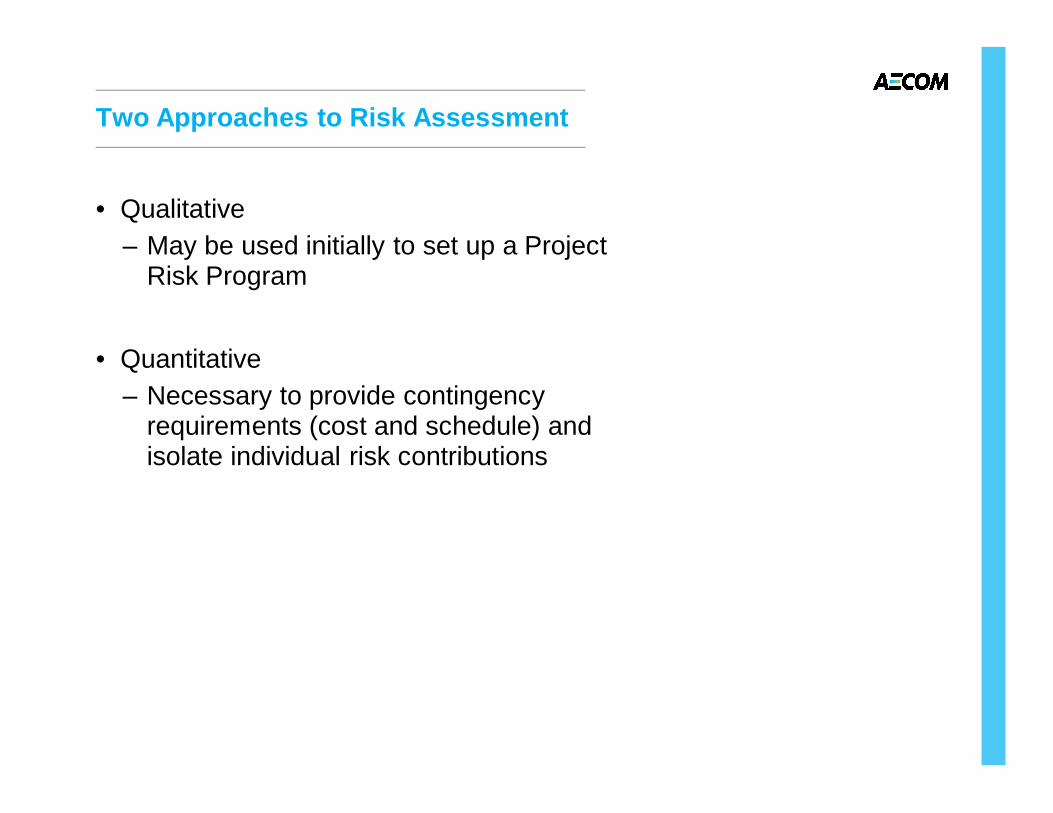
Two Approaches to Risk Assessment
• Qualitative– May be used initially to set up a Project
Risk Program
• Quantitative– Necessary to provide contingency
requirements (cost and schedule) andisolate individual risk contributions

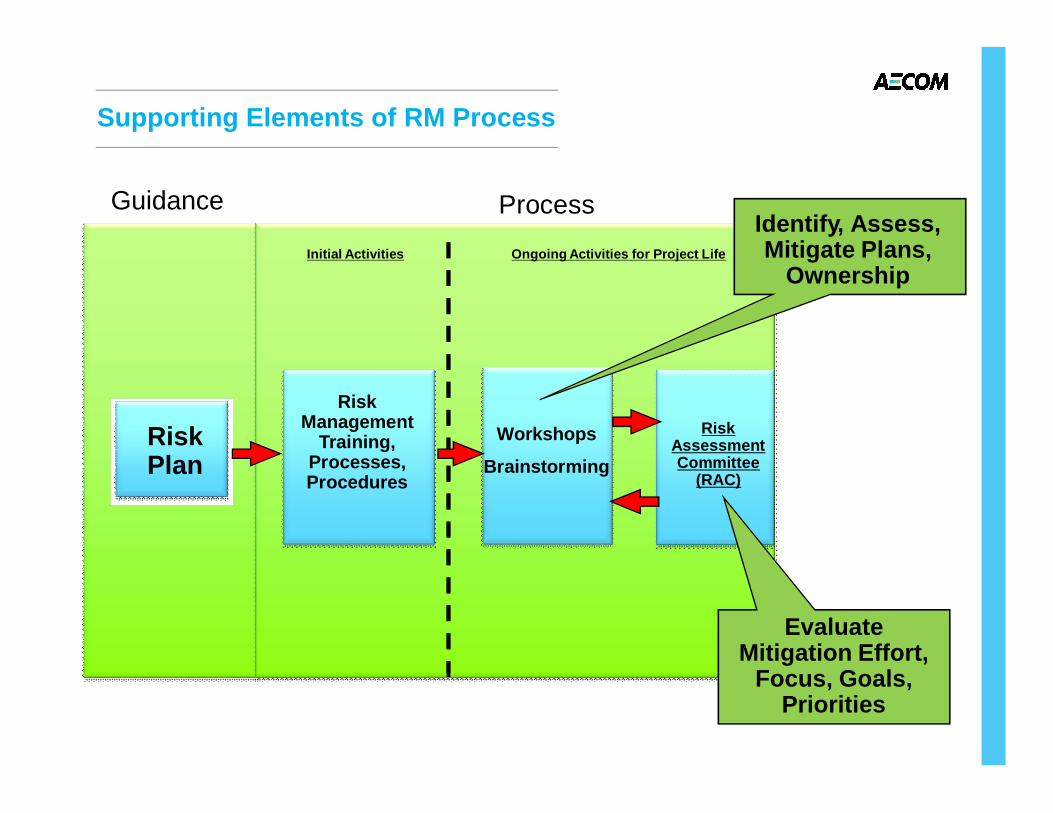
Supporting Elements of RM Process
Guidance
RiskPlan
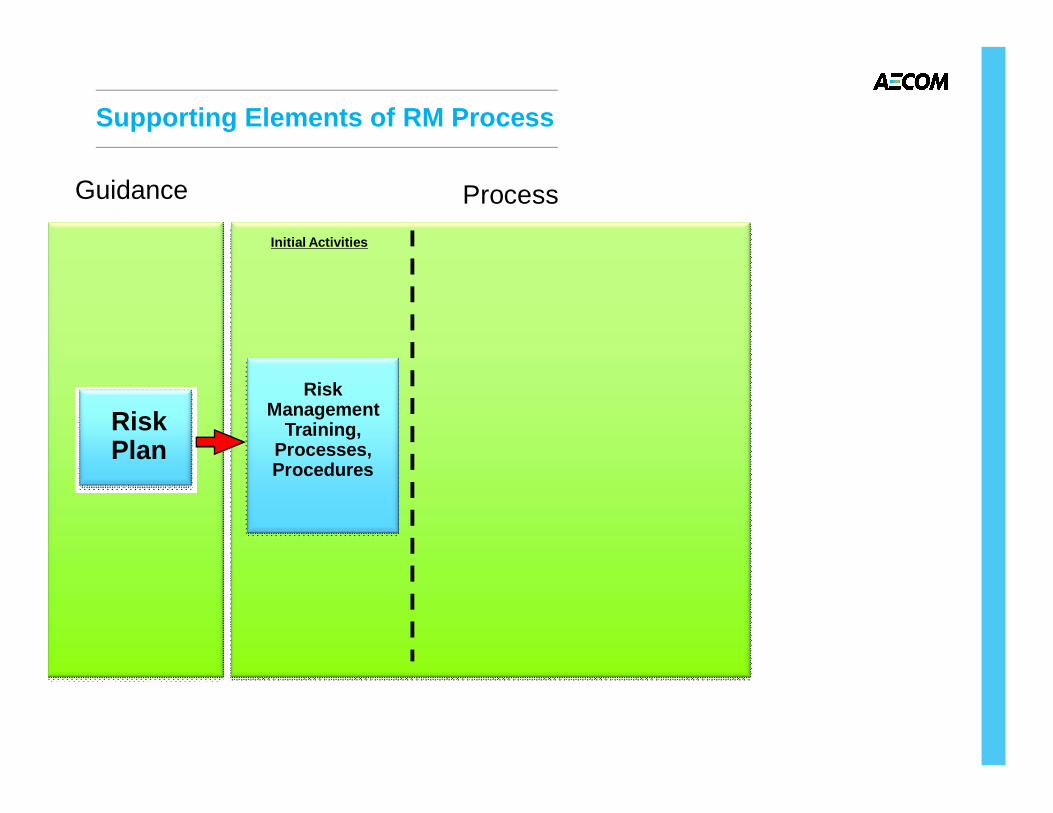
Guidance
RiskPlan
Process
RiskManagement
Training,Processes,Procedures
Initial Activities
Supporting Elements of RM Process
Guidance
RiskPlan
Process
RiskManagement
Training,Processes,Procedures
Initial Activities
RiskAssessmentCommittee
(RAC)
Ongoing Activities for Project Life
Workshops
Brainstorming
Supporting Elements of RM Process
Identify, Assess,Mitigate Plans,
Ownership
EvaluateMitigation Effort,
Focus, Goals,Priorities

Supporting Elements of RM Process
Guidance
RiskPlan
Process
RiskManagement
Training,Processes.Procedures
Initial Activities
RiskAssessmentCommittee
(RAC)
Ongoing Activities for Project Life
Workshops
Brainstorming
AssessmentGroup Reports• MeasuredReduction ofRisk
• Action Items
• Cost/ScheduleConfidence Levels
• Cost Contingencyand schedule floatmanagement
Output
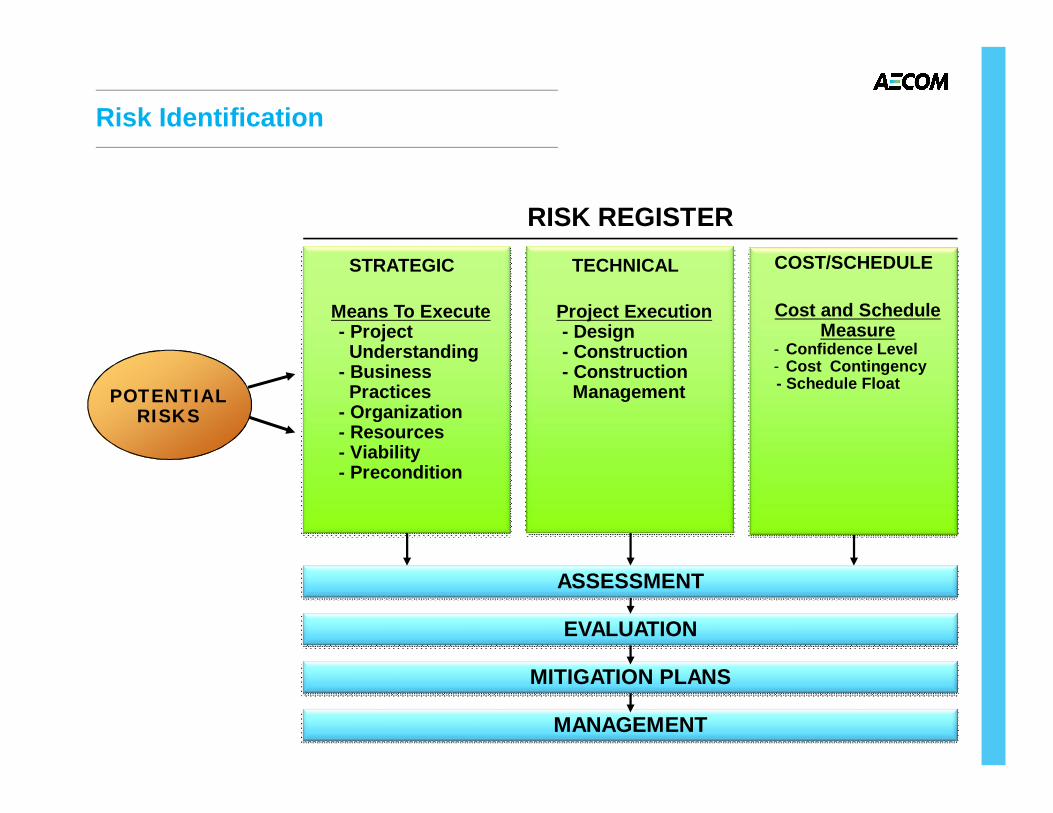
POTENTIALRISKS
ASSESSMENT
EVALUATION
MITIGATION PLANS
STRATEGIC TECHNICAL COST/SCHEDULE
Means To Execute- Project
Understanding- Business
Practices- Organization- Resources- Viability- Precondition
Project Execution- Design- Construction- Construction
Management
Cost and ScheduleMeasure
- Confidence Level- Cost Contingency- Schedule Float
RISK REGISTER
Risk Identification
MANAGEMENT

Tools for Risk Identification
• Interviews
• Project Team workshops
• Brainstorming
• Project documents review
• Risk Breakdown Structure
• Check lists
• Cause and effect diagrams
• Questionnaire
• SWOT analysis
• Industry knowledge base
• Influence diagrams
• Post-project review / lessonslearned / historical information
• Root-cause analysis
• Force field analysis
• List of assumptions andconstrains
• Delphi technique (anonymouspolling)
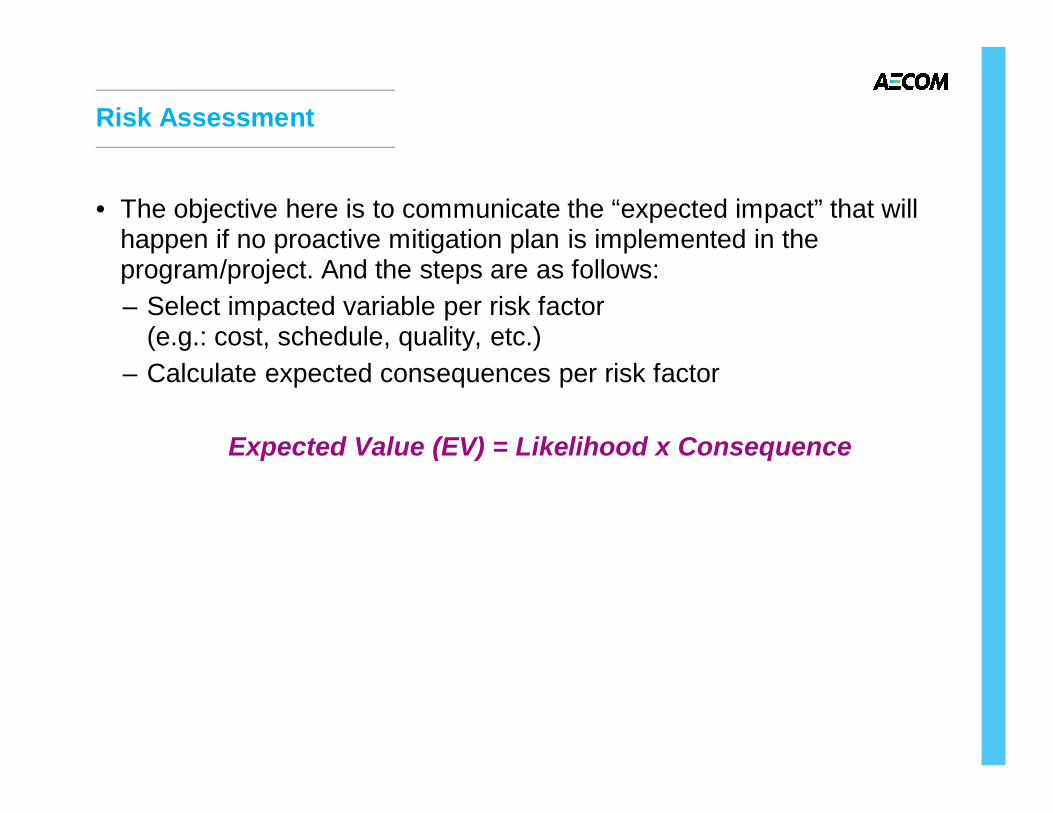
Risk Assessment
• The objective here is to communicate the “expected impact” that willhappen if no proactive mitigation plan is implemented in theprogram/project. And the steps are as follows:– Select impacted variable per risk factor
(e.g.: cost, schedule, quality, etc.)– Calculate expected consequences per risk factor
Expected Value (EV) = Likelihood x Consequence
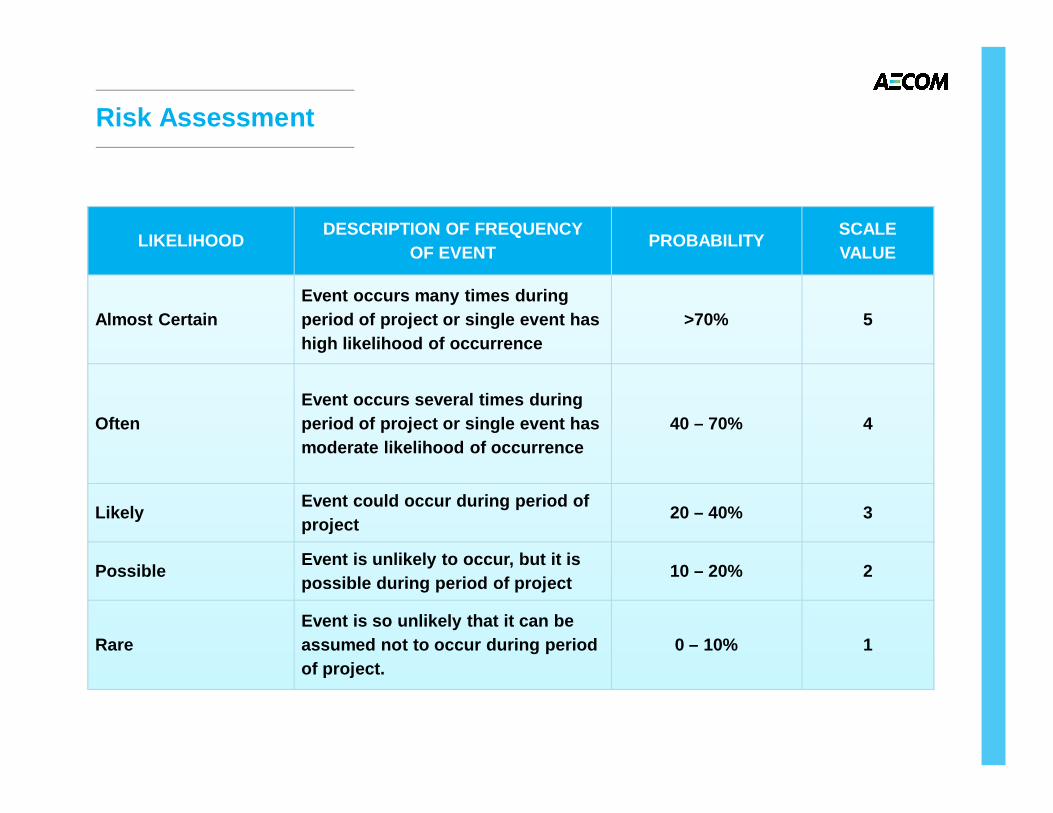
Risk Assessment
LIKELIHOOD DESCRIPTION OF FREQUENCYOF EVENT
PROBABILITY SCALEVALUE
Almost CertainEvent occurs many times duringperiod of project or single event hashigh likelihood of occurrence
>70% 5
OftenEvent occurs several times duringperiod of project or single event hasmoderate likelihood of occurrence
40 – 70% 4
Likely Event could occur during period ofproject
20 – 40% 3
Possible Event is unlikely to occur, but it ispossible during period of project
10 – 20% 2
RareEvent is so unlikely that it can beassumed not to occur during periodof project.
0 – 10% 1

Risk Assessment
CONSEQUENCE
DESCRIPTION OF EFFECT OF EVENTCOST
(INMILLIONS)
SCHEDULE SAFETYPROJECT PERCEPTION/POLITICAL REACTION
SCALEVALUE
Catastrophic Adds up to$250
Adds 12months
Multiple publicaccidents
Public perception very poor.Project seriously jeopardized.Serious political consequence to-- Owner
5
Major Adds up to$100
Adds 6months
Single publicaccident andmultiple workforceaccidents
Project jeopardized. Requiresconsiderable effort to regrouppublic/political support
4
Moderate Adds up to$50
Adds 4months
Single publicaccident ormultiple workforceaccidents
Some concern for projectviability. Some politicalconsequence experienced byOwner. Moderate effort requiredto re-establish viability.
3
MinorAdds up to
$25Adds 2months
Single workforceaccident
Minor concern for projectviability and effect on Ownerpolitically
2
Insignificant Adds up to$10
Adds 1month
Little possibility ofaccident
Little or no concern for projectviability and effect on Ownerpolitically
1

Traditional Practice of Risk Ranking
CONSEQUENCE
PROBABILITYINSIGNIFICANT
(1) MINOR (2) MODERATE(3) MAJOR (4) CATASTROPHIC
(5)
RARE (1) 1 2 3 4 5
POSSIBLE (2) 2 4 6 8 10
LIKELY (3) 3 6 9 12 15
OFTEN (4) 4 8 12 16 20
ALMOST CERTAIN (5) 5 10 15 20 25

Risk Allocation
• Mitigate
• Transfer (e.g.: Share, Insurance)
• Accept
• Avoid
Identify party best able to implement the allocation
Manage Risk
• Primary Risk MitigationThis is the risk mitigation accomplished by implementing the riskmitigations placed in the Risk Register.
• Secondary MitigationThese are the items identified in advance by the project aspossible areas in which to reduce scope in an effort to savemoney or time to replenish contingency (cost and/or schedule)that is being used more rapidly than planned.
Tools/SupportingDocumentation

Risk ManagementPlan
Risk Identification• Workshops
• Informal process
Risk Assessmentand Evaluation
Risk ManagementRisk Mitigation Meetings
Risk Assessment Committee• Approve Allocations• Direct, evaluate mitigations• Change L,C• Secondary Mitigations
Risk Register• Risks• Mitigation Strategies• Allocation
- Mitigate- Transfer- Accept- Avoid
• Status
Risk: OwnershipMitigation Strategies
Allocations
Risk MitigationReport
Risk Mitigation Status logsSupporting documentation
Risk Program Documents
ContingencyManagement
• Reporting• Remedies

Risk Mitigation Meetings
• Risk Mitigation Meetings
– Regular interval (monthly)
– Includes key project personnel
– Establish priority risks and place on the agenda
– Minutes capture essential risk / mitigation discussions
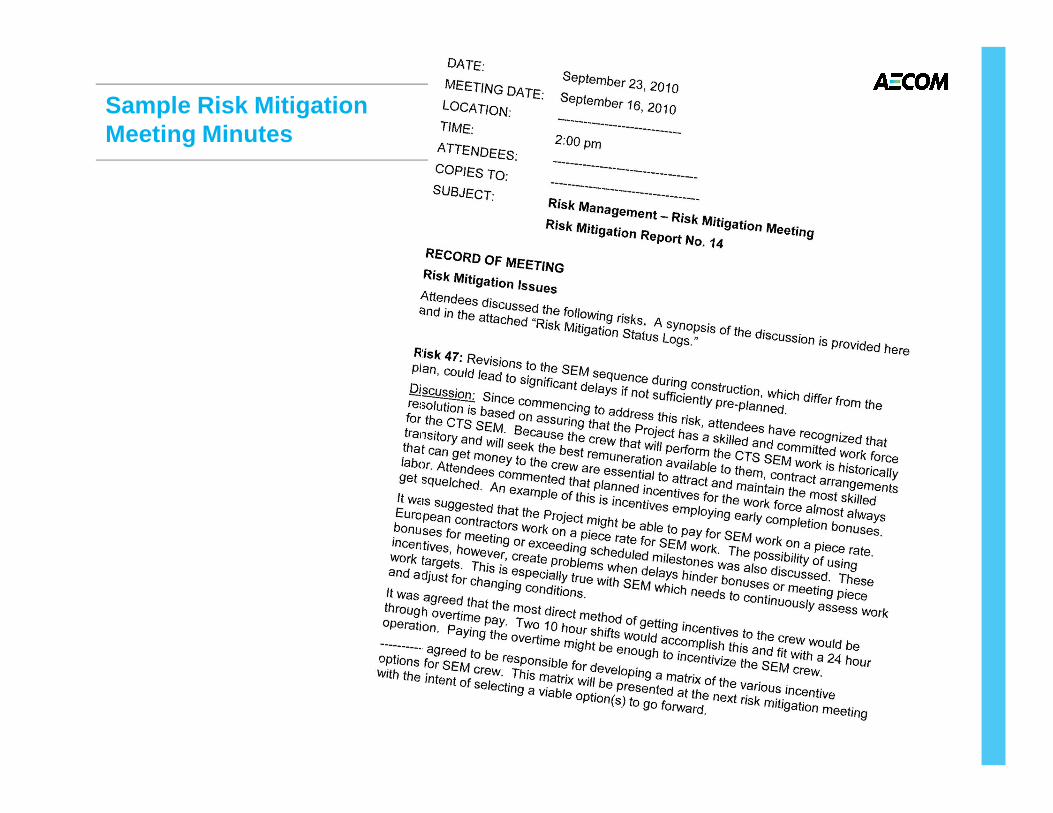
Sample Risk MitigationMeeting Minutes

Risk Mitigation Status Log
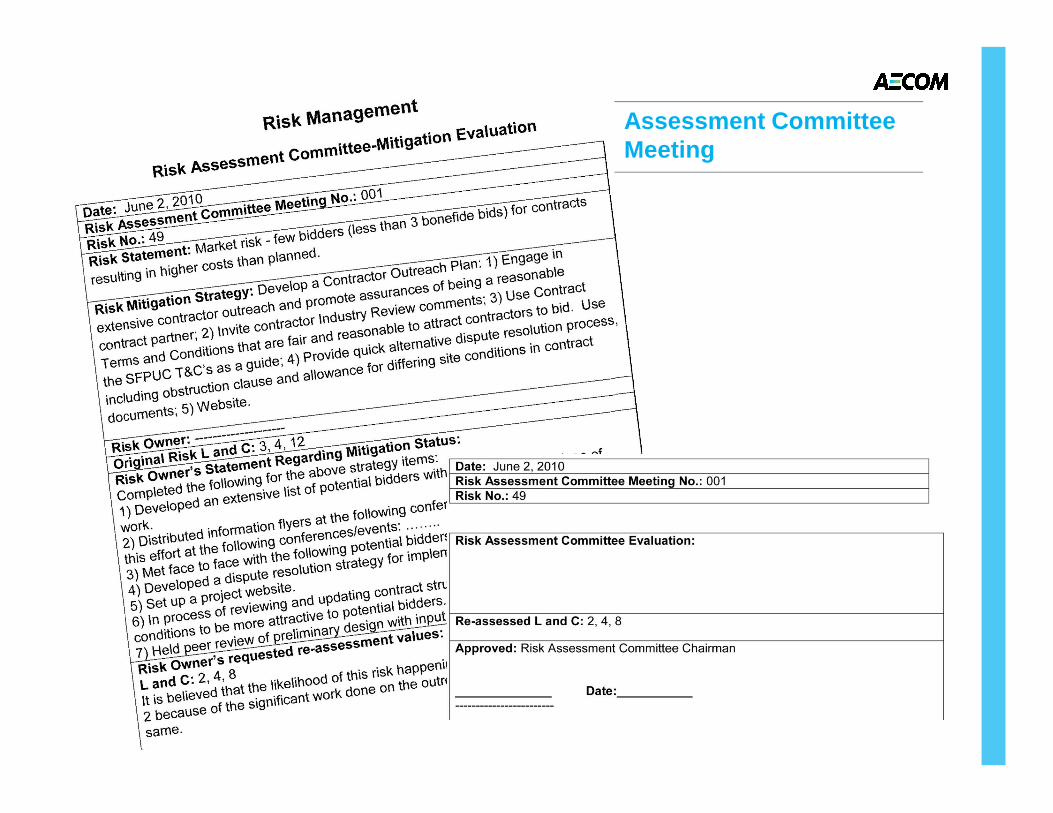
Assessment CommitteeMeeting

Risk Register

Sample Risk Register

Quantitative Analysis

Risk Analysis
• Provides confidence level for cost estimate and schedule
• Rational approach to establish cost contingency and schedule float
• Means to manage contingency and float
• Addresses oversight agency requirements
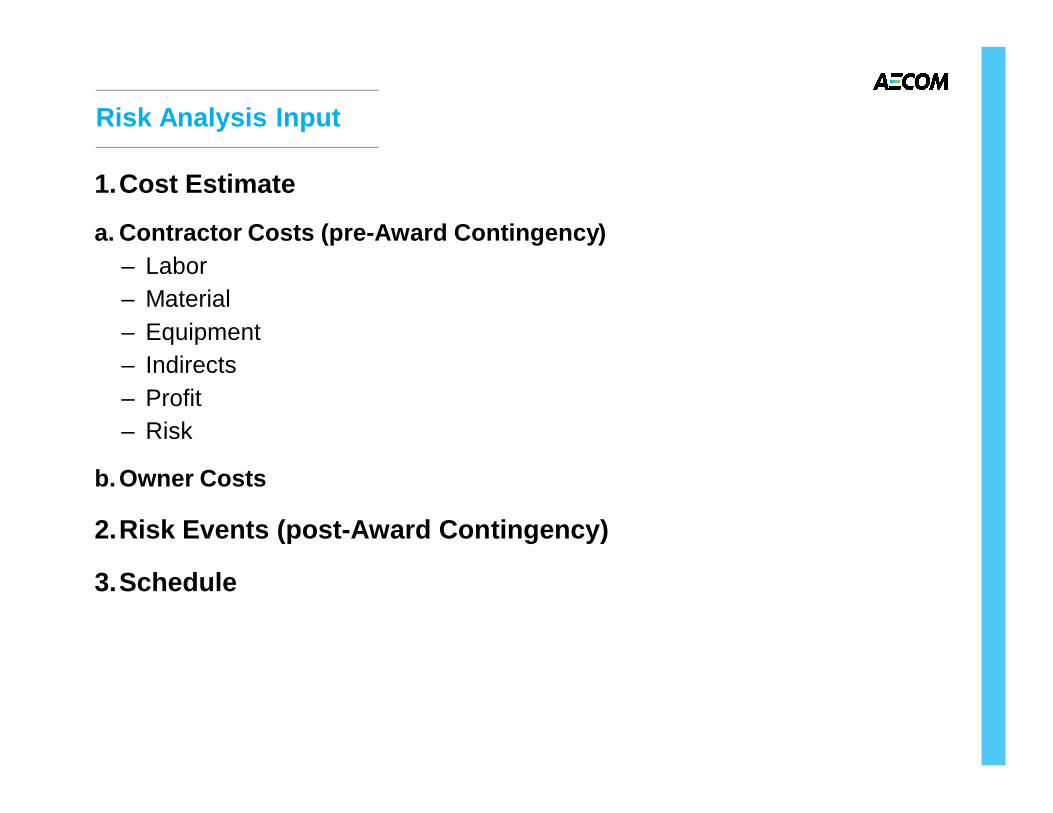
Risk Analysis Input
1.Cost Estimate
a. Contractor Costs (pre-Award Contingency)– Labor– Material– Equipment– Indirects– Profit– Risk
b.Owner Costs
2.Risk Events (post-Award Contingency)
3.Schedule

Cost Estimate Uncertainties Matrix
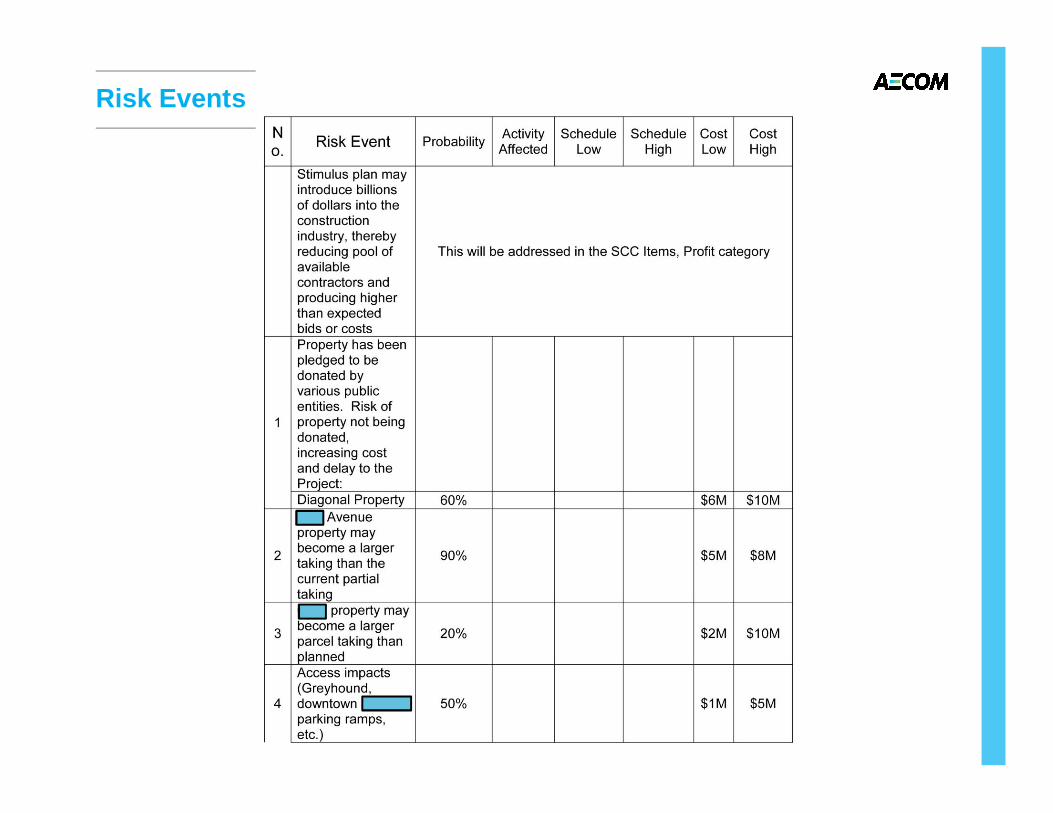
Risk Events
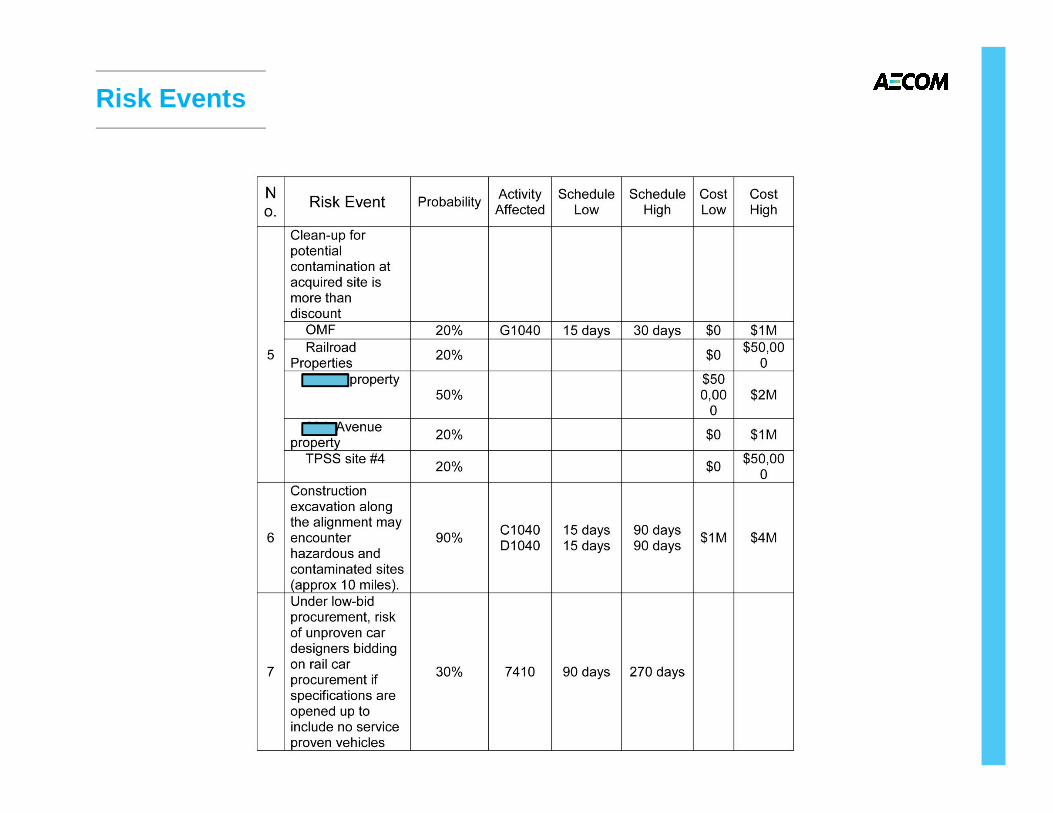
Risk Events
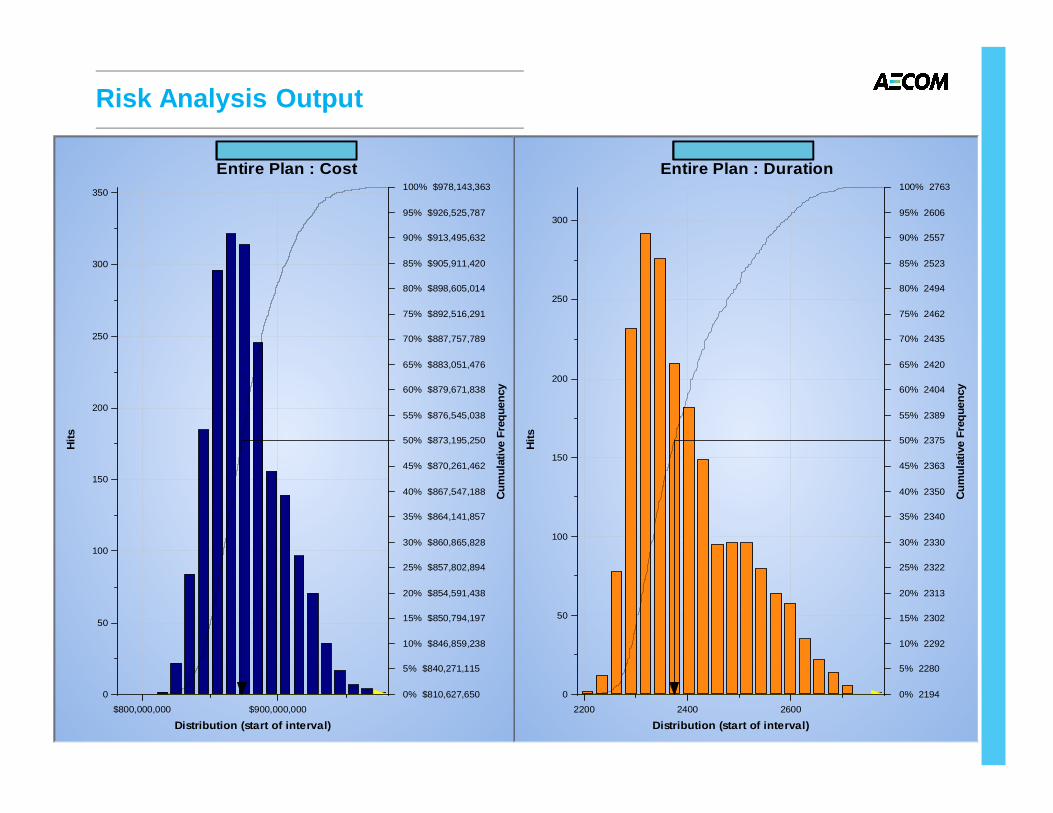
Risk Analysis Output
$800,000,000 $900,000,000
Distribution (start of interval)
0
50
100
150
200
250
300
350
Hits
0% $810,627,650
5% $840,271,115
10% $846,859,238
15% $850,794,197
20% $854,591,438
25% $857,802,894
30% $860,865,828
35% $864,141,857
40% $867,547,188
45% $870,261,462
50% $873,195,250
55% $876,545,038
60% $879,671,838
65% $883,051,476
70% $887,757,789
75% $892,516,291
80% $898,605,014
85% $905,911,420
90% $913,495,632
95% $926,525,787
100% $978,143,363
Cum
ulat
ive
Freq
uenc
y
CCLRT ProjectEntire Plan : Cost
2200 2400 2600
Distribution (start of interval)
0
50
100
150
200
250
300
Hits
0% 2194
5% 2280
10% 2292
15% 2302
20% 2313
25% 2322
30% 2330
35% 2340
40% 2350
45% 2363
50% 2375
55% 2389
60% 2404
65% 2420
70% 2435
75% 2462
80% 2494
85% 2523
90% 2557
95% 2606
100% 2763
Cum
ulat
ive
Freq
uenc
y
CCLRT ProjectEntire Plan : Duration

Risk Analysis Output
7%
8%
9%
10%
10%
13%
14%
16%
20%
91%CC 65701 - CCLRT Project Schedule
0780 - SCC 70 Light Rail
0630 - SCC 40 Materials
0450 - SCC 10 Materials
0770 - SCC 60 ROW
0710 - SCC 50 Materials
0790 - SCC 80 Owner Cos ts
0550 - SCC 30 Labor
0700 - SCC 50 Labor
0750 - SCC 50 Risk
CCLRT ProjectCost Sensitivity

Increase confidence of$3.833 billion estimate by18%. (from 59% to 77%)
Reduce P90 by $160million. (from $4.18 to
$4.02 billion)
Mitigation & Effect
Unmitigated
Contingency Management
Contingency Management Includes:
• Recording actual values of remaining contingency on a month bymonth basis
• Forecasting contingency values into the future based on possibleopportunities and risks
• Identifying options to address any significant variations in contingencyusage
• Implementing the options to restore contingency usage to plannedlevels

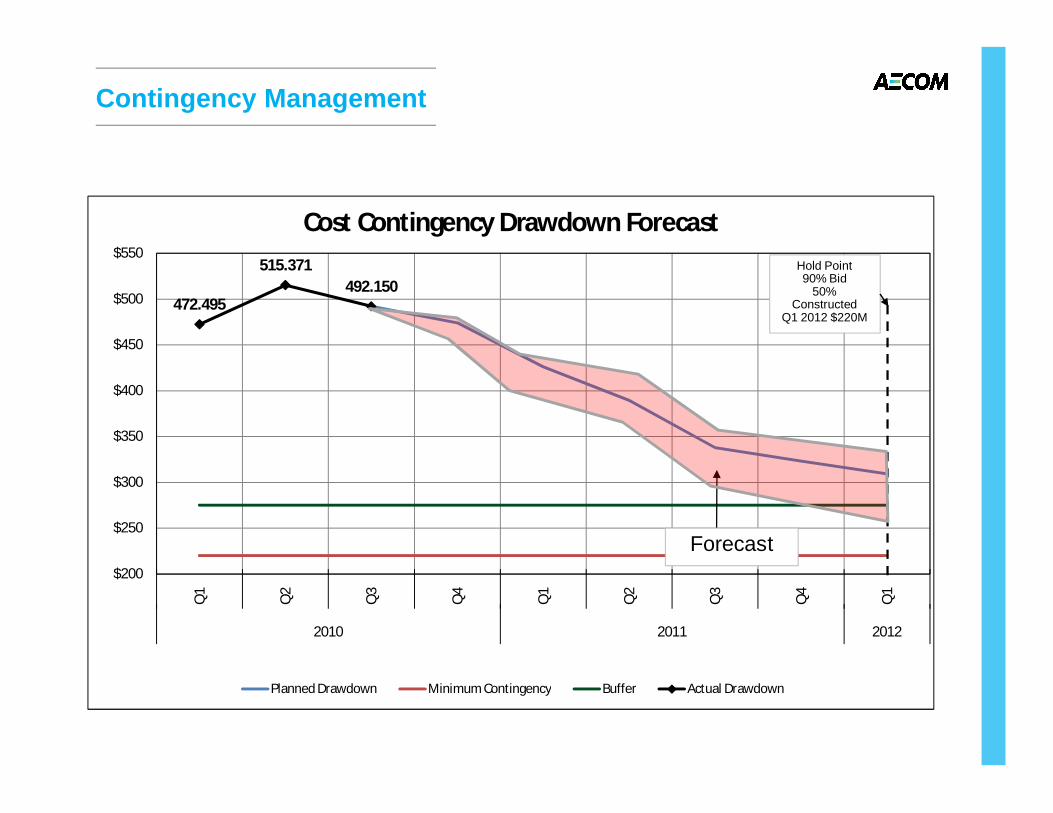
472.495
515.371492.150
$200
$250
$300
$350
$400
$450
$500
$550Q
1
Q2
Q3
Q4
Q1
Q2
Q3
Q4
Q1
2010 2011 2012
Cost Contingency Drawdown Forecast
Planned Drawdown Minimum Contingency Buffer Actual Drawdown
Updated PlannedCurve
Contingency Management
472.495
515.371492.150
$200
$250
$300
$350
$400
$450
$500
$550
Q1
Q2
Q3
Q4
Q1
Q2
Q3
Q4
Q1
2010 2011 2012
Cost Contingency Drawdown Forecast
Planned Drawdown Minimum Contingency Buffer Actual Drawdown
Hold Point90% Bid
50%Constructed
Q1 2012 $220M
Forecast
Contingency Management
Tools and Resources
• Software– @RISK
• A Palisade Corporation Windows-based tool, which is an ‘add-on’ toMicrosoft Excel
• It is AECOM Standard software for conducting cost risk analysis andmodeling
– Oracle Primavera Risk (Formerly PERTMASTER) / @RISK forProject• Oracle Primavera Risk Analysis (Formerly PERTMASTER) or @RISK for
Projects are both AECOM standard tools used for conducting schedulerisk analysis and modeling
• References– (2009) “Practice Standard for Project Risk Management” published
by the Project Management Institute (PMI)– ISO 31000:2009 “Risk Management-Principles and Guidelines”
Optional Presentation TitlePhoto Slide
Presenter’s Name
Project Risk Management Basics: Questions and Answers