project report - osmania university mrp final reports2018/low... · 2018-11-16 · 1 project report...
TRANSCRIPT

1
PROJECT REPORT
Low-Cost Drinking Water Purification by Dual and
Combined Treatment with Natural Coagulants and
Solar Disinfection”
Submitted to
University Grants Commission –
Major Research Project (MRP)
New Delhi
Submitted By
Dr. SYEDA AZEEM UNNISA
Assistant Professor & Principal Investigator
Department of Botany, Environmental Science
University College of Science,
Osmania University, Hyderabad -500007,Telangana State, India

2
S.No CONTENTS
1.0 Introduction
2.0 Objectives
3.0 Methodology
3.1 Natural coagulant preparation
3.2 Coagulant solution preparation
3.3 Model turbid water
3.4 Solar Exposure time
3.5 Physico – Chemical and Microbial analysis
3.6 Estimation of Proteins in Seeds by Lowry’s method
3.7 Turbidity Procedure
3.8 Combined turbid water treatment methodology
3.9 Description and Characterization of natural coagulants (seeds)
4.0 Study area
4.1 About Hyderabad
4.2 Surface water sample collection locations in and around Hyderabad
4.3 Description of Lakes (Sampling locations)
4.4 Surface water sampling method
4.5 Results and Discussion
5.0 Turbid water treatment with Aluminum Sulphate (Alum)
6.0 Dual turbid water treatment with natural coagulants and solar disinfection for
various seasons (summer and rainy)
6.1 Abelmoschous esculentum
6.2 Carica papaya
6.3 Coccinia grandis

3
6.4 Moringa oleifera
6.5 Phaseolus vulgaris
6.6 Pysum sativum
6.7 Strychnos potatorum
6.8 Zee Mays
7.0 Comparison of turbidity removal with alum and natural coagulants
7.1 Comparison of deactivation of E-coli and Coliforms with combined treatment
with natural coagulants and solar disinfection
8.0 Scientific Description of the Product/Process, give Specifications/Standards for
the same – (Annexure -2)
9.0 Solar disinfection treatment for 100 L unit
10.0 Discussion
11.0 Design of 100 liter water treatment unit
12.0 Conclusions
13.0 References
14.0 Published Paper (Attached)
4
1.0 Introduction
General Assembly in synthesis report 2018 on water and sanitation declares access to clean
water and sanitation is a human right–Safe and clean drinking water and sanitation is a
human right essential to the full enjoyment of life and all other human rights, the General
Assembly declared, voicing deep concern that almost 900 million people worldwide do not
have access to clean water. The 192-member Assembly also called on United Nations
Member States and international organizations to offer funding, technology and other
resources to help poorer countries scale up their efforts to provide clean, accessible and
affordable drinking water and sanitation for everyone.
Almost fifty per cent of the developing world’s population –over 884 million people still
uses unsafe drinking water sources. Inadequate access to safe water services, coupled with
poor hygiene practices, kills and sickens thousands of children every day, and leads to
impoverishment and diminished opportunities for thousands more. Unsafe- water has many
other serious repercussions. Women are forced to spend large parts of their day fetching
water. Poor farmers and wage earners are less productive due to illness, health systems are
overwhelmed and national economies suffer. Without safe water sustainable development is
impossible.
The Millennium Development Goal (MDG) aims at halving the portion of the population
without sustainable access to safe drinking water by 2015. The indicator for the MDG is “use
of an improved drinking water source” as defined by the World Health Organisation
(WHO). Although 2 billion people have gained access to improved water sources between
1990 and 2010, more than 780 million people are still relying on unimproved sources such as
surface water and unprotected wells for drinking water (WHO/UNICEF 2011). Access to
fresh water is a human right, yet more than 780 million people, especially in rural areas, rely
on unimproved sources and the need for finding ways of treating water is crucial. Although
the use of natural coagulant protein in drinking water treatment has been discussed for a
long time, the method is still not in practice, probably due to availability of material and
limited knowledge.

5
There is also a great inequity between genders in the sustentation of water. In households
without access to drinking water on the premises the responsibility for collecting water falls
on women in 64% of the cases, the tribute of men, girls and boys are 24, 8 and 4%
respectively. This is a significant burden and very time consuming, in some cases girls have
to stay home from school to help their mothers in the household. Although a water source is
considered as improved, this does not take into account if the water is of good quality. In
Southern-Asia, the number of people that have access to water from boreholes has increased
by 310 million over the last 20 years; nevertheless, the quality of this water is of concern and
might contain microorganisms or other contaminants (WHO/UNICEF 2011).
For instance, in India, rapid population growth and other factors such as industrial
discharge, agricultural run-off and poor sanitation practices put the long-term availability
and quality of the potable water at stake. Water from boreholes is often too hard and
although most people in the urban area have access to water treated by the municipality
through tap or protected pumps; this water is rarely fit for drinking unless treated first.
Microbial contamination through faecal contamination in water is the major reason for the
poor water quality, transmitting a large number of diseases. The pathogens present in the
drinking water include: Shigella species, Salmonella species, Klebsiella species, Escherichia coli,
Enterobacter species, and parasites such as Giardia lamblia and Entamaeba histolytica. Drinking
water treatment involves a number of combined processes based on the quality of the water
source such as turbidity, amount of microbial load present in water and the others include
cost and availability of chemicals in achieving desired level of treatment.
Generally drinking water treatment protocols consist of two major steps:
coagulation/flocculation and disinfection. Commonly alum (aluminum sulfate) is used as a
coagulation agent, as it is efficient and relatively cost-effective in developed countries; while,
disinfection is achieved by the addition of chemical disinfectants like chlorine-based
compounds. The chemicals most commonly used for disinfection of the water are chlorine,
ozone, chlorine dioxide, and chloramines, and these chemical disinfectants are all removing
microorganisms present in the water. However, they are powerful oxidants and will react

6
with natural organic matter and contaminants in the water, and form disinfection by-
products (DBPs). These DBPs have been associated with increased risk for cancer and other
health related issues (Morris et al., 1992; Cantor et al., 1998; Villanueva et al., 2006;
Richardson et al., 2007). In addition to the health concerns, such complicated methods are
difficult to adopt, especially in poor or developing countries, where cost-effective and
simple drinking water treatment methods are needed. Therefore, usage of safe, traditional
water treatment agents from natural sources becomes essential.
There are a few methods commonly advocated for the disinfection of drinking water at the
household level. These include boiling of water for about 10 minutes, or the use of certain
chlorine compounds available in the form of tablets (Halazone tablets, or calcium
hypochlorite tablets) or solutions (sodium hypochlorite solutions). As each of these
procedures has its own drawbacks, their application is extremely limited in the developing
regions of the world where water-borne diseases are prevalent, and the safety of drinking
water supplies cannot always be assured. Availability and costs are only part of the
problem. In the case of boiling, for instance, the need for about one kilogramme of wood to
boil on litre of water is totally unjustifiable in fuel-short regions already suffering from
aridity and desertification. Besides, the disagreeable taste of boiled water often discourages
consumers. The addition of 1 to 2 drops of 5% sodium hypochlorite solution per litre of
water requires the use of a dropper and litre measure, both being uncommon devices in
most homes. In view of these difficulties and constraints, it was deemed necessary to search
for an alternative method for the disinfection of water on an individual basis using simple
and inexpensive technology that would be more appropriate for application in the Third
World. Unlike other kinds of energy, the utilization of solar energy would not lead to
negative environmental impacts.
Although the technology and the efficiency of treating water are rapidly increasing it will
take time before these techniques will be available for all. This is an urgent matter and it is
very important to find alternative means of treating water in areas where the advanced
treatment methods are not yet available. There is no universal solution for solving the
problem with water supply in the world, every place and village is unique, and hence it is

7
desirable to find alternative methods for water treatment to access potable water. Moreover,
due to the emerging threat of climate changes WHO is now recommending small-scale
water treatment rather than relying on large-scale treatment plants that constitute a more
fragile system.
Safe drinking water should generally be free from heavy metals, turbidity, organic
compounds and pathogens. Turbidity may contain these compounds and also shield
pathogens from chemical or thermal damage. It is also important to remove turbidity for the
aesthetic values of the drinking water. Organic substances in water might originate from
industrial and agricultural operations, which contribute with compounds such as
chloroform, gasoline, pesticides and herbicides. Finally, protozoa, bacteria and viruses are
all pathogens that can cause diseases. Water is undoubtedly the most vital element among
the natural resources. In many developing countries, access to clean and safe water is a
crucial issue. More than six million people die because of diarrhea which is caused by
polluted water. Developing countries pay a high cost to import chemicals for water
treatment
The water condition of the surface water has become highly polluted due to indiscriminate
discharge of untreated waste from tannery, textile, and other industries, municipal waste
into water bodies, poor drainage system, population increasing and urban encroachment.
Water from all sources must have some form of purification before consumption. Various
methods are used to make water safe and attractive to the consumer. The method employed
depends on the character of the raw water. One of the problems with treatment of surface
water is the large seasonal variation in turbidity
For the treatment of surface water, some traditional chemicals are used during the treatment
of surface water at its various steps. Commonly used chemicals for various treatment units
are synthetic organic and inorganic substances. In most of the cases, these are expensive
since they are required in higher dose and does not show cost effectiveness. Many of the
chemicals are also associated with human health and environmental problems, Kaggwa . So,

8
there raised a voice to develop cost-effective, easier, and environmental friendly process of
water clarification.
The history of the use of natural coagulants is long. Natural organic polymers have been
used for more than 2000 years in India, Africa, and China as effective coagulants and
coagulant aids at high water turbidities. They may be manufactured from plant seeds,
leaves, and roots. These natural organic polymers are interesting because, comparative to
the use of synthetic organic polymers containing acryl amide monomers, there is no human
health danger and the cost of these natural coagulants would be less expensive than the
conventional chemicals alike since it is locally available in most rural communities. We have
developed an economically, feasible and environmentally sound combined turbid water
treatment technology with natural coagulants and solar disinfection to provide potable
water to the rural people.
2.0 - Objectives
• To develop an economically feasible and environmentally sound combined
purification method with natural coagulants and solar disinfection for providing
potable water to the villagers.
• To validate the effectiveness of the two methods (natural coagulants along with solar
disinfection) when used sequentially.
• To identify new plant materials with coagulating properties, which should have
competitive characteristics such as being cost effective, easily available and having
an effect against microorganisms and as a potential substitute to chemicals for water
purification
• To evaluate and compare the effectiveness of natural coagulants seeds with
aluminium sulphate (Alum) chemical coagulant by treating low, medium and high
turbid waters.
• Design a field unit for treating 100 liters of raw turbid water with a provision to
scaling up later.
• To make the water treatment process easier and environmental friendly for
household applications.

9
3.0 - Methodology
3.1- Natural coagulant preparation:
Seeds were collected from nearby market. Dissections of the seed pods were performed by
hand: The seeds were removed from the pods and were dried in the hot sun. Fine powder
was made by using mortar and pestle and was stored in air tighten packets for future use.
Figure 1: Seeds and seed powder for various
seeds
3.2- Coagulant solution preparation:
The pulverized seed material of about (optimum) was made into paste using little amount of
water and mixed into 50 ml of clean water which was shaked for 1minute in order to
activate the coagulant properties of the seed to form a solution . The
solution was filtered through a muslin cloth into the 1000ml of
turbid water to be treated. Figure 2: Synthetic turbid water with
various turbidity
3.3 - Model turbid water:
A stock of synthetic turbid water samples was prepared by suspending 10g of Kaolin in 1L
of tap water. The suspension was stirred for 30 minutes and left to stand for 24hrs to hydrate
particles. The desire turbidity of 20 NTU (low), 40 NTU (medium) and 80 NTU (high) was
prepared by mixing a fraction of decanted kaolin suspension with tap water. The pH of
synthetic water samples was maintained constant at 7.0 using 0.1 M HCl. E.coli and
Coliforms was mixed in stock turbid water from preserve lab culture samples.
3.4- Solar Exposure time

10
Poly Ethylene Terephtalate (PET) bottles made of transparent, clear plastic, cylinder shape
with a surface area of 23 x 7.2 x 6.0 cm was used for experimental purpose as they are good
transmitters of light in the UV and visible range of the solar spectrum. The total exposure
time of experiments varied from 2 to 8 hours. Sunlight is strongest
from 10 am to 2 pm so initial experiments were conducted to
encompass this time bracket by up to 1.5 hours before and up to 3
hours after (from 8:30am to 4:30 pm). Figure 3: Solar disinfection
3.5 - Physico – chemical and microbial analysis
Samples were analyzed before and after treatment for its potability using APHA methods. The
turbidity of water samples was measured using the turbidity meter (ELICO CL 52 D). pH was
determined using a pH strip. The Escherichia coli and Coli forms bacteria counts were
enumerated on Eosin Methylene Blue and Mac Conkey were performed hourly during the
experimental period. The inverted Petri dishes were incubated for 24 hrs at 37 0 C. Colonies
with a gold metallic sheen on the EMB were considered to be positive for E.Coli growth and
white colonies on Mac Conkey agar as positive for coliform growth. All results were reported
as log CFU (Coliforms units)/100 ml). The colonies are enumerated by using digital colony
meter and the log reduction is given by the following formula.
Cfu/ml = No. Of colonies formed × 1
Sample plated Dilution factor
3.6 - Estimation of Protiens in Seeds by Lowry’s Method
Principle: The principle behind the Lowry method of determining protein concentrations
lies in the reactivity of peptide nitrogen with the copper [II] ions under alkaline conditions
and the subsequent reduction of the folin-ciocalteay phosphomolybdic phosphotungstic acid
to heteropolymolybdenum blue by the copper-catalyzed oxidation of aromatic acids [Dunn,
13]. The Lowry method is sensitive to pH changes and therefore the pH of assay solution
should be maintained at 10 - 10.5.
The Lowry method is sensitive to low concentrations of protein. Dunn [1992] suggests
concentrations ranging from 0.10 - 2 mg of protein per ml while Price [1996] suggests
concentrations of 0.005 – 0.10 mg of protein per ml. The major disadvantage of the Lowry

11
method is the narrow pH range within which it is accurate. However, we will be using very
small volumes of sample, which will have little or no effect on pH of the reaction mixture. A
variety of compounds will interfere with the Lowry procedure. These include some amino
acids derivatives, certain buffers, drugs, lipids, sugars, salts, nucleic acids and sulphydryl
reagents [Dunn, 1992]. Price [1996] notes that ammonium ions, zwitter ionic buffers, non-
ionic buffers and thiol compounds may also interfere with the Lowry reaction. These
substances should be removed or diluted before running Lowry assays.
Reagents:
A. 2% sodium carbonate in 0.1N sodium hydroxide:
• 100 ml of 2%Sodiumcarbonate- take 2 gm of sdium carbonate in a 100 ml
standard flask and makeup to the mark using 0.1 N sodium hydroxide.
• 100 ml of 0.1 N sodium hydroxide - take 400 mg of sodium hydroxide in
100 ml standard flask and makeup to the mark using distilled water.
B. 1% potassium sodium tartarate in water:
• 100 ml of 1% potassium sodium tartarate- take 1 gm of potassium sodium
tartarate in 100 ml of standard flask and makeup to the mark using distilled
water.
C. 0.5% copper sulphate in water:
• 100 ml of 0.5% copper sulphate- take 0.5 gm of copper sulphate in 100 ml
standard flask and makeup to the mark using distilled water.
D. REAGENT I: 48 ml of A, 1 ml of B, 1 ml of C
E. 1 part folin-phenol (2 N) : 1 part water
• 10 ml of 2 N folin-phenol- take 1.9 ml of folin-phenol and add 8.1 ml of
distilled water.
• To the above solution add 10 ml of distilled water.
F. BSA STANDARD: bovine serum albumin 1 mg/ml
• Weigh accurately 50 mg of BSA and dissolve in distilled water and makeup
to 50 ml in a standard flask.
Procedure:
• From the BSA standard 0.2 ml, 0.4 ml, 0.6 ml, 0.8 ml and 1.0 ml was taken
five test tubes respectively and made up to 1.0 ml using distilled water.

12
• In another test tube 1.0 ml of distilled water was taken as a blank.
• Extraction of protien from sample- 500 mg of the sample was weighed and
ground well in a motor and pestle by adding 5.0 ml of buffer. Then the
sample was centrifuged for 10 minutes and the supernatant was used for
protein estimation.
• The protein estimation in the samples was carried out in three different
volumes that are 0.1 ml, 0.2 ml and 1.0 ml.
• The samples were taken in different test tubes.
• To the all the test tubes including blank 4.5 ml of reagent-I was added and
incubated for 10 minutes.
• After incubation 0.5 ml of reagent-II was added and incubated for 30
minutes.
• The absorbance was measured at 660 nm in spectrophotometer.
• Standard graph was plotted with the BSA standard concentrations from
which the amount of protein present was estimated.
3.7- Turbidity Procedure
Procedure
• Solution I- In a 100 ml standard flask 1 gm of hydrazine sulphate was taken
and made up to the mark using distilled water.
• Solution II- In a 100 ml standard flask 10 gm of hexamine
(hexamethylenetetramine) was taken and made up to the mark using distilled
water.
• In another 1000 ml standard flask 50 ml of solution I and 50 ml of solution II
was taken and mixed well and allowed it to stand for 24 hours for the
development of turbidity.
• After 24 hours made up to the mark using distilled water, the solution
developed was of 400 NTU.
• For treatment three different concentrations were prepared from 400 NTU
standard by taking 50 ml, 100 ml and 150 ml in different 1000 ml standard

13
flasks and made up to the mark using distilled water which resulted in 20
NTU, 40 NTU and 60 NTU respectively.
• Each concentration three sets were prepared for obtaining optimum
concentration of the seeds.
• Standard graph was plotted using different solutions of 20 NTU, 40 NTU, 60
NTU, 80 NTU and 100 NTU from 200 NTU.
• From 400 NTU 200 NTU was prepared by taking 50 ml of solution in a 100 ml
standard flask and made up to the mark using distilled water.
• Standards were prepared from 200 NTU of 50 ml each by taking 5 ml, 10 ml,
15 ml, 20 ml and 25 ml in separate 50 ml standard flaks and made up to the
mark using distilled water resulting in 20 NTU, 40 NTU. 60 NTU, 80 NTU
and 100 NTU respectively.
• Treatment was carried out by adding 0.2 gm of seeds powder in all the first
set three different concentrations turbidity (20,40,80 NTU) and flocculated for
and then let it stand for settling for 30 minutes.
• The above procedure was repeated by using different concentrations of seeds
powder that is 0.4 gm and 0.6 gm.
• The treatment procedure was done on soil sample with different
concentrations of turbidity (20, 40, 60 NTU) using different concentrations of
seeds powder (0.2, 0.4, 0.6 gm) similarly as the above synthetic sample.
• The parameters like pH, turbidity and total dissolved solids were recorded
before treating the samples and after treating the samples.
3.8 - Combined turbid water treatment methodology
The dried seeds of natural coagulants were pulverized in to fine powder. Preliminary
coagulation experiments were conducted at rapid and slow mixing speeds of 100 RPM and 40
RPM for duration of 1 min and 10 min respectively. Different coagulant dosages were added
into beakers during rapid mixing. After various settling intervals samples were drawn at 5 cm
from the surface and residual turbidity were measured using nephlometer for optimum dose
and settling time. The clarified water with natural coagulant was then poured in to plastic

14
poly ethylene terephthalate (PET) bottles was placed on the black cloth lying down in a sunny
place, in order to absorb more sunlight. Transparent bottles containing samples were placed
indoors served as control. After various exposure hours of solar disinfection, bottles were
placed in cool place. The water samples were analyzed for its potability before and after
treatment with combined treatment (natural coagulant treatment followed by solar
disinfection). All of the experiments were performed in duplicates and the average values
were presented.
E.coli count Treatment with E.coli count Solar E.coli count after
in turbid water natural coagulant (NC) after NC treatment disinfection solar disinfection
Figure 4: Process of combined turbid water treatment methodology with natural coagulants
and solar disinfection
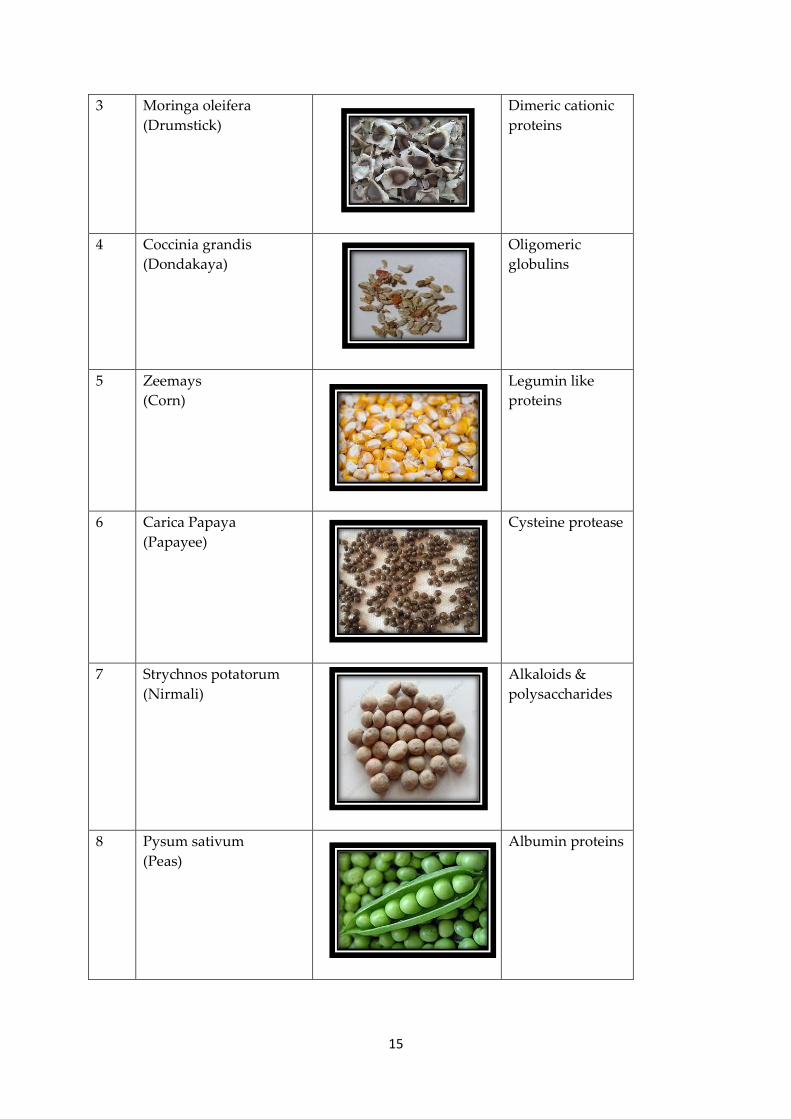
3.9- Description and Characterization of natural coagulants (seeds)
Table 1: Scientific names and active component in agro based seeds
S.No Scientific Name and
Common Name
Natural Coagulant Seeds Active agent
1 Phaseolus vulgaris
(Green bean)
Albumin proteins
2 Abelmoschus esculentus
(Ladies Finger or Okra)
Cyclo propenoid
fatty acid
15
3 Moringa oleifera
(Drumstick)
Dimeric cationic
proteins
4 Coccinia grandis
(Dondakaya)
Oligomeric
globulins
5 Zeemays
(Corn)
Legumin like
proteins
6 Carica Papaya
(Papayee)
Cysteine protease
7 Strychnos potatorum
(Nirmali)
Alkaloids &
polysaccharides
8 Pysum sativum
(Peas)
Albumin proteins
16
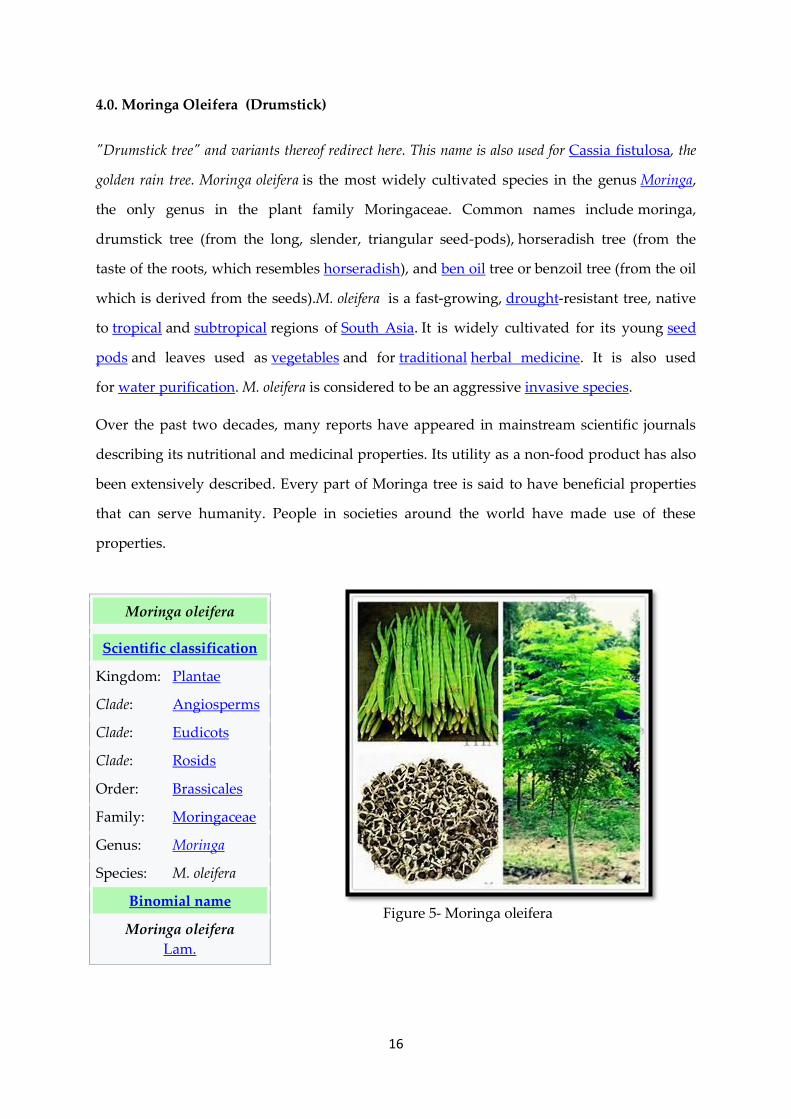
4.0. Moringa Oleifera (Drumstick)
"Drumstick tree" and variants thereof redirect here. This name is also used for Cassia fistulosa, the
golden rain tree. Moringa oleifera is the most widely cultivated species in the genus Moringa,
the only genus in the plant family Moringaceae. Common names include moringa,
drumstick tree (from the long, slender, triangular seed-pods), horseradish tree (from the
taste of the roots, which resembles horseradish), and ben oil tree or benzoil tree (from the oil
which is derived from the seeds).M. oleifera is a fast-growing, drought-resistant tree, native
to tropical and subtropical regions of South Asia. It is widely cultivated for its young seed
pods and leaves used as vegetables and for traditional herbal medicine. It is also used
for water purification. M. oleifera is considered to be an aggressive invasive species.
Over the past two decades, many reports have appeared in mainstream scientific journals
describing its nutritional and medicinal properties. Its utility as a non-food product has also
been extensively described. Every part of Moringa tree is said to have beneficial properties
that can serve humanity. People in societies around the world have made use of these
properties.
Figure 5- Moringa oleifera
Moringa oleifera
Scientific classification
Kingdom: Plantae
Clade: Angiosperms
Clade: Eudicots
Clade: Rosids
Order: Brassicales
Family: Moringaceae
Genus: Moringa
Species: M. oleifera
Binomial name
Moringa oleifera
Lam.

17
4.1. Strychnos potatorum (Nirmali)
Strychnos potatorum also known as clearing-nut tree. It is a deciduous tree which has height
up to 40 feet (12 meters). The seeds of the tree are
commonly used in traditional medicine as well as for
purifying water in India and Myanmar.[Traditional
Medicinal Uses: According to Ayurveda, seeds are acrid,
alexipharmic, lithotriptic and cure strangury, urinary
discharges, head diseases etc. Roots cure Leucoderma
whereas fruits are useful in eye diseases, thirst, poisoning
and hallucinations. The fruits are emetic, diaphoretic
alexiteric etc. According to Unani system of medicine,
seeds are bitter, astringent to bowels, aphrodisiac, tonic,
diuretic and good for liver, kidney complaints, gonorrhea,
colic etc. Seeds are used to purify water. Seeds are rich source of polysaccharide gum
suitable for use in paper and textile industries.
Figure 6: Strychnos potatorum
4.2. Zea mays (Corn)
Scientific classification
Kingdom: Plantae
Clade: Angiosperms
Clade: Eudicots
Clade: Asterids
Order: Gentianales
Family: Loganiaceae
Genus: Strychnos
Species: S. potatorum
Binomial name
Strychnos potatorum L.f.
18
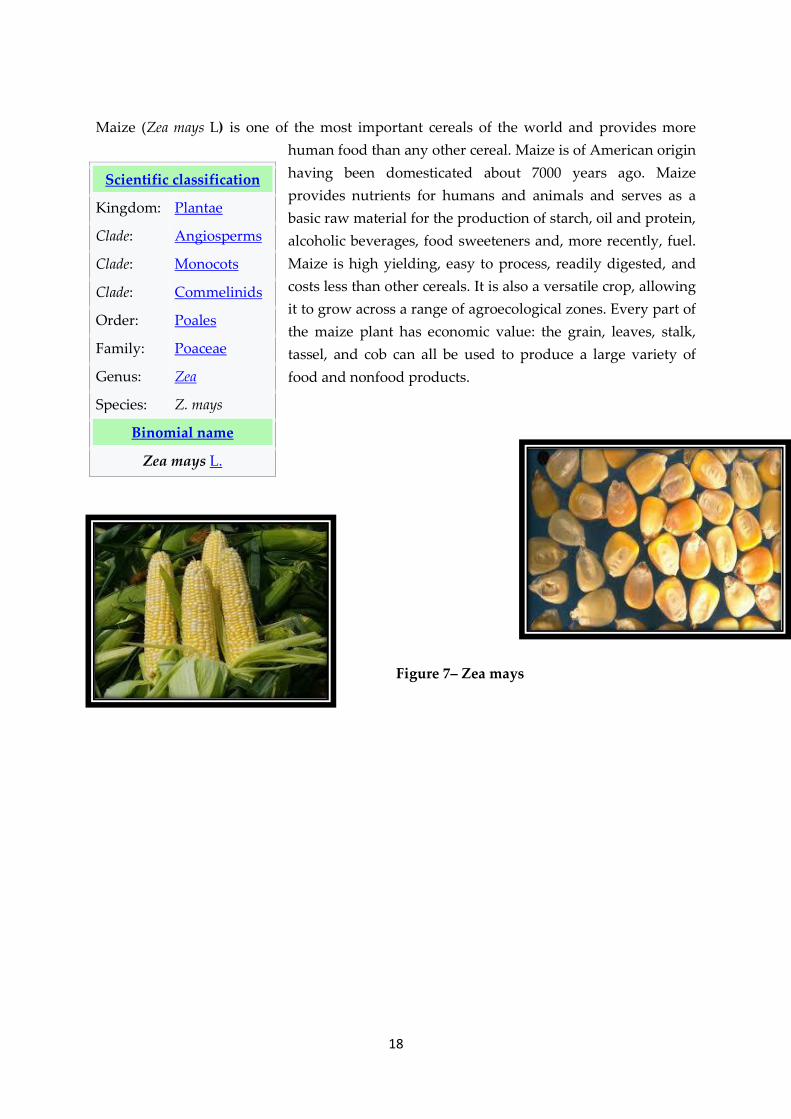
Maize (Zea mays L) is one of the most important cereals of the world and provides more
human food than any other cereal. Maize is of American origin
having been domesticated about 7000 years ago. Maize
provides nutrients for humans and animals and serves as a
basic raw material for the production of starch, oil and protein,
alcoholic beverages, food sweeteners and, more recently, fuel.
Maize is high yielding, easy to process, readily digested, and
costs less than other cereals. It is also a versatile crop, allowing
it to grow across a range of agroecological zones. Every part of
the maize plant has economic value: the grain, leaves, stalk,
tassel, and cob can all be used to produce a large variety of
food and nonfood products.
Figure 7– Zea mays
Scientific classification
Kingdom: Plantae
Clade: Angiosperms
Clade: Monocots
Clade: Commelinids
Order: Poales
Family: Poaceae
Genus: Zea
Species: Z. mays
Binomial name
Zea mays L.

19
4.3. Coccinia Grandis (Dondakaya)
Coccinia grandis, the ivy gourd, also known as scarlet gourd, tindora, and kowai fruit, is a
tropical vine. It grows primarily in tropical climates and is commonly found in the southern
Indian state of Kerala, where it forms a part of the local cuisine. Coccinia grandis is cooked
as a vegetable. In Southeast Asia, it is grown for its edible young shoots and edible fruits.
Occurs in agricultural areas, natural forests, and planted forests, rural/distributed. Native range:
Africa and Asia; India, Philippines, China, Indonesia, Malaysia, Thailand, Vietnam, eastern
Papua New Guinea, Northern Territories (Australia). Known introduced range:
Commonwealth of the Northern Mariana Islands, Federated States of Micronesia, Fiji,
Guam, Hawai‘i, Marshall Islands, Samoa, Tonga, Vanuatu. Medicinal uses: Medicinal
qualities as follows "The juice of the roots and leaves is used in the treatment of diabetes.
The leaves are used as a poultice in treating skin eruptions. The plant is used as a laxative. It
is used internally in the treatment of gonorrhea. Aqueous and ethanolic extracts of the plant
have shown hypoglycaemic principles.
Figure 8 - Coccinia Grandis
4.4. Phaseolus vulgaris (Green beans)
Scientific classification
Kingdom: Plantae
Clade: Angiosperms
Clade: Eudicots
Clade: Rosids
Order: Cucurbitales
Family: Cucurbitaceae
Genus: Coccinia
Species: C. grandis
Binomial name
Coccinia grandis
(L.) Voigt

20
The common bean, Phaseolus vulgaris, is an herbaceous annual plant domesticated
independently in ancient Mesoamerica a nd the Andes, and now grown worldwide for its
edible bean, popular both dry and as a green bean. The leaf is occasionally used as a leaf
vegetable, and the straw is used for fodder. Botanically, the common bean is classified as a
dicotyledon. Similar to other beans, the common bean is high in starch, protein and dietary
fiber and is an excellent source of iron, potassium, selenium, molybdenum, thiamine,
vitamin B6, and folic acid.
Figure 9 : Phaseolus vulgaris
Scientific classification
Kingdom: Plantae
Clade: Angiosperms
Clade: Eudicots
Clade: Rosids
Order: Fabales
Family: Fabaceae
Genus: Phaseolus
Species: P. vulgaris
Binomial name
Phaseolus vulgaris

21
4.5. Abelmoschus esculentus (Lady finger)
Okra (Abelmoschus esculentus Moench, pronounced, known in many English-speaking
countries as lady's fingers or gumbo) is a flowering plant in the mallow family. It is valued
for its edible green seed pods. Originating in Africa, the plant is cultivated in tropical,
subtropical and warm temperate regions around the world.
Figure 10- Abelmoschus esculentus
Scientific classification
Kingdom: Plantae
Clade: Angiosperms
Clade: Eudicots
Clade: Rosids
Order: Malvales
Family: Malvaceae
Genus: Abelmoschus
Species: A. esculentus
Binomial name
Abelmoschus
esculentus(L.) Moench

22
4.6. Pisum sativum (Peas)
A pea is most commonly the small spherical seed or the seed-pod of the legume Pisum
sativum. Each pod contains several peas. Peapods are botanically a fruit, since they contain
seeds developed from the ovary of a (pea) flower. However, peas are considered to be a
vegetable in cooking. P. sativum is an annual plant, with a life cycle of one year. It is a cool
season crop grown in many parts of the world; planting can take place from winter through
to early summer depending on location. The average pea weighs between 0.1 and
0.36 grams. The species is used as a vegetable, fresh, frozen or canned, and is also grown to
produce dry peas like the split pea. These varieties are typically called field peas.
Figure 11 - Pisum sativum
Pea plant: Pisum sativum
Scientific classification
Kingdom: Plantae
Clade: Angiosperms
Clade: Eudicots
Clade: Rosids
Order: Fabales
Family: Fabaceae
Genus: Pisum
Species: P. sativum
Binomial name
Pisum sativum L.

23
4.7. Carica papaya (Papayee)
The widely cultivated papaya (also called papaw or pawpaw), a tropical fruit plant. For the
mountain papaya (Vasconcellea pubescens) of South America, see Mountain papaya. For the
Eastern North American tree (and fruit) called "pawpaw", see Asimina triloba. For other
uses, see Papaya (disambiguation). The papaya is a small, sparsely branched tree, usually
with a single stem growing from 5 to 10 m (16 to 33 ft) tall, with spirally
arranged leaves confined to the top of the trunk. The lower trunk is
conspicuously scarred where leaves and fruit were borne. The leaves are large, 50–70 cm
(20–28 in) in diameter, deeply palmately lobed, with seven lobes. All parts of the plant
contain latex in articulated laticifers. Papayas are dioecious. The flowers are 5-parted and
highly dimorphic, the male flowers with the stamens fused to the petals. The female flowers
have a superior ovary and five contorted petals loosely connected at the base. Male and
female flowers are borne in the leaf axils, the males in multiflowered dichasia, the female
flowers is few-flowered dichasia. The flowers are sweet-scented, open at night and are
moth-pollinated.[6] The fruit is a large berry about 15–45 cm (5.9–17.7 in) long and 10–30 cm
(3.9–11.8 in) in diameter. It is ripe when it feels soft (as soft as a ripe avocado or a bit softer)
and its skin has attained amber to orange hue.
Figure 12 : Carica papaya
Scientific classification
Kingdom: Plantae
Clade: Angiosperms
Clade: Eudicots
Clade: Rosids
Order: Brassicales
Family: Caricaceae
Genus: Carica
Species: C. papaya
Binomial name
Carica papayaL.

21
Table 2: Proforma –Dual Treatment Design for treating Turbid Water by Natural Coagulants and Solar Disinfection
Step 1 Step 2 Step 3 Step 4 Step 5 Step 6
S.No Coagulant
name
Dosage
(gm/l)
Stirring speed
Rapid Slow
Settling
Time (min)
Before Treatment
NTU E.coli Coliform
After Treatment with Natural Coagulant
Control Sample E.coli Coliform
(NTU) (NTU) (CFU/ml) (CFU/ml)
Step 7 Step 8
Treatment with Solar disinfection
(Exposure time for E.coli Inactivation)
Control 1 hr 2hr 3hr
Treatment with Solar disinfection
(Exposure time for Coliforms Inactivation)
Control 1 hr 2hr 3hr

22
5.0 - Study Area
5.1. About Hyderabad
Hyderabad is the capital of the Indian state of Telangana . Occupying 650 square
kilometres (250 sq mi) along the banks of the Musi River, it has a population of about 6.9
million and a metropolitan population of about 7.75 million, making it the fourth most
populous city and sixth most populous urban agglomeration in India. At an average
altitude of 542 metres (1,778 ft), much of Hyderabad is situated on hilly terrain around
artificial lakes, including Hussain Sagar—predating the city's founding—north of the
city centre.
Hyderabad is full of natural beauty. Lakes and ponds are just anywhere you can find.
The outskirts of the city has preserved the lakes, giving them the regular cleaning, and
making it the must visit tourist spot. The best part about them is that you could gather
up your group, go on a leisure walk through its rough path that leads to the lake, where
you can set up a nice picnic for a long day ahead. And if the weather is pleasant with a
little rain here and then, then you could have the most wonderful time. Some of these
lakes are man-made with the purpose of storing water for irrigational purposes. With
time, the migratory birds come and nestle here making this their temporary home.
Figure 13: Location map of Hyderabad

23
5.2. Surface water sample collection locations in and around Hyderabad
Table 3: Sampling Locations
S.No Sampling locations
1
2
3
4
5
6
7
8
9
10
11
Mir Alam Tank (S1)
Safilguda Lake (S2)
Saroornagar lake (S3)
Langarhouz Cheruvu (S4)
Ramakrishnapuram Lake (S5)
Kapra Lake (S6)
Durgam Cheruvu (S7)
Alwal Lake (S8)
Nacharam Cheruvu (S9)
Ramanthapur Cheruvu (S10)
Jeedimetla Cheruvu (S11)
5.3 Description of Lakes (Sampling locations)
1. Mir Alam Tank:
Mir Alam Tank is
a reservoir in Hyderabad, Telangana, India. It is located to
the south of Musi river. It was the primary source of
drinking water to Hyderabad before Osman
Sagar and Himayat Sagar were built. It is connected to
National Highway7 near Palm Valley (Tadbun).
Coordinates 17°21′N 78°26′E and Surface area600 acres (240 ha).
2. Safilguda Lake
Safilguda lake, also known as Nadimi Cheruvu and Mini
Tank Bund, is a lake located in Old
Neredmet, Secunderabad, Telangana, India. There is a park

24
adjacent to the lake called Safilguda Lake Park. The lake has a small island called
Nadimi Bird Island. It is covered with thick trees, which attract a variety of wildlife,
especially migratory birds. Katta Misamma Temple is located on the shoreline of the
lake. The road around the lake is similar to the Necklace Road around the "tank bund"
on the Hussain Sagar Lake and hence the lake is also called "Mini Tank Bund". The park
is a popular attraction for jogging and evening walks. Coordinates17.46372°N
78.53626°E, Surface elevation, 1759 ft (536 m).
3. Saroornagar Lake
Saroornagar Lake is a lake in Hyderabad, India. From the year of its creation in 1626, the
lake remained largely clean until 1956 when Hyderabad
expanded. Spread over 99 acres (40 ha), the lake was
restored by the Hyderabad Urban Development
Authority in 2003–04 at a cost of ₹200
million (US$2.8 million). After the restoration of the
lake, migratory birds returned to the lake in big
numbers a few years later. Coordinates 17.35584°N 78.52714°E, Surface area99 acres
(40 ha) and Max. depth 6.1 metres (20 ft).
4. Langarhouz Cheruvu
Langar Houz is a suburb of Hyderabad, located
near Golconda. It is a part of the city. Langer houz is
located on the bank of River Musi, and is home to the
sangam of Musi and Esi rivers. River musi carries water
from Osman Sagar lake and River esi carries the water from Himayat Sagar lake.Langar
houz lake, that is getting polluted with huge amounts of sewage flowing into it
directly, can be seen foaming and frothing on a daily basis even today. In 2005, the
erstwhile Hyderabad Urban Development Authority (HUDA) had constructed a 1.2
Million Liters per Day (MLD) STP beside the lake to restore it so that sewage from

25
nearby areas can be channelised to the STP, treated and then released into the lake. A
park was also constructed beside the lake as part of beautification.
5. Ramakrishnapuram Lake
Ramakrishnapuram Lake, also known as Mukidi Cheruvu, is a lake located
in Neredmet, Hyderabad near Ramakrishnapuram Railway Station. It is home to
many migratory birds.[1] The lake is currently facing many
problems, including water pollution. GHMC is trying to
stop pollution but the efforts are not effective. Migratory
birds and other animals are also affected by the pollution.
Coordinates17.476°N 78.533°E Surface elevation 1,1759 ft
(536 m).
6. Kapra Lake
Kapra lake or Oora Cheruvu is a lake located in the Kapra
municipality near Sainikpuri in the north-east part
of Greater Hyderabad.[1]Length of its bund is measured at
1254 Meters. Coordinates 17.49558°N 78.55278°E, Surface
area 113 acres (46 ha), Average depth 547.873 m
(1,797.48 ft), Max. depth 551.614 m (1,809.76 ft) Surface
elevation1,759 ft (536 m).
7. Durgam Cheruvu
Durgam Cheruvu also known as Raidurgam Cheruvu is
a freshwater lake located in Rangareddy
district, Telangana, India. The lake, which is spread over
83 acres (34 ha), is located near the city of Hyderabad.
The lake is also known as Secret Lake because it is

26
hidden between the localities of Jubilee Hills and Madhapur. Surface area 83 acres
(34 ha) Max. depth 28 feet (8.5 m) Water volume 1,679,430 cubic metres (1,361.54 acre⋅ft)
8. Alwal Lake
Alwal Lake is an artificial lake near Hyderabad, India,
about 8 kilometers north of Secunderabad. It is situated
in Alwal. There were many issues associated with the
lake, which made a highly tensed situation for the Alwal
Municipality Officials. Coordinates17°30′28″N 78°30′41″E.
9. Nacharam Cheruvu
It is a manmade lake. Nacharam Cheruvu with
HMDA lake id 3806This is a fresh water lake spread
over, about 90 acres.
Coordinates: 17°25'15"N 78°33'12"E
10. Ramanthapur Cheruvu
Ramanthapur Lake, also known as Pedda Cheruvu, is
a lake located in Ramanthapur, Hyderabad. It is one of
the largest lakes in Hyderabad. 'Pedda Cheruvu' means
'Large Lake' in Telugu language. Coordinates 17.42124°N
78.55403°E Surface area 9 acres (3.6 ha) Surface
elevation1,759 ft (536 m).

27
11. Jeedimetla Cheruvu
Fox Sagar Lake, also Jeedimetla Cheruvu or Kolla Cheruvu, is
the fifth largest lake, spread over 500 km2, in Hyderabad,
India. It is located in Jeedimetla near Kompally, Hyderabad.
The lake is popular for fishing and a popular spot for picnics.
Coordinates 17.524°N 78.470°E Surface area 500 km2 (190 sq mi).
5.4 Surface water sampling method
Grab surface water samples in duplicate were collected from 3 areas of Hyderabad, A.P,
India. Polypropylene bottles of one litre capacity were used for sampling. Sample was
collected from 15 cm (6 in) from surface water. ID tag was attach immediately to bottles
which contain the details of sampling time, location, quantity and date according to
APHA (1982) methods.
Figure 14: Surface water samples

28
Table 4: Surface water sample physico-chemical, microbiological analysis before treatment
# Parameters Standards (As
per IS: 10500)
Sampling Locations (Lakes)
S1 S2 S3 S4 S5 S6 S7 S8 S9 S10 S11
1 Color (Hazen) < 05 80.1 90.5 59.2 10.2 25.6 58 45 35.6 54 48 39
2 Odour Un-Objectionable Obj Obj Obj Obj Obj Obj Obj Obj Obj Obj Obj
3 pH 6.5 – 8.5 7.8 8.74 8.76 8.18 9.0 8.30 8.1 8.4 8.4 8.7 8.1
4 Turbidity (NTU) < 05 56.3 85.6 65.8 90.5 150 78 250 52.3 200 121 156
5 Chlorides (mg/l) <250 199 320.2 41.56 303 150 253 336 1082 407 537 458
6 TDS (mg/l) <500 1589 3508.3 565.4 643.7 1059 1195 1000 1066 689 1569 598
7 Alkalinity (mg/l) 200 300 259.6 175.3 356 198 625 581 522 256 304 250
8 E.coli (cfu/ml) 0 – 10 TMC TMC TMC TMC TMC TMC TMC TMC TMC TMC TMC
9 Coliforms (cfu/ml) 0 – 10 TMC TMC TMC TMC TMC TMC TMC TMC TMC TMC TMC
Note: TMC – Too many to count

29
5.5 - Results and Discussions
Table 5: Standard graph readings for protein estimation
S.No Vol. of
BSA
(ml)
Conc. of
BSA
(mg/ml)
Vol. of
distilled
water (ml)
Vol. of
reagent-I
(ml)
Incu
bat
ed f
or
10 m
inu
tes
Vol. of
reagent-II
(ml)
Incu
bat
ed f
or
30 m
inu
tes
Absorbance
at
660 nm
1 Blank - 1.0 4.5 0.5 0.000
2 0.2 0.2 0.8 4.5 0.5 0.281
3 0.4 0.4 0.6 4.5 0.5 0.404
4 0.6 0.6 0.4 4.5 0.5 0.521
5 0.8 0.8 0.2 4.5 0.5 0.672
6 1.0 1.0 - 4.5 0.5 0.845
Table 6: Sample (seeds) readings for protein estimation
S.
No
Sample name Vol. of
sample
(ml)
Vol. of
distilled
water (ml)
Vol. of
reagent
-I (ml)
Incu
bat
ed f
or
10 m
inu
tes
Vol. of
reagent-
II (ml)
Incu
bat
ed f
or
30 m
inu
tes
Absorbance
at
660 nm
1 Phaseolous vulgaris 0.1 0.9 4.5 0.5 0.406
0.2 0.8 4.5 0.5 0.413
1.0 - 4.5 0.5 1.037
2 Abelmoschus
esculentus
0.1 0.9 4.5 0.5 0.759
0.2 0.8 4.5 0.5 0.843
1.0 - 4.5 0.5 1.342
3 Moringa oleifera 0.1 0.9 4.5 0.5 0.356
0.2 0.8 4.5 0.5 0.878
1.0 - 4.5 0.5 2.45
4 Coccinia grandis 0.1 0.9 4.5 0.5 0.479
0.2 0.8 4.5 0.5 0.542
1.0 - 4.5 0.5 0.894
5 Zea mays 0.1 0.9 4.5 0.5 0.369
0.2 0.8 4.5 0.5 0.447
1.0 - 4.5 0.5 2.084
6 Carica papaya 0.1 0.9 4.5 0.5 0.542
0.2 0.8 4.5 0.5 0.942
1.0 - 4.5 0.5 2.026
7 Strychnos potatorum 0.1 0.9 4.5 0.5 0.628
0.2 0.8 4.5 0.5 0.732
1.0 - 4.5 0.5 2.000
8 Pisum sativam 0.1 0.9 4.5 0.5 0.400
0.2 0.8 4.5 0.5 0.512
1.0 - 4.5 0.5 1.230

30
Table 7: Concentration of proteins in the seed samples
S.No Name of
the seed
Quantity
of
sample
(mg)
Volume
analysed
(ml)
Concentration at 660 nm in
spectrophotometer
mg/l mg/g
1 Phaseolus
vulgaris
500
0.1 4000 4.00
0.2 2700 2.70
1.0 1180 1.18
2 Abelmoschus
esculentus
500
0.1 4400 4.40
0.2 2600 2.60
1.0 1580 1.58
3 Moringa
oleifera
500
0.1 13400 13.40
0.2 6900 6.90
1.0 2800 2.80
4 Coccinia
grandis
500
0.1 8600 8.60
0.2 5000 5.00
1.0 1600 1.60
5 Zea mays
500
0.1 4000 4.00
0.2 2250 2.25
1.0 2360 2.36
6 Carica papaya
500
0.1 10000 10.00
0.2 9100 9.10
1.0 2360 2.36
7 Strychnos
potatorum
500
0.1 12500 12.50
0.2 5800 5.80
1.0 2700 2.70
8 Pisum sativam
500
0.1 4400 4.40
0.2 2200 2.20
1.0 1350 1.35

31
Figure 15: Protein estimation reagents
(a) (b) (c)
(d) (e) (f)
Figure 16: Seed Samples analysed for protein concentration
(a) Abelmoschus esculentus , (b) Carica papaya, (c )Zea mays,
(d) Phaseolus vulgaris, (e) Moringa oleifera, (f) Coccinia grandis
Figure 17: Seed samples after centrifugation

32
Figure 18: Concentration of protein in various natural coagulants
6.0- Turbid water treatment with aluminium sulphate (Alum)
Table 8: Optimization of aluminium sulphate dosages on different turbidity
Type of
Turbidity
(NTU)
Alum
concentration
(g/l)
Turbidity (NTU)
Initial Final
Settling
Time
(Minutes)
Turbidity
Removal
(%)
pH
Initial Final
Low
(20 NTU)
0.7 20 000 30 100 7 7
Medium
(40 NTU)
1.4 40 000 30 100 7 7
High
(80 NTU)
1.6 80 000 30 100 7 7
Figure 19: Alum suspension Coagulation & Flocculation Treated turbid water
02468
10121416
mg/
g co
nc.
Seed Name
0.1 sample

33
Figure 20: Synthetic samples (alum) with various turbidities
Figure 21: Seeds Powder Figure 22: Soil sample
Figure 23: Flocculation-Coagulation with Seeds Powder and Filtration of the Sample

34
Table 9 : Standard graph readings for turbidity
S.No Concentration
(NTU)
Turbidity meter
reading
1 20 61
2 40 133
3 60 200
4 80 285
5 100 372
Figure 24 : Standard graph for turbidity
0
50
100
150
200
250
300
350
400
20 NTU 40 NTU 60 NTU 80 NTU 100 NTU
X - AXIS Linear (X - AXIS)

35
7.0 Dual turbid water treatment with natural coagulants and solar disinfection for
various seasons (summer and rainy)
7.1- Abelmoschous esculentum
Figure 25 – Turbidity removed by Abelmoschous esculentum- Summer Season
Figure 26 – Turbidity removed by Abelmoschous esculentum- Rainy Season
0
0.05
0.1
0.15
0.2
0.25
0.3
20 NTU 40 NTU 80 NTU
66%90min
56.25%30min
61.85%90min
Op
tim
um
Do
sage
(g/
l)
Various turbidities removed by Abelmoschus esculentus
0
0.05
0.1
0.15
0.2
0.25
0.3
20 NTU 40 NTU 80 NTU
60%90min
53.5%30min
60.5%90min
Op
tim
um
do
sage
(g/l
)
Various turbidities removed by Abelmoschus
esculentum

36
Figure 27- Bacterial inactivation by Abelmoschous esculentum at different turbidity
levels - Summer Season
BT=before treatment, AT= after treatment with natural coagulants SD=solar disinfection
40 NTU
0
5
10
15
20
25
30
35
B.T A.T S.D
Co
lon
ies p
er m
l
E.coli
Coliforms
80 NTU
0
5
10
15
20
25
30
35
40
B.T A.T S.D
Co
lon
ies p
er m
l
E.coli
Coliforms
20 NTU
0
5
10
15
20
25
30
B.T A.T S.D
Co
lon
ies p
er m
l
E.coli
Coliforms

37
Figure 28- Bacterial inactivation by Abelmoschous esculentum at different turbidity
levels - Rainy Season
20NTU
0
2
4
6
8
10
12
14
16
B.T A.T S.D
co
lon
ies p
er
ml
E.coli
Coliforms
40NTU
0
2
4
6
8
10
12
14
16
18
B.T A.T S.D
co
lon
ies p
er
ml
E.coli
Coliforms
80NTU
0
5
10
15
20
25
B.T A.T S.D
co
lon
ies p
er
ml
E.coli
Coliforms

38
7.2 Carica papaya
Table 10: Treatment with Carica papaya for synthetic sample
S.N
o
Treatm
ent
Time
(minute
s)
Papaya
Seeds
Quanti
ty
(gm)
NTU TDS pH
Before
Treatm
ent
After
Treatm
ent
Before
Treatm
ent
After
Treatm
ent
Before
Treatm
ent
After
Treatm
ent
1 30 0.2 20 0 45 74 5 6
2 30 0.2 40 0 83 103 6 6
3 30 0.2 60 0 139 164 6 6
4 30 0.4 20 0 45 70 5 7
5 30 0.4 40 0 83 107 6 7
6 30 0.4 60 0 139 185 6 7
7 30 0.6 20 0 45 100 5 6
8 30 0.6 40 0 83 152 6 6
9 30 0.6 60 0 139 185 6 6
Table 11: Treatment with Carica papaya for soil sample
S.N
o
Treatm
ent
Time
(minute
s)
Papaya
Seeds
Quanti
ty
(gm)
NTU TDS pH
Before
Treatm
ent
After
Treatm
ent
Before
Treatm
ent
After
Treatm
ent
Before
Treatm
ent
After
Treatm
ent
1 30 0.2 20 0 318 336 6 7
2 30 0.2 40 0 492 469 7 7
3 30 0.2 60 0 477 434 7 7
4 30 0.4 20 0 318 333 6 7
5 30 0.4 40 0 492 349 7 7
6 30 0.4 60 0 477 472 7 7
7 30 0.6 20 0 318 343 6 7
8 30 0.6 40 0 492 479 7 7
9 30 0.6 60 0 477 492 7 7

39
7.3 Coccinia grandis
Figure 29 - Turbidity removal by Coccinia grandis - Summer Season
Figure 30 - Turbidity removal by Coccinia grandis - Rainy Season
0
0.05
0.1
0.15
0.2
0.25
0.3
0.35
0.4
20 NTU 40 NTU 80 NTU
66%90 min
71.25%60min
78%60min
Op
tim
um
Do
sage
(g/
l)Various turbidities removed by coccinia grandis
0
0.05
0.1
0.15
0.2
0.25
0.3
0.35
0.4
20 NTU 40 NTU 80 NTU
62%90min
69%60min
72.5%60min
Op
tim
um
do
sage
(g/l
)
Various turbidities removed by Coccinia grandis

40
Figure 31- Bacterial inactivation by Coccinia grandis at different turbidity levels -
Summer Season
BT=before treatment, AT= after treatment with natural coagulants SD=solar disinfection
20 NT U
0
5
10
15
20
25
30
35
B .T A.T S .D
Co
lon
ies
pe
r m
l
E .coli
C oliforms
40NT U
0
5
10
15
20
25
30
35
B .T A.T S .D
Co
lon
ies
pe
r m
l
E .coli
C oliforms
80NT U
0
10
20
30
40
50
B .T A.T S .D
Co
lon
ies
pe
r m
l
E .coli
C oliforms

41
Figure 32 - Bacterial inactivation by Coccinia grandis at different turbidity levels
- Rainy Season
20NT U
0
2
4
6
8
10
12
14
16
B .T A.T S .D
Co
lon
ies
pe
r m
l
E .coli
C oliforms
40NT U
0
5
10
15
20
B .T A.T S .D
Co
lon
ies
pe
r m
l
E .coli
C oliforms
80NT U
0
5
10
15
20
25
B .T A.T S .D
Co
lon
ies
pe
r m
l
E .coli
C oliforms
42
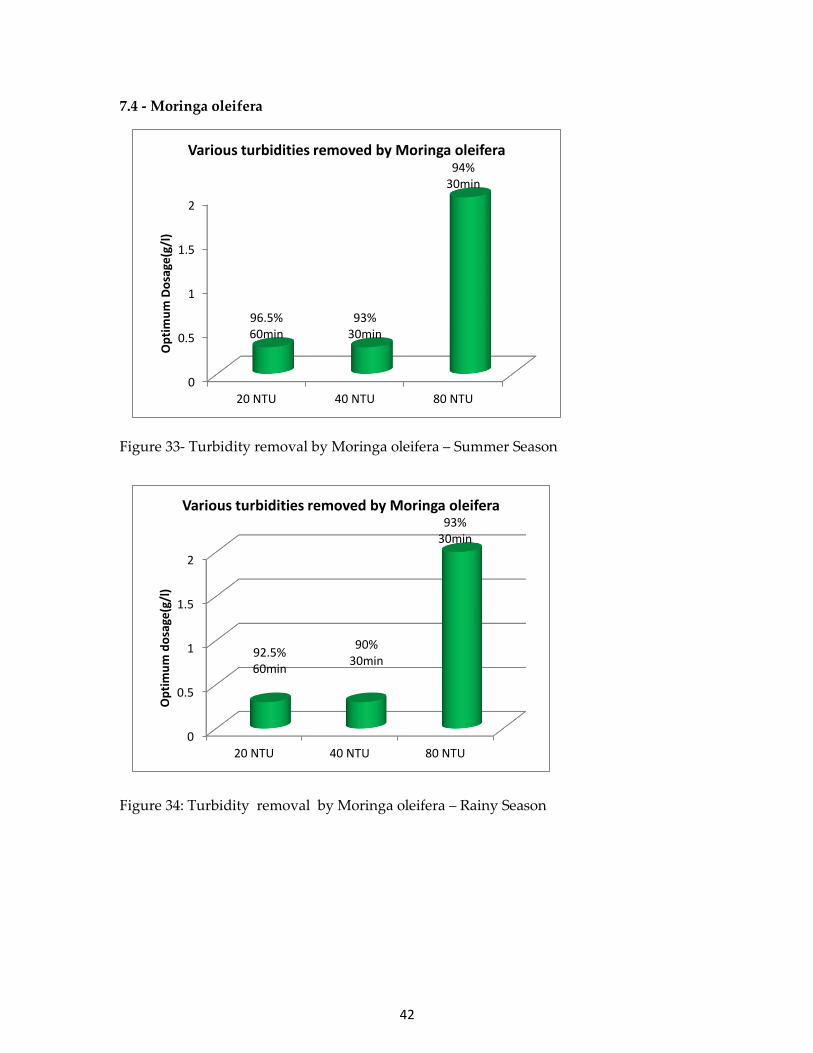
7.4 - Moringa oleifera
Figure 33- Turbidity removal by Moringa oleifera – Summer Season
Figure 34: Turbidity removal by Moringa oleifera – Rainy Season
0
0.5
1
1.5
2
20 NTU 40 NTU 80 NTU
96.5%60min
93%30min
94%30min
Op
tim
um
Do
sage
(g/l
)Various turbidities removed by Moringa oleifera
0
0.5
1
1.5
2
20 NTU 40 NTU 80 NTU
92.5%60min
90%30min
93%30min
Op
tim
um
do
sage
(g/l
)
Various turbidities removed by Moringa oleifera

43
Figure 35 - Bacterial inactivation by Moringa oleifera at different turbidity levels -
Summer Season
BT=before treatment, AT= after treatment with natural coagulants SD=solar disinfection
20NT U
0
10
20
30
40
50
60
70
80
B .T A .T S .D
Co
lon
ies
pe
r m
l
E .c oli
C oliforms
40 NT U
0
20
40
60
80
100
B .T A.T S .D
Co
lon
ies
pe
r m
l
E .c oli
C oliforms
80NT U
0
10
20
30
40
50
60
70
80
90
B .T A.T S .D
Co
lon
ies
pe
r m
l
E .coli
C oliforms
44
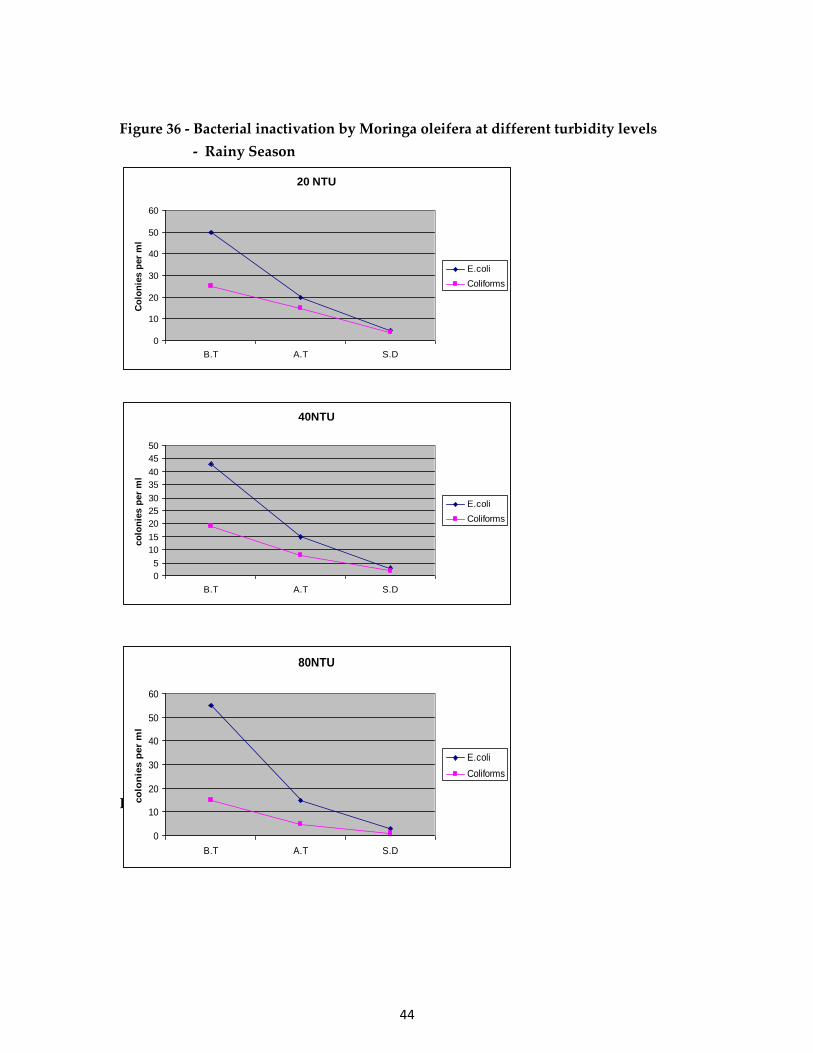
Figure 36 - Bacterial inactivation by Moringa oleifera at different turbidity levels
- Rainy Season
Phaseolus vulgaris
20 NTU
0
10
20
30
40
50
60
B.T A.T S.D
Co
lon
ies p
er
ml
E.coli
Coliforms
40NTU
0
5
10
15
20
25
30
35
40
45
50
B.T A.T S.D
co
lon
ies p
er
ml
E.coli
Coliforms
80NTU
0
10
20
30
40
50
60
B.T A.T S.D
co
lon
ies p
er
ml
E.coli
Coliforms

45
7.5 Phaseolus vulgaris
Figure 37– Turbidity removal by Phaseolus vulgaris - Summer Season
Figure 38 – Turbidity removal by Phaseolus vulgaris – Rainy Season
0
0.1
0.2
0.3
0.4
0.5
0.6
0.7
0.8
20 NTU 40 NTU 80 NTU
76%30min
75%30min
59%30min
Op
tim
um
Do
sage
(g/
l)
Various turbidities removed by Phaseolus vulgaris
0
0.2
0.4
0.6
0.8
20 NTU 40 NTU 80 NTU
72%30min
73%30min
56.5%30min
Op
tim
um
do
sage
(g/l
)
Various turbidities removed by Phaseolus vulgaris

46
Figure 39 - Bacterial inactivation by Phaseolus vulgaris at different turbidity levels
Summer Season
BT=before treatment, AT= after treatment with natural coagulants SD=solar disinfection
80 NT U
0
10
20
30
40
50
60
70
80
B .T A .T S .D
Co
lon
ies
pe
r m
l
E .c oli
C oliforms
40 NT U
0
10
20
30
40
50
B .T A .T S .D
Co
lon
ies
pe
r m
l
E .c oli
C oliforms
20 NT U
0
5
10
15
20
25
30
35
40
B .T A .T S .D
Co
lon
ies
pe
r m
l
E .c oli
C oliforms

47
Figure 40- Bacterial inactivation by Phaseolus vulgaris at different turbidity levels -
Rainy Season
20NT U
0
5
10
15
20
B .T A.T S .D
Co
lon
ies
pe
r m
l
E .coli
C oliforms
40NT U
0
5
10
15
20
25
30
B .T A.T S .D
Co
lon
ies
pe
r m
l
E .coli
C oliforms
80NT U
0
10
20
30
40
50
60
B .T A.T S .D
Co
lon
ies
pe
r m
l
E .coli
C oliforms

48
7.6 Pysum sativum
Figure 41– Turbidity removal by Pysum sativum - Summer Season
Figure 42 - Turbidity removal by Pysum sativum - Rainy Season
0
0.05
0.1
0.15
0.2
20 NTU 40 NTU 80 NTU
85%60min
81.25%60 min
74.35%120 min
op
tim
um
do
ssag
e(g
/l)
Various turbidities removed by Pysum sativum
0
0.05
0.1
0.15
0.2
20 NTU 40 NTU 80 NTU
83.75%60min
78%60min
73.5%120min
Op
tim
um
do
sage
(g/l
)
Various turbidities removed by Pysum sativum

49
Figure 43- Bacterial inactivation by Pysum sativum at different turbidity levels
- Summer Season
BT=before treatment, AT= after treatment with natural coagulants SD=solar disinfection
20NT U
0
5
10
15
20
25
B .T A .T S .D
Co
lon
ies
pe
r 1
00
ML
E .coli
C oliforms
40NT U
0
5
10
15
20
25
30
35
40
B .T A.T S .D
Co
lon
ies
pe
r 1
00
ml
E .coli
C oliforms
80NT U
0
10
20
30
40
50
B .T A.T S .D
Co
lon
ies
pe
r 1
00
ml
E .coli
C oliforms

50
Figure 44- Bacterial inactivation by Pysum sativum at different turbidity levels
Rainy Season
20NT U
0
5
10
15
20
25
30
B .T A.T S .D
Co
lon
ies
pe
r m
l
E .c oli
C oliforms
40NT U
0
5
10
15
20
25
30
35
B .T A.T S .D
Co
lon
ies
pe
r m
l
E .coli
C oliforms
80NT U
0
5
10
15
20
25
30
35
B .T A.T S .D
Co
lon
ies
pe
r m
l
E .coli
C oliforms
51
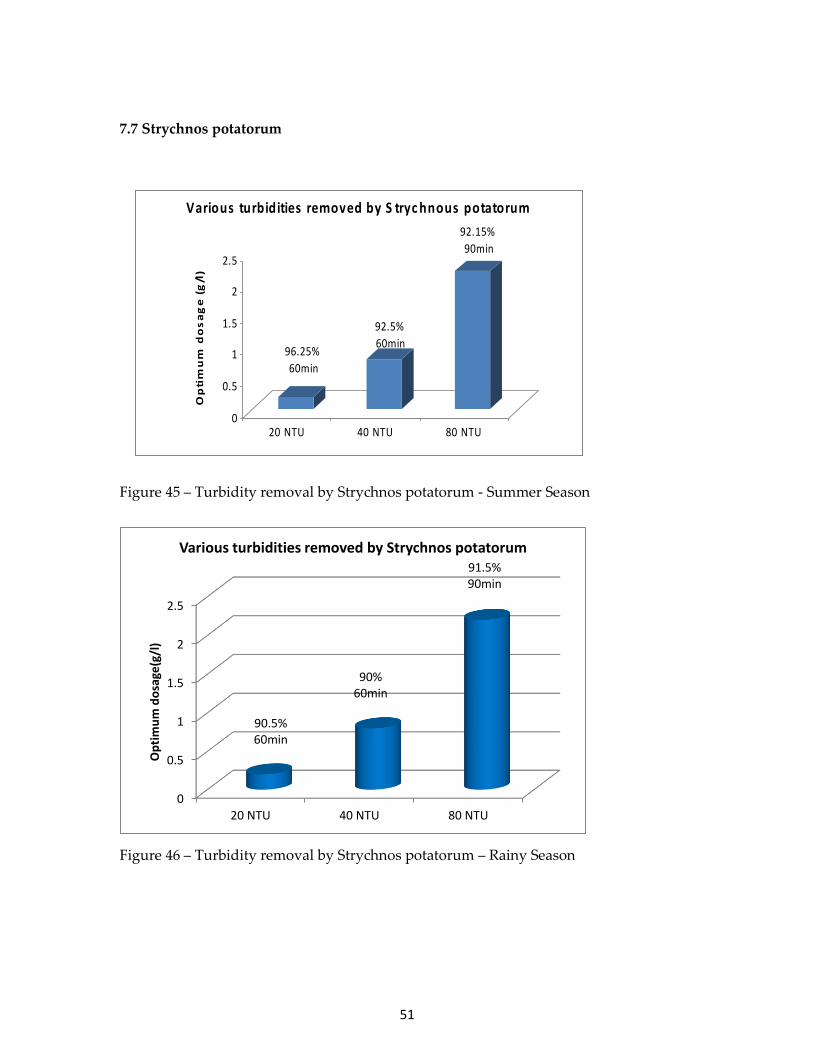
7.7 Strychnos potatorum
Figure 45 – Turbidity removal by Strychnos potatorum - Summer Season
Figure 46 – Turbidity removal by Strychnos potatorum – Rainy Season
96.25%
60min
92.5%
60min
92.15%
90min
0
0.5
1
1.5
2
2.5
Op
tim
um
do
sa
ge
(g
/l)
20 NTU 40 NTU 80 NTU
Various turbidities removed by S tryc hnous potatorum
0
0.5
1
1.5
2
2.5
20 NTU 40 NTU 80 NTU
90.5%60min
90%60min
91.5%90min
Op
tim
um
do
sage
(g/l
)
Various turbidities removed by Strychnos potatorum
52
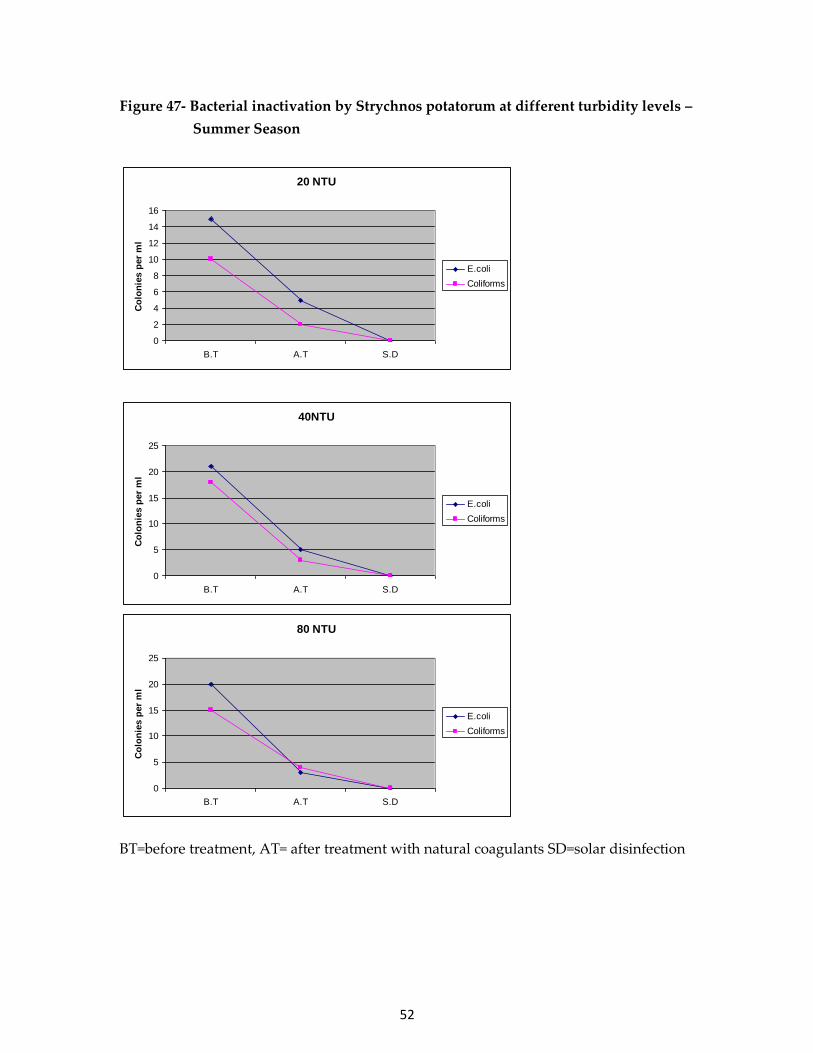
Figure 47- Bacterial inactivation by Strychnos potatorum at different turbidity levels –
Summer Season
BT=before treatment, AT= after treatment with natural coagulants SD=solar disinfection
20 NTU
0
2
4
6
8
10
12
14
16
B.T A.T S.D
Co
lon
ies p
er
ml
E.coli
Coliforms
40NTU
0
5
10
15
20
25
B.T A.T S.D
Co
lon
ies p
er
ml
E.coli
Coliforms
80 NTU
0
5
10
15
20
25
B.T A.T S.D
Co
lon
ies p
er
ml
E.coli
Coliforms

53
Figure 48- Bacterial inactivation by Strychnos potatorum at different turbidity levels –
Rainy Season
80NTU
0
10
20
30
40
50
60
B.T A.T S.D
co
lon
ies p
er
ml
E.coli
Coliforms
40 NTU
0
5
10
15
20
25
30
35
40
45
50
B.T A.T S.D
co
lon
ies p
er
ml
E.coli
Coliforms
20 NTU
0
5
10
15
20
25
B.T A.T S.D
co
lon
ies p
er
ml
E.coli
Coliforms

54
7.8 Zee Mays
Figure 49- Turbidity removal by Zee Mays - Summer Season
Figure 50- Turbidity removal by Zee Mays - Rainy Season
0
0.5
1
1.5
2
2.5
3
20 NTU 40 NTU 80 NTU
86%60min
80%90min
80%60min
Op
tim
um
Do
sage
(g/
l)
Various turbidities removed by Zeemays
0
0.5
1
1.5
2
2.5
3
20 NTU 40 NTU 80 NTU
84%60min
77.5%90min
78%60min
Op
tim
um
do
sage
(g/l
)
Various turbidities removed by Zeemays
55
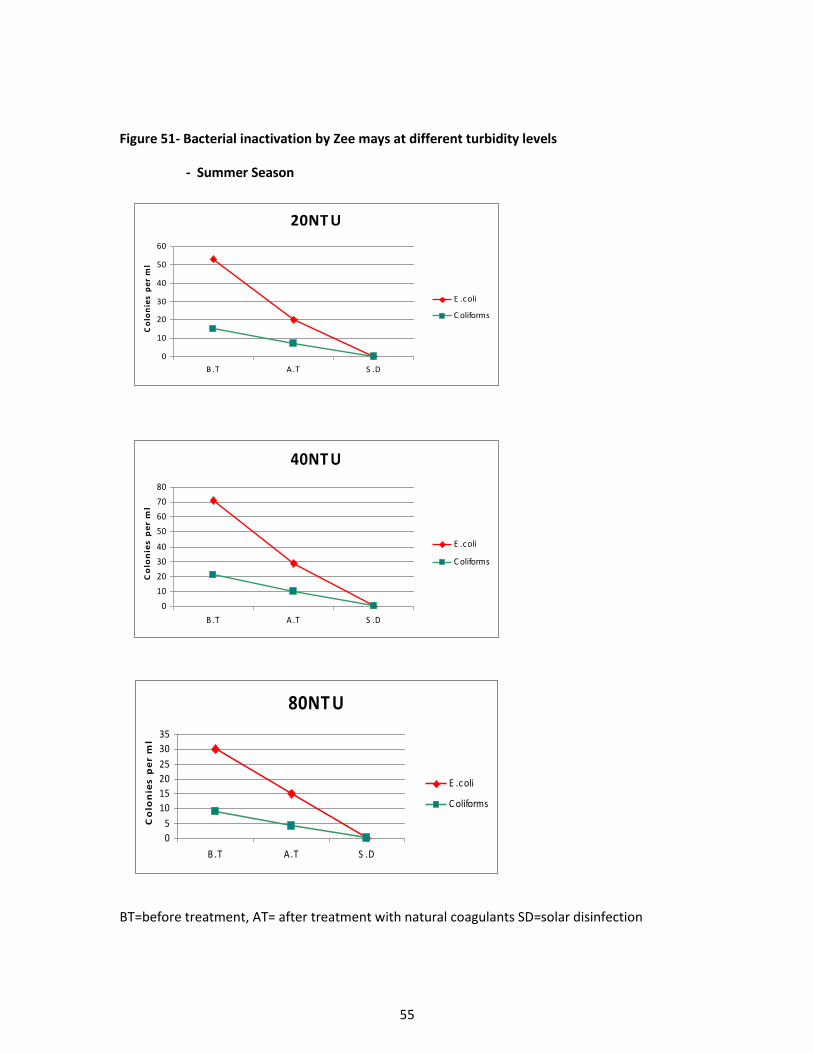
Figure 51- Bacterial inactivation by Zee mays at different turbidity levels
- Summer Season
BT=before treatment, AT= after treatment with natural coagulants SD=solar disinfection
20NT U
0
10
20
30
40
50
60
B .T A.T S .D
Co
lon
ies
pe
r m
l
E .coli
C oliforms
40NT U
0
10
20
30
40
50
60
70
80
B .T A.T S .D
Co
lon
ies
pe
r m
l
E .coli
C oliforms
80NT U
0
5
10
15
20
25
30
35
B .T A.T S .D
Co
lon
ies
pe
r m
l
E .coli
C oliforms
56
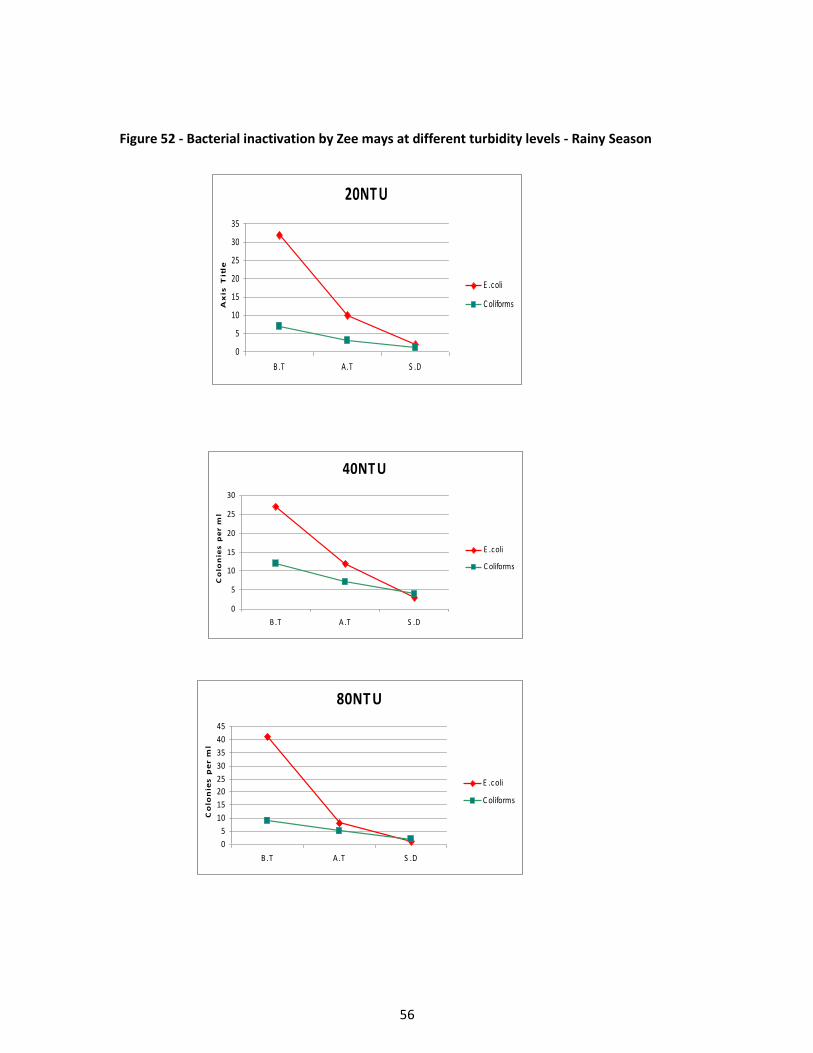
Figure 52 - Bacterial inactivation by Zee mays at different turbidity levels - Rainy Season
20NT U
0
5
10
15
20
25
30
35
B .T A.T S .D
Ax
is T
itle
E .coli
C oliforms
40NT U
0
5
10
15
20
25
30
B .T A.T S .D
Co
lon
ies
pe
r m
l
E .coli
C oliforms
80NT U
0
5
10
15
20
25
30
35
40
45
B .T A.T S .D
Co
lon
ies
pe
r m
l
E .coli
C oliforms

57
8.0 - Comparison of turbidity removal with alum and natural coagulants
Figure 53 - Comparison of turbidity removal for various NTU’S with Alum and
Natural Coagulants for Summer Season
(Note: Carica papaya has shown “Zero” total removal of turbidity and total deactivation
of coliforms when compared to other seven seeds mentioned in the graph)
00.20.40.60.8
11.21.41.61.8
2
100%30min 96.5%
60min 96.25%60min
86%60min
85%60min
76%30min
66%90min
66%90min
Op
tim
um
do
sage
(g/
l)
Comparision of turbidity removal by Natural coagulant with Alum 20NTU
---Summer season
0
0.5
1
1.5
2 100%30min
93%30min
92.5%60min
81.25%60min
80%90min
75%30min
71.25%60min
56.25%30min
Op
tim
um
do
sage
(g/
l)
Comparision of turbidity removal by Natural coagulant with Alum for 40 NTU
---Summer season

58
Figure 54- Comparison of turbidity removal for various NTU’S with Alum and
Natural Coagulants For Rainy Season
0
0.5
1
1.5
2
100%30min
92.5%60min
90.5%60min
84%60min
83.75%60min
72%30min 62%
90min
60%60min
Op
tim
um
do
sage
(g/l
)
Comparision of turbidity removal by Natural coagulant with
Alum for 20 NTU
--- Rainy season

59
0
0.5
1
1.5
2
2.5100%30min
90%30min
90%60min 78%
60min
77.5%90min
73%30min
69%60min
53.5%30min
Op
tim
um
do
sage
(g/l
)
Comparision of turbidity removal by Natural coagulant with
Alum for 40 NTU---
Rainy season
00.5
11.5
22.5
3100%30min
93%30min
91.5%90min
78%60min
73.5%120min
72.5%60min
60.5%90min
56.5%30min
Op
tim
um
do
sage
(g/l
)
Comparision of turbidity removal by natural coagulant with
Alum for 80 NTU
--- Rainy season

60
8.1 -Comparison of deactivation of E-coli and Coliforms with combined
treatment with natural coagulants and solar disinfection
Figure 55- Comparison of Deactivation of E.coli with Combined treatment
with Natural coagulants and Solar Disinfection for various NTU’S for Summer
Season
Inactivation of E. coli by SD from water clarified
with NC for 40 NTU
0 5
10 15 20 25 30 35
0 (control) 1 2
Time (h)
CFU/ml
M.O S.P Zeemays A.E P.V C.G P.S
0
5
10
15
20
25
0 (control) 1 2
Time (h)
CFU/ml
M.O S.P Z.M A.E P.V C.G P.S
Inactivation of E. coli by SD from water clarified
with NC for 20 NTU

61
Figure 56- Comparison of Deactivation of E.coli with Combined treatment
with Natural coagulants and Solar Disinfection for various NTU’S for Rainy
Season
Inactivation of E.coli at 20NTU (Low turbidity)
- Rainy season
0
5
10
15
20
25
0 (control) 1 2 3
Time(h)
CF
U/m
l
M.O
S.P
Zeemays
A.E
P.V
C.G
P.S
Inactivation of E.coli at 40NTU (Medium turbidity)
Rainy season
0
2
4
6
8
10
12
14
16
0 (control) 1 2 3
Time(h)
CF
U/m
l
M.O
S.P
Zeemays
A.E
P.V
C.G
P.S
Inactivation of E. coli by SD from water clarified
with NC for 80 NTU
0
5
10
15
20
25
0 (control) 1 2 Time (h)
CFU/ml
M.O S.P Z.M A.E P.V C.G P.S
62
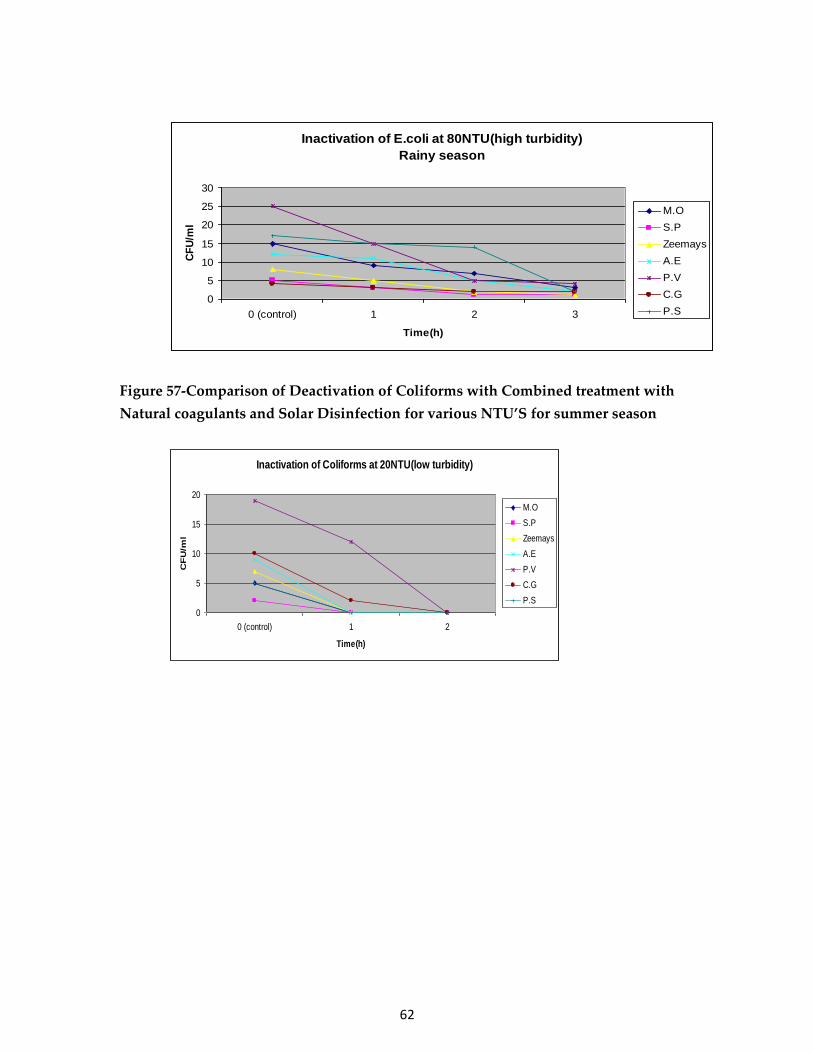
Figure 57-Comparison of Deactivation of Coliforms with Combined treatment with
Natural coagulants and Solar Disinfection for various NTU’S for summer season
Inactivation of E.coli at 80NTU(high turbidity)
Rainy season
0
5
10
15
20
25
30
0 (control) 1 2 3
Time(h)
CF
U/m
l
M.O
S.P
Zeemays
A.E
P.V
C.G
P.S
Inactivation of Coliforms at 20NTU(low turbidity)
0
5
10
15
20
0 (control) 1 2
Time(h)
CF
U/m
l
M.O
S.P
Zeemays
A.E
P.V
C.G
P.S

63
Figure 58 -Comparison of Deactivation of Coliforms with Combined treatment
with Natural coagulants and Solar Disinfection for various NTU’S for Rainy
season
Inactivation of Coliforms at 40NTU(medium turbidity)
0
2
4
6
8
10
12
14
16
0 (control) 1 2
Time(h)
CF
U/m
l
M.O
S.P
Zeemays
A.E
P.V
C.G
P.S
Inactivation of Coliforms at 80NTU(high turbidity)
0
5
10
15
20
25
30
0 (control) 1 2
Time(h)
CF
U/m
l
M.O
S.P
Zeemays
A.E
P.V
C.G
P.S

64
Inactivation of Coliforms at 20NTU(low turbidity)
0
2
4
6
8
10
12
14
16
0 (control) 1 2 3
Time(h)
CF
U/m
l
M.O
S.P
Zeemays
A.E
P.V
C.G
P.S
Inactivation of Coliforms at 40NTU(medium turbidity)
0
1
2
3
4
5
6
7
8
9
0 (control) 1 2 3
Time(h)
CF
U/m
l
M.O
S.P
Zeemays
A.E
P.V
C.G
P.S
Inactivation of Coliforms at 80NTU(high turbidity)
0
2
4
6
8
10
12
0 (control) 1 2 3
Time(h)
CF
U/m
l
M.O
S.P
Zeemays
A.E
P.V
C.G
P.S

65
9.0 -Scientific Description of the Product/Process, give Specifications/Standards for the same - (Annexure -2)
Table 12 : Design of 100 litre treatment unit for treating turbid surface water
S.No Coagulant name Dosage Settling time Initial Final Turbidity Cost
(gms) (mins) NTU NTU removal (Rs/Ps)
8 Strychnos potatorum 1.0 60 80 0 100% 0.50
Note : According to WHO standard the turbidity of water should be 5.0 NTU
1 Carica Papaya 1.0 60 80 0 100% 0.30
2 Moringa oleifera 1.0 60 80 8 90% 3.50
3 Zee mays 1.0 60 80 4 95% 0.50
4 Phaseolus Vulgaris 1.0 60 80 9 89% 0.25
5 Pysum sativum 1.0 60 80 9 89% 0.01
6 Abelmoschous 1.0 60 80 9 89% 0.25
Esculentum
7 Coccinia grandis 1.0 60 80 5 94% 0.008

10.0- Solar disinfection treatment for 100 L unit
Solar disinfection for treated alum water
After treating the water sample with the Alum, the treated water was kept for solar
disinfection for 3 hrs along with control. The microbial tests were done before and after the
treatment. The results of the microbial analysis are: before treatment the microbial colonies
in the water sample were too many to count and after treatment with alum there are two coli
form colonies and it was observed that there were no colonies present after 1hr of solar
disinfection when compared to control.
• Clarified turbid water with natural coagulants can be exposed to solar disinfection
for 3 hrs in between 42 to 48 0 C in summer season for treatment of 100 L turbid
surface water.
• Clarified turbid water with natural coagulants can be exposed to solar disinfection
for 5 - 8 hrs for 2 days in rainy season for treating of 100 L turbid surface water.
11.0 Discussion
Using natural materials to clarify water is a technique that has been practiced for centuries
and the seed materials used have been found to be effective. From the present research we
have design 100 litre turbid water treatment unit for surface water having various turbidity
shown in Table 4. Solutions of all the eight agro based seeds – Carica papaya, Moringa
oleifera, Zee mays, Beans, Peas, Lady’s finger, Coccinia grandis, Nirmali seeds for water
treatment may be prepared from seeds. Solutions for treating water should be prepared
fresh each time. All the eight agro based seeds are non-toxic and effective coagulant aids
useful for removing turbidity and bacteria from water. The cost of solar disinfection is
negligible as it is a natural source. The cost of seed treatment is very low, in some cases
negligible. The seed treatment and solar disinfection does not remove 100% of water
pathogens. It is acceptable for drinking only where people are currently drinking untreated
and contaminated water.
The results of this study have shown that the seeds of eight natural plant species are
powerful polyelectrolyte coagulant whether it is used as a primary or as a coagulant aid in
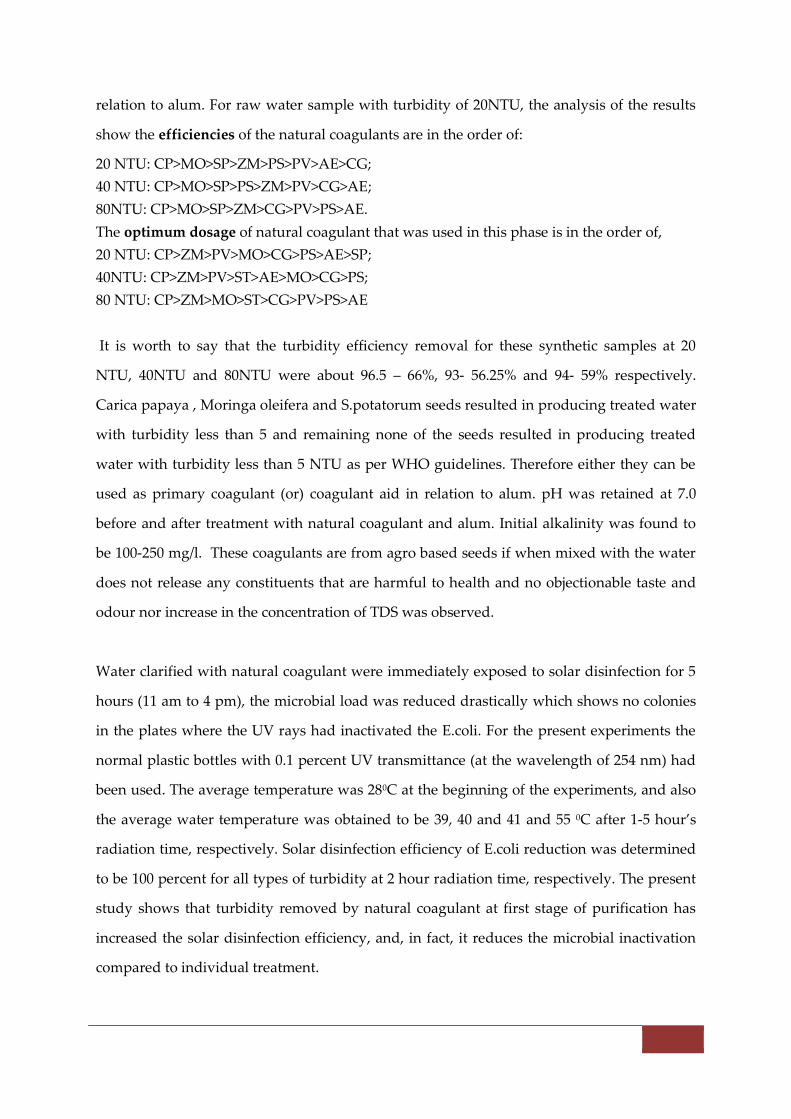
relation to alum. For raw water sample with turbidity of 20NTU, the analysis of the results
show the efficiencies of the natural coagulants are in the order of:
20 NTU: CP>MO>SP>ZM>PS>PV>AE>CG;
40 NTU: CP>MO>SP>PS>ZM>PV>CG>AE;
80NTU: CP>MO>SP>ZM>CG>PV>PS>AE.
The optimum dosage of natural coagulant that was used in this phase is in the order of,
20 NTU: CP>ZM>PV>MO>CG>PS>AE>SP;
40NTU: CP>ZM>PV>ST>AE>MO>CG>PS;
80 NTU: CP>ZM>MO>ST>CG>PV>PS>AE
It is worth to say that the turbidity efficiency removal for these synthetic samples at 20
NTU, 40NTU and 80NTU were about 96.5 – 66%, 93- 56.25% and 94- 59% respectively.
Carica papaya , Moringa oleifera and S.potatorum seeds resulted in producing treated water
with turbidity less than 5 and remaining none of the seeds resulted in producing treated
water with turbidity less than 5 NTU as per WHO guidelines. Therefore either they can be
used as primary coagulant (or) coagulant aid in relation to alum. pH was retained at 7.0
before and after treatment with natural coagulant and alum. Initial alkalinity was found to
be 100-250 mg/l. These coagulants are from agro based seeds if when mixed with the water
does not release any constituents that are harmful to health and no objectionable taste and
odour nor increase in the concentration of TDS was observed.
Water clarified with natural coagulant were immediately exposed to solar disinfection for 5
hours (11 am to 4 pm), the microbial load was reduced drastically which shows no colonies
in the plates where the UV rays had inactivated the E.coli. For the present experiments the
normal plastic bottles with 0.1 percent UV transmittance (at the wavelength of 254 nm) had
been used. The average temperature was 280C at the beginning of the experiments, and also
the average water temperature was obtained to be 39, 40 and 41 and 55 0C after 1-5 hour’s
radiation time, respectively. Solar disinfection efficiency of E.coli reduction was determined
to be 100 percent for all types of turbidity at 2 hour radiation time, respectively. The present
study shows that turbidity removed by natural coagulant at first stage of purification has
increased the solar disinfection efficiency, and, in fact, it reduces the microbial inactivation
compared to individual treatment.

The treatment of water with the common inorganic coagulants have a number of
disadvantages such as cost of chemicals (especially for developing nations), concern for
human health, sludge management among others. However there are constraints
encountered in the use of chemical coagulants, such as scarcity of foreign currency for
importation and inadequate supply of chemicals (WHO 2005). Although aluminium is the
most commonly used coagulant in the developing countries, studies have linked it to the
development of neurological diseases (e.g. pre-senile dementia or Alzheimer’s disease) due
to the presence of aluminium ions in the drinking water. More so, large non- biodegradable
sludge volumes are produced containing residual aluminium sulphate needing treatment
facilities to prevent further contamination into the environment (Lye 2002).
Moreover, researchers observed that the coagulation protein inhibits the growth of enteric
and non- enteric bacterial strains. Such dual role of purified proteins in clarification and
antimicrobial potential renders this simplified method of extraction and purification of
coagulating proteins proper for poor countries where they cannot afford the costly
conventional methods for protein purification (Sobsey 2006). Investigated the potential of
plant seeds and roots on removal of turbidity and compared it with alum. The researcher
used clean water to extract the coagulating agent from seed powder and roots analogous to
what is done traditionally by women. It was observed that in terms of turbidity removal, the
crude seed suspension compared well with that affected by alum with alum performing
only 1% percent better than the natural coagulants. Moreover, they observed that the
removal of turbidity was accompanied by bacterial reduction (50-60%) although upon
storing the treated water for 24 hours secondary bacterial growth was noted.
Mc Connachie (1999) observed that the active agent is a water-soluble cationic protein that
harbours very good coagulation properties which is used in extremely low dosages than that
used for crude seed extract. Also, water treated by pure proteins is not prone to bacterial re-
growth. The researchers thus affirmed that, the isolation and purification of active agents
from the seed is relatively easy compared to laborious manipulation of other proteins and
thus recommended it for use in water treatment processes. Studies have shown that

synergies from the combined application of radiation and thermal treatment have a
significant effect on the die-off rate of micro organisms.
Most of the published investigation to date has been made using Escherichia coli as model
microorganism, because it is a very well- known bacteria from all points of view (DNA,
metabolism, structure and composition, morphology, behaviour under different nutrient
media, pathogencity, types, strains, etc.).The results of the present study, namely the
complete elimination of indicator bacteria within a few hours, showed that sunlight, given
an appropriate intensity and good water transparency, was the most important factor in the
reduction of hygienically relevant micro organisms in surface waters.
Turbidity is a significant factor in the disinfection process. The effectiveness of solar
disinfection has been tested on samples with turbidity ranging from less than 10 NTU to
approximately 300 NTU. Researchers have found that higher turbidity samples exposed to
sunlight attained consistently higher water temperatures, which was attributed to
absorption of radiation by the particulate matter (Barer 2004). More turbid samples, at 300
NTU, also had less inactivation of E.coli compared to samples with little or no turbidity.
This may be in part due shielding of organisms by particles (Mani 2006). Meera and
Ahammed (2006) reported that less than 1 % of the total incident UV light is able to
penetrate beyond a water depth of 2cm from the surface in samples with turbidities greater
than 200 NTU. Therefore, it may be necessary to filter turbid waters before sun exposure.
For over 4000 years sunlight has been used as an effective disinfectant (Kehoe 2001). When
organisms are exposed to sunlight, photo sensitizers absorb photons of light in the UV – A
and early visible wavelength regions of 320 to 450 nm. The photo sensitizers react with
oxygen molecules to produce highly reactive oxygen species. In turn, these species react
with DNA; this leads to strand breakage, which is fatal, and base changes, which result in
mutagenic effects such as blocks to replication. The biocide effect of sunlight is due to optical
and thermal processes and a strong synergistic effect occurs for water temperatures
exceeding 450C (Martin 2005).

It has reported that the reduction of indicator bacteria in surface waters depended on
physical parameters (e.g. temperature, pH, oxygen saturation, and sunlight), chemical
parameters (inorganic and organic substances) as well as the activities of macro and micro-
organisms (Rob Reed 2005).The viability of the bacteria Escherichia coli depends to a great
extent on its temperature of incubation (Rose 2006). In general, the chemical composition of
water as well as its content in suspended solid particles, their turbidity, etc. affect in a very
important way the disinfection processes (Berney 2006; Fujioka et al 2002 and Masschelein
2002).
Compared the germicidal effects of different wavelengths of light by measuring the average
number of E.coli inactivated upon exposure to the varying wavelengths. They found that the
most significant decrease in viable bacterial organisms occurred when they were exposed to
wavelengths between 260 to 350 nm (compared to inactivation at wavelengths between 550
to 850 nm) because wavelengths below 290nm do not reach the earth. Reed et al (2000)
concluded that the most bactericidal wavelengths were between 315 to 400 nm, which
corresponds to the wavelengths of the near- ultraviolet region that are not visible to the eye.
The findings of (Mofidi 2001) are further supported by the research of others. Amir Hossein
Mahvi (2007) attributed half of the toxic effects of sunlight to wavelengths lower than
370nm. Tandon et al (2005) concurred, stating that wavelengths between 300 and 370 nm
have significant effects on inactivating bacteria and viruses.
Advantages of using natural coagulant
• Cheap and easy method for developing countries (especially at household level).
• The efficiency is independent of raw water pH.
• The processing doesn´t modify the pH of the water.
• It doesn´t alter the water taste (unless a very high doses is added).
• The low volume of sludge precipitated is biodegradable and hence an
environmentally sound technology.
12.0 - Conclusions

Finally we would like to conclude that, the use of locally available natural coagulants in
poor countries has a great potential of improving the economy and health of the people.
Extensive studies have been done to know the efficiency of natural coagulant and solar
disinfection when used sequentially. It is now up to the governments in poor countries to
first recognize and duly support the initiatives of the poor and yet disadvantaged
population segments. This will need communities of countries to strengthen the natural
water coagulation and solar disinfection as point-of-use (POU) technology in a holistic
approach and to support these initiatives including empowering and enabling local scientist
and technologists to build up the POU technology that will suit the local requirements and
situation based on scientific knowledge available.
13.0 - References
1. Amir Hossein, M. 2007 Feasibility of Solar Energy in Disinfection of Drinking Water
in Iran. Journal of American- Eurasian Agric. and Environ. Sci. 2(4), 410.
2. Barer, M. R. 2004 Batch process solar disinfection is an efficient means of disinfecting
drinking water contaminated with Shigella dysenteriae type 1. Journal of Applied
Microbiology. 38, 414.
3. Berney, M. 2006 Efficacy of solar disinfection of Escherichia coli Shigella flexneri,
Salmonella typhimuriam and Vibrio cholerae. Journal of Applied Microbiology. 101,
836.
4. Cheesbrough, M. 1984 Medical laboratory manual for Tropical Health Technology.
5. Fujioka, R. S. & Yoneyama, B.S. 2002 Sunlight inactivation of human enteric viruses
and fecal bacteria. Journal of Water Science Technology. 46, 291- 295.
6. Kehoe, S.C. 2001 Effect of agitation, turbidity, aluminum foil reflectors and container
volume on the inactivation efficiency of batch process solar disinfection. Journal of
Water Research. 35(4), 1065.
7. Lye, D.J. 2002 Health risks associated with consumption of untreated water from
household roof catchments systems. Journal of AWR. 38(5), 1306.
8. McConnachie, H. L. 1999 Field trial of appropriate flocculation processes. Journal of
Water Research. 33(6), 1434.

9. Mintz, E., Bartram, J. & Lochery, P. 2001 Not just a drop in the bucket: expanding
access to point-of- use water treatment systems, Am. J. Public Health. 31, 1565–1570.
10. Mofidi, A. A. 2001 Disinfection of Cryptosporidium parvum with polychromatic UV
light. Journal of American Water Works Assocciation. 93, 109.
11. Masschelein, W. J. 2002 UV light in water and waste water sanitation. Boca Raton, CRC
Press.
12. Mara, D. D. 2003 Water, sanitation and hygiene for the health of developing nations,
Public Health. 117, 452–456.
13. Martin- Dominguez, A. 2005 Efficiency in the disinfection of water for human
consumption in rural Communities using solar radiation. Journal of Solar Energy. 78,
40.
14. Mani, S. K. 2006 Comparative effectiveness of solar disinfection using small scale
batch reactors with reflective, absorptive and tranmissive rear surfaces. Journal of
Water Research. 40, 727.
15. Meera, V & Ahammed, M. M. 2006 Water quality of rooftop harvesting systems: a
review. Journal of Water Supply Research Technology- Aqua. 55(4), 268.
16. Reed, R. H., Mani, S. K. & V. Meyer, V. 2000 Solar photo oxidative disinfection of
drinking water: preliminary field observations. Journal of Applied Microbiology. 30,
436.
17. Rob Reed. 2005 Making the most of a scarce resource: Solar disinfection of drinking
water in the arid zone of western Rajasthan. ALN.
18. Rose, A. 2006 Solar disinfection of water for diarrhoeal prevention in India. Journal of
Arch. Dis.Child. 10, 141.
19. Standard Methods for the Examination of Water and Wastewater 1998 18th edition.
American Public Health Association / American Water Works Association / Water
WE Environment Federation, Washington DC.
20. Sobsey, M. D. 2006 Drinking water and health research: a look to the future in the
United States and globally. Journal of Water Health. 4(1), 21.

21. Tandon, P., Chhibber. S & Reed, R. H. 2005 Inactivation of Escherichia coli and
coliform bacteria in traditional brass and earthenware water storage vessels. Journal
of Water Research. 88,48.
22. United Nations (UN) Water for people, water for live: The United Nations World
Water Development Report 1, United Nations Educational Scientific Cultural
Organization Publishing/Berghah Books, 2003, available at:
www.unesco.org/water/wwap/wwdr/index_es.shtml (accessed December 2007).
23. United Nations International Children’s Emergency Fund, The state of the world’s
children 2005, available
at:http://www.unicef.org/spanish/publications/index_24432.html (accessed July
2006).
24. United Nations, Millenium Development Goals, 2005, available at:
http://www.un.org/millenniumgoals/ (accessed September 2007).
25. United Nations Development Programme, Beyond Scarcity: Power, Poverty and the
Global Water Crisis, 2006, available at:
http://hdr.undp.org/hdr2006/pdfs/report/HDR06-complete.pdf (accessed
November 2007).
26. WHO 2004 Guidelines for drinking quality, 3rd edition, vol.1, Recommendations,
Geneva, World Health Organization, available at: http://www.who.int/water-
sanitation -health/dwq/gdwq3/en/index.html.