project on marketing
TRANSCRIPT

CHAPTER-1
INTRODUCTION TO THE STUDY
1.1 INTRODUCTION
The marke t ing concep t i s consumer o r i en ted and the emphas i s i s more
on the consumer rather than on the product. The essence of modern marketing lies in
building of profit along with creating meaningful value satisfaction for the
customers whose needs and desires have to be coordinated with the set of
products and production programmes. Therefore, marketing success an
enterprise depends as its ability to create a community of satisfied consumers. All
the business activities should be carried out in ways which are directed towards the
satisfaction of consumer needs. Consumer behaviour is affected by host of variables
ranging from personal, professional needs, attitudes and values, social economic and
cultural background. The combination of these factors helps the consumer in decision
making further psychological factors that as individual’s consumer needs, motivations
and perception attitudes which operate across the different types of people and influence
their behaviour.
1.2 STATEMENT OF THE PROBLEM
Consumer behaviour is the study of when, why, how, and where people do or do not buy
a product. It blends elements from psychology, sociology, social anthropology and
economics. It attempts to understand the buyer decision making process, both
individually and in groups. It studies characteristics of individual consumers such as
demographics and behavioural variables in an attempt to understand people's wants. The
aim of the project is to study about the consumer behaviour towards TVS bikes in
Krishnagiri town.
1
1.3 OBJECTIVES OF THE STUDY
1.3.1 Primary Objective
To study about consumers behaviour towards TVS bikes.
1.3.2 Secondary Objective
To know the social and economic status of the respondents.
To study the advertisement effectiveness of TVS bikes through respondents.
To study about the factors that influences the behaviour of consumers in TVS
bikes.
To know about the consumers opinion of TVS bikes regarding its features like
price, mileage, appearance etc.
1.4 SCOPE OF THE STUDY
This study focus on how and why customers make decision about the goods and service
and their behaviour of buying the product.
The purpose of this study is to find the behaviour of the consumer about the TVS bikes in
Krishnagiri Town. The study could provide appropriate and timely information about the
position of TVS bikes in Krishnagiri. This study focused mainly on the customers who
bought TVS bikes in Chinnasamy agency.
1.5 LIMITATIONS
Research work was carried out in Krishnagiri Town only the finding may not be
applicable to the other parts of the country because of social and cultural
difference.
The scope of the study has to be restricted to primary data, which were supplied
by the respondents.
Shortage of time is also reason for incomprehensiveness.
The views of the people are biased therefore it doesn’t reflect true picture.
The views and the preference of the people changes from time to time, hence the
result of the project may not be applicable in long run.
2
1.6 CHAPTERIZATION
CHAPTER 1
This chapter deals introduction, statement of the problem, objectives,scope and
limitation of the study.
CHAPTER 2
This chapter deals with the industry and company profile.
CHAPTER 3
This chapter deals with the research methodology.
CHAPTER 4
This chapter deals with the analysis and interpretation.
CHAPTER 5
This chapter deals with the findings, suggestions and conclusion.
3
CHAPTER 2
2.1 INTRODUCTION ABOUT TWO WHEELERS
India is the second largest manufacturer and producer of two-wheelers in the world. It
stands next only to Japan and China in terms of the number of two-wheelers produced
and domestic sales respectively. This distinction was achieved due to variety of reasons
like restrictive policy followed by the Government of India towards the passenger car
industry, rising demand for personal transport, inefficiency in the public transportation
system etc.
The Indian two-wheeler industry made a small beginning in the early 50s when
Automobile Products of India (API) started manufacturing scooters in the country. Until
1958, API and Enfield were the sole producers. In 1948, Bajaj Auto began trading in
imported Vespa scooters and three-wheelers. Finally, in 1960, it set up a shop to
manufacture them in technical collaboration with Piaggio of Italy. The agreement expired
in 1971.
In the initial stages, the scooter segment was dominated by API, it was later overtaken by
Bajaj Auto. Although various government and private enterprises entered the fray for
scooters, the only new player that has lasted till today is LML.
Under the regulated regime, foreign companies were not allowed to operate in India. It
was a complete seller market with the waiting period for getting a scooter from Bajaj
Auto being as high as 12 years.
The motorcycles segment was no different, with only three manufacturers viz Enfield,
Ideal Jawa and Escorts. While Enfield bullet was a four-stroke bike, Jawa and the
Rajdoot were two-stroke bikes. The motorcycle segment was initially dominated by
Enfield 350cc bikes and Escorts 175cc bike. The two-wheeler market was opened to
foreign competition in the mid-80s. And the then market leaders - Escorts and Enfield -
were caught unaware by the onslaught of the 100cc bikes of the four Indo-Japanese joint
ventures. With the availability of fuel efficient low power bikes, demand swelled,
4

resulting in Hero Honda - then the only producer of four stroke bikes (100cc category),
gaining a top slot.
The first Japanese motorcycles were introduced in the early eighties. TVS Suzuki and
Hero Honda brought in the first two-stroke and four-stroke engine motorcycles
respectively. These two players initially started with assembly of CKD kits, and later on
progressed to indigenous manufacturing. In the 90s the major growth for motorcycle
segment was brought in by Japanese motorcycles, which grew at a rate of nearly 25%
CAGR in the last five years.
The industry had a smooth ride in the 50s, 60s and 70s when the Government prohibited
new entries and strictly controlled capacity expansion. The industry saw a sudden growth
in the 80s. The industry witnessed a steady growth of 14% leading to a peak volume of
1.9mn vehicles in 1990.
The entry of Kinetic Honda in mid-eighties with a variometric scooter helped in
providing ease of use to the scooter owners. This helped in inducing youngsters and
working women, towards buying scooters, who were earlier, inclined towards moped
purchases. In the 90s, this trend was reversed with the introduction of scooterettes. In line
with this, the scooter segment has consistently lost its part of the market share in the two-
wheeler market.
In 1990, the entire automobile industry saw a drastic fall in demand. This resulted in a
decline of 15% in 1991 and 8% in 1992, resulting in a production loss of 0.4mn vehicles.
Barring Hero Honda, all the major producers suffered from recession in FY93 and FY94.
Hero Honda showed a marginal decline in 1992.
The reasons for recession in the sector were the incessant rise in fuel prices, high input
costs and reduced purchasing power due to significant rise in general price level and
credit crunch in consumer financing. Factors like increased production in 1992, due to
new entrants coupled with the recession in the industry resulted in company either
reporting losses or a fall in profits. India is one of the very few countries manufacturing
5
three-wheelers in the world. The two wheeler population has almost doubled in 1996
from a base of 12.6mn in 1990.
2.2 TVS PROFILE
TVS Motor Company Ltd, the flagship company of TVS Group is the third largest two-
wheeler manufacturer in India. The company manufactures a wide range of two-wheelers
from mopeds to racing inspired motorcycles. The company is having their manufacturing
plants at Hosur in Tamilnadu, Mysore in Karnataka and Solan in Himachal Pradesh. They
are also having one unit located at Indonesia. Their subsidiaries include Sundaram Auto
Components Ltd, TVS Motor Company (Europe) BV, TVS Motor (Singapore) Pte Ltd,
PT TVS Motor Company, Indonesia, TVS Energy Ltd and TVS Housing Ltd. TVS Motor
Company Ltd is a part of Sundaram Clayton group in TVS group of companies. In the
year 1979, Sundaram-Clayton Ltd started Moped Division at Hosur to manufacture TVS
50 mopeds. In the year 1982, the company entered into a technical know-how and
assistance agreement with Suzuki Motor Co Ltd of Japan and in the year 1985, they
incorporated a new company Lakshmi Auto Components Pvt Ltd for the manufacture of
critical engines and transmission parts
In the year 1986, the company acquired the assets of the moped division from Sundaram
Clayton Ltd. Also, the name of the company was changed from Indo Suzuki Motorcycles
Ltd to TVS Suzuki Ltd. In the year 1992, they launched two modes of motor cycles
namely, Samurai and Shogun and in the year 1993, they launched TVS Scooty. During
1999-2000, TVS Suzuki Ltd was amalgamated with Sundaram Auto Engineers Ltd, an
unlisted group company which was incorporated in the year 1992. As per the scheme, all
the assets and liabilities of erstwhile TVS Suzuki Ltd together with all obligations and
contingent liabilities were vested in Sundaram Auto Engineers (India) Ltd with effect
from April 22, 1999. This merged entity was later renamed TVS Suzuki Ltd. The TVS
group and Suzuki Motor Corporation parted ways from their 15-year-old joint venture on
September 27, 2001. The shares held by the Suzuki Motor Corporation were acquired by
Anusha Investments Ltd, a wholly owned subsidiary of Sundaram-Clayton Ltd for Rs. 9
crore. Thus, the company became a subsidiary of Sundaram-Clayton Ltd with effect from
6
November 15, 2001. Since, Suzuki Motor Corporation ceased to be a shareholder of the
company, the company cannot use the word 'Suzuki' as the part of their name and hence
the name of the company was changed to TVS Motor Company Ltd.
During the year 2007-08, the company commenced commercial production from its
Nalagarh Plant located in Himachal Pradesh. They commenced their commercial
production from their state-of-the art plant located at Karawang in Indonesia and
launched TVS Neo, which is exclusively developed for the Indonesian market. During
the year, the company launched various new products and variants such as TVS Flame,
Apache RTR, StaR Sport, StaR City 110 cc, Scooty Teenz Electric, TVS Tru4 Oil. In
March 2008, the company launched their three wheeler, TVS King in two variants,
namely two stroke petrol and two stroke LPG. The company won the Team Tech 2007
Award of Excellence for Integrated use of Advanced Computer Aided Engineering
Technologies in product development. They also won the prestigious SAP ACE 2007
Awards for Customer Excellence in the Most Innovative Netweaver Category for several
SAP implementations that are put in place. In June 2008, the company entered into a
contract manufacturing arrangement with Mahabharat Motors Manufacturing Pvt Ltd
whereby TVS motor cycles will be manufactured at the latter's two-wheeler
manufacturing facility that is located on the outskirts of Kolkata. TVS would help
Mahabharat Motors to set up the factory and provides engineering support to them. The
production would commence from June 2009. During the year 2008-09, the company
launched Scooty Streak, a tough and trendy variant of Scooty Pep+ and Apache RTR RD,
premium segment motorcycle. Also, they launched their three-wheeler, TVS King in six
statesThus, Sundaram-Clayton Ltd became a subsidiary of T V Sundram Iyengar & Sons
Ltd. Consequent to this acquisition; the company also became the subsidiary of TVS with
effect from June 3, 2009.
During the year 2009-10, the company launched TVS JIVE and TVS Wego in the
market. They also launched a four stroke three-wheeler with superior features. They
commenced export of TVS Apache to Brazil.
7
2.3 COMPANY PROFILE
The chairman of Chinnasamy TVS Agencies is Mr. Chinnasamy, he started the company
in 1980. The Managing Director is Mr. C.Ramesh.
8
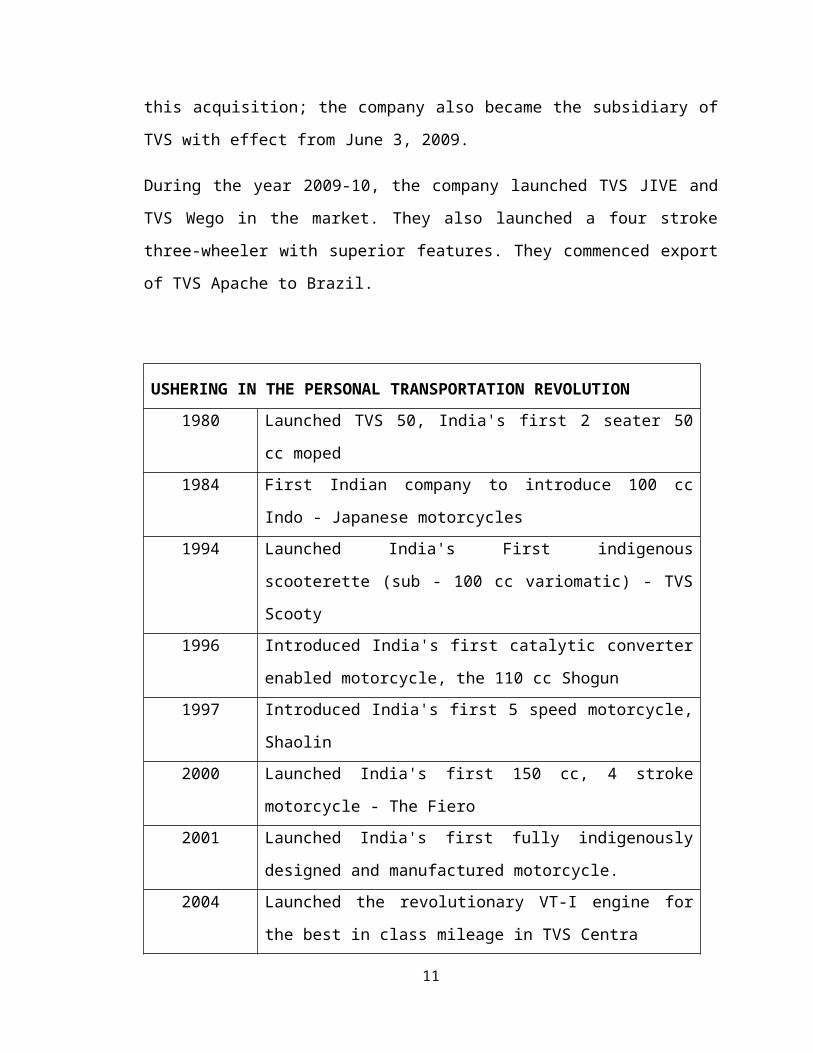
USHERING IN THE PERSONAL TRANSPORTATION REVOLUTION
1980 Launched TVS 50, India's first 2 seater 50 cc moped
1984 First Indian company to introduce 100 cc Indo - Japanese
motorcycles
1994 Launched India's First indigenous scooterette (sub - 100 cc
variomatic) - TVS Scooty
1996 Introduced India's first catalytic converter enabled motorcycle, the
110 cc Shogun
1997 Introduced India's first 5 speed motorcycle, Shaolin
2000 Launched India's first 150 cc, 4 stroke motorcycle - The Fiero
2001 Launched India's first fully indigenously designed and
manufactured motorcycle.
2004 Launched the revolutionary VT-I engine for the best in class
mileage in TVS Centra
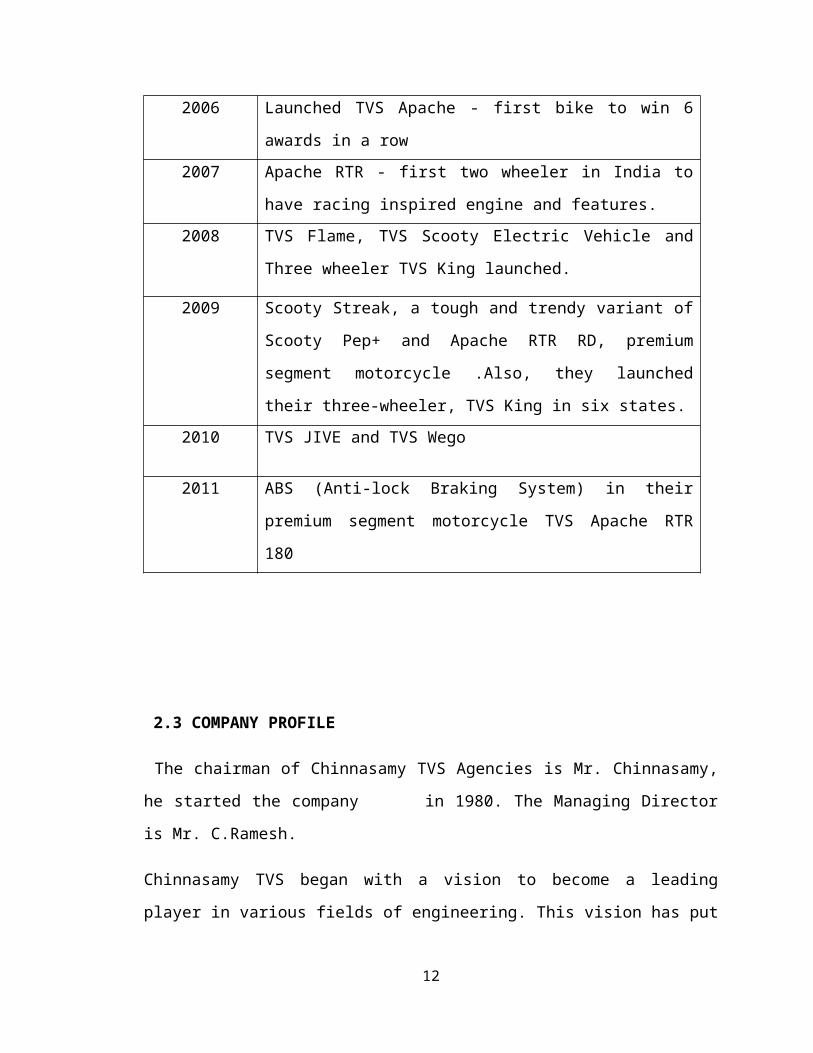
2006 Launched TVS Apache - first bike to win 6 awards in a row
2007 Apache RTR - first two wheeler in India to have racing inspired
engine and features.
2008 TVS Flame, TVS Scooty Electric Vehicle and Three wheeler TVS
King launched.
2009 Scooty Streak, a tough and trendy variant of Scooty Pep+ and
Apache RTR RD, premium segment motorcycle .Also, they
launched their three-wheeler, TVS King in six states.
2010 TVS JIVE and TVS Wego
2011 ABS (Anti-lock Braking System) in their premium segment
motorcycle TVS Apache RTR 180

Chinnasamy TVS began with a vision to become a leading player in various fields of
engineering. This vision has put it on a consistent growth path. Today our group has
operations in variety of areas.
The very first business of our chairman was in auto mobile. The involvement of our
group in motor vehicles thus dates back to our formative years. In line with this strength,
our group has taken up the dealership of TVS auto, a well known producer of two-
wheelers for decades, which sells under the TVS brand name.
SHOWROOM & SERVICE
The range of models is displayed in an attractive showroom which is situated in
Krishnagiri. The showroom is managed by an able team of managers and sales personnel.
The unit has a modern high-technical service station, which meets the standards of TVS
auto, to facilitate after sales service, Maintenance and repairs of all TVS motor vehicles,
genuine spare parts are also available for customers. With the growth in demand for two
wheelers and introduction of advanced models, our dealership foresees a favorable future
in years to come.
2.4 PROFILE OF THE PRODUCT
The Chinnasamy TVS Company promoted the following brands due to the
demand in Krishnagiri district.
TVS Apache
TVS Flame
TVS Jive – The Clutch Free Wonder
TVS Star Sport
TVS Star City
TVS Apache
TVS Apache is a motorcycle launched by TVS Motors. TVS Apache is currently
available in four variants: Apache 150, Apache RTR FI 160, Apache RTR 160 and
9

Apache 180. In each model, RTR stands for "Racing Throttle Response." The RTR FI
160 retails at around Rs 70,000 Currently more than 250,000 Apaches are on road.
TVS Apache RTR 180 ABS, is the first of its kind in India, that includes the ABS
technology i.e. Anti-lock Brake System. The system would be a boon in situations which
demand hard braking or while driving on damp and slippery roads. It would help prevent
imminent wheel lock and any misbalances. The TVS Apache RTR 180 ABS has also
been fitted with a modern Hydraulic- Electronic Control Unit (HECU), supported by
speed sensing machinery
Technical Specifications
Displacement: 177.4cc
Engine: Single Cylinder, 4 Stroke
Power: 17.3bhp@8500rpm
Torque: 15.5Nm@6500rpm
Transmission: 5 Speed gears
Chassis: Double Cradle
Cooling: Air Cooling
Acceleration: 0 - 60 in 4.35 seconds
Fuel tank: 16 liters
Wheel base: 1326mm
Wheel type: 6 spoke Mage alloys
Safety Features
No wheel skidding
Better brake performance on wet roads)
Very safe regardless of driver skill
Rear Wheel Lift-off protection (RLP)
Independent control
TVS Flame
Design and Styling
10
The TVS calls their design approach for Flame as Delta edge. This is inspired by the
delta wing of fighter jets and features design cues with a triangular theme, like the arrow
shaped headlight. The turn indicator, named Trafficators by TVS is integrated to the fuel
tank scoops.
Comfort and Handling
The bike has a sporty stance and provides good handling but vibrations are present at
speeds above 80 km/h.
Performance and fuel economy
After the high court ruling, TVS launched the bike with a modified engine. The removal
of spark plug was accompanied by retuning of the engine with changed mapping and gear
ratios. The engine is developed and patented by AVL and is licensed to TVS. The bike
does the 0–60 km/h in 6.5 seconds and is capable of reaching a top speed of almost
100 km/h with a fuel economy of 79 kmpl for the single spark version. While the twin
spark version does the 0–60 km/h in 6.1 se conds and manages a top speed in excess of
100 km/h.
TVS Jive – The Clutch Free Wonder
TVS created waves in Indian Biking scenario when it announced its clutchless bike JIVE
in November last year, although its India’s second after Hero Honda Street, being it as
bike it sure did create a lot of waves. It raised many speculations as to how one can
actually ride a bike without having to use a clutch. Finally the bike hit the market and
bookings now open in all TVS showrooms across India. The bike looks similar to TVS
Star city and its next variant, the Sport. It has 5 spoke black alloy wheels and all black
treated engines. To be honest, the bike is not very eye catching in the looks department.
After the huge success of recently launched Apache RTR 180 & Flame SR125 and Flame
DS125 TVS India has tapped the market of gearless bikes with the launch of TVS Jive. It
is the first Indian two wheeler to feature automatic transmission. Jive comes with 4-speed
transmission but features a hand free gear R shift and it comes with T metric technology.
11
TVS Jive comes with gear Indicator and undersea space which can accommodate a bottle,
umbrella or any documents.
TVS Star Sport
TVS Sport from the house of Motors Company is a stylish, compact and affordable 100
cc motorcycle. Targeted at discerning urban motorcycle lovers, Sport offers sleek
contours and compact style. At the showroom, this bike costs around Rs. 37,000 with an
on-road price of around Rs. 42,250 at Ahmadabad. This includes standard ancillary
charges also. It is reported, Sport is available for lower prices in the capital city of Delhi,
while in Chennai the on road price of Star is quite high. Star Sport bike prices vary upon
the two-wheeler dealer's location.
TVS Star City
The all new TVS Star City looks stunning and seems as a new horse, thanks to its new
features and design cues. The bike has got sporty graphics, added features, aerodynamic
style and fuel efficient CVTi engine. TVS Star City has been gifted with bold and
beautiful front mask, it has body colour side panels that houses halogen type clear
headlamp. The mask has got aerodynamic black tinted wind screen; front turn indicator
are placed just either sides of the hood. TVS Star City has black colour rear view mirrors
mounted on handlebars
CHAPTER-3
12

RESEARCH METHODOLOGY
3.1 Definition
Research Methodology is a process by which the data are collected for the study from
various sources and they are processed, interpreted and analyzed using statistical tools to
derive useful information.
3.2 Research Designs
The researcher adopted the descriptive design for the study. Descriptive research
describes the state of affairs, as it is present, descriptive studies can be complex
demanding high degree of scientific skill on the part of researchers.
3.3 Data collection
The researcher collected two types of data namely.
Primary data
Secondary data
3.3.1 Primary data
Primary data is the data which is collected through observation or direct communication
with the respondent in one form or another. These are several methods for primary data
collection like Observation method, Interview method through schedule, through
questionnaires. The researcher collected data through questionnaire.
3.3.2 Secondary data
Secondary Data are those which have already been collected by someone else and which
have already been passed through statistical process. The researcher collected data from
Internet and Books.
3.4 Sample Unit
Target respondents for this study are customers of TVS two wheelers in Krishnagiri
town.
13
3.5 Sample Size
A sample is a subset of population. Typically, the population is very large, making a
census or a complete enumeration of all the values in the population impractical or
impossible. In this study the sample size is 130.
3.6 Sampling Method
The sample items are chosen as per the researcher’s simple random method. The method
used is simple random sampling.
3.7 Tools used for Analysis
Simple Percentage Analysis
Correlation Coefficient
Chi square
Simple Percentage Analysis
The percentage method is used for comparing certain feature. The collected data
represented in the form of tables and graphs in order to give effective visualization of
comparison made.
Actual population
Simple Percentage = ___________________ X 100
Sample size
Correlation
“The statistical tool with the help of which relationship between two or more than two
variables are studied is called correlation”
N ∑ XY – ( ∑ X) (∑ Y )
R =
N ∑ X2 - ( ∑ X ) 2 N ∑ Y2 - ( ∑ Y )2
Chi-Square test
14
Chi-square test is used when the set of observed frequencies obtained after
experimentation have to be supported by hypothesis or theory. The test is known as X2-
test of goodness of fit and is used to test if the deviation between observation
(experiment) and theory may be attributed to chance (fluctuations of sampling).
Here we have the assumption of H0 and H1. If the values come in accordance to the
depicted values then the hypothesis is accepted else it’s rejected.
S(O-E) 2
X2 = ——— where,
E
O = observed frequency
E = Expected frequency
3.8 Diagrams used for Analysis
Pie Chart
Column Chart
15

CHAPTER 4
ANAYSIS AND INTERPRETATION
Primary and secondary data were collected to conduct this study. Primary data were
collect through survey and personal discussion with customers. Secondary data were
collected from books, reports, brochures, internets, etc.
After the data has been collected from consumers it was then tabulated, edited and
analyzed in accordance with the scheme laid down for the purpose at the time of
developing the research plan. Percentage analysis and composite index was used for
analysis the data.
Editing of data is a process of examining the collected data. As a matter of fact editing
involves careful security of the complicated questionnaire or schedules. Editing is done
assure that the data are accurate, consistent with other facts gathered uniformly entered as
complete possible and been well arranged to facilitate coding and tabulation.
When a mass data has been assembled it becomes necessary for the researcher to arrange
the same in some kind of concise and logical order. This procedure is referred to as
tabulation. This tabulation is the process of summarizing the raw data and displaying the
same in compact from for further analysis.
16
TABLE - 4.1
TABLE SHOWING THE AGE WISE CLASSIFICATION OF THE
RESPONDENTS
SI. NO Age No. of Respondents Percentage
1 Below 25 years 39 30
2 26-35 58 45
3 36-45 26 20
4 Above 46 07 05
Total 130 100
(Source: Primary Data)
INFERENCE:
Out of 130 Respondents 30% are in the age group below 25 years, 45% are in the age
group 26 - 35 years and 20% are in the age group 36 - 45 and 5%are in the age group
above 46.
CHART - 4.1
CHART SHOWING THE AGE WISE CLASSIFICATION OF THE
RESPONDENTS
Below 25 years 26-35 36-45 Above 460
10
20
30
40
50
60
70
No. of RespondentsAGE
No.
of r
espo
nden
ts
17

TABLE-4.2
TABLE SHOWING THE EDUCATION-STATUS OF THE RESPONDENTS
(Source: Primary Data)
INFERENCE:
Out of 130 Respondents 50% are having school level education, 10% of the respondents
are College and 34% of the respondents are Professionals and 6% of the respondents are
others.
CHART- 4.2
CHART SHOWING THE EDUCATION-STATUS OF THE RESPONDENTS
School Level College Professionals Others0
10
20
30
40
50
60
70
NO. OF RESPONDENTSEducational Status
No.
of r
espo
nden
ts
18
SI.
NO
EDUCATION
STATUS
NO. OF
RESPONDENTSPERCENTAGE
1 School Level 65 50
2 College 13 10
3 Professionals 44 34
4 Others 08 06
Total 130 100

TABLE-4.3
TABLE SHOWING THE OCCUPATION WISE CLASSIFICATION OF THE
RESPONDENTS
SI. NO OCCUPATIONNO OF
RESPONDENTSPERCENTAGE
1 Students 9 7
2 Government Employees 26 20
3 Private Employees 33 25
4 Business man 41 32
5 Others 21 16
Total 130 100
(Source: Primary Data)
INFERENCE:
Out of 130 Respondents 25% of them are private employees,20% of them were
Government employees. 32% of the respondents were Business man and16% of the
respondents were Others and 7% of the respondents were Students.
CHART - 4.3
CHART SHOWING THE OCCUPATION WISE CLASSIFICATION OF THE
RESPONDENTS
Students Government Employees
Private Employees Business man Others0
5
10
15
20
25
30
35
40
45
NO OF RESPONDENTSOCCUPATION
NO
. OF
RESP
ON
DEN
TS
19

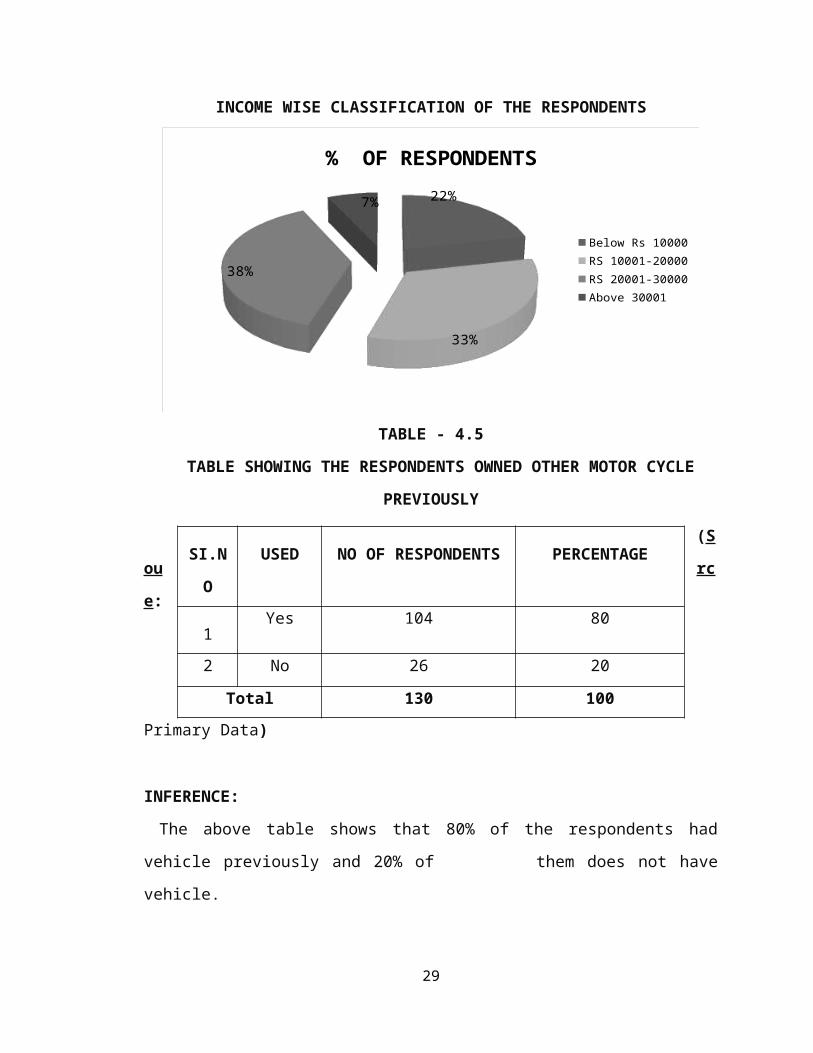
TABLE - 4.4
TABLE SHOWING THE INCOME WISE CLASSIFICATION OF THE
RESPONDENTS
SI.NO INCOME PER MONTH NO. OF
RESPONDENTS
PERCENTAGE
1Below Rs 10000 28 22
2 RS 10001-20000 43 33
3 RS 20001-30000 50 38
4 Above 30001 09 07
Total 130 100
(Source: Primary Data)
INFERENCE:
Out of 130 Respondents 73% earn below 10000, 16% of the respondents earn between Rs
10001 to 20000, 8% of the respondents earn between Rs 20001-30000 and 3% earn
above 30001.
CHART - 4.4
INCOME WISE CLASSIFICATION OF THE RESPONDENTS
22%
33%
38%
7%
% OF RESPONDENTS
Below Rs 10000RS 10001-20000RS 20001-30000Above 30001
TABLE - 4.5
20
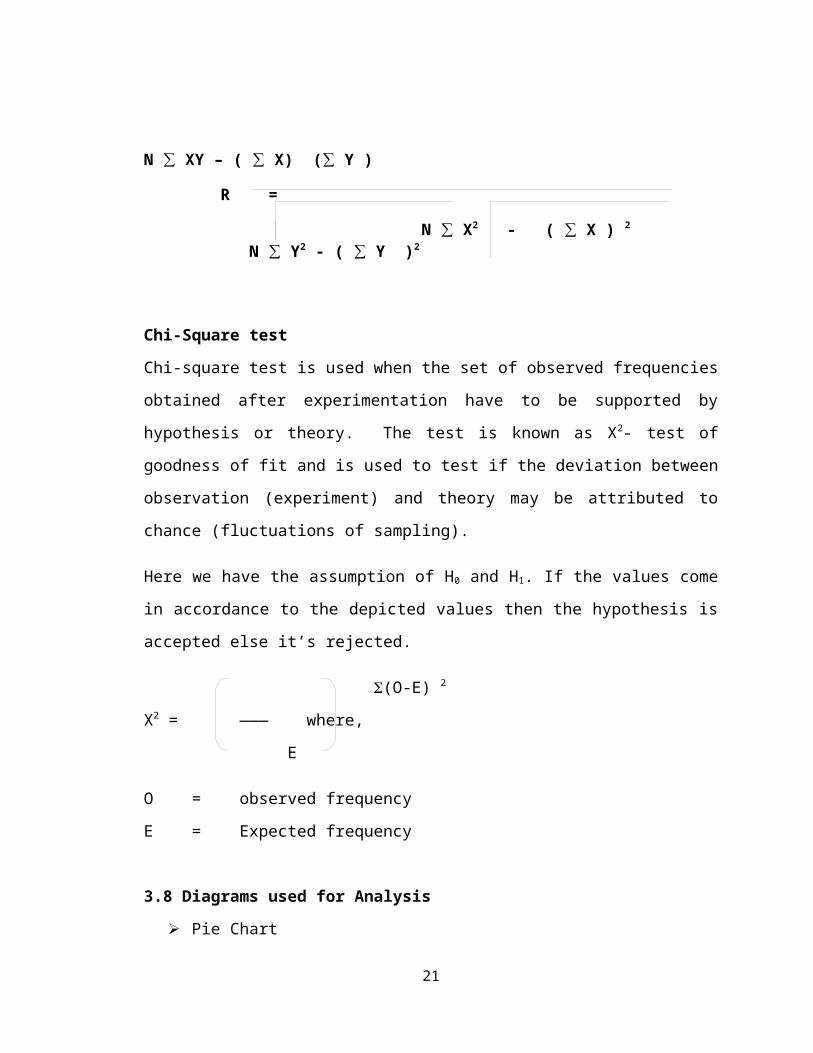
TABLE SHOWING THE RESPONDENTS OWNED OTHER MOTOR CYCLE
PREVIOUSLY
(Source: Primary Data)
INFERENCE:
The above table shows that 80% of the respondents had vehicle previously and 20% of
them does not have vehicle.
CHART - 4.5
CHART SHOWING THE RESPONDENTS OWNED OTHER MOTOR CYCLE
PREVIOUSLY
PERCENTAGE
Yes No
TABLE - 4.6
21
SI.NO USED NO OF RESPONDENTS PERCENTAGE
1Yes 104 80
2 No 26 20
Total 130 100

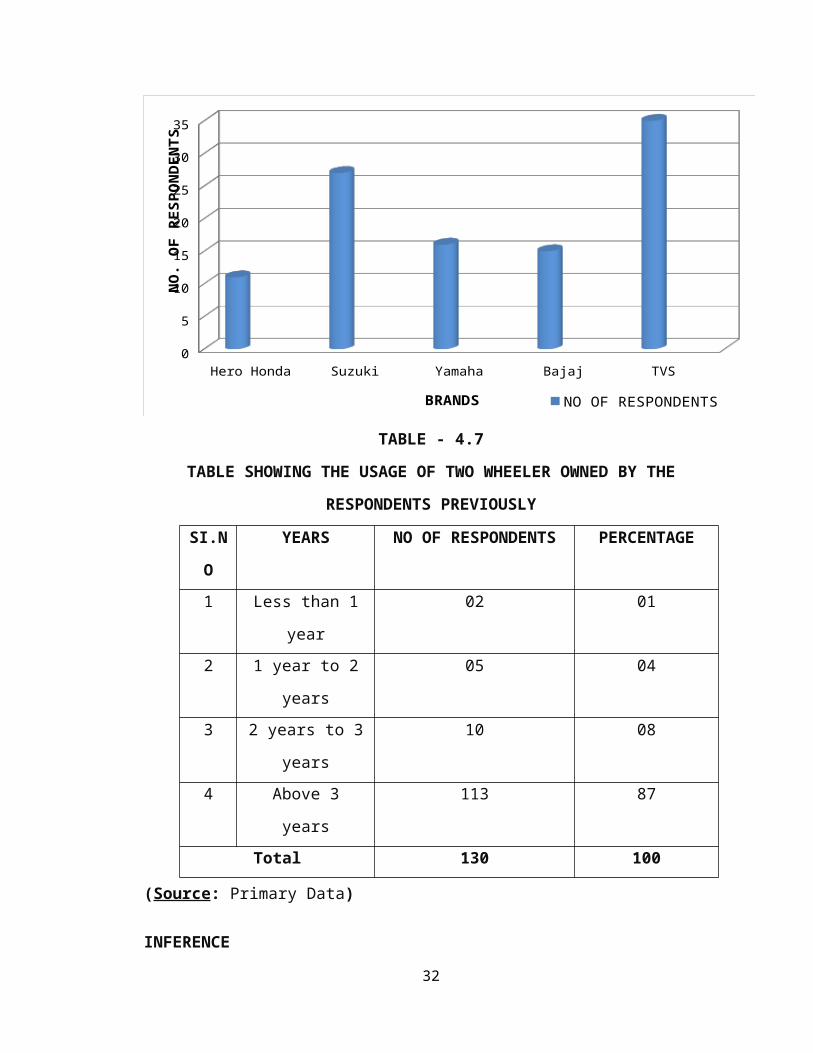
TABLE SHOWING THE PREVIOUS BRANDS OF MOTORCYCLE OWNED BY
THE RESPONDENTS
(Source: Primary Data)
INFERENCE:
The above table shows that 11% of the respondents had Hero Honda and 26% of them
have suzuki and 15% of them had Yamaha and 14% of them had Bajaj and 34% of them
had TVS.
CHART - 4.6
CHART SHOWING THE SHOWING THE PREVIOUS BRANDS OF
MOTORCYCLE OWNED BY THE RESPONDENTS
Hero Honda Suzuki Yamaha Bajaj TVS 0
5
10
15
20
25
30
35
NO OF RESPONDENTSBRANDS
NO
. O
F R
ES
PO
ND
EN
TS
22
SI.NO CLASSIFICATION NO OF RESPONDENTS PERCENTAGE
1 Hero Honda 11 11
2 Suzuki 27 26
3 Yamaha 16 15
4 Bajaj 15 14
5 TVS 35 34
Total 104 100
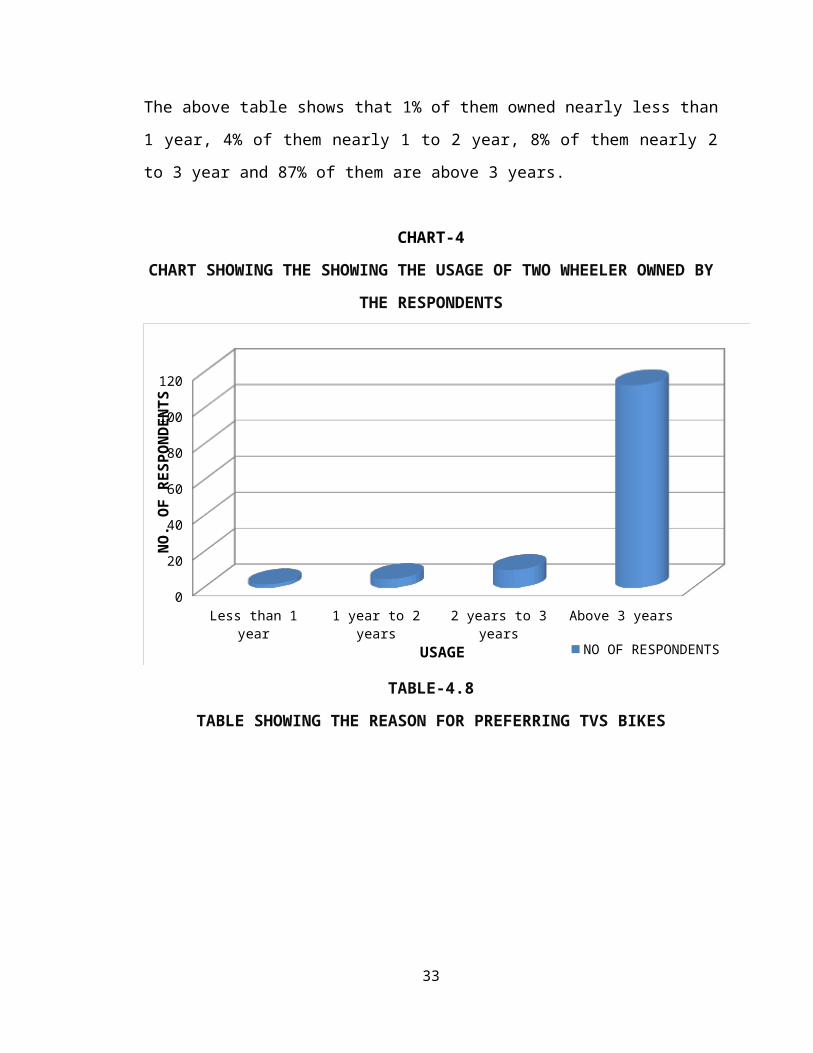
TABLE - 4.7
TABLE SHOWING THE USAGE OF TWO WHEELER OWNED BY THE
RESPONDENTS PREVIOUSLY
SI.N
O
YEARS NO OF RESPONDENTS PERCENTAGE
1 Less than 1 year 02 01
2 1 year to 2 years 05 04
3 2 years to 3 years 10 08
4 Above 3 years 113 87
Total 130 100
(Source: Primary Data)
INFERENCE
The above table shows that 1% of them owned nearly less than 1 year, 4% of them nearly
1 to 2 year, 8% of them nearly 2 to 3 year and 87% of them are above 3 years.
CHART-4
23
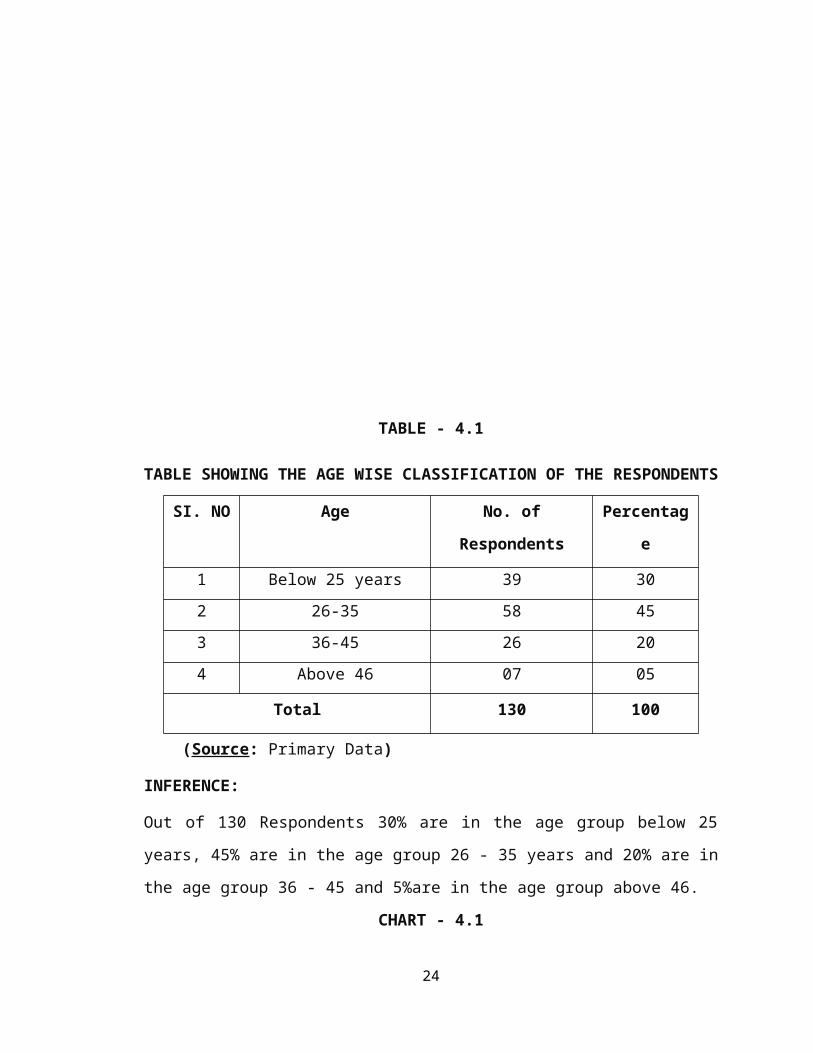
CHART SHOWING THE SHOWING THE USAGE OF TWO WHEELER
OWNED BY THE RESPONDENTS
Less than 1 year 1 year to 2 years 2 years to 3 years Above 3 years0
20
40
60
80
100
120
NO OF RESPONDENTSUSAGE
NO
. OF
RE
SPO
ND
EN
TS
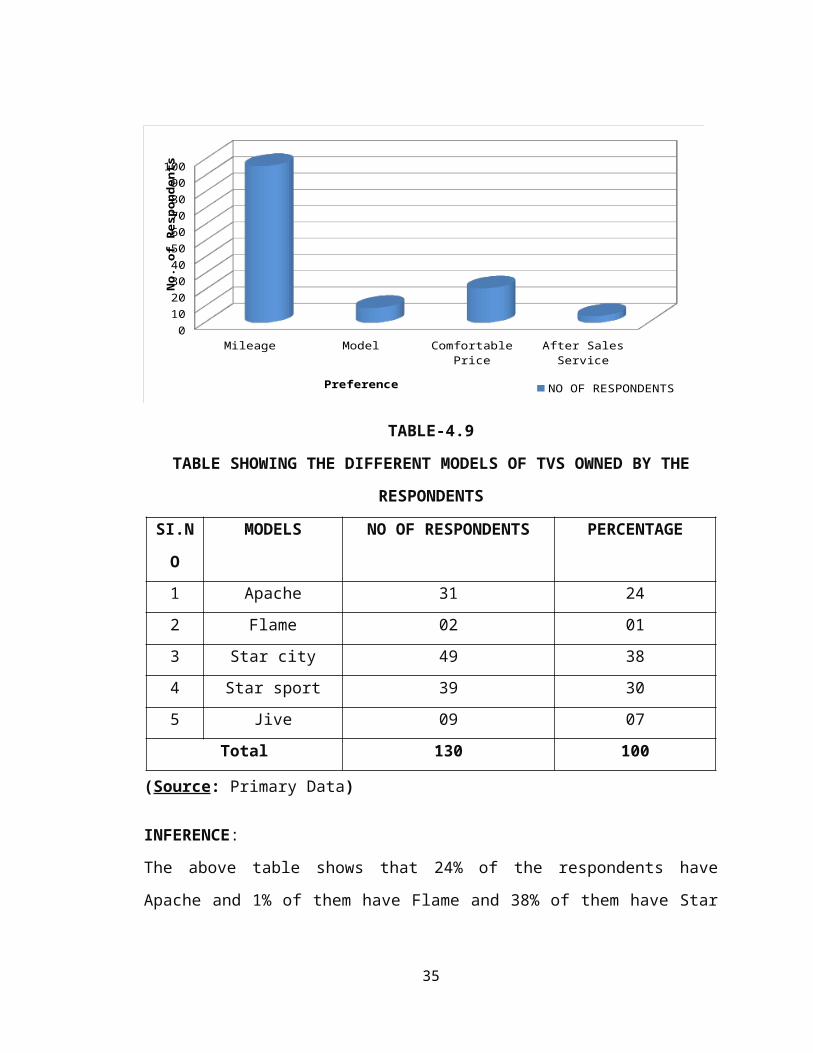
TABLE-4.8
TABLE SHOWING THE REASON FOR PREFERRING TVS BIKES
(Source: Primary Data)
INFERENCE:
The above table shows that 74% of the respondents prefer due to mileage and 7% of
them prefer due to model and 16% of them prefer due to comfortable price and 3% of
them prefer due to after sales service.
24
SI.NO REASON FOR
CHANGE
NO OF
RESPONDENTSPERCENTAGE
1 Mileage 96 74
2 Model 09 7
3 Comfortable Price 21 16
4 After Sales Service 04 03
Total 130 100

CHART-4.8
CHART SHOWING THE REASON FOR PREFERRING TVS BIKES
Mileage Model Comfortable Price After Sales Service0
102030405060708090
100
NO OF RESPONDENTSPreference
No
. of
Res
po
nd
ents
TABLE-4.9
TABLE SHOWING THE DIFFERENT MODELS OF TVS OWNED BY THE
RESPONDENTS
SI.N
O
MODELS NO OF RESPONDENTS PERCENTAGE
1 Apache 31 24
2 Flame 02 01
3 Star city 49 38
4 Star sport 39 30
5 Jive 09 07
Total 130 100
(Source: Primary Data)
INFERENCE:
The above table shows that 24% of the respondents have Apache and 1% of them have
Flame and 38% of them have Star city and 30% of them have Star sport and 7% of them
have Jive.
CHART- 4.9
25

CHART SHOWING THE DIFFERENT MODELS OF TVS OWNED BY THE
RESPONDENTS
Apache Flame Star city Star sport Jive0
10
20
30
40
50
60
NO OF RESPONDENTSMODELS
NO
. OF
RESP
ON
DEN
TS
TABLE - 4.10
TABLE SHOWING THE SOURCE OF AWARENESS ABOUT THE TVS
SI.NO SOURCES NO OF RESPONDENTS PERCENTAGE
1 Advertisement 59 45
2 Friends and Relatives 44 34
3 Experts 21 16
4 Sales Man 06 05
Total 130 100
(Source: Primary Data)
INFERENCE:
The above table shows that 34% of the respondents came to know through friend and
relatives and 16% of the respondents are recommended by the mechanics and 5% are
recommended by the sales man.
CHART-4.10
26
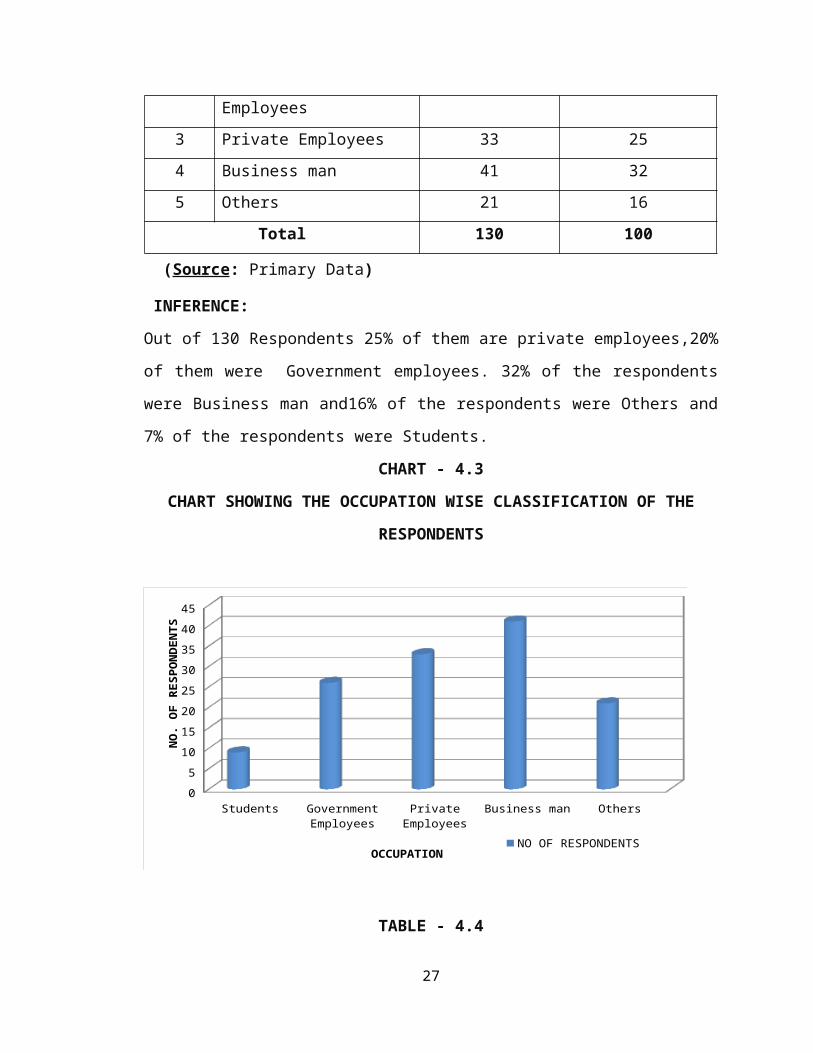
CHART SHOWING THE SOURCE OF AWARENESS ABOUT THE TVS
Advertisement Friends and Relatives Experts Sales Man0
10
20
30
40
50
60
70
NO OF RESPONDENTSSOURCE OF AWARENESS
NO
. OF
RESP
ON
DEN
TS
TABLE-4.11
TABLE SHOWING THE MEDIUM OF ADVERTISEMENY ABOUT TVS
SI.NO ADVERTISEMENT NO OF RESPONDENTS PERCENTAGE
1 Newspaper 61 47
2 Magazine 03 02
3 Television 26 20
4 Banners 17 13
5 Others 23 18
Total 130 100
(Source: Primary Data)
INFERENCE:
The above table shows that 47% of the respondents are attracted by newspaper and 2% of
the respondents are attracted by the magazine and 20% are attracted by television.
CHART - 4.11
CHART SHOWING THE MEDIUM OF ADVERTISEMENY ABOUT TVS
27

NewspaperMagazine
TelevisionBanners
Others
61
3
26
17 23
NO OF RESPONDENTS ADVERTISEMENTS
NO
. OF
RESP
ON
DEN
TS
TABLE-4.12
TABLE SHOWING THE REASONS FOR PURCHASE OF TVS TWO
WHEELERS
SI.NO REASON FOR
PURCHASE
NO OF
RESPONDENTSPERCENTAGE
1 Stylish 18 14
2 Brand image 65 50
3 Advertisement 06 05
4 Pick up 19 15
5 Credit Facilities 13 10
6 Availability of Spares 06 04
7 Choice of colors 03 02
28
Total 130 100
(Source: Primary Data)
INFERENCE:
The above table shows that 50% of the respondents had purchased TVS two wheelers for
its brand image, 15% of the respondents had taken for its pick up and 14% of the
respondents buy due to its stylish. 5% of the respondents purchase the TVS bikes due to
advertisement, 10% of the respondents buy due to the credit facilities available and 2% of
the respondents buy due to choice of colors available.
CHART - 4.12
CHART SHOWING THE REASONS FOR PURCHASE OF TVS TWO
WHEELERS
stylish
brand im
age
advertisem
entpick
up
credit f
acilities
availab
ility of sp
ares
choice of co
lors
0
10
20
30
40
50
60
70
no of respondentsREASON FOR PURCHASE
NO. O
F RES
POND
ENTS
29
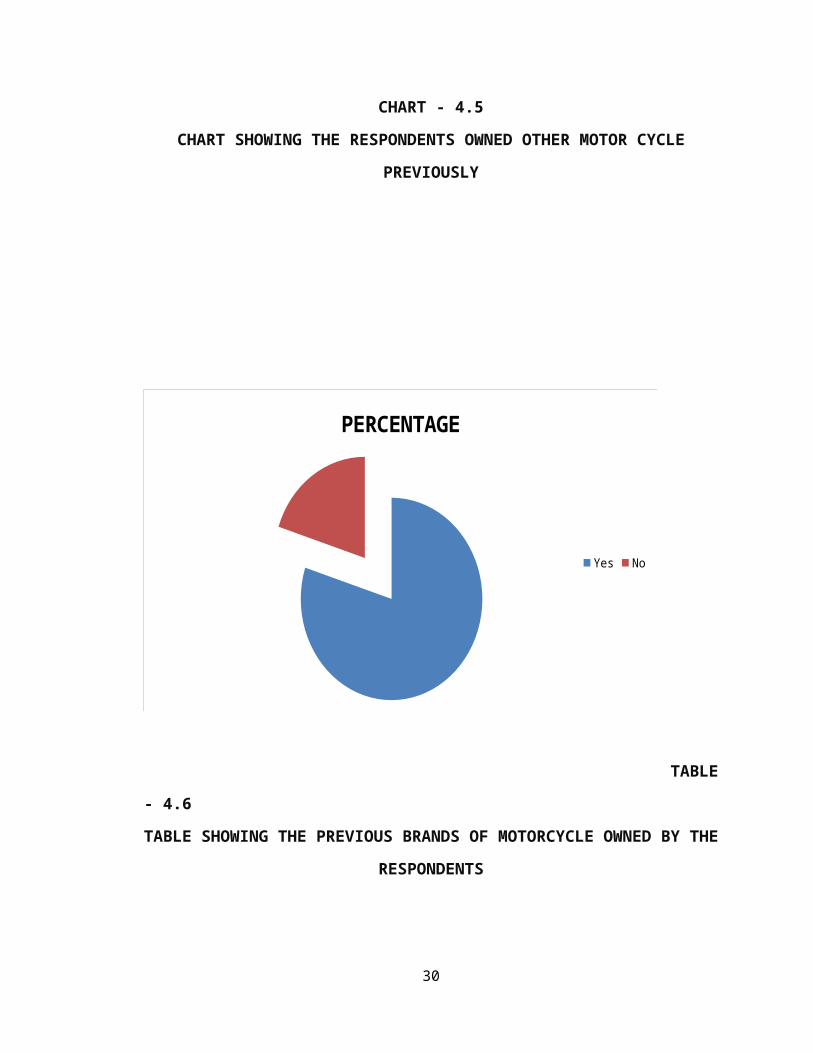
TABLE-4.13
TABLE SHOWING THE PERIOD OF PURCHASING TVS
(Source: Primary Data)
INFERENCE:
The above table shows that 59% of the respondents bought their vehicle in ordinary
season and 26% of the respondents bought their vehicle in exchange and 15% of the
respondents bought their vehicle in during special scheme.
CHART-4.13
CHART SHOWING THE PERIOD OF PURCHASING TVS
30
SI.NO PERIODOF
PURCHASE
NO OF
RESPONDENTSPERCENTAGE
1 Special Scheme 19 15
2 Ordinary season 77 59
3 Exchange by
Vehicle
34 26
Total 130 100

NO OF RESPONDENTS
Special Scheme
Ordinary season
Exchange by Vehicle
TABLE-4.14
TABLE SHOWING THE MODE OF PAYMENT BY THE RESPONDENT
(Source: Primary Data)
INFERENCE:
The above table shows that 85% of the respondents buy through installment and 15% of
them buy through ready cash.
CHART-4.14
THE MODE OF PAYMENT BY THE RESPONDENT
31
SI.N
O
MODE OF
PAYMENTNO OF RESPONDENTS PERCENTAGE
1 Installment 110 85
2 Ready cash 20 15
Total 130 100
NO OF RESPONDENTS
InstallmentReady cash
TABLE-4.15
TABLE SHOWING THE SOURCE OF FINANCE TO THE RESPONDENTS
Sl. No.SOURCE OF
FINANCENO OF
RESPONDENTSPERCENTAGE
1 Personal Saving 19 15
2 Loan From Bank 28 21
3 Loan From Office 71 55
4 Private Financial Institution
12 09
Total 130 100
(Source: Primary Data)
INFERENCE:
The above table shows that 15% of the respondents had source of finance through
personal saving and 9% arranged through private finance institution. From the above
table we can infer that 55% of respondents had source of finance through office.
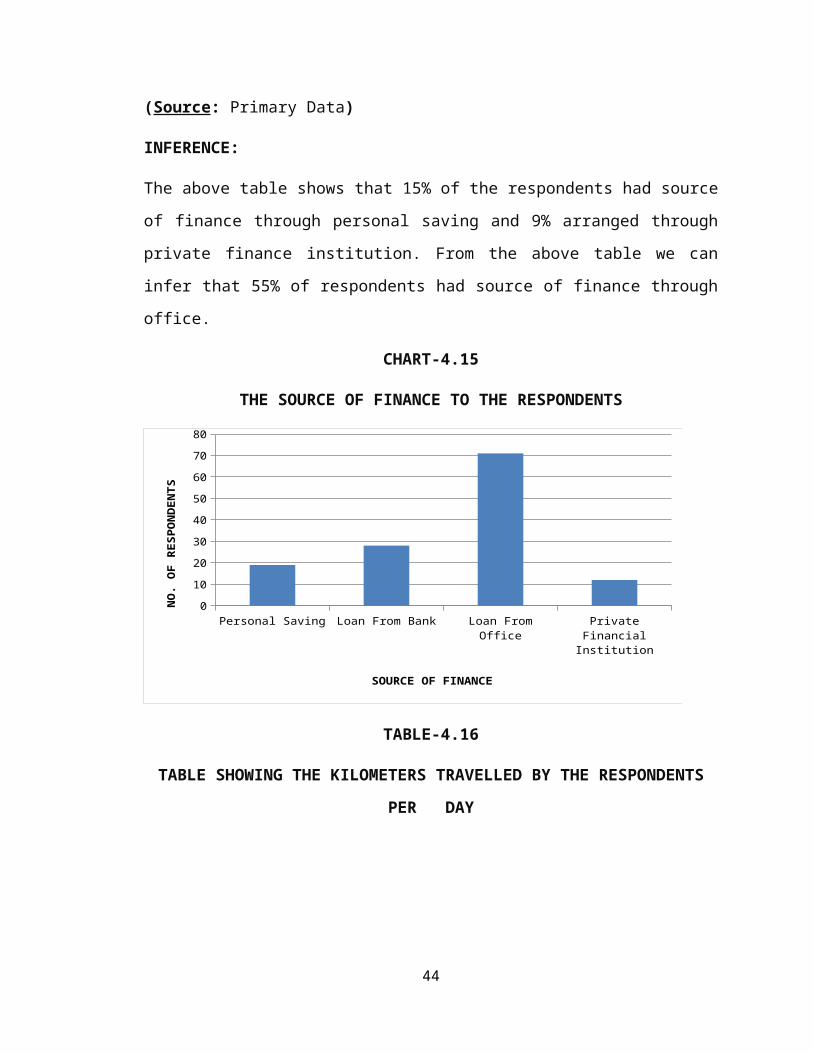
CHART-4.15
32
THE SOURCE OF FINANCE TO THE RESPONDENTS
Personal Saving Loan From Bank Loan From Office Private Financial Institution0
10
20
30
40
50
60
70
80
SOURCE OF FINANCE
NO
. OF
RESP
ON
DEN
TS
TABLE-4.16
TABLE SHOWING THE KILOMETERS TRAVELLED BY THE
RESPONDENTS PER DAY
(Source: Primary Data)
INFERENCE
The above table shows that 2% of them travel less than 10 km, 13% of them travel nearly
10 to 15 km, 15% of them travel nearly 16 to 20 km.
CHART-4.16
33
Sl. No. KILOMETERS NO OF RESPONDENTS PERCENTAGE
1 Less than 10 km 03 02
2 10 km to 15 km 17 13
3 16 km to 20 km 19 15
4 Above 20 km 91 70
Total 130 100
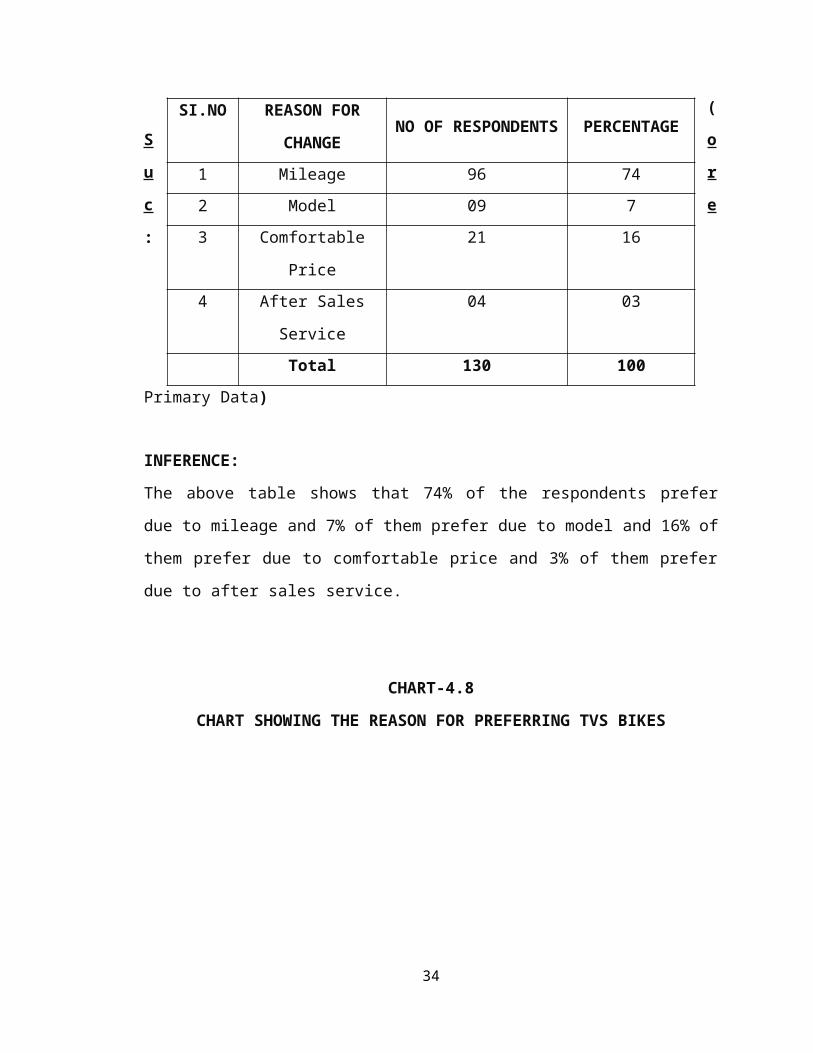
CHART SHOWING THE KILOMETERS TRAVELLED BY THE
RESPONDENTS PER DAY
NO OF RESPONDENTS
Less than 10 km 10 km to 15 km 16 km to 20 km Above 20 km
TABLE-4.17
TABLE SHOWING THE APPROXIMATE MILEAGE GIVEN PER LITER
(Source: Primary Data)
INFERENCE
The above table shows that 20% of the respondents two wheeler give mileage below 50
km, 31% of them respondents two wheeler give mileage nearly 51 to 60 km and 46% of
the respondents two wheeler give mileage nearly 61 to 70 km.
CHART-4.17
CHART SHOWING THE APPROXIMATE MILEAGE GIVEN PER LITER
34
Sl. No.KILOMETERS NO OF
RESPONDENTSPERCENTAGE
1 Below 50 km 26 20
2 51 to 60 km 40 31
3 61 to 70 km 60 46
4 Above 71 km 04 03
Total 130 100
Below 50 km 51 to 60 km 61 to 70 km Above 71 km 0
10
20
30
40
50
60
MILEAGE PER LITRE
NO
. OF
RESP
ON
DEN
TS
TABLE 4.18
TABLE SHOWING THE RESPONDENTS SATISFACTION TOWARDS
MILEAGE
SI.N
O
PARTICULARS NO OF
RESPONDENTS
PERCENTAGE
1 Highly Satisfied 81 62
2 Satisfied 49 38
3 NSNDS - -
4 Dissatisfied - -
5 Highly Dissatisfied - -
Total 130 100
(Source: Primary Data)
INFERENCE:
The above table shows that 62% of the respondents are highly satisfied, 38% of the
respondents are satisfied.
CHART-4.18
35
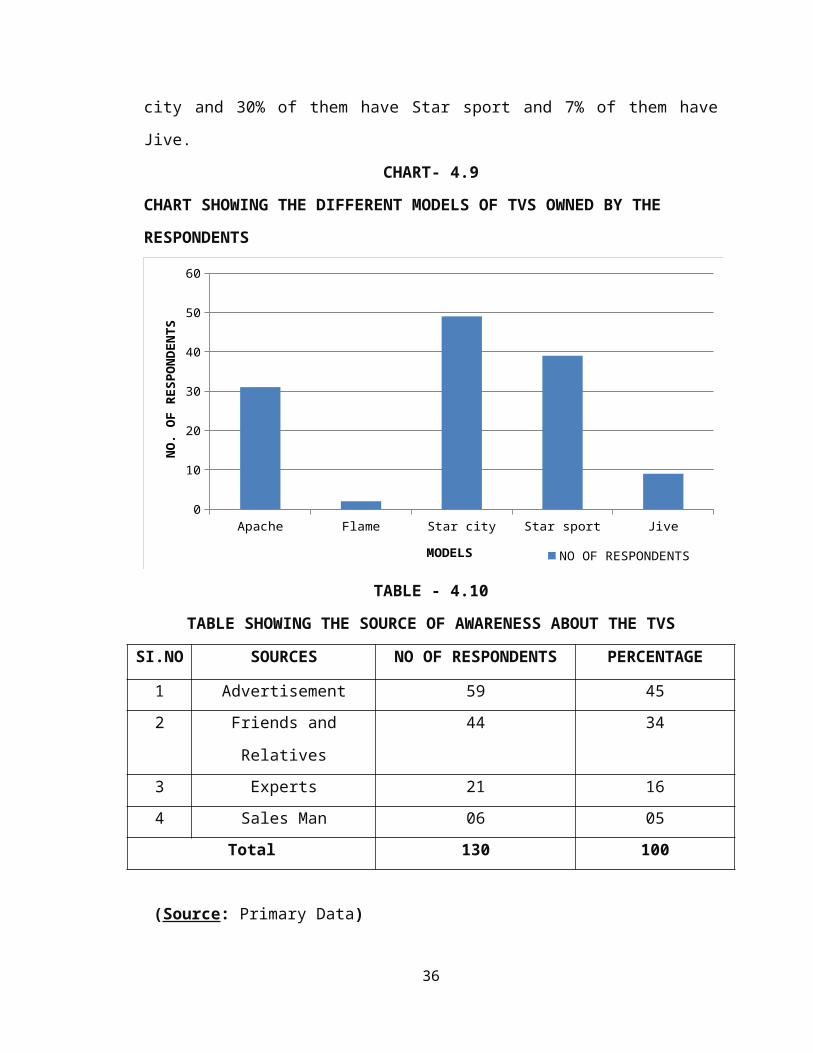
CHART SHOWING THE RESPONDENTS SATISFACTION LEVEL TOWARDS
MILEAGE
highly satisfied satisfied nsnds dissatisfied highly dissatisfied0
10
20
30
40
50
60
70
80
90
PARTICULARS
NO
.OF
RESP
ON
DEN
TS
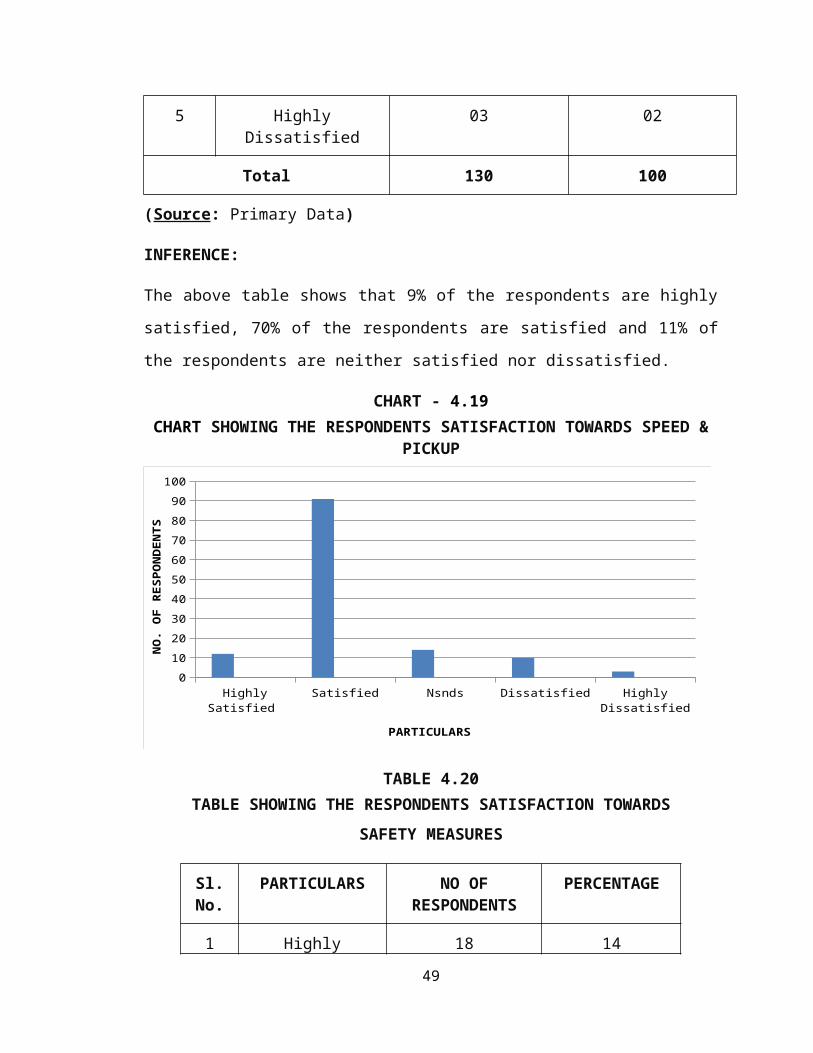
TABLE 4.19
TABLE SHOWING THE RESPONDENTS SATISFACTION TOWARDS SPEED & PICKUP
Sl. No.PARTICULARS NO OF
RESPONDENTSPERCENTAGE
1 Highly Satisfied 12 09
2 Satisfied 91 70
3 NSNDS 14 11
4 Dissatisfied 10 08
5 Highly Dissatisfied 03 02
Total 130 100
(Source: Primary Data)
INFERENCE:
The above table shows that 9% of the respondents are highly satisfied, 70% of the
respondents are satisfied and 11% of the respondents are neither satisfied nor dissatisfied.
36
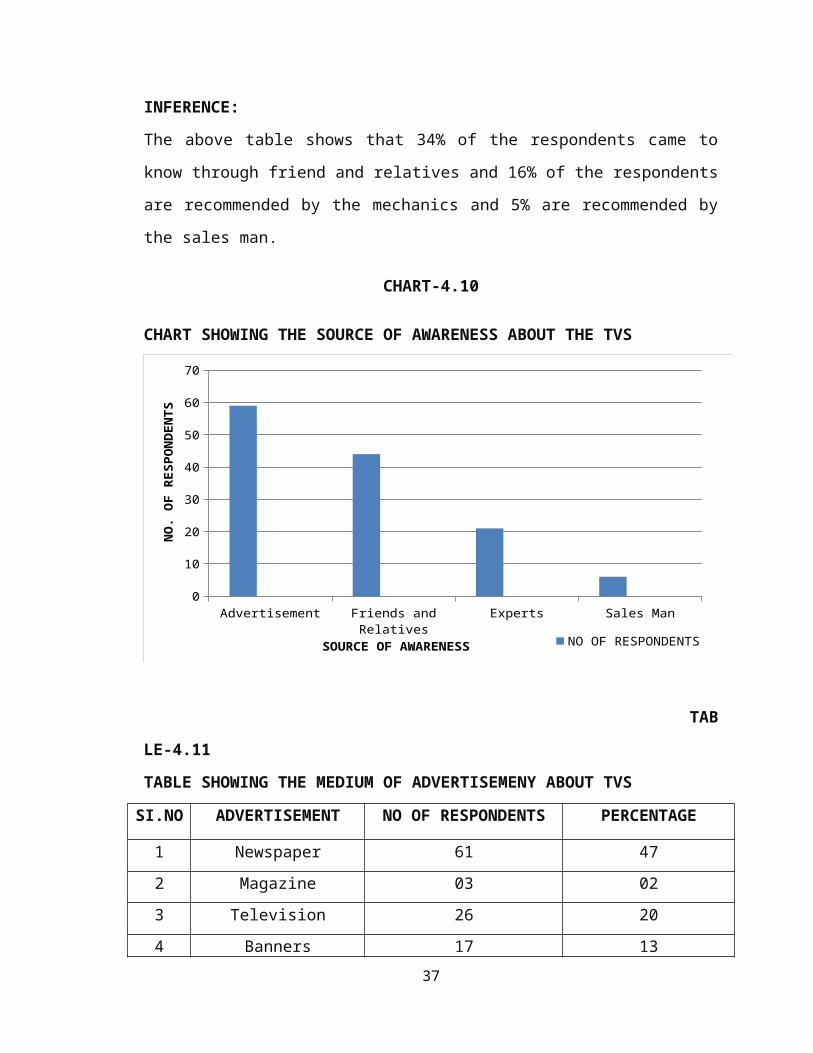
CHART - 4.19
CHART SHOWING THE RESPONDENTS SATISFACTION TOWARDS SPEED & PICKUP
Highly Satisfied Satisfied Nsnds Dissatisfied Highly Dissatisfied0
10
20
30
40
50
60
70
80
90
100
PARTICULARS
NO
. OF
RESP
ON
DEN
TS
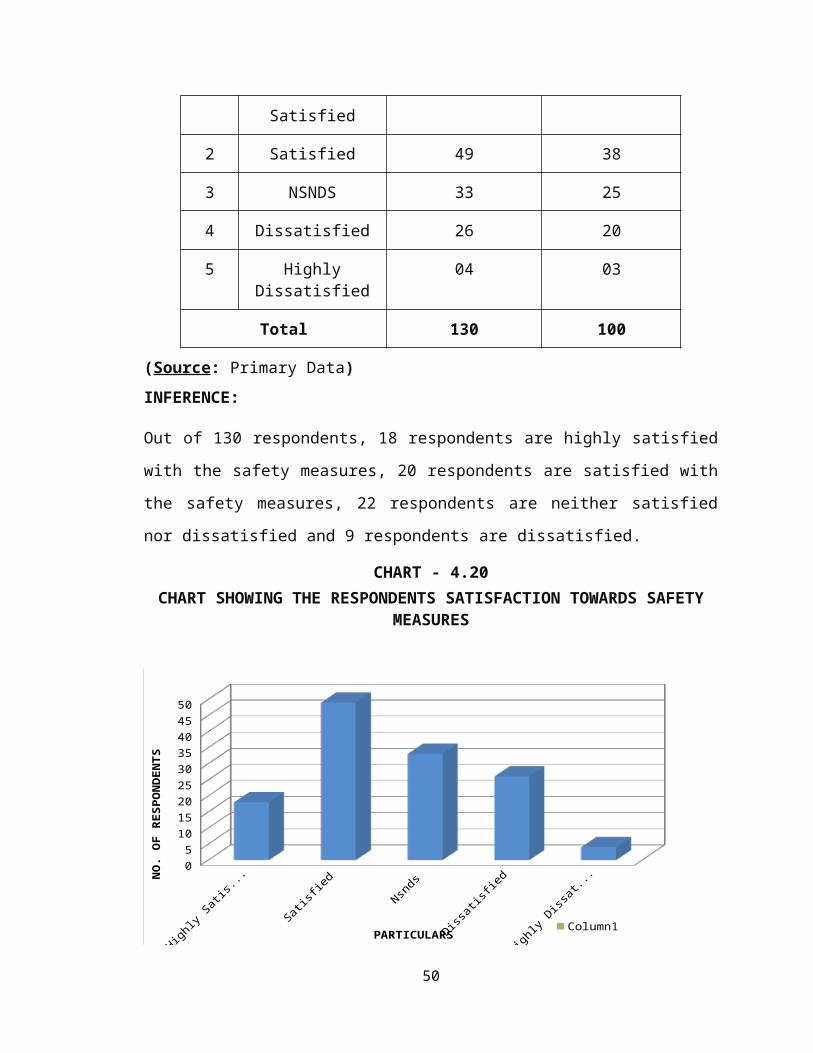
TABLE 4.20
TABLE SHOWING THE RESPONDENTS SATISFACTION TOWARDS
SAFETY MEASURES
Sl. No.
PARTICULARS NO OF RESPONDENTS
PERCENTAGE
1 Highly Satisfied 18 14
2 Satisfied 49 38
3 NSNDS 33 25
4 Dissatisfied 26 20
5 Highly Dissatisfied 04 03
Total 130 100
(Source: Primary Data)
INFERENCE:
Out of 130 respondents, 18 respondents are highly satisfied with the safety measures, 20
respondents are satisfied with the safety measures, 22 respondents are neither satisfied
nor dissatisfied and 9 respondents are dissatisfied.
37

CHART - 4.20
CHART SHOWING THE RESPONDENTS SATISFACTION TOWARDS SAFETY MEASURES
Highly Satisfied Satisfied Nsnds Dissatisfied Highly Dissatisfied05
101520253035404550
Column1
PARTICULARS
NO
. OF
RESP
ON
DEN
TS
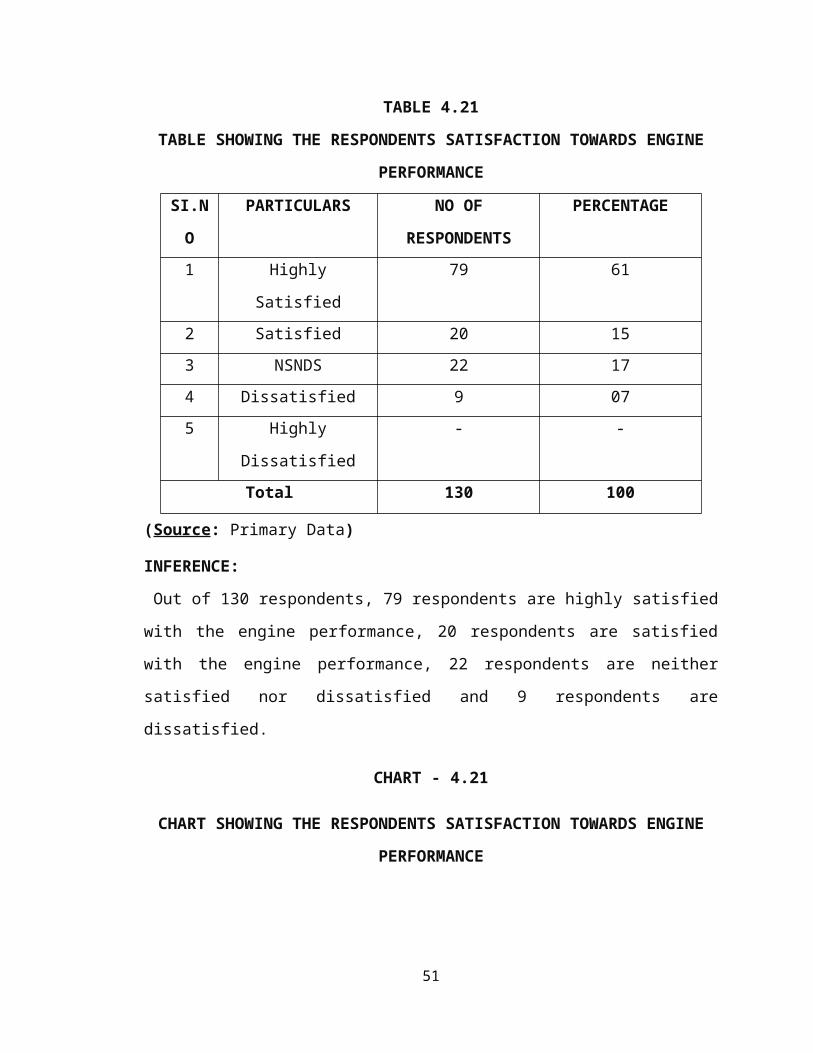
TABLE 4.21
TABLE SHOWING THE RESPONDENTS SATISFACTION TOWARDS
ENGINE PERFORMANCE
SI.N
O
PARTICULARS NO OF
RESPONDENTS
PERCENTAGE
1 Highly Satisfied 79 61
2 Satisfied 20 15
3 NSNDS 22 17
4 Dissatisfied 9 07
5 Highly Dissatisfied - -
Total 130 100
(Source: Primary Data)
INFERENCE:
Out of 130 respondents, 79 respondents are highly satisfied with the engine performance,
20 respondents are satisfied with the engine performance, 22 respondents are neither
satisfied nor dissatisfied and 9 respondents are dissatisfied.
CHART - 4.21
38
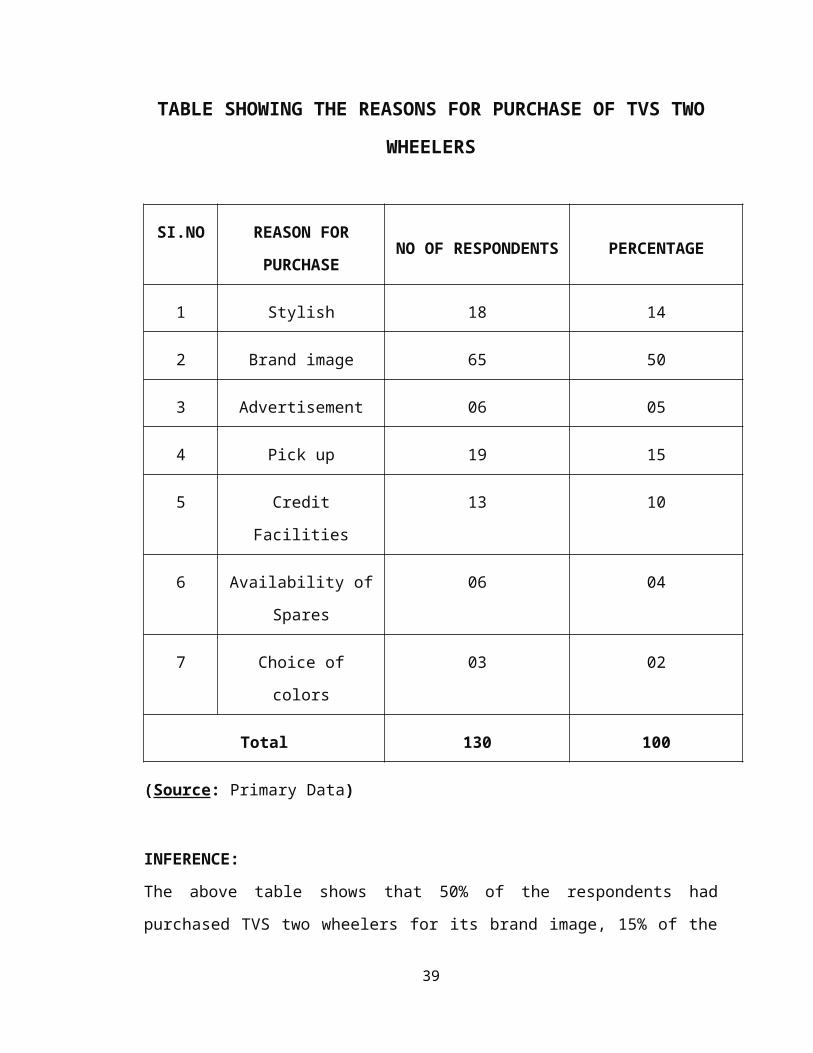
CHART SHOWING THE RESPONDENTS SATISFACTION TOWARDS
ENGINE PERFORMANCE
highly satisfied satisfied nsnds dissatisfied highly dissatisfied0
10
20
30
40
50
60
70
80
no of respondents
PARTICULARS
NO
> O
F RE
SPO
ND
DEN
TS
TABLE 4.22
TABLE SHOWING THE RESPONDENTS SATISFACTION TOWARDS PRICE
SI.NO PARTICULARS NO OF
RESPONDENTS
PERCENTAGE
1 Highly Satisfied 38 29
2 Satisfied 46 35
3 NSNDS 22 17
4 Dissatisfied 19 15
5 Highly Dissatisfied 05 04
Total 130 100
(Source: Primary Data)
INFERENCE:
Out of 130 respondents, 38 respondents are highly satisfied with the price, 46
respondents are satisfied with the price, 22 respondents are neither satisfied nor
dissatisfied and 19 respondents are dissatisfied. While remaining 5 respondents are highly
dissatisfied.
39

CHART - 4.22
CHART SHOWING THE RESPONDENTS SATISFACTION TOWARDS PRICE
highly satisfied satisfied neutral dissatisfied highly dissatisfied0
10
20
30
40
50
60
70
80
no of respondentsSeries2Column1
PARTICULARS
NO
> O
F RE
SPO
ND
ENTS
TABLE 4.23
TABLE SHOWING THE RESPONDENTS SATISFACTION TOWARDS
BREAK SYSTEMS
SI.NO PARTICULARS NO OF
RESPONDENTS
PERCENTAGE
1 Highly Satisfied 20 15
2 Satisfied 52 40
3 NSNDS 35 27
4 Dissatisfied 23 18
5 Highly Dissatisfied - -
Total 130 100
(Source: Primary Data)
INFERENCE:
Out of 130 respondents, 20 respondents are highly satisfied with the break systems, 52
respondents are satisfied with the break systems, 35 respondents are neither satisfied nor
dissatisfied and 23 respondents are dissatisfied. While remaining 5 respondents are highly
dissatisfied.
40
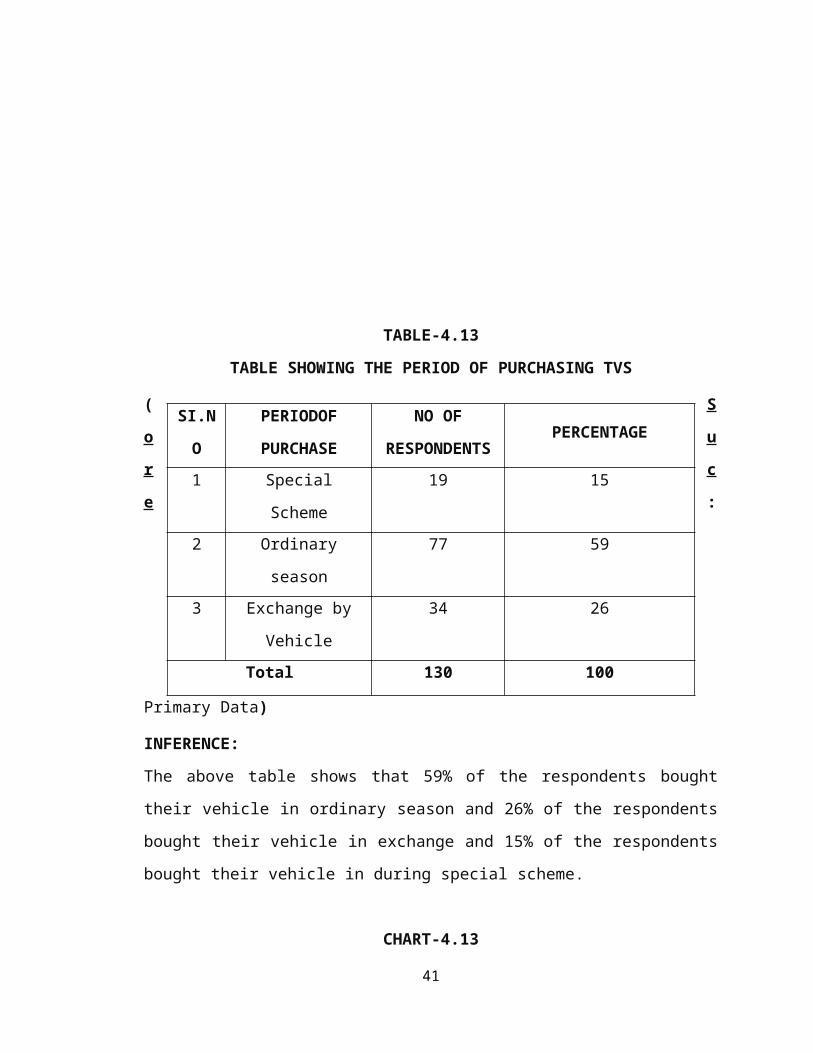
CHART - 4.23
CHART SHOWING THE RESPONDENTS SATISFACTION TOWARDS BREAK
SYSTEMS
highly satisfied satisfied nsnds dissatisfied highly dissatisfied0
10
20
30
40
50
60
respondents
PARTICULARS
NO
. OF
RE
SPO
ND
ENTS
TABLE - 4.24
TABLE SHOWING THE RESPONDENTS SATISFACTION TOWARDS
VEHICLE APPEARANCE
SI.N
O
PARTICULARS NO OF
RESPONDENTS
PERCENTAGE
1 Highly Satisfied 05 04
2 Satisfied 47 36
3 NSNDS 34 26
4 Dissatisfied 30 23
5 Highly Dissatisfied 14 11
Total 130 100
(Source: Primary Data)
INFERENCE:
Out of 130 respondents, 5 respondents are highly satisfied with the vehicle appearance,
47 respondents are satisfied with the vehicle appearance, 34 respondents are neither
satisfied nor dissatisfied and 30 respondents are dissatisfied. While remaining 14
respondents are highly dissatisfied.
41

CHART - 4.24
CHART SHOWING THE RESPONDENTS SATISFACTION TOWARDS
VEHICLE APPEARANCE
TABLE - 4.25
TABLE SHOWING THE RESPONDENTS SATISFACTION TOWARDS
MODELS
SI.NO PARTICULARS NO OF
RESPONDENTS
PERCENTAGE
1 Highly Satisfied 22 17
2 Satisfied 52 40
3 NSNDS 39 30
4 Dissatisfied 17 13
5 Highly Dissatisfied - -
Total 130 100
(Source: Primary Data)
INFERENCE:
Out of 130 respondents, 22 respondents are highly satisfied with the models, 52
respondents are satisfied with the models, 39 respondents are neither satisfied nor
dissatisfied and 17 respondents are dissatisfied.
42
Highly Satisfied Satisfied Nsnds Dissatisfied Highly Dissatisfied0
5
10
15
20
25
30
35
40
45
50
NO OF RESPONDENTS
PARTICULARS
NO
. OF
RES
PO
ND
ENTS
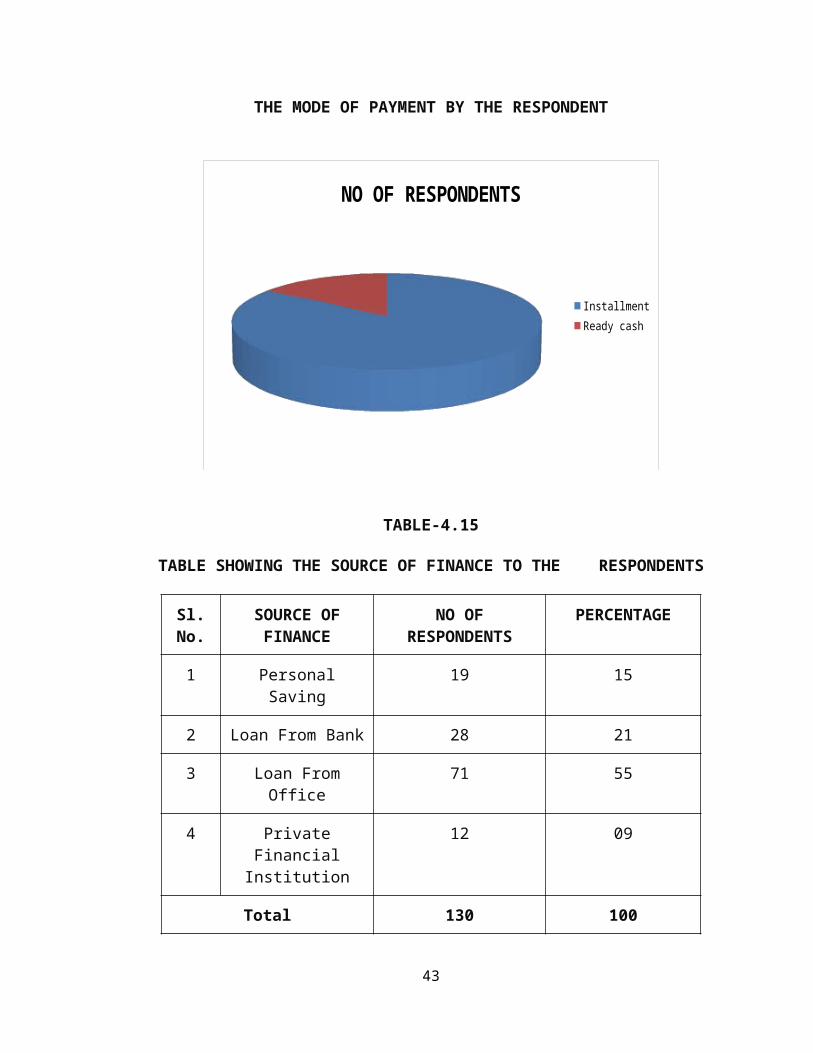
CHART - 4.25
CHART SHOWING THE RESPONDENTS SATISFACTION TOWARDS
MODELS
highly satisfied satisfied nsnds dissatisfied highly dissatisfied0
10
20
30
40
50
60
no of respondents
PARTICULARS
NO
. OF
RESP
ON
DEN
TS
TABLE 4.26
TABLE SHOWING THE RESPONDENTS SATISFACTION TOWARDS
RESALE VALUE
SI.NO PARTICULARS NO OF
RESPONDENTS
PERCENTAGE
1 Highly Satisfied 08 06
2 Satisfied 30 23
3 NSNDS 32 25
4 Dissatisfied 38 29
5 Highly Dissatisfied 22 17
Total 130 100
(Source: Primary Data)
INFERENCE:
Out of 130 respondents, 6 respondents are highly satisfied with the resale value, 30
respondents are satisfied with the resale value, 32 respondents are neither satisfied nor
43
dissatisfied and 28 respondents are dissatisfied. While remaining 22 respondents are
highly dissatisfied.
CHART - 4.26
CHART SHOWING THE RESPONDENTS SATISFACTION TOWARDS
RESALE VALUE
highly satisfied satisfied nsnds dissatisfied highly dissatisfied0
5
10
15
20
25
30
35
40
no of respondents
PARTICULARS
NO
. OF
RES
PO
ND
ENTS
TABLE-4.27
TABLE SHOWING THE OVERALL PERFORMANCE OF TVS
SI.N
O
PARTICULARS NO OF
RESPONDENTS
PERCENTAGE
1 Highly Satisfied 38 29
2 Satisfied 48 37
3 NSNDS 20 15
4 Dissatisfied 18 14
5 Highly Dissatisfied 06 05
Total 130 100
(Source: Primary Data)
INFERENCE:
The above table shows that 29% of the respondents are highly satisfied with the overall
performance of TVS, 37% of the respondents are satisfied with the overall performance
of TVS and 14% of the respondents are dissatisfied with the overall performance of TVS.
44

CHART-4.27
OVERALL PERFORMANCE OF TVS
Highly Satisfied Satisfied Nsnds Dissatisfied Highly Dissatisfied0
10
20
30
40
50
60
NO OF RESPONDENTS
PARTICULARS
NO
. OF
RESP
ON
DEN
TS
TABLE-4.28
TABLE SHOWING THAT RESPONDENTS WOULD TELL THEIR FRIENDS
TO BUY TVS
(Source: Primary Data)
INFERENCE
The above table shows 74% of the respondents would recommend their friends to buy
TVS and 26% will not recommend.
CHART-4.28
45
SI.NO USED NO OF RESPONDENTS PERCENTAGE
1 Yes 96 74
2 No 34 26
Total 130 100

CHART SHOWING THAT RESPONDENTS WOULD TELL THEIR FRIENDS
TO BUY TVS
NO OF RESPONDENTS
Yes No
TABLE- 4.29
The table shows the cross tabulation between the income and mileage
Mileage
Income
Highly satisfied Satisfied Total
Below Rs.10000 13 15 28
Rs.10001-20000 29 14 43
Rs.20001-30000 31 19 50
Above Rs.30000 8 1 09
TOTAL 81 49 130
Applying correlation coefficient method for the above table and the analysis is followed:
X Y X2 Y2 XY
46

13 15 169 225 195
29 14 841 196 406
31 19 961 361 589
8 1 64 1 8
∑ X=81 ∑y=49 ∑x2 = 2035 ∑y2 = 783 ∑xy = 1198
Correlation coefficient formula
N ∑ xy – (∑ x) (∑ y )
R =
N ∑ x2 - ( ∑ x ) 2 N ∑ y2 - ( ∑ y )2
= ( 4* 1198) - (81*49)
(4*2035) - (81)2 (4* 783) - (49)2
= 4792 – 3969
(8140 - 6561) * (3132 – 2401
= 823
1579 * 731
= 823
1074.5
47

= 0.766
Inference:
Based on the above analysis the calculated correlation coefficient value is + 0.766 that is +ve correlation coefficient. Hence there is significant relationship between income and mileage.
TABLE-4.30
Chi-Square Test
Null hypothesis There is no relationship between age and model for choosing the bikes.
Alternative hypothesis
There is relationship between age and model for choosing the bikes.
Descriptive Statistics
N Mean
Std.
Deviation
Minimu
m
Maximu
m
age 130 2.0077 .84904 1.00 4.00
model 130 2.9462 1.24708 1.00 5.00
Test Statistics
48
Age ModelChi-Square(a,b) 42.615 61.077Df 3 4Asymp. Sig. .000 .000Monte Carlo Sig.
Sig. .000(c) .000(c)95% Confidence Interval
Lower Bound
.000 .000
Upper Bound
.000 .000
Inference
The significant value is less than 0.05 so null hypothesis is rejected. There is a
significant relationship between age and model for choosing the bikes.
CHAPTER 5
5.1 FINDINGS
During this research project I came in to contact with many customers who are
having bikes. It has been found that in TVS mostly the customers are having Star
city while the ratio of the customers using Apache, Star sport and other bikes are
comparatively low. The maximum numbers of customers that are using these
bikes fall in the income group of below 10000.
It is observed that the awareness of TVS bikes mostly comes from
advertisements, friends and relatives. Out of the sample size of 130 customers, 59
customers agree with the fact that advertisements play a very significant role in
influencing their behavior to choose the bike. On the other hand 44 customers
have the awareness from friends and relatives. While 21 customers have
awareness from the experts and 6 customers have awareness from salesman.
When the customers are asked that are they satisfied with the performance of their
bikes then most of them agrees to the fact. Out of the sample size of 130
49
customers, 58 customers say that they are satisfied with the performance of their
bikes. On the other hand 28 customers are dissatisfied with the performance of the
bikes that they are having and 38 customers are highly satisfied. While remaining
6 customers are highly dissatisfied with the performance of the bike. In TVS bike
the economic price of the bikes influences the buying behavior of the customers.
It is observed that in rating of different features of TVS bikes people give
maximum rating to the brand image. At the second level they give their rating to
the pickup. At the third level they rate mileage. And at the fourth level they give
points to credit facilities. At last they rate choice of color.
5.2 SUGGESTION
1. TVS should introduce some more models having more engine power.
2. TVS should think about fuel efficiency in case of upper segment bikes.
3. More service centers should be opened.
4 Maintenance cost and availability of the spare parts should also be given importance.
5. They should introduce some good finance and discount schemes for customers.
6. The price should be economic.
7. The resale value should be increased.
8. New technology should be applied according to the requirement of the customer.
5.3 CONCLUSION
50
The researcher conducted the survey regarding consumer behaviour towards TVS bikes
in Krishnagiri town. The study shows that most of the customers are satisfied with the
overall performance of the TVS. Apache bike is purchased by the young generation
because they prefer stylish look and rest of the models are purchased more by daily users
who needs performance than elegant look. Customers are highly satisfied with the
mileage of TVS bikes.
51