project number: 711 o 005 project manager: ir. j.d. van
TRANSCRIPT

Project number: 711 o 005
Quality Program Agricultural Produels
Project manager: ir. J.D. van Klaveren
Report 96.28 September 1996
THEORETICAL MAXIMUM DAILY INTAKE OF PESTICIDE RESIDUES
IN THE NETHERLANDS - A MODEL FOR RISK ASSESSMENT
ir. M.M.H. van Dooren-Fiipsen, ir. J.D. van Klaveren, ir. G. van Donkersgoed
This project was funded by the Ministry of Health, Welfare and Sport,
Public Health Department, Sectien Nutrition and Veterinary Policy,
The Hague, The Netherlands
Agricultural Research Department of the Netherlands (OLO-NL)
DLO-State lnstitute for Quality Control of Agricultural Produels (RI KILT -OLO)
Department of Quality Control and Quality Systems
Bornsesteeg 45, NL-6708 PO Wageningen, The Netherlands
P.O. Box 230, NL-6700 AE Wageningen, The Netherlands
Telephone +31.317.475400
Telefax +31.317.417717

Copyright 1996, DLO-State lnstitute for Quality Control of Agricultural Products.
MAILING LIST
INTERNAL:
di rector
program managers
public relations & secretary (2x)
library {4x)
ir. M.M.H. van Dooren-Flipsen
ir. J.D. van Klaveren
ir. G. van Donkersgoed
ir. P.C.H. Hallman
dr. ir. S. de Boer
drs. O.G. Kloet
dr. ir. L.A.P. Hoogenboom
dr. H.P.J.M. Noteborn
dr. M.J.B. Mengelers
EXTERNAL:
Agricultural Research Department of The Netherlands (DLO)
Ministry of Agriculture, Nature Management and Fisheries, Department of Science and
Knowledge Dissemination
Ministry of Agriculture, Nature Management and Fisheries, Department of Environment, Quality
and Health (drs. P.H. Draaisma, ir. L.W.A. Vischer, ir. W. Huiskamp, ir. A.F. Onneweer)
Ministry van Health, Welfare and Sport, Public Health Department {drs. J.W. Dornseiffen, dr.
W.H. van Eek)
Board of the Authorisation of Pesticides (ir. J.A. Garthoff)
Head Inspectorale tor Health Proteetion (dr. ir. G. Kleter, ir. W.J. de Koe, ir. J.A. van Kooij)
Inspectorale tor Health Proteetion Amsterdam (dr. H.A. van der Schee)
Agricultural Univarsity Wageningen, Section Human Nutrition (prof. dr. J.G.A.J. Hautvast, prof.
dr. W.A. van Staveren, dr. C.E. West)
RIVM National lnstitute of Public Health and the Environment (dr. G.J.A. Speijers, A.K.D. Liem,
drs. P.H. van Hoeven)
TNO Nutrition and Food Research lnstitute {dr. ir. M.R.H. Löwik, dr. W. van Dokkum)
Dutch National Food Consumption Survey cammission
Health Council (ir. W. Bosman, ir. H.G.M. Bouman)
The Netherlands Bureau tor Food and Nutrition Education (ir. R.J. van Stigt-Thans)
IKC National Raferenee Centre tor Agriculture (ir. G.H. Horeman)

CONTENT
ABSTRACT .... .. ....... .. ..... .. .. ... ....... ... ................... . .
SAMENVATIING . . . . . . . . . . . . . . . . . . . . . . . . . . . . . . . . . . . . . . . . . . . . . . . . . . . . . . 2
INTRODUCTION . . . . . . . . . . . . . . . . . . . . . . . . . . . . . . . . . . . . . . . . . . . . . . . . 3
2 METHOD ..................... ... .. . .. .. ....... . .. . ....... . . . .. 6
2.1 Average Dutch food consumption . . . . . . . . . . . . . . . . . . . . . . . . . . . . . . . 6
2.2 Conversion of toodstuffs into primary agricultural products . . . . . . . . . . . . . 6
2.3 Conneetion between MALs and consumption . . . . . . . . . . . . . . . . . . . . . . 7
2.4 Plant c/assification of the European Union . . . . . . . . . . . . . . . . . . . . . . . . . 8
2.5 MALs tor not consumed produels . . . . . . . . . . . . . . . . . . . . . . . . . . . . . . 8
2.6 MALs at limit of determination . . . . . . . . . . . . . . . . . . . . . . . . . . . . . . . . . 9
2 . 7 Theoretica/ and acceptable dai/y intake . . . . . . . . . . . . . . . . . . . . . . . . . . . 9
3 RESULTS . ....... .. ..... . ............ . . . .... . .. . ........ .. .. . . 10
3.1 Average consumption of primary agricu/tural products . . . . . . . . . . . . . . . . 1 o 3.2 TMDI ca/cu/ations in a computer model . . . . . . . . . . . . . . . . . . . . . . . . . . 11
3.2.1 Description of TMDI model . . . . . . . . . . . . . . . . . . . . . . . . . . . . . . 11
3.2.2 Application of TMDI model . . . . . . . . . . . . . . . . . . . . . . . . . . . . . . 13
4 DISCUSSION . . . . . . . . . . . . . . . . . . . . . . . . . . . . . . . . . . . . . . . . . . . . . . . . . . . 16
5 GONGLUSION AND RECOMMENDATIONS . ....... . ..... . ...... ....... . 18
LITERATURE
ANNEX 1:
ANNEX 2:
ANNEX 3:
Average consumption of primary agricultural products in the Dutch
TMDI model
Attribute definitions Dutch TMDI model
Output Dutch TMDI model pesticide chlorfenvinphos


ABSTRACT
Theoretische Maximale Dagelijkse Inname pesticiden residuen in Nederland - een model voor
risico-evaluatie
Theoretica! Maximum Daily Intake of pesticide residues in the Netherlands - a model tor risk
assessment
Report 96.28
M.M.H. van Dooren-Fiipsen, J.D. van Klaveren, G. van Donkersgoed
DLO-State lnstitute tor Quality Control of Agricultural Products (RIKIL T-DLO)
P.O. Box 230, 6700 AE Wageningen, The Netherlands
5 tables, 13 references, 18 pages, 3 annexes, 1 tigure
September 1996
Setting Maximum Residue Limits (MALs) for residues and contaminants is a responsibilty of
the government in order to guarantee public health and to stimulate fare trade practises. lt is
extremely important to set MALs at the right level to ensure that potential risk to consumers is
excluded and that criteria tor agricultural products (e.g. Good Agricultural Practice) will be met.
In order to reach a conclusion whether MALs are set at the right level, it is necessary to
predict the theoretica! dietary intake of a particular residue in question. In a worst case
scenario MALs are applied tor calculation a Theoretica! Maximum Daily Intake (TMDI). In 1989
the WHO tor the first time described this procedure tor predicting dietary intake of pesticide
residues (WHO, 1989]. Recently the WHO has recommended making calculations at the
national level with available national consumption data [WHO, 1995]. In the Netherlands the
Dutch National Food Consumption SuNey (DNFCS) provides food consumption data of a
representative sample of the Dutch population. These consumption data are expressed in
foods as eaten by consumers, whereas MALs are mainly established for primary agricultural
products. Therefore RIKILT-DLO has transformed the average Dutch food consumption into
average amounts of raw agricultural commodities. Software has been developed to perfarm
automated TMDI calculations and comparisons with the Acceptable Daily Intake (AD I) . Th is
computer model can be very useful tor policy makers in risk assessment of pesticides and tor
harmonisation of residue limits between countries in the European Union or worldwide.
Keywords: theoretica! maximum daily intake (TMDI) , risk assessment, pesticide residues,
MALs, model, food safety, diet, agricultural products
1

SAMENVATIING
Normstelling ten aanzien van residuen en contaminanten is in Nederland een verantwoordelijk
heid van de overheid met als doel het optimaal waarborgen van de volksgezondheid en het
bevorderen van de eerlijkheid in de handel. Belangrijk hierbij is dat Maximum Residu Limieten
(MRL) op het juiste niveau worden gesteld om er zeker van te zijn dat de volksgezondheid niet
in gevaar komt en dat aan kriteria gesteld aan agrarische productiewijzen (bijvoorbeeld Good
Agricultural Practica) wordt voldaan. Om uitspraken te doen met betrekking tot de
aanvaardbaarheid van Maximum Residu Limieten (MRL's) wordt aanbevolen een voorspelling
te doen van de theoretische inname van een pesticide aan de hand van (voor)gestelde MALs
en deze te vergelijken met de Aanvaardbare Dagelijkse Inname (ADI}. In het kader van de
hiervoor ontwikkelde WHO procedure voor bestrijdingsmiddelen, wordt als eerste stap, de
zogenaamde 'worst case' benadering, een Theoretisch Maximale Dagelijkse Inname (TMDI)
berekend [WHO, 1989, WHO, 1995).
Tot op heden worden in Nederland theoretische innameberekeningen voor pesticiden
uitgevoerd met behulp van het hypothetische culturele dieet van Europa, afgeleid van Food
Balance Sheets. Voor innameschattingen op nationaal niveau wordt aanbevolen om nationale
voedselconsumptiedata te hanteren. In Nederland geeft de Voedsel Consumptiepeiling (VCP)
inzicht in de consumptie van voedingsmiddelen van een representatieve steekproef uit de
Nederlandse bevolking. MRL's hebben doorgaans betrekking op primaire agrarische
producten en niet op voedingsmiddelen. De Nederlandse consumptiecijfers van
voedingsmiddelen zijn daarom getransformeerd naar een gemiddelde consumptie van primaire
agrarische producten. Een nationaal TMDI model op basis van de gemiddelde consumptie,
uitgedrukt in primaire agrarische producten, is ontwikkeld. Software is ontworpen waarmee
routinematige berekeningen van nationale TMDI's en vergelijkingen met de ADI kunnen
worden gemaakt. Het nationale TMDI model kan worden ingezet voor risico-evaluatie van
pesticiden en bij de harmonisatie van maximale residu toleranties tussen landen van de
Europese Unie of de wereld.
2

1 INTAODUCTION
Risk assessment
In order to reach a conclusion towards the proteetion of public health it is necessary to predict
the dietary intake of pesticides.
National and international calculations of dietary intake of pesticides are carried out tor risk
evaluation and management of potential risk to consumers (van Eek, 1995]. lnformation on the
levels present in foods and the consumption of those foods by consumers is required to make
these estimations.
WHO model
For risk evaluation of pesticides the WHO has developed a stepwise process tor predicting
dietary intake of pesticides [WHO, 1989; WHO, 1995]. This model consists of different steps,
starting with the most exaggerated procedure, the sa called worst case scenario, predicting
the Theoretica! Maximum Daily Intake {TMDI).
In formula the TMDI calculation:
TMDI
F; =
MRL; =
= ~ F;x MRL;
the average food consumption for the relevant commodity, as derived trom a
hypothetical diet (kg product/person/day)
the (proposed} MAL for the relevant commodity (mg pesticide residua/kg
product)
Dimension TMDI and ADI:
TMDI mg pesticide residue/person/day
ADI mg pesticide residue/kg body weight/day
A TMDI is calculated by multiplying the maximum residue level {MAL} by the average food
consumption for each commodity and then summing the products. For TMDI calculations
proposed Codex MALs, EU MALs, national MALs and the average daily consumption of each
product are used as an input. In order to predict pesticide residue intake at the international
level average food consumption data given in FAO Food Balance Sheets [FAO, 1984] are
recommended. These consumption data are based on production, import and export figures.
When assembling national data to culturally related groups, hypothetical cultural diets can be
3

calculated. An average hypothetical global diet is than derived from these hypothetical cultural
diets.
The five hypothetical cultural diets that are calculated now are the following :
Middle-East, Far-East, African, Latin American and the European diet.
In order to evaluate the TMDI a comparison with the Acceptable Daily Intake (ADI) is made.
The TMDI is divided by an assumed average body weight (usually 60 kg) and expressed in a
percentage of the ADI.
A TMDI calculation is a relatively straightforward procedure which gives a gross overestimate
of the true pesticide intake. A TMDI calculation is useful for setting priorities such as re
evaluation of a selection of pesticides. lt should be used as a screening process that may
eliminale the need for further consideration of the intake of a pesticide residue.
National food consumption
International TMDI calculations are carried out with hypothetical food consumption data
derived from Food Balance Sheets. FBS are subject to a number of uncertainties and
limitations and only provide an approximate picture of the overall food situation in a country
over a specified period of time. The amount of food actually consumed may be lower
depending on the degree of losses of edible food e.g. during storage, in preparatien and
cooking as plate waste or quantities fed to dornestic animals and pets, or thrown away.
An important refinement of intake estimation is using national food consumption data. In The
Netherlands a large scale food consumption suNey was carried out in 1987/88 and in 1992
[DNFCS, 1988; DNFCS, 1992]. Both food consumption suNeys included about 6,000 persons
constituting a representative sample of the Dutch population.
When national food consumption suNeys are used tor estimating national TMDis it is possible
to consider the acceptability of MALs for the Dutch situation.
The Dutch TMDI model can be a useful tooi tor risk assessment of pesticides and
harmonisation of residue limits in the European Union or worldwide (Codex).
Dutch TMDI model
This project provides the Dutch TMDI model, which can be used for risk assessment and
reporting theoretica! maximum daily intake of pesticides for the Dutch population.
For the development of the Dutch TMDI model a link is made between Dutch consumption
data of foodstuffs and MALs of primary agricultural commodities. This involves the calculation
of the Dutch food consumption in terms of primary agricultural products.
A computer program is developed in order to execute routine TMDI calculations.
Chapter 2 reports the applied methodology tor the realisation of a national diet of primary
4

agricultural products and the development of the TMDI model. Results are described in
chapter 3. In chapter 4 the Dutch TMDI model is discussed. Finally conclusions and
recommendations are given in chapter 5.
5

2 METHOD
The Dutch national TMDI model was designed to meet the international recommendations
regarding dietary intake assessment of pesticide residues. During the realisation of the TMDI
model a number of conditions were met. The subparagraphs below give the procedures
followed:
1 Average Dutch food consumption
2 Conversion of foodstuffs to primary agricu/tura/ produels
3 Conneetion between MRLs and consumption
4 Plant classification of the European Union
5 MRLs tor nol consumed produels
6 MRLs at limit of determination
7 Theoretica/ and acceptab/e dai/y intake
2.1 Average Dutch food consumption
The Dutch National Food Consumption Survey 1992 [DNFCS, 1993) was used as a starting
point tor determining the Dutch dietary intake. This large scale food consumption survey was
carried out in 1992 among a representative sample of the Dutch population. In total 6,218
respondents {2,475 households) participated. lnformation on the actual individual intake of
foodstuffs was obtained with a 2-day diary method.
In order to formulate a national dietary pattern the average consumption of foodstuffs was
calculated based upon the DNFCS 1992. As recommended by the Commission of the second
DNFCS [Anonymous, 1993), weighing factors were taken into account to correct tor the
distribution of sex-age groups.
2.2 Conversion of foodstuffs info primary agricultural produels
In global (Codex) recommendations and in Europaan and national legislation Maximum
Residue Limits (MALs) of pesticide residues are set. These residue limits are related to primary
agricultural products. In Dutch food consumption surveys the consumption is recorded in
terms of prepared foods eaten by consumers; e.g. apple pie, French fries, pizza. In 1994 a
Conversion model Primary Agricultural Produels (CPAP) was developed in order to link food
stuffs to primary agricultural products [Van Dooren et al., 1995). With this model it is possible
to transfarm food consumption surveys, coded with the Dutch NEVO-code [Foundation NEVO
6

Dutch Nutriant Databank], to consumption amounts of raw primary agricultural products.
Further the CPAPoffers the possibility to derive consumption figures for individual components
of primary agricultural products (e.g . milk fat, meat fat, germ, waste component vegetables).
In order to derive the average Dutch consumption of primary agricultural products tor TMDI
calculations, specific product definitions are set in the CPAP. These definitions are linked with
the product definitions in EC Directives, implemented in the 'Regulation residues of pesticides'
of the Dutch Pesticide Act [Pesticide Act, 1996).
Table 2.1 presents an overview of the applied primary agricultural product definitions specific
tor the Dutch TMDI model.
Table 2.1
vegetables
fruit
cereal
milk
Product definitions primary agricultural products in TMDI model.
= = =
=
including shrink and waste amount
including peel, seed, stone, core and green waste amount
derived trom the most important components of a grain which may
be separately present in a foodstuff (starch/flour, germ, bran)
sum of the casein, whey, milk fat, lactose and water amount present
in foodstuffs
2.3 Conneetion between MRLs and consumption
The maximum allowable residue levels of pesticides in animal products (meat, milk and eggs)
are aften expressed in mg/kg fat. These MALs are set on a fat basis for fat soluble pesticides.
When predicting a TMDI this MAL should be related to the consumption of the fat component
of a primary agricultural product.
To link this information the consumption of the fat component of a primary agricultural product
is calculated through the CPAP. These fat consumption data are also recorded in the TMDI
model.
With this the Dutch TMDI model offers a possibility to conneet MALs of both not-fat soluble
and fat soluble pesticides respectively with consumption on product and fat basis.
Table 2.2 shows the groups of primary agricultural products trom which the consumed fat
component is calculated.
7

Table 2.2 Overview groups primary agricultural products with fat component.
•
primary agricultural product group
• nuts
oil containing seeds
** vegetabla oils
• grains
cocoa
meal, liver, kidney
milk
egg (product)
game/ poultry
fish
other animal produels
•• fat based calculations not applicable lor MALs of pesticides
consumpl ion product is equalto consumption fat
2.4 Plant c/assification of the Europaan Union
MALs are set at different product levels, namely tor product groups, product subgroups and
tor individual products. For example a MAL can be set tor the product lemon, the product
subgroup citrus fruit or tor the total product group fruit. When setting maximum residue levels
tor vegetabla products, the EU uses a plant classification [PbEG L350, Directive 90/642/EEC].
In the Dutch TMDI model the primary agricultural products are classified according to this
system.
The list of primary agricultural products is extended with a number of consumed animal
products. This concerns a number of fish species and specific narnes of animals and poultry.
Same products mentioned explicitly in the EU classification are transformed via the conversion
model to one primary agricultural product. These particular products concern prepared,
processed EU products, namely grain products, cocoa products and milk products. For
example the EU product flour is converted in wheat and the EU product cheese in milk.
The EU classification is included in the TMDI model and makes it possible to fill in (proposed}
MALs at a product, product subgroup as well as product group level. The contribution of
different product(sub)groups to the theoretica! maximum daily intake of a pesticide can be
generated.
2.5 MRLs tor not consumed products
8

lf food consumption data are not available tor a commodity or a commodity is not consumed,
the hypothetical diets of the WHO use the consumption value for a similar food. lf no similar
food is available, instead using zero, a default value of 0.1 g/day is used.
In the Dutch diet, derived trom the DNFCS-1992, a number of primary agricultural products are . not consumed. For TMDI calculations this consumption tigure is adjusted to 0.1 g/day. These
corrected consumption data are only applied to products which are implicitly mentioned by
name in the EU plant classification. Products with a collectiva name of other products (e.g.
other nuts, other malaceous fruit) and prepared, processed products (e.g. cheese, flour) are
excluded from this procedure.
2.6 MRLs at limit of determination
When a pesticide residue is not allowed in/on a commodity the MAL is set at the Limit of
Determination (LOD) of the analytica! method. According to the guidelines of predicting dietary
intake of pesticide residues 1989 [WHO, 1989) in intake calculations MALs are set to zero. In a
FAO/WHO Consultalion for revision of these guidelines it is recommended to calculate the
TMDI using a residuelevel equivalent to the LOD [WHO, 1995).
In the Dutch TMDI model a procedure is built in to give the user the opportunity to make bath
calculations with and without MALs at LOD level. The user can enter the LOD level into the
program.
2. 7 Theoretica/ and acceptable daily intake
For evaluating the TMDI a comparison with the Acceptable/Tolerable Daily Intake (ADI) is
necessary. The ADI is expressed in mg/kg body weight so the calculated TMDI should be
divided by the mean body weight. lnternationally a standard body weight of 60 kg is used. The
mean body weight of the national population under research (DNFCS-1992) is 65 kg.
In the computer model the user can enter the ADI (in mg/kg body weight). The user can
choose between the standard body weight or the body weight of the population under
research. Using this input, the theoretica! intake is automatically expressed as a percentage of
the ADI. The contribution of the different products to the total theoretica! intake is expressed in
the same way.
9

3 RESULTS
3.1 Average consumption of primary agricultural produels
The average consumption of 1,112 foodstuffs, as recorded with the DNFCS 1992, was transfor
med into consumption amounts of about 200 primary agricultural products, using the
Conversion model Primary Agricultural Produels (Van Do oren et al. , 1995). Along with primary
agricultural produels containing fat, the consumed amount of fat was calculated (e.g. milk
consumption and milk fat consumption) and recorded in the average national diet. When
deriving consumption amounts, according to TMDI procedures, specific product definitions
were used (paragraph 2.2} and null consumption tor a number of cammodities was updated
(paragraph 2.5}.
The primary agricultural produels were grouped according to the system of EU plant
classification. The list of primary agricultural produels with the Dutch consumption data tor
national theoretica! maximum daily intake calculations of pesticide residues is presenled in
Annex 1. A selection of this list is presenled in table 3.1.
Table 3.1
Product group
fruit, nuts
fish produels
other animal produels
Average Dutch consumption of primary agricultural products.
Product subgroup
citrus fruit
nuts
molluscs
honey
Product
grapefruit Iernon lime mandarin orange, clementines and others orange pomelo other citrus frult
almonds
paranuts
cashew
mussel
honey
10
Consumption Consumption of (g/day)
PROD PROD PROD PROD PROD PROD PROD
PROD FAT PROD FAT PROD FAT
PROD FAT
PROD
5,28 2,13 0,10
10,18 77,41
0,10 0,00
0,81 0,45 0,05 0,03 0,42 0,22
0 ,27 0,01
0,82

3.2 TMDI ca/cu/ations in a computer model
3.2.1 Description of TMDI model
A schematic presentation of the entities related to the TMDI model are given in Figure I. The
Dutch TMDI model is conneeled with 2 other entities: the Dutch National Food Consumption
Survey (DNFCS-1992) and the Conversion model Primary Agricultural Produels (CPAP).
Consumption data trom the DNFCS-1992 are transformed via the CPAP in consumption data of
primary agricultural products.
The average Dutch consumption data of primary agricultural produels are recorded in the
entity CONSUMPTION_PAP. The consumption can be expressed on product basis and on fat
basis. The user can choose whether the calculation should be made tor fat soluble pesticides
of water soluble pesticides. This choice should be made in the entity COMPONENT. This
entity COMPONENT contains the codes PAOD (=whole product) and FAT (=fat component).
With this code a correct link between MALs and consumption will be automatically achieved.
The entered input tor a TMDI calculation is registered in the entities COMPOUND _ADI and
COMPOUND_PAP _MAL. The computer user enters the name of a compound, the Acceptable
Daily Intake, the average body weight and the limit of determination. This compound
intermation is recorded in the entity COMPOUND_ADI. The MALs with the correct component
of a primary agricultural product are entered in the entity COMPOUND _PAP _MAL.
The entities PAP, EU_PAODUCTSUBGAOUP and EU_PAODUCTGAOUP contain the names
and codes of the EU classification system of each primary agricultural commodity present in
the TMDI model. With these codes produels can be classified in categories of primary
agricultural products. The computer user can enter MALs per food category (productgroup and
product subgroup) or per individual primary agricultural product.
More detailed definitions of terms and attributes of the entities are described in Annex 2.
11

Dutch TMDI model
classify
PAP
t EU
PRODUCTSUBGROUP
t EU
PRODUCTGROUP
------Dutch National Food Consumption Survey 1992
DNFCS-1992
-- - -----
Conversion Model Primary Agricultural Products CPAP
-
PROD / FAT
CONSUMPTION_PAP
COMPOUND _PAP _MRL
11 = =
COMPOUND _AD I
------OUTPUT TMDIMOD~
----------
COMPONENT
PROOI FAT
Figure 1: Entifies of the Dut eh TMDI model.

3.2.2 Application of TMDI model
The procedure tor calculating a TMDI of a particular pesticide can be distinguished in
management of input and selection of output:
1) Input management TMDI calculation
• Aegistration of the name of a compound with accompanying Acceptable Daily Intake
(ADI) (in mg/kg body weight) and Limit Of Determination (LOD) (in mg/kg product)
• Aegistration of average body weight:
standard 60 kg
national Dutch food consumption survey 1992 65 kg
• Aegistration of (proposed) MALs. The computer user can fill in MALs (mg/kg) at
different product levels: productgroup, productsubgroup or tor one individual product.
When registering a MAL for example tor the productsubgroup citrus fruit, all
cammodities in this productgroup (grapefruit, lemon, lime, mandarin orange, orange,
pomelo) automatically get the same toleranee level.
• Aegistration of the valid component of primary agricultural product tor which a MAL is
established: A MAL can be established fora whole product or tor the fat component of
a product. For example a toleranee level can be set for the whole product meat or tor
the component fat in meat. Choosing the component fat (FAT) the MAL is automatically
linked to the consumption of the fat component of a commodity. The component whole
product (PAOD) connects the MAL to the consumption of the whole primary
agricultural product.
2) Output TMDI calculation
Ta illustrate the use of the Dutch TMDI model, the input and output of the pesticide
chlorfenvinphos are presented. MALs of this pesticide residue are stated in the Dutch
Pesticide Act. Table 3.2.3a presents the gathered input tor entering into the Dutch TMDI
model. A selection of the generaled information of the TMDI calculation of chlorfenvinphos is
given in Table 3.2.3b. The complete output is presenled in Annex 3.
• The computer program produces a well-organised output, presenting per primary
agricultural product the entered MALs (mg/kg), the selected component, the
Theoretica! Maximum Daily Intake (ug/person/day) and the intake as a percentage of
the ADI. At the end of the list the total amount of the TMDI and percentage of the ADI
is printed.
• The output can be produced with the entered MALs only or with the entered MALs and
the level of determination tor the remaining products.
13

Table 3.2.3a Input TMDI ca/culation ch/orfenvinphos.
Input Value
Name of compound CHLORFENVINPHOS
Body welght (kg) 65
ADI (mg/kg body welghVday) 0,0005
Consumptlon of PROD & FAT
Limit of Determination (mg/kg) prod 0,05
MALs (mg/kg)
citrus fruit PROD
roots and lubers PROD 0,5
bulbous plants PROD 0,5
celery PROD 0,5
parsley PROD 0,5
(bleach)celery PROD 0,5
other vegetables PROD 0,1
tea PROD 0,2
me at FAT 0,2
milk PROD 0,008
14

Table 3.2.3b Output of Dutch TMDI model chlorfenvinphos.
AOI = Acceptable Daily Intake (mg/kg body weight) Consumption = Average consumption (g/person/day) of primary agricultural products derived from DNFCS 1992 MAL = Maximum Aesidue Limit (mg/kg) TMDI = Theoretica! Maximum Daily Intake (ug/person/dag) ADI% = Percentage of ADI * - Calculation including MAL at limit of determination (MAL*)
==================================================== COMPOUND CHLOAFENVINPHOS - ADI-value: 0.0005
===================================================
Productgroup Productsubgroup Product Component Consumption MAL MAL* TMDI TMDI* ADI% ADI%*
fruit, nuts citrusfruit grapefruit PAOD 5,28 1,00 1,00 5,28 5,28 16,23 16,23 Iernon PAOD 2,13 2,13 2,13 6,55 6,55 I i me PAOD 0,10 0,10 0,10 0,31 0,31 mandarin, clementine and others PAOD 10,18 10,18 10,18 31 ,33 31,33 orange PAOD 77,41 77,41 77,41 238,18 238,18 pomelo PAOD 0,10 0,10 0,10 0,31 0,31 other citrus fruit PAOD 0,00 0,00 0,00 0,00 0,00
nuts al mond PAOD 0,81 0,00 0,05 0,00 0,04 0,00 0,13 paranut PAOD 0,05 0,00 0,00 0,00 0,01 cashew PAOD 0,42 0,00 0,02 0,00 0,07
.... .. . .
....
meat, poultry, meat, liver, kidney, meat of cow FAT 3,83 0,20 0,20 0,77 0,77 2,35 2,35 fat, edible fat of cow, pig, liver of cow FAT 0,08 0,02 0,02 0,05 0,05 offal sheep, goat, horse kidney of cow FAT 0,00 0,00 0,00 0,00 0,00
fat of cow FAT 1,16 0,23 0,23 0,71 0,71
fish products molluscs mussel PAOD 0,27 0,00 0,05 0,00 0,01 0,00 0,04 ........... ..
other animal honey honey PAOD 0,82 0,00 0,05 0,00 0,04 0,00 0,13 products
-------------------------------Total 139,49 175,49 429,24 539,98

4 DISCUSSION
Dutch TMDI model
The developed Dutch TMDI model is a first refinement of consumption data tor estimating
Theoretica! Maximum Daily Intake. The average consumption of primary agricultural products,
derived trom the Dutch National Food Consumption Survey 1992, is incorporated in the Dutch
TMDI model. Calculation of a theoretica! maximum daily intake at a national level is now
possible and can be useful tor registration decisions, risk assessment and harmonisation of
international maximum residue levels tor pesticides.
The calculation of a TMDI is a worst case approach, with the assumption that all consumed
foods are treated with pestieldes and contain residues at MAL level. The proportion of crops
treated with a pesticide is usually far less than 100% and the true pesticide residue intake will
be much lower because of losses during processing or cooking of treated commodities. A
TMDI calculation should be used only as a screening procedure that may eliminate the need
tor further consideration of the intake of a pesticide residue.
When a TMDI calculation exceeds the ADI more refined predictions of pesticide residue intake
are necessary. For a more realistic intake estimation (Estimated Daily Intake = EDI) it is
recommended to use as much available relevant information as possible (WHO, 1995). These
factors are on the one hand related to a further refinement of food consumption data and on
the other hand to retinament of expected residue levels.
Food consumption data
The application of national food consumption data to dietary intake calculations of potentially
harmful substances in foods is established in the present Dutch TMDI model. National food
consumption data provide an important retinament of dietary intake assessment of pesticide
residues. lnternationally most countries use the hypothetical cultural diets derived trom Food
Balance Sheets in their assessments. In reporting TMDI calculations to the WHO/FAO Finland,
Norway, Spain and Sweden use the average national diet. Only a small number of countries
apply food consumption data of subpopulations of the national population. For dietary intake
assessment of pesticides the United Kingdom uses food consumption data of 3 subpopu
lations; adults (age 16-65), children (age 10-15) and babies (6-12 months). In Germany the
average diet of a 4-6 year old girl is utilised.
From the Dutch National Food Consumption Survey information regarding dietary intake of
foodstuffs trom different subpopulations can be obtained, e.g. gender, age, lifestyle,
pregnancy. Splitting up consumption data tor different subpopulations could be very useful tor
16

identifying vulnerable groups of the population. Further this method provides new prospects
tor international comparisons of intake calculations.
Residue data
Many countries have a considerable amount of residue data available trom national monitoring
programs and surveys. These monitoring data provide actual pesticide residue levels in
imported products and products available on the national market [Van Klaveren, 1995]. These
data can be an important refinement for more accurate intake calculations of pesticide
residu es.
When calculating a TMDI, processing effects are not taken into account. Residues on raw
cammodities are normally dissipated during storage, transport, preparation, commercial
processing and cooking. Usually data on the effects of processing on residues are scarce.
Available processing studies should be used tor determining reduction and concentration
factors. Processing data can be used for deriving more realistic estimates of dietary intake of
pesticides.
17

5 CONCLUSION AND RECOMMENDATIONS
Toleranee setting of pesticides is intended to ensure public health and tree movement of food
in international trade. In order to reach a conclusion regarding the acceptability of a Maximum
Residue Limit (MAL) it is necessary to predict the theoretica! maximum daily intake of a
pesticide residue and campare this prediction with the Acceptable Daily Intake (ADI).
According to the stepwise WHO procedure, the sa called worst case scenario, a Theoretica!
Maximum Daily Intake (TMDI) is calculated. The current report describes a procedure to
calculate Theoretica! Maximum Daily Intakes by transforming data of the Dutch National Food
Consumption Survey to data tor primary agricultural products. This model can be used tor risk
assessment of pesticides and for harmonisation of residue limits between countries in the
Europaan Union ar worldwide.
A TMDI is a worst case approach which results in a theoretica! intake estimate. In cases where
the TMDI exceeds the ADI it is essential to make more refined predictions of pesticide residue
intake. For a more realistic intake estimation it is recommended to use as much available
relevant information as possible. Available residue data trom national monitoring programs and
surveys should be taken in consideration. Data on processing effects are also an important
retinament tor intake estimation of pesticide residues. Intake calculations of subpopulations
could be useful tor identifying vulnerable groups of the population.
18

LITERATURE
Anonymous
Methodologische verschillen tussen de eerste en de tweede voedselconsumptiepeiling (in
Dutch).
TNO-report V 93.407, Zeist, The Netherlands, 1993.
DNFCS 1992
Zo eet Nederland, 1992.
Resultaten van de voedselconsumptiepeiling 1992 (in Dutch).
Ministry of Welfare, Health and Cultural Aftairs
Ministry of Agriculture, Nature Management and Fisheries
DNFCS 1987/1988
Wat eet Nederland
Resultaten van de voedselconsumptiepeiling 1987-1988 (in Dutch).
Ministry of Welfare, Health and Cultural Aftairs
Ministry of Agriculture, Nature Management and Fisheries
Dooren, M.M.H. van, Boeijen, 1., Klaveren, J.D. van, Donkersgoed, G. van
Conversie van consumeerbare voedingsmiddelen naar primaire agrarische produkten (in
Dutch).
RIKILT-DLO report 95.17, Wageningen, The Netherlands, 1995.
Eek, W.H. van, Dornseiften, J.W.
Residuen van landbouwbestrijdingsmiddelen (in Dutch).
Gewasbescherming 26(3) 1995:79-85.
FAO
Food Balance Sheets: 1979-81 average. Rome, Food and Agriculture Organisation of the
United Nations, 1984.
Foundation NEVO
NEVO-tabel (in Dutch).
Zeist, 1993.
\ \

Klaveren, J.D. van
KAP-verslag 1995.
Resultaten residubewaking in Nederland (in Dutch}.
Wageningen, RIKIL T-DLO, 1995.
Bestrijdingsmiddelenwet (in Dutch).
Koninklijke Vermande BV-Uitgevers, Lelystad.
Official Joumal of the European Community
Directive 90/642/EEC (L350/71)
Richtlijn van de Raad tot vaststelling van maximumgehalten aan residuen van bestrijdingsmid
delen in en op bepaalde producten van plantaardige oorsprong, met inbegrip van groenten en
fruit (90/642/EEG).
WHO
Food Contamination Monitoring Programme. Guidelines tor Predicting Dietary Intake of
Pesticide Residues. WHO, Geneva, 1989.
WHO
Recommendations tor the revision of the guidelines for predicting dietary intake of pesticide
residues, Report of a FAO/WHO Consultation, 1995 lssued by the World Health Organisation
with the Food and Agriculture Organisation of the United Nations.

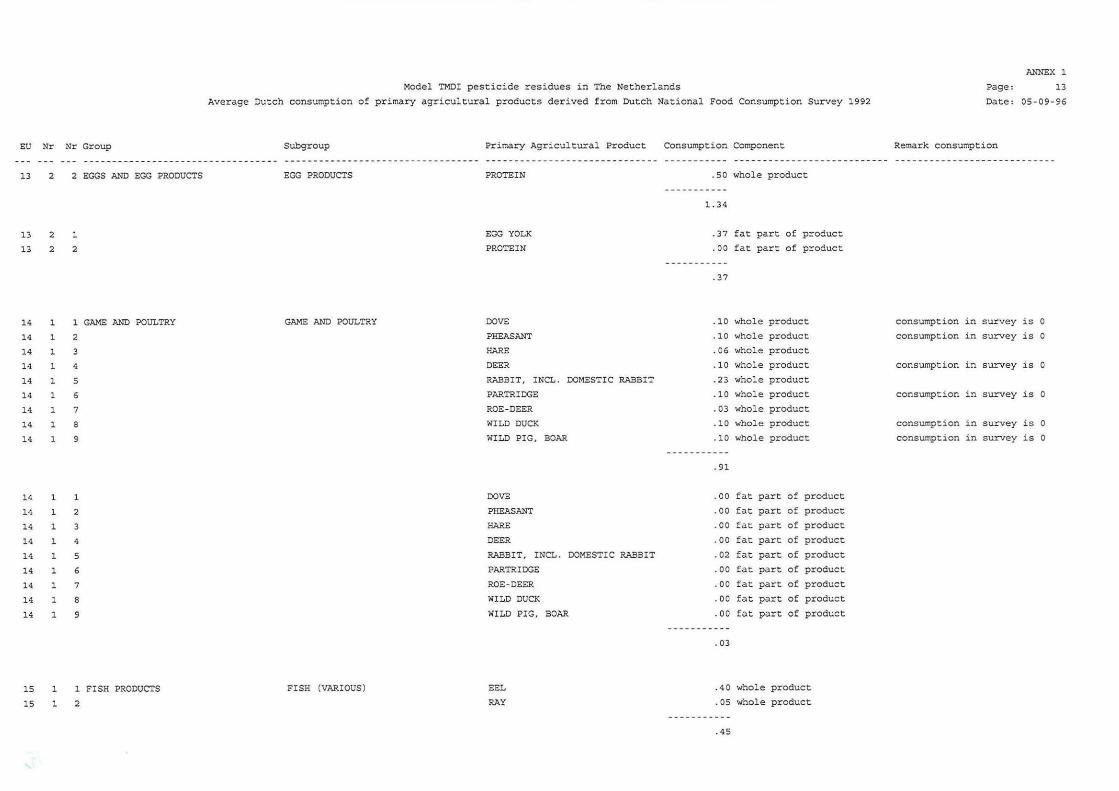
ANNEX 1: Average consumption of primary agricultural products in the Dutch TMDI model.

Î

EU Nr Nr Group
1
1
1
1
1
1
l
l
1
1
1
1
1
1
1
1
1
1
1
1
1
1
1
1
1
1
1
1
1
1
1
1
1
1
1 FRUIT, NUTS
2
3
4
5
1 6
1 99
2
2
2
1
2
3
2 4
2 5
2 6
2 7
2 8
2 9
2 10
2 11
2 99
2 1
2 2
2 3
2 4
2 5
2 6
2 7
2 8
2 9
2 10
2 ll
2 99
Model TMDI pesticide residues in The Netherl ands
Average Dutch consumption of primary agricultural products derived from Dutch National Food Consumpti on Survey 1992
Subgroup
CITRUS FRUIT
NUTS
Primary Agricultural Product
GRAPEFRUI T
LEMON
LIME
MANDARIN ORANGE, CLEMENTINE AN
ORANGE
POMELO
OTHER CI TRUS FRUIT
ALMOND
PARANUTS (BRAZILNUT)
CASHEW
SWEET (EDIBLE) CHESTNUTS
CO CO NUT
HAZELNUT
MACADAMIA NUT
PECAN
PINE CONE
PISTACHIO NUTS
WALNUTS
OTHER NUTS
ALMOND
PARANUTS (BRAZILNUT)
CASHEW
SWEET (EDIBLE) CHESTNUTS
CO CO NUT
HAZELNUT
MACADAMIA NUT
PECAN
PINE CONE
PI STACHI O NUTS
WALNUTS
OTHER NUTS
Consumption Component
5.28 whole product
2.13 whole product
.10 whole product
10 . 18 whole product
77.41 whole product
.10 whole product
.00 whole product
95.19
.81 whole product
.05 whole product
.42 whole product
. 02 whol e product
.62 whole product
. 77 whole pr oduct
. 10 whole product
.10 whole product
.10 whole product
.10 whole product
.2 6 whole produc t
.00 whol e product
3 . 35
.45 fat part of product
.03 fat part of product
.22 fat part of product
.00 fat part of product
.25 fat part of product
.53 fat part of product
. 00 fat part of product
. 00 fat part of product
.00 fat part of product
.00 fat part of product
.17 fat part of product
.00 fat part of product
ANNEX 1
Page: 1
Date: 05-09-96
Remark consumption
consumption in survey is 0
consumption in survey is 0
consumption i n survey is 0
consumption in survey is 0
consumption in survey is 0
consumption in survey is 0

EU Nr Nr Group
1 3 1 FRUIT, NUTS
1 3 2
1 3 3
1 3 99
1 4 1
1 4 2
1 4 3
1 4 4
1 4 99
1 5 1
1 5 2
1 5 3
1 5 4
5 5
1 5 6
1 5 7
1 5 8
1 5 9
1 5 10
1 5 11
1 5 12
1 5 13
1 5 15
1 5 79
1 5 89
1 5 99
Model TMDI pesticide residues in The Netherlands
Average Dutch consumption of primary agr icultural products derived from Dutch National Food Consumption Survey 1992
Subgroup Primary Agricul tural Product Consumption Component
1. 64
MALACEOUS FRUIT APPLE 81.05 whole product
PEAR 9.49 whole product
QUINCE . 11 whole product
OTHER MALACEOUS FRUIT . 00 whole product
-----------90.65
STONE FRUIT APRICOT 2.23 whole product
SWEET CHERRIES 2.17 whole product
PEACH, NECTARINE 2.79 whole product
PLUM 1 . 94 whole product
OTHER STONE FRUIT .00 whole product
-----------9.12
BERRIES AND SMALL FRUIT TABLE GRAPES 15 . 20 whole product
WINE GRAPES 34.82 whole product
STRAWBERRY 4.33 whole product
BLACKBERRY .32 whole product
DEWBERRY .10 whole product
LOGANBERRY .10 whole product
RASPBERRY .81 whole product
BLUE BILBERRIES . 25 whole product
CRANBERRIES .00 whole product
CURRANT (RED, WHITE, BLACK) 1.38 whole product
GOOSEBERRIES .OS whole product
COWBERRY .00 whole product
ELDERBERRY .26 whole product
ROSE HIP .40 whole product
OTHER RUBUS VARIETlES .00 whole product
OTHER SMALL FRUIT AND BERRY FR .00 whole product
WILD BERRY FRUITS AND WILD FRU .00 whole product
-----------58.03
Page :
ANNEX 1
2
Da te: 05-09-96
Remark consumption
consumption in survey is 0
consumption in survey is 0

EU Nr Nr Group
1
1
1
1
1
1
1
1
1
1
1
1
1
1
1
1
1
1
2
2
2
2
2
2
2
2
2
2
2
2
6
6
6
6
6
6
1 FRUIT, NUTS
2
3
4
5
6
6 7
6 8
6 9
6 10
6 11
6 12
6 13
6 14
6 15 6 17
6 99
6
1
1
1
1
1
1
1
1
1
9
1 VEGETABLES
2
3
4
5
6
7
8
9
1 10
1 11
1 12
Model TMDI pes t icide residues in The Netherlands
Average Dutch consumption of primary agricultural pr oducts derived from Dutch National Food Consumption Survey 1992
Subgroup
VARIOUS FRUITS
ROOTS AND TUEERS
Primary Agricultural Product
AVOCADO
BANANA
DATE
FIGS
KIWI FRUIT
KUMQUAT
LYCHEE
MANGO
OLIVES {TABLE OLIVES)
OLIVES {FOR OIL-EXTRACTION)
PASSIONFRUIT
PINEAPPLE
POMEGRANATE
GUAVA
PAPAYA
KAKI
OTHER MISCELLANEOUS FRUIT
OLIVES {TABLE OLIVES)
BEETROOT
CARROT
CELERIAC
HORSERADISH
TOPINAMBUR
PARSNIP
ROOTED PASLEY
RADISH
SALSIFY
SWEET POTATO
SWEDI SH TURNIP, SWEDE
TURNIP SHOOTS
Consumption Component
.02 whole product
21.59 whole product
.03 whole product
.02 whole product
3.05 whole product
.10 whole product
.03 whole product
.84 whole product
.25 whole product
.00 whole product
.54 whole product
4.51 whole product
.10 whole product
.00 whole product
.10 whole product
.02 whole product
.00 whole product
31.21
.03 fat part of product
.03
5.15 whole product
13.43 whole product
.78 whole product
.10 whol e product
. 10 whole product
.10 whole product
.10 whole product
.43 whole product
.06 whole product
.04 whole product
.81 whol e product
.10 whole product
ANNEX 1
Page: 3
Date: 05- 09-96
Remark consumption
consumption in survey is 0
included in olives {table cl
consumption in survey is 0
consumption in survey is 0
consumption in survey is 0
consumpt i on in survey i s 0
consumption in survey is 0
consumption in survey is 0
consumption in survey is 0

EU Nr Nr Group
2 1 13 VEGETABLES
2 1 14
2 1 1 5
2 1 16
2 1 99
2
2
2
2
2
2
2
2
1
2
3
4
2 2 99
2
2
2
2
2
2
2
2
2
2
2
2
2
2
2
2
2
3
3
3
3
3
3
3
3
3
3
3
3
3
4
4
4
4
1
2
3
5
6
7
9
10
ll
13
79
89
99
1
2
4
6
Model TMDI pesticide residues in The Netherlands
Average Dutch consumption of primary agricultural products derived from Dutch National Food Consumption Survey 1992
Subgroup Primary Agricultural Product Consumption Component
ROOTS AND TUBERS YAM .10 whole product
WINTER CARROT .16 whole product
CASSAVA .02 whole product
BLACK RADISH .03 whole product
OTHER ROOT AND TUBER VARIETlES .02 whole product
-----------21.51
BULBOUS PLANT GARLIC .01 whole product
ONION 16.81 who1e product
SHALLOT .10 whole product
ONION (SMALL) . 10 whole product
OTHER BULBOUS PLANTS .00 whole product
-----------17.02
FRUITING VEGETABLES TOMATO 26.07 whole product
SWEET PEPPER 3.97 whole product
AUBERGINE/EGG PLANT .26 whole product
CUCUMBER 8.03 whole product
GHERKIN/PICKLE 1.54 whole product
COURGETTE .54 whole product
MELON 2.23 whole product
PUMPKIN .02 whole product
WATERMELeN .48 whole product
SWEET CORN 1.41 whole product
OTHER SOLANACEAE .00 whole product
OTHER CUCURBITACEAE WITH EDIBL .00 whole product
OTHER CUCURBITACEAE WITH NOT E .00 whole product
---------- -44.55
CABBAGES BROCCOLI 1.98 whole product
CAULIFLOWER 16.00 who1e product
BRUSSEL SPROUTS 4.66 whole product
RED CABBAGE 5.13 whole product
Page:
ANNEX 1
4
Date: 05-09-96
Remark consumption
consumption in survey is 0
consumption in survey is 0
consumption in survey is 0

EU Nr Nr Group
2
2
2
2
2
2
2
2
2
2
2
2
2
2
2
2
2
2
2
2
2
2
2
2
2
2
2
2
2
2
2
4
4
7 VEGETABLES
8
4 9
4 10
4 11
4 13
4 79
4 89
4 99
5
5
5
5
5
5
1
2
3
4
5
6
5 7
5 9
5 10
5 11
5 12
5 13
5 14
5 15
5 79
5 89
5 99
6 10
6 11
6 12
6 13
6 20
Model TMDI pesticide residues in The Netherlands
Average Dutch consumption of primary agricultural products derived from Dutch Nat ional Food Consumption Survey 1992
Subgroup
CABBAGES
LEAF VEGETABLES AND FRESH HERBS
LEGUMES
Primary Agricultural Product
OXHEART/CONICAL CABSAGE
WliiTE CABSAGE
SAVOY CABSAGE
CHINESE CABSAGE
CURLY KALE
KOHLRABI
OTHER CAULIFLOWER VARIETlES
OTHER READEO CABSAGE VARIETlES
OTHER LEAF CABSAGE VARIETlES
GARDENCRESS
LAMS- S LETTUCE
CABSAGE LETTUCE, COS LETTUCE
ENDIVE
PURSLANE
SPINACH
SWISS CHARD/LEAF BEAT
WATERCRESS
CHICORY
CHERVIL
CHIVES
PARSLEY
CELERY
TURNIP TOPS
OTHER LETTUCE AND SIMILAR VARI
OTHER SPINACH AND SIMILAR VARI
OTHER FRESH HERBS
FRENCH BEANS (FRESH}
GREEN BEANS (FRESH)
LEGUME (FRESH)
STRING BEAN (FRESH)
MARROW FAT PEA (DRY HARVESTED)
Consumption Component
2.03 whole product
6.98 whole product
1.20 whole product
.92 whole product
4.93 whol e product
.15 whole product
. 00 whole product
.00 whole product
.00 whole product
43 .97
.00 whole product
.22 whol e product
8.48 whole product
7.42 whole product
.24 whole product
10.24 whole product
.49 whole product
.10 whole product
9.17 whole product
.10 whole product
. 10 whole product
.10 whole product
.27 whole product
.08 whole product
.01 whole product
.00 whole product
.00 whole product
37.03
3.14 whole product
11.66 whole product
.50 whole product
.12 whole product
.33 whole product
ANNEX 1
Page: 5
Date: 05-09-96
Remark consumption
consumption in survey is 0
consumption in survey is 0
consumpt ion in survey is 0

EU Nr Nr Group
2
2
2
2
2
2
2
2
2
2
2
2
2
2
2
3
3
3
6 21 VEGETABLES
6 30
6 99
7
7
7
7
7
7
7
7
7
7
8
8
1
1
1
2
1
2
3
4
5
6
7
s 9
99
2
3
1 PULSES
2
4
1
Model TMDI pesticide residues in The Netherlands
Average Dutch consumption of primary agricultural products derived from Dutch National Food Consumption Survey 1992
Subgroup
LEGUMES
STALK VEGETABLES
FUNGUS
BEANS
LENTILS
Primary Agricultural Product
BROAD BEAN (FRESH)
GREEN/ (GARDEN) PEAS (FRESH)
OTHER LEGUMES (FRESH)
ASPARAGUS
CARDOON
(BLEACH) CELERY
FENNEL
ARTICHOKE
LEEK
RHUBARB
BEAN SPROUTS
BAMBOC SHOOTS
OTHER STALK VEGETABLES
MUSHROOM
CHANTARELLE
WHITE BEAN (DRY HARVESTED)
BROWN BEAN (DRY HARVESTED)
BEANS
LENTILS
Consumption Component
2.50 whole product
14.78 whole product
.00 whol e product
33.03
1.74 whole product
. 10 whole product
. 56 whole product
.09 whole product
.04 whol e product
12.86 whole product
.71 whole product
1.08 whole product
.01 whole product
. 00 whole product
-----------17.20
5.13 whole product
.00 whole product
------ -----5.14
.89 whole product
1 . 76 whole product
. 46 whol e product
3.11
.04 whole product
. 04
Page:
ANNEX 1
6
Date: 05-09- 96
Remark consumption
consumption in survey is 0

Model TMDI pesticide residues in The Netherlands
Average Dutch consumption of primary agricultural products derived from Dutch National Food consumption Survey 1992
EU Nr Nr Group Subgroup Primary Agricultural Product Consumption component
3 3 1 PULSES PEAS PEAS (DRY HARVESTED) .76 whole product
.76
3 4 99 OTHER PULSES OTHER PULSES .00 whole product
.00
4 1 1 OIL-BEARING SEEDS AND PRODUCTS OIL-BEARING SEEDS LINSEED .02 whole product
4 l 2 PEANUTS 7.09 whole product
4 1 3 POPPY SEED .10 whole product
4 1 4 SESAME SEED .07 whole product
4 1 5 SUNFLOWER SEEDS . 10 whole product
4 1 6 COLESEED AND RAPE SEED .10 whole product
4 1 7 SOYABEANS .72 whole product
4 1 8 MUSTARD SEED .07 whole product
4 1 9 COTTON SEED .10 whole product
4 1 10 CUMIN (SEED) .02 whole product
4 1 99 OTHER OIL-BEARING SEEDS .00 whol e product
-----------8.40
4 1 1 LINSEED .01 fat part of product
4 1 2 PEANUTS 3.67 fat part of product
4 1 3 POPPY SEED .00 fat part of product
4 1 4 SESAME SEED .04 fat part of product
4 1 5 SUNFLOWER SEEDS .06 fat part of product
4 1 6 COLESEED AND RAPE SEED .00 fat part of product
4 1 7 SOYABEANS .14 fat part of product
4 1 8 MUSTARD SEED .01 fat part of product
4 1 9 COTTON SEED .00 fat part of product
4 1 10 CUMIN (SEED) .oo fat part of product
4 1 99 OTHER OIL-BEARING SEEDS .00 fat part o f product
--- --------3.93
ANNEX 1
Page: 7
Dat e: 05- 09-96
Remark consumption
consumption in survey is 0
consumption in survey is 0
consumption in survey is 0

Model TMDI pesticide residues in The Netherlands
Average Dutch consumption of primary agricultural products derived from Dutch National Food Consumption Survey 1992
EU Nr Nr Group Subgroup Primary Agricultural Product Consumption Component
4 2 99 OIL-BEARING SEEDS AND PRODUCTS VEGETABLE OILS AND FATS VEGETABLE OILS AND FATS 37.28 whole product
37.28
5 1 99 POTATOES EARLY POTATOES EARLY POTATOES .00 whole product
. 00
5 2 99 STORE POTATOES STORE POTATOES 179.68 whole product
179.68
6 99 99 TEA TEA TEA, DRIED LEAVES/STALKS, POSS 2.13 whole product
2.13
7 99 99 HOP HOP HOPS .10 whole product
.10
8 1 1 GRAINS AND GRAIN PRODUCTS GRAINS WHEAT 122.83 whole product
8 1 2 RYE 4.93 whole product
8 1 3 BARLEY 26.69 whole product
8 1 4 OAT 1.37 whole product
8 1 5 MAIZE 3.01 whole product
8 1 6 RICE 9.90 whole product
8 1 7 SORGHUM .10 whole product
8 1 8 BUCKWHEAT .71 whole product
8 1 9 MILLET .03 who1e product
8 1 99 OTHER GRAINS .00 whole product
-----------169 .58
8 1 1 WHEAT 1.88 fat part of product
Page:
ANNEX 1
8
Date : 05-09-96
Remark consumption
see store potatoes
consumption in survey is 0
consumption in survey is 0
derived from germ part

Model TMDI pesticide residues in The Netherlands
Average Outch consumption of primary agricultural produces derived from Dutch National Food Consumption Survey 1992
EU Nr Nr Group
8
8
8
8
8
8
8
8
8
8
8
8
8
8
9
9
9
9
9
9
9
9
1
1
2 GRAINS AND GRAIN PRODUCTS
3
1 4
1 5
1 6
1 7
1 8
1 9
1 99
2
2
2
2
2
1
1
1
2
2
2
2
2
1
2
3
4
5
1 TROPI CAL SEEDS AND PRODUCTS
2
1
1
2
3
4
5
Subgroup
GRAINS
GRAIN PRODUCTS
TROPICAL SEEDS
PRODUCTS OF TROPICAL SEEDS
Primary Agricultural Product
RYE BARLEY CAT
MAIZE
RICE SORGHUM
BUCKWHEAT
MILLET OTHER GRAINS
WHITE FLOUR
BREAD
ROLLED QATS
FLOUR/MEAL WHOLEMEAL FLOUR
COCOA BEANS
COFFEE BEANS
COCOA BEANS
COCOA BUTTER (PRESS)
COCOA MASS
COCOA POWOER COCOA BUTTER
COFFEE
Consumption Component
.04 fat part of product
.53 fat part of product
.03 fat part of product
.01 fat part of product
.19 fat part of product
.00 fat part of product
.01 fat part of product
.00 fat part of product
.00 fat part of product
2.69
.00 whole product
.00 whole product
.00 whole product
.00 whole product
.00 whole product
.00
3.82 whole product 21.42 whole product
25.24
2.06 fat part of product
2.06
.00 whole product
.00 whole product
.00 whole product
.00 whole product
.00 whole product
.00
ANNEX 1
Page: 9
Date: 05-09-96
Remark consumption
derived from germ part
derived from germ part
derived from germ part
derived from germ part derived from germ part
derived from germ part
derived from germ part derived from germ part derived from germ part
included in grain (s )
included in grain (s ) included in grain (s )
included in grain (s ) included in grain (s)
included in cacao beans
included in cacao beans
included in cacao beans
included in cacao beans
included in coffee b eans

Model TMDI pesticide residues in The Netherlands
Average Dutch consumption of primary agricultural produces derived from Dutch National Food Consumption Survey 1992
EU Nr Nr Group
9
9
9
9
9
10
10
10
11
11
11
11
11
11
11
11
11
11
11
11
11
2
2
2
2
2
1
1
1 TROPICAL SEEDS AND PRODUCT$
2
3
4
5
1 VARIOUS VEGETABLE PRODUCTS
2
2 99
1 10 MEAT, POULTRY, FAT, EDIBLE OFFALS
1 11
1 12
1 13
1 20
1 21
1 22
1 23
1 30
1 50
1 60
1 61
1 10
Subgroup
PRODUCT$ OF TROPICAL SEEDS
SPICES/SEASONINGS
SUGAR
Primary Agricultural Product
COCOA BUTTER (PRESS)
COCOA MASS
COCOA POWDER
COCOA BUTTER
COFFEE
GINGER (ROOT)
TAMARI NO
SUGAR
MEAT,LIVER,KIDNEY,FAT-COW,PIG,SHEE MEAT OF COW
P,GOAT,HORSE
LIVER OF COW
KIDNEY OF COW
FAT OF COW
MEAT OF PI G
LIVER OF PIG
KIDNEY OF PIG
FAT OF PIG
MEAT OF SHEEP
MEAT OF HORSE
MEAT OF CALF
LIVER OF CALF
MEAT OF COW
Consumption Component
.00 fat part of product
.oo fat part of product
.00 fat part of product
.00 fat part of product
.00 fat part of product
-----------.00
.07 whole product
.02 whole product
.09
64.84 whole product
64.84
41.45 whole product
1.64 whole product
.04 whole product
1.16 whole product
57.99 whole product
2.02 whole product
.04 whole product
1.30 whole product
.98 whole product
1 . 40 whole product
.76 whole product
.04 whole product
-- -- -------108.83
3.83 fat part of product
Page:
ANNEX 1
10
Date: 05-09-96
Remark consumption
included in cacao beans
included in cacao beans
included in cacao beans
included in cacao beans
included in coffee beans

Model TMDI peseicide residues in The Neeherlands
Average Duech consumpeion of primary agriculeural produces derived from Duech Naeional Food consumpeion Survey 1992
EU Nr Nr Group Subgroup Primary Agriculeural Produce Consumpeion Componene
11
11
11
11
11
11
11
11
11
11
11
11
11
11
11
11
11
11
11
12 12
12 12
1 11 MEAT, POULTRY, FAT, EDIBLE OFFALS MEAT,LIVER,KIDNEY,FAT-COW,PIG,SHEE LIVER OF COW
P,GOAT,HORSE
1 12
1 13 l 20
1 21
1 22
1 23 1 30
1 50
1 60 l 61
2 20
2 21
2 30 2 50
2 20 2 21
2 30 2 50
1
1
1
1 MILK AND MILK PRODUCTS
2
3
99
KIDNEY OF COW
FAT OF COW
MEAT OF PIG LIVER OF PIG
KIDNEY OF PIG
FAT OF PIG MEAT OF SHEEP MEAT OF HORSE
MEAT OF CALF LIVER OF CALF
MEAT,LIVER-COCK,CHICKEN,DUCK,GOOSE MEAT OF CHICKEN
, TURKEY, G . FOWL
MILK
LIVER OF CHICKEN
MEAT OF DUCK MEAT OF TURKEY
MEAT OF CHICKEN LIVER OF CHICKEN
MEAT OF DUCK MEAT OF TURKEY
COW MILK
GOAT MILK SHEEP MILK
MILK
.08 fae part of produce
.00 fat pare of product 1.16 fae part of produce
6.98 fae pare of product .10 fae pare of produce
.oo fat pare of product
1.30 fae pare of produce .22 f a e pare of product .01 fat pare of produce .04 fae pare of produce
.oo fat pare of produce
-- ---------13.73
15.64 whole product
.20 whole produce
.11 whole produce
.60 whole produce
16.55
.82 fae pare of produce
.01 fae part of produce
.03 fae pa re of produce
.05 fae pare of produce
-----------.91
.00 whole product
.00 whole product
.00 whole produce
402.00 whole product
-----------
ANNEX 1
Page: 11
oaee: 05- 09- 96
Remark consumpei on
prod = fae
prod z fae
included in milk
included in milk
included in milk

Model TMDI pesticide residues i n The Netherlands
Average Dutch consumption of primary agricultural products derived from Dutch National Food Consumpti on Survey 1992
EU Nr Nr Group
12
12
12
12
12
12
12
12
12
12
12
12
13
13
13
13
13
13
13
1
1
1
1 MILK AND MILK PRODUCTS
2
3
1 99
2
2
2
2
2
2
2
2
1
1
1
1
1
1
2
1
2
3
4
1
2
3
4
1 EGGS AND EGG PRODUCTS
2
3
1
2
3
1
Subgroup
MILK
MILK PRODUCTS
EGGS
EGG PRODUCTS
Primary Agricultural Product
COW MILK
GOAT MILK
SHEEP MILK
MILK
CREAM
BUTTER
CHEESE
CURD
CREAM
BUTTER
CHEESE
CURD
WHOLE EGG, CHICKEN
DUCK EGGS
GOOSE EGGS
WHOLE EGG, CHI CKEN
DUCK EGGS
GOOSE EGGS
EGG YOLK
Consumption Component
402.00
.00 fat part of product
.00 fat part of product
.00 fat part of product
19.98 fat part of product
-----------19.98
. 00 whole product
.00 whole product
. 00 whole product
.00 whole product
-----------.00
.00 fat part of product
.00 fat part of product
.00 fat part of product
.00 fat pa rt of product
-----------. 00
22.21 whole product
. 10 whole product
.10 whole product
22.41
2.27 fat part of product
.00 fat part of product
.00 fat part of product
2.27
.84 whole product
Page:
ANNEX 1
12
Date: 05-09- 96
Remark consumpt i on
included in milk
included in milk
included in milk
included in milk
included in milk
incl uded in milk
included in milk
included in milk
included in milk
included in milk
included in mi lk
consumption i n survey is 0
consumption in survey is 0
EU Nr Nr Group
13
13
13
14
14
14
14
14
14
14
14
14
14
14
14
14
14
14
14
14
14
15
15
2
2
2
1
1
1
1
1
1
1
1
1
1
1
1
1
1
1
1
1
1
1
1
2 EGGS AND EGG PRODUCTS
1
2
1 GAME AND POULTRY
2
3
4
5
6
7
8
9
1
2
3
4
5
6
7
8
9
1 FISH PRODUCTS
2
Model TMDI peseicide residues in The Neeherlands
Average Duech consumpt ion of p r imary agricultural p r oduces derived from Dutch National Food Consumption Survey 1992
Subgroup
EGG PRODUCTS
GAME AND POULTRY
FISH (VARIOUS)
Primary Agricu1tura1 Product
PROTEIN
EGG YOLK
PROTEIN
DOVE
PHEASANT
HARE
DEER
RABBIT, INCL. DOMESTI C RABBIT
PARTRIDGE
ROE-DEER
WILD DUCK
WILD PIG, BOAR
DOVE
PHEASANT
HARE
DEER
RABBIT, INCL. DOMESTIC RABBIT
PARTRIDGE
ROE - DEER
WILD DUCK
WILD PIG, BOAR
EEL
RAY
Consumption Component
.50 who1e product
l. 34
.37 fat part of product
.00 fat part of product
.37
.10 whole product
.10 who1e product
.06 whole product
.10 whole product
.23 whole product
.10 whole product
.03 whole product
.10 whole product
.10 whole product
-----------.91
.00 fat part of product
.00 fat part of produce
.00 fat part of product
.00 fat part of product
.02 fat part of product
.00 fat part of product
.00 fat part of product
.00 fat part of product
.00 fat part of product
-----------.03
.40 who1e product
.os whole product
------- ----.45
Page:
ANNEX 1
13
Date: 05 -09-96
Remark consumption
consumption in survey is 0
consumption in survey is 0
consumption in survey is 0
consumption in survey is 0
consumption in survey is 0
consumption in survey is 0

EU Nr Nr Group
15
15
15
15
15
15
15
15
15
15
15
15
15
15
15
15
15
1
1
2
2
2
2
2
2
3
3
3
3
4
4
4
4
4
1 FISH PRODUcrS
2
1
2
3
1
2
3
1
2
1
2
1
2
3
4
1
Model TMDI pesticide residues in The Netherlands
Average Dutch consumption of primary agricultural products derived from Dutch National Food Consumption Survey 1992
Subgroup
FISH (VARIOUS )
FISH (HERRING-TYPE)
FISH (MACKEREL-TYPE)
FISH (CCD- TYPE )
Primary Agricultural Product
EEL
RAY
HERRING
ANCHOVY
SARDINES
HERRING
ANCHOVY
SARDINES
MACKEREL
TUNA
MACKEREL
TUNA
COD
POLLACK, LYTHE
HADDOCK
GURNARD
COD
Consumption Component
.08 fat part of product
.oo fat part of product
.08
1.92 whole product
.00 whole product
.04 whole product
l. 96
.22 fat part of product
.00 fat part of product
.01 fat part of product
-------- ---.23
. 4 5 whole product
.23 whole product
.69
. 12 fat part of product
.0 0 fat part of product
.13
1.16 whole product
.89 whole product
.06 whole product
.OS whole product
----- ------2.17
.02 fat part of product
Page:
ANNEX 1
l4
Date: 05 - 09-96
Remark consumption

EU Nr Nr Group
15
15
15
15
15
15
15
15
15
15
15
1 5
15
15
15
15
l S
4
4
4
5
5
5
5
5
5
5
5
6
6
6
6
7
7
2 FISH PRODUCTS
3
4
1
2
3
4
1
2
3
4
1
2
1
2
l
1
Model TMDI pesticide residues in The Netherlands
Average Dutch consumption of primary agricultural products derived from Dutch National Food Consumption Survey 1 992
Subgroup
FISH (COD·TYPE)
FISH (FLAT FISH TYPE )
FISH (SALMON-TYPE)
FISH (CARP-TYPE)
Primary Agricultural Product
POLLACK, LYTHE
HADOOCK
GURNARD
FLOUNDER, FLUKE
PLAICE
SOLE
LEMON SOLE , LIMANDE
FLOUNDER, FLUKE
PLAICE
SOLE
LEMON SOLE, LIMANDE
SALMON
TROUT
SALMON
TROUT
CARP
CARP
Consumpt i on Component
.OS fat part of product
.00 fat part of product
.00 fat part of product
.07
.13 who1e product
2.70 who1e product
.OS whole product
. OS whole product
-----------2.93
.02 fat part of product
.22 fat part of product
.00 fat part of product
.00 fat part of produc t
---------- -.24
.79 whole product
.02 whol e product
.81
.09 fat part of product
.00 fat part of product
.10
.02 whole product
.02
.00 fat part of product
Page:
ANNEX 1
15
Date: OS - 09-96
Remark consumpti on

EU Nr Nr Group
15
15
15
15
15
15
15
15
15
15
8
8
8
8
9
9
9
9
9
9
15 10
15 10
15 10
15 10
15 11
1 FISH PRODUCTS
2
1
2
1
2
3
1
2
3
1
2
1
2
1
Model TMDI pesticide residues in The Netherlands
Average Dutch consumption of primary agricultural products derived from Dutch National Food Consumption Survey 1992
Subgroup
FISH (PERCH-TYPE)
CRUSTACEANS
MOLLUS CS
SPAWN
Primary Agricultural Product
PERCH
BREAM
PERCH
BREAM
CRAB
LOBSTER
SHRIMPS
CRAB
LOBSTER
SHRIMPS
MUSSEL
OYSTERS
MUSSEL
OYSTERS
SPAWN
Consumption Component
. 00
.05 whole product
.02 whole product
.07
.00 fat part of product
.00 fat part of product
.00
. 02 whole product
.01 whole product
.47 whole product
. 50
.00 fat part of product
.oo fat part of product
.01 fat part of product
---- -------.01
.26 whole product
.00 whole product
.27
.01 fat part of product
.00 fat part of product
. 01
.10 whole product
Page:
ANNEX 1
16
Date : 05- 09-96
Remark consumption
consumption in survey is 0

EU Nr Nr Group
15 ll
15 12
15 12
1 5 1 3
15 13
16
16
16
16
1
1
1
1
1 FISH PRODUCTS
1
1
1
1
1 OTHER ANIMAL PRODUCTS
2
1
2
16 2 99
Model TMDI pesticide residues in The Netherlands
Average Dutch consumption of primary agricultura l products der ived from Dutch Nat i onal Food Consumption Survey 1992
Subgroup Primary Agricul tural Product Consumption Component
.10
SPAWN SPAWN . 00 fat part of product
.00
FISH LIVER LIVER OF HADDOCK .01 whole product
.01
LIVER OF HADDOCK .00 fat part of product
. 00
OCTOPUS/SQUID OCTOPUS . 01 whole product
.01
OCTOPUS .00 fat part of product
. 00
MEAT OF REPTILES AND AMPHIBIANS MEAT OF REPTILES AND AMPHIBIAN .10 whole product
FROG PARTS .10 whole produc t
-------- ---. 20
MEAT OF REPTILES AND AMPHIBIAN .00 fat part of product
FROG PARTS .00 fat part of product
-----------.00
SNAILS SNAIL .03 whole product
Page :
ANNEX 1
17
Date : 05 - 09-96
Remark consumption
consumption in survey i s 0
consumption in survey is 0

EU Nr Nr Group
16
16
16
16
16
16
2 99 OTHER ANIMAL PRODUCTS
3 1
3 99
3 1
3 99
4 99
377 r ows selected.
Model TMDI pesticide residues in The Netherlands
Average Dutch consumption of primary agricultural products derived from Dutch National Food Consumption Survey 1992
Subgroup
SNAILS
OTHER ANIMAL OILS AND FATS
HONEY
Primary Agricultural Product
SNAIL
COD-LIVER OIL
ANIMAL OILS AND FATS
COD-LIVER OIL
ANI MAL OILS AND FATS
HONEY
Consumption Component
.03
.00 fat part of product
.oo
.10 whole product
2.67 whole product
2.77
.00 fat part of product
2.67 fat part of product
2.67
.82 whole product
.82
ANNEX 1
Page: 18
Date : 05-09-96
Remark consumption
consumption in survey is 0
prod • fat
prod a fat

ANNEX 2: Attribute definitions Dutch TMDI model.
Entlty: PAP
- Pap_name_nl Name of primary agricultural product. These are products with established MALs in Dutch and EG legislation.
- Pap_source_number
- Pap_name_uk
- Eu _productgroup _ number
- Eu_productsubgroup_number
- Eu_product_number
Proporties: Mandatory Basic Text Length: 50 Default none
Aeference to literature where primary agricultural product is mentioned.
Proporties: Optional Basic Integer Length: 1 Default none
English name of primary agricultural product. These are produels with established MALs in Dutch and EG legislation.
Proporties: Optional Basic Text Length: 50 Default none
Unique number for a product group of primary agricultural products according to the EU plant classification.
Proporties: Optional Basic Integer Length: 2 Default none
Unique number for a product subgroup (in combination with eu _productgroup _number) of primary agricultural products according to the EU plant classification.
Proporties: Optional Basic Integer Length: 2 Default none
Unique number for an individual primary agricultural product (in combination with eu_productgroup_number, eu_productsubgroup_number) according to the EU plant classification.
Proporties: Optional Basic Integer Length: 2 Default none

Entlty:
- Component_code
- Component_desc_nl
- Component_desc_uk
Entlty:
- Eu_productgroup_number
- Eu_productgroup_name_nl
- Eu_productgroup_name_uk
Entlty:
- Eu_productgroup_number
- Eu_productsubgroup_number
COMPONENT
Code tor the consumed component of a primary agricultural product.
Proporties: Mandatory Basic Text Length: 12 Default none
Dutch description of the component_code.
Proporties: Mandatory Basic Text Length: 60 Default none
English description of the component_code
Proporties: Optional Basic Text Length: 60 Default none
EU PPRODUCTGROUP
Unique number tor a productgroup according to the EU plant classification (Directive 90/642/EEC) .
Proporties: Mandatory Basic Integer Length: 2 Default none
Dutch name of productgroup.
Proporties: Mandatory Basic Text Length: 50 Default none
English name of productgroup.
Proporties: Optional Basic Text Length: 50 Default none
EU_PRODUCTSUBGROUP
Unique number tor a productgroup according to the EU plant classification (Directive 90/642/EEC).
Proporties: Mandatory Basic Integer Length: 2 Default none
Unique number tor a productsubgroup according to EU plant classification (Directive 90/642/EEC) .

- Eu _productsubgroup _name _nl
- Eu _productsubgroup _name_ uk
Entlty:
- Eu_productgroup_number
- Eu_productsubgroup_number
- Eu_product_number
- Avg_cons_pap_tmdi
- Component_ code
Proporties: Mandatory Basic Integer Length: 2 Default none
Dutch name of productsubgroup.
Proporties: Mandatory Basic Text Length: 50 Default none
English name of productsubgroup.
Proporties: Optional Basic Text Length: 50 Default none
CONSUMPTION PAP
Unique number tor productgroup according to EU plant classification (Directive 90/642/EEC).
Proporties: Mandatory Basic Integer Length: 2 Default none
Unique number tor a productsubgroup according to EU plant classification (Directive 90/642/EEC).
Proporties: Mandatory Basic Integer Length: 2 Default none
Unique number tor a product (in combination with eu _productgroup _ number,eu _productsubgroup _ number) according to EU plant classification.
Proporties: Optional Basic Integer Length: 2 Default none
Average consumption of primary agricultural produels derived trom the DNFCS-1992 population n = 6,218 (corrected tor sex-age). Consumption values are updated when consumption = 0 according to WHO procedures. These consumption figures are applied for a TMDI calculation.
Proporties: Optional Basic Integer Length: 10,4 Default none
Code tor the consumed component of a primary

- Consumption_reference
Entlty:
- Compound_name
- Eu_productgroup_number
- Eu_productsubgroup_number
- Eu_product_number
- Value
- Component_ code
agricultural product.
Proporties: Mandatory Basic Text Length: 12 Default none
Remarks to consumption data.
Proporties: Optional Basic Text Length: 80 Default none
COMPOUND_PAP _MRL
Entered name of compound for calculating TMDI.
Proporties: Mandatory Basic Text Length: 50 Default none
Unique number tor productgroup according to EU plant classification (Directive 90/642/EEC).
Proporties: Mandatory Basic Integer Length: 2 Default none
Unique number for a productsubgroup according to EU plant classification (Directive 90/642/EEC).
Proporties: Mandatory Basic Integer Length: 2 Default none
Unique number for a product (in combination with eu_productgroup_number,eu_productsubgroup_number) according to EU plant classification.
Proporties: Mandatory Basic Integer Length: 2 Default none
MRL value to be entered of compound for concerning product.
Proporties: Optional Basic Integer Length: 9,5 Default none
Code for the consumed component of a primary agricultural product.
Proporties: Mandatory Basic Text Length: 12

Entlty:
- Compound_name
- ADI value
-LOD
- Component_code
- Body_weight
Default none
COMPOUND_ADI
Entered name of compound tor calculating TMDI.
Proporties: Mandatory Basic Text Length: 50 Default none
Acceptable Daily Intake.
Proporties: Mandatory Basic Integer Length: 9,5 Default none
Limit of Determination.
Proporties: Optional Basic Integer Length: 9,5 Default none
Code tor the consumed component of a primary agricultural product.
Proporties: Mandatory Basic Text Length: 12 Default none
Average body weight. The user can enter a standard body weight of 60 kg or the average body weight of the DNFCS-1992 population of 65 kg.
Proporties: Mandatory Basic Integer Length: 2 Default none


ANNEX 3: Output Dutch TMDI model pesticide chlorfenvinphos.

\

ADI : Acceptable Daily Intake (mg/kg b ody weight )
Model TMDI pesticides in The Netherlands
Calculation of Theoretica! Maximum Daily Intake
Consumpti on Average consumption (g/person/day) of primary agricultural products derived from Dutch National Food Consumption Survey 1992
MRL Maximum Residu Limit (mg/kg)
TMDI Theoretica! Maximum Dail y Int ake (ug/person/day)
ADI~ : Percentage (t) of ADI
Calculation including MRLs at Level Of Determination (MRL• )
COMPOUND CHLORFENVINPHDS ADI-waarde .0005
Productgroup Product subgroup Product Component Consumption MRL MRL* TMDI TMDI* AD! t
ANNEX 3
Page: 1
Date : 05-09-96
ADI %*
-------------------- -------------------- ---------- ---------------- ------- ----------------- --------- ------ ----- -------- -- -- ---- -- ---- --- --------- --------- --- ------FRUIT, NUTS CITRUS FRUIT GRAPEFRUIT PROD 5.28 1.000 1.000 5.28 5.28 16.23 16.23
LEMDN PROD 2.13 2.13 2.13 6.55 6.55
LIME PRDD .10 . 1 0 .10 . 31 .31
MANDARIN DRANGE, CLEMENTINE AND DTHERS PRDD 10.18 10.18 1 0 .18 31.33 31.33
DRANGE PRDD 77.41 77.41 77.41 238.18 238.18
PO MELD PRDD .10 .10 . 1 0 .31 .31
DTHER CITRUS FRUIT PRDD .00 .co . 00 .00 . 00
NUTS ALMDND PRDD .81 .000 .oso .00 .04 .oe . 12
PARANUTS (BRAZILNUT) PROD .os .00 .00 .00 .01
CASHEW PRDD . 42 .00 .02 .00 . 07
SWEET (EDIBLE) CHESTNUTS PRDD .02 .00 . 00 . 00 . 00
CDCDNUT PRDD .62 .co .03 . 00 .09
HAZELNUT PROD .77 .00 .04 . 00 .12
MACADAMIA NUT PROD .10 .00 .01 . 00 . 02
PECAN PROD .10 .oo .01 . 00 . 02
PINE CONE PROD .10 .00 .01 .00 . 02
PISTACHID NUTS PROD .10 .00 .01 .co .02
WALNUTS PROD .26 .co . 01 .00 .04
OTHER NUTS PRDD . 00 . 00 .00 .00 .00
MALACEDUS FRUIT APPLE PRDD 81. os .000 .aso .00 4.0S .00 12.47
PEAR PROD 9.49 .00 .47 .00 1.46
QUINCE PRDD .11 .oo .01 .00 .02
OTHER MALACEDUS FRUIT PRDD .00 .oo .00 . 00 .00
STONE FRUIT APRICOT PRDD 2.23 .000 .aso . 00 .11 .00 .34
SWEET CHERRIES PROD 2.17 .00 .11 .co . 33
PEACH, NECTARINE PRDD 2.79 .00 .14 .co .43
PLUM PRDD l. 94 .oo .10 . 00 .30

ADI
Consumption
MRL
TMDI AOI'I;
Productgroup
Acceptable Daily Intake (mg/kg body weight )
Model TMDI pesticides in The Netherlands
calculation of Theoretical Maximum Daily Intake
Average consumption (g/person/day) of primary agricultural products derived from Dutch National Food Consumption Survey 1992 Maximum Residu Limit (mg/kg)
Theoretical Maximum Daily Intake (ug/person/day)
Percentage (%) of ADI
Calculation including MRLs at Level Of Determination (MRL• )
COMPOUND
Productsubgroup Product
CHLORFENVINPHOS ADI-waarde .OOOS
Component Consumption MRL MRL• TMDI TMDI• ADI %
ANNEX 3
Page: 2
Date: OS-09-96
ADI %•
-------------------- ------------------------------ ---------------- ------ ------------·------ --------- ------- ---- -------- -------- ----- --- - --------- ------ --- ---- -----FRUIT, NUTS STONE FRUIT OTHER STONE FRUIT PROD . 00 .000 .oso .oo . oo .00 .00
BERRIES AND SMALL FRUIT TABLE GRAPES PROD 1S.20 .ooo .oso .00 .76 .00 2.34 WINE GRAPES PROD 34.82 .00 1. 74 .00 S.36 STRAWBERRY PROD 4.33 .oo .22 . 00 .67 BLACKBERRY PROD .32 .00 .02 . 00 .os DEWBERRY PROD .10 .oo .01 . 00 .02 LOGJ\NBERRY PROD .10 .00 .01 .00 .02 RASPBERRY PROD .81 .00 .04 .00 .12 BLUE BILBERRIES PROD .2S .00 .01 .oo .04 CRANBERRIES PROD .00 .oo . 00 . 00 .oo CURRANT (RED, WHITE, BLACK) PROD 1. 38 .00 .07 . 00 .21 GOOSEBERRIES PROD .os . 00 . 00 . 00 . 01 COWBERRY PROD .oo .00 .00 .oo . 00 ELDERBERRY PROD .26 .oo . 01 .00 . 04 ROSE HIP PROD .40 .oo .02 .00 .06 OTHER RUBUS VARIETlES PROD .00 .oo .00 .00 .00
OTHER SMALL FRUIT AND BERRY FRUIT (NOT W PROD .00 .oo .00 .00 . 00 WILD BERRY FRUIT$ AND WILD FRUIT$ PROD .00 .oo .00 .00 .oo
VARIOUS FRUIT$ AVOCADO PROD .02 .000 .oso .oo .00 .00 .00 BANANA PROD 21. S9 .00 1. 08 .oo 3.32
DATE PROD .03 .00 .oo .00 .00 FIGS PROD .02 .00 .00 .oo . 00 KIWI FRUIT PROD 3.0S .00 .1S .00 .47
KUMQUAT PROD .10 . 00 .01 .oo .02
LYCHEE PROD .03 .00 .oo . 00 . 00
MANGO PROD .84 .00 .04 .00 .13
OLIVES (TABLE OLIVES) PROD .2S .oo . 01 . 00 .04
OLIVES (FOR OIL-EXTRACTI ON) PROD . 00 .00 .00 . 00 . 00

ADI
Consumption
MRL
TMDI
AD I%
Productgroup
Acceptabl e Daily Intake (mg/kg body weight)
Model TMDI pesticides in The Netherlands
Calculation of Theoretica! Maximum Daily Intake
Average consumption (g/person/day) of primary agricultural products derived from Dutch National Food Consumption Survey 1992
Maximum Residu Limi t (mg/kg)
Theoretical Maximum Daily Intake (ug/person/day)
Percentage (t) of ADI
Calculation including MRLs at Level Of Determination (MRL*)
COMPOUND
Productsubgroup Product
CHLORFENVINPHOS ADI-waarde .0005
Component Consumpti on MRL MRL• TMDI TMDI* ADI '0
ANNEX 3
Page: 3
Date: 05-09-96
ADI '0 •
----------------·---- -------------- ------------- --- ---------- ----------------- -------- ----- --------- --- ------- - -------- --- ----- --------- --------- ----- ---- ---------FRUIT, NUTS VARIOUS FRUITS PASSIONFRUIT PROD .54 .000 . 050 .00 .03 .00 . 08
PINEAPPLE PROD 4.51 .oo .23 . 00 . 69
POMEGRANATE PROD .10 . 00 .01 .00 .02
GUAVA PROD .00 .00 .00 .00 . 00
PAPAYA PROD .10 .00 . 01 .00 .02
KAKI PROD .02 . 00 . 00 .00 . 00
OTHER MISCELLANEOUS FRUIT PROD .0 0 .00 .00 .oo . 00
VEGETABLES ROOTS AND TUBERS BEETROOT PROD 5.15 .500 .500 2.58 2.58 7.92 7.92
CARROT PROD 13.43 6. 71 6. 71 20.66 20.66
CELERIAC PROD .78 .39 . 39 1.21 1.21
HORSERADISH PROD .10 .05 .05 . 1 5 .15
TOPINAMBUR PROD . 1 0 .os .os . 15 .15
PARSNIP PROD .10 .os .05 . 15 .15
ROOTED PASLEY PROD .10 .05 .05 .15 . 15
RADISH PROD . 43 .21 .21 .66 .66
SALSIFY PROD .06 .03 .03 .09 . 09
SWEET POTATO PROD .04 .02 .02 .06 .06
SWEDISH TURNIP, SWEDE PROD .8 1 . 40 .40 1.24 1.24
TURN I P SHOOTS PROD .10 .05 .os .15 . 15
YAM PROD .10 .os .05 .15 .15
WINTER CARROT PROD .16 .08 . 08 .24 .24
CAS SA VA PROD .02 . 01 . 01 .03 .03
BLACK RADISH PROD .03 .01 . 01 .04 . 04
OTHER ROOT AND TUBER VARIETlES PROD .02 .01 .01 .03 .03
BULSOUS PLANT GARLIC PROD .01 .500 .500 .00 . 00 .01 .01
ONION PROD 16.81 8.41 8.41 25.87 25.87
SHALLOT PROD .10 .05 .05 .15 . 15

ADI
Consumption
MRL
TMDI
ADH:
Productgroup
Acceptable Daily Intake (mg/kg body weight)
Model TMDI pesticides in The Netherlands
Calculation of Theoretical Maximum Daily Intake
Average consumption (g/person/day) of primary agricultural products derived from Dutch National Food Consumption Survey 1992
Maximum Residu Limit (mg/kg)
Theoretical Maximum Daily Intake (ug/person/day)
Percentage (%) of ADI
Calculation including MRLs at Level Of Determination (MRL• )
COMPOUND
Productsubgroup Product
CHLORFENVINPHOS ADI-waarde .OOOS
Component Consumption MRL MRL* TMDI TMDI• ADI '<
ANNEX 3
Page: 4
Date: OS-09-96
ADI %•
----------- --------- --- --------------------------- -------- -------- ----------------- ------- --------- ---- ------- -------- -------- --------- --------- --------- ---------VEGETABLES BULBOUS PLANT ONION (SMALL) PROD .10 .soo .soo .os .os .1S .1S
OTHER BULBOUS PLANT$ PROD .00 .oo .00 .00 .00
FRUITING VEGETABLES TOMATO PROD 26.07 .100 .100 2.61 2.61 8.02 8.02
$WEET PEPPER PROD 3.97 .40 . 40 1.22 1.22
AUBERGINE/EGG PLANT PROD .26 .03 . 03 .os .oe CUCUMBER PROD 8.03 .80 .80 2.47 2. 47
GHERKIN/PICKLE PROD 1. S4 .1S .1S .47 .47
COURGETTE PROD .S4 .os . os .17 .17
MELON PROD 2.23 .22 .22 .69 .69
PUMPKIN PROD .02 .00 .00 .01 .01
WATERMELON PROD .48 .os .os .1S .1S
SWEET CORN PROD 1. 41 .14 .14 .43 .43
OTHER SOLANACEAE PROD .00 .00 . 00 .oo .00
OTHER CUCURBITACEAE WITH EDIBLE SKIN PROD .00 .00 . 00 .oo .00
OTHER CUCURBITACEAE WITH NOT EDIBLE SKIN PROD . 00 .oo .00 .00 .00
CABBAG ES BROCCOLI PROD 1. 98 .100 .100 .20 .20 .61 .61
CAULIFLOWER PROD 16.00 1. 60 1. 60 4. 92 4. 92
BRUSSEL SPROUTS PROD 4.66 .47 .47 1. 4.4. 1. 44
RED CABBAGE PROD S.13 .S1 .S1 1.S8 1. S8
OXHEART/CONICAL CABBAGE PROD 2.03 .20 .20 .62 .62
WHITE CABBAGE PROD 6.98 .70 .70 2.1S 2.1S
SAVOY CABBAGE PROD 1.20 . 12 .12 .37 . 37
CHINESE CABBAGE PROD .92 .09 .09 .28 .28
CURLY KALE PROD 4.93 .49 .49 1.S2 l.S2
KOHLRABI PROD .1S .01 . 01 .os .os OTHER CAULIFLOWER VARIETlES PROD .00 .00 .00 .00 .00
OTHER HEADED CABBAGE VARIETlES PROD .00 .00 . 00 .00 .00
OTHER LEAF CABBAGE VARIETlES PROD .00 . 00 . 00 .00 . 00

ADI Acceptable Daily Intake (mg/kg body weight )
Model TMDI pesticides in The Netherlands
Calculation of Theoretical Maximum Dail y Intake
Consumption Average consumption (g/person/day) of primary agricultural products derived from Dutch National Food Consumption Survey 1992
MRL Maximum Residu Limit (mg/kg)
TMDI Theoretical Maximum Daily Intake (ug/person/day)
ADI% Percentage (%) of ADI
Calculation including MRLs at Level Of Determination (MRL* )
COMPOUND CHLORFENVINPHOS ADI-waarde .ooos
Productgroup Productsubgroup Product Component Consumption MRL MRL*
VEGETABLES LEAF VEGETABLES AND FRESH HERB GARDENCRESS PROD . 00 .100 .100
LAMB- S LETTUCE PROD .22
CABBAGE LETTUCE, COS LETTUCE PROD 8.48
ENDIVE PROD 7.42
PURSLANE PROD .24
SPINACH PROD 10.24
SWISS CHARD/LEAF BEAT PROD .49
WATERCRESS PROD .10
CHICORY PROD 9 . 17
CHERVIL PROD .10
CHIVES PROD .10
PARSLEY PROD .10 .soo .soo CELERY PROD .27
TURNIP TOPS PROD .oe .100 . 100
OTHER LETTUCE AND SIMILAR VARI ETlES PROD . 01
OTHER SPINACH AND SIMI LAR VARIETlES PROD .00
OTHER FRESH HERBS PROD .00
LEGUMES FRENCH BEANS (FRESH) PROD 3.14 . 100 . 100
GREEN BEANS (FRESH) PROD 11.66
LEGUME ( FRESH) PROD .so STRING BEAN (FRESH) PROD .12
MARROW FAT PEA (DRY HARVESTED) PROD . 33
BROAD BEAN (FRESH) PROD 2.SO
GREEN/ (GARDEN) PEAS (FRESH) PROD l4. 78
OTHER LEGUMES (FRESH) PROD . 00
STALK VEGETABLES ASPARAGUS PROD 1.74 .100 .100
CARDOON PROD .10
TMDI TMDI *
.00 .00
.02 . 02
.8S .8S
.74 .74
.02 .02
l. 02 l. 02
.os .os
.01 .01
.92 . 92
.01 .01
.01 .01
.os .os
.13 .13
.01 .01
.00 . 00
.00 . 00
.00 .00
.31 .31
1.17 1.17
.os .os
.01 . 01
.03 .03
.2S .2S
1.48 1.48
. 00 . 00
. 17 .17
.01 . 01
ADI :C
.00
.07
2 . 61
2.28
.07
3.1S
. 1S
.03
2.82
.03
.03
.16
.41
.02
.00
. 00
.00
. 97
3.S9
.1S
.04
.10
. 77
4.SS
.00
.S4
.03
ANNEX 3
Page: s
Date: OS-09 - 96
ADI 'è*
.00
. 07
2.61
2.28
.07
3.1S
.1S
.03
2.82
. 03
.03
.16
.41
.02
.00
.00
.00
. 97
3 . S9
.1S
.04
.10
. 77
4.SS
.00
.S4
.03

ADI
Consumption
MRL
TMDI
ADI't
Productgroup
Acceptable Daily Intake (mg/kg body weight )
Model TMDI pesticides in The Netherlands
Calculation of Theoretical Maximum Daily Intake
Average consumption (g/person/day) of primary agricultural products derived from Dutch National Food Consumption Survey 1 992
Maximum Residu Limi t (mg/kg )
Theoretical Maximum Daily Intake (ug / person/day)
Percentage (%) of ADI
Ca lculation including MRLs a t Level Of Determination (MRL* )
COMPOUND
Productsubgroup Product
CHLORFENVINPHOS ADI-waarde : .0005
Component Consumption MRL MRL* TMDI TMDI* ADI %
ANNEX 3
Page: 6
Date: 05- 09-96
ADI %•
-------------- ------ ----- --- --- -- ------ ----------- -- --------- --- -------- -- ------- ---- ----- --------- ----------- ---- ---- -- -- ---- --- ------ ---- ----- ------ --- ----- ----VEGETABLES STALK VEGETABLES (BLEACH) CELERY PROD .56 .500 .500 .26 .28 .86 .86
FENNEL PROD . 09 .100 .100 . 01 . 01 . 03 . 03
ARTICHOKE PROD .04 .00 .00 . 01 .01
LEEK PROD 12 .86 1.29 1. 29 3. 96 3.96
RHUBARB PROD .7l .07 .07 .22 .22
BEAN SPROUTS PROD 1. oe .ll .ll .33 . 33
BAMBOO SHOOTS PROD .01 . 00 .00 . 00 . 00
OTHER STALK VEGETABLES PROD .00 . 00 .00 .00 . 00
FUNGUS MUSHROOM PROD 5.13 .100 .100 .51 .51 l. 58 1.58
CHANTARELLE PROD .00 .00 .00 .00 . 00
PULS ES BEANS WHITE BEAN (DRY HARVESTED) PROD .89 .000 .050 . 00 . 04 . 00 . 14
BROWN BEAN (DRY HARVESTED) PROD l. 76 .00 . 09 . 00 .27
BEANS PROD .46 .00 .02 . 00 .07
LENTILS LENTILS PROD . 04 . 000 . 050 . 00 . 00 . 00 . 01
PEAS PEAS (DRY HARVESTED) PROD .76 . 000 . 050 .00 .04 .00 .12
OTHER PULSES OTHER PULSES PROD . 00 .ooo .050 . 00 . 00 . 00 . 00
OIL-BEARING SEEDS AN OIL-BEARING SEEDS LINSEED PROD .02 .000 .050 .00 . 00 .0 0 . 00
PEANUTS PROD 7.09 . 00 .3 5 . 00 l. 09
POPPY SEED PROD .10 . 00 . 01 .00 .02
SESAME SEED PROD .07 .00 .00 .00 .01
SUNFLOWER SEEDS PROD .10 .co . 01 .00 .02
COLESEED AND RAPE SEED PROD .10 .00 .01 .oo .02

ADI
Consumption
MRL
TMDI
ADH:
Productgroup
Acceptable Daily Intake (mg/ kg body weight)
Model TMDI pesticides in The Netherlands
Calculation of Theoretical Max imum Da ily Intake
Average consumption (g/person/day) of primary agricultural products derived from Dutch National Food Consumption Survey 1992
Maximum Residu Limit (mg/kg )
Theoretical Maximum Daily Intake (ug/ person/day)
Percentage (~) of ADI
Calc ulation including MRLs at Level Of Determination (MRL* )
COMPOUND
Productsubgroup Product
CHLORFENVINPHOS ADI-waarde .ooos
Component Consumption MRL MRL* TMDI TMDI* ADI %
ANNEX 3
Page: 7
Date : OS-09-96
ADI ~· --- --- -- --- --------- --------- ------ -- ---- --- --- --- ----- --- ---- ----- ----- -- --- -- --- -- --- -- - --------- ----------- -- --- -- - -------- ---- -- --- --------- ---- --- -- --- ------OIL- BEARING SEEDS AN OIL- BEARING SEEDS SOYABEANS PROD .72 .000 .oso .00 .04 .00 .11
MUSTARD SEED PROD .07 .00 . 00 .00 .01
COTTON SEED PROD .10 .00 .01 .00 . 02
CUMIN (SEED) PROD .02 . 00 .00 .00 .00
OTHER OIL-BEARING SEEDS PROD .00 .00 .00 . 00 . 00
VEGETABLE OILS AND FATS VEGETABLE OILS AND FATS PROD 37.28 .000 .aso .00 1. 86 . 00 S.74
POTATOES EARLY POTATOES EARLY POTATOES PROD .00 .ooo . oso .00 . 00 . 00 .00
STORE POTATOES STORE POTATOES PROD 179.68 .000 .aso .00 8.98 .00 27.64
TEA TEA TEA, DRIED LEAVES/STALKS, POSSIBLY FERME PROD 2.13 .200 .200 .43 .43 1. 31 1. 31
HOP HOP HOPS PROD .10 .000 .aso .00 .01 . 00 .02
GRAINS AND GRAIN PRO GRAINS WHEAT PROD 122.83 .ooo .oso .00 6.14 .00 18.90
RYE PROD 4.93 .00 .2S .00 . 76
BARLEY PROD 26.69 . 00 1. 33 .00 4..11
OAT PROD 1. 37 . 00 .07 .oo .21
MAIZE PROD 3 . 01 . 00 . 1S .00 .4.6
RICE PROD 9.90 .00 .sa .00 1. S2
SORGHUM PROD .10 . 00 .01 .oo .02
BUCKWHEAT PROD . 71 .00 .04 .00 . 11
MILLET PROD .03 .00 .00 .00 .00
OT:-!ER GRAINS PROD . 00 . 00 . 00 . 00 .00

ADI Acceptable Daily Intake (mg/kg body weight)
Model TMDI pesticides in The Netherlands
Calculation of Theoretica! Maximum Daily I ntake
consumption Average consumption (g/person/day) of primary agricultural products derived from Dutch National Food Consumption Survey 1992
MRL Maximum Residu Limit (mg/kg)
TMDI Theoretica! Maximum Daily Intake (ug/person/day)
ADit : Percentage (t) of ADI
Calculation including MRLs at Level Of Determination (MRL*)
Productgroup Productsubgroup
GRAINS AND GRAIN PRO GRAIN PRODUCTS
TROPICAL SEEDS AND P TROPICAL SEEDS
PRODUCT$ OF TROPICAL SEEDS
VA-~IOUS VEGETABLE PR SPICES/SEASONINGS
SUGAR
Product
WHITE FLOUR
BREAD
COMPOUND
ROLLED OATS
FLOUR/MEAL
WHOLEMEAL FLOUR
COCOA BEANS
COFFEE BEANS
COCOA BUTTER (PRE SS )
COCOA MASS
COCOA POWDER
COCOA BUTTER
COFFEE
GINGER (ROOT)
TAMARI NO
SUGAR
MEAT, POULTRY, FAT, MEAT,LIVER,KIDNEY,FAT-COW,PIG, MEAT OF COW
LIVER OF COW
KIDNEY OF COW
FAT OF COW
MEAT OF PIG
LIVER OF PIG
CHI.ORFENVINPHOS ADI-waarde .0005
Component Consumption MRL MRL*
PROD .00 .ooo .oso PROD .00
PROD .00
PROD . 00
PROD .00
PROD 3.82 .000 .050
PROD 21.42
PROD .oo .ooo .oso PROD .00
PROD .oo PROD .00
PROD . 00
PROD .07 .000 .oso PROD .02
PROD 64.84 .000 .oso
FAT 3.83 .200 .200
FAT .08
FAT .00
FAT 1.16
FAT 6.98
FAT .10
TMDI TMDI*
. 00 . 00
.00 .00
.00 .00
.0 0 .00
. 00 .00
.00 . 19
.00 l. 07
.00 .00
.00 .00
. 00 . 00
. 00 .00
. 00 .00
. 00 .oo
.00 .00
. 00 3.24
.77 .77
.02 .02
.00 .00
.23 .23
1.40 1.40
.02 .02
AD! %
.00
.00
. 00
.00
. 00
.00
.00
.00
. 00
. 00
.00
.00
. 00
.00
. 00
2.3S
.os
. 00
.71
4.29
.06
ANNEX 3
Page: 8
Date: OS-09-96
ADI '!:*
.00
.00
.00
. 00
. 00
.S9
3 .3 0
.00
. 00
. 00
.00
.00
.01
.00
9.97
2.3S
.os
. 00
.71
4 .29
.06

ADI Acceptable Daily Intake (mg/kg body weight )
Model TMDI pesticides in The Netherlands
Calculation of Theoretical Maximum Daily Intake
Consumption : Average consumpti on (g/person/day) of primary agricul tural products derived from Dutch Na tional Food Cons umption Survey 1992
MRL : Maximum Residu Limit (mg/kg)
TMDI Theoretical Maximum Daily Intake (ug/person/day)
ADI% Percentage {%) of ADI
Calcul ation including MRLs at Level Of Oeterminat ion (MRL*)
COMPOUND CHLORFENVINPHOS ADI-waarde . 0005
Productgroup Productsubgroup Product Component Consumption MRL MRL* TMDI TMDI* ADI %
ANNEX 3
Page: 9
Date: 05-09-96
ADI '!:*
-------------------- ------------------------------ ---------------------------------------- --------- ----- -- ---- -------- ------ -- ----- ---- ---- ----- --------- ---- -----MEAT, POULTRY, FAT, MEAT,LIVER,KIDNEY,FAT-COW,PIG, KIDNEY OF PIG FAT .00 .200 .200 .00 . 00 .oo . 00
FAT OF PIG FAT 1. 30 .26 .26 .80 .80 MEAT OF SHEEP FAT .22 .04 .04 .14 . 14 MEAT OF HORSE FAT . 01 .oo . 00 .01 . 01
MEAT OF CALF FAT .04 . 01 .01 .02 .02 LIVER OF CALF FAT .00 .00 .00 .00 .oo
MEAT,LIVER-COCK,CriiCKEN,DUCK,G MEAT OF CHICKEN FAT .82 .200 .200 .16 .16 .51 .51
LIVER OF CHICKEN FAT .01 .00 .00 .01 .01
MEAT OF DUCK FAT .03 . 01 . 01 .02 .02 MEAT OF TURKEY FAT .os .01 .01 .03 .03
MI LK AND MILK PRODUC MILK COW MILK PROD . 00 .008 . 008 .00 . 00 . 00 .00
GOAT MILK PROD . 00 .00 . 00 .00 . 00 SHEEP MILK PROD .oo .00 .00 .00 . 00
MILK PROO 402.00 3.22 3 . 22 9.90 9 .90
MILK PRODUCTS CREAM PROD .00 .008 .008 .00 .00 .00 .00
BUTTER PROO . 00 .oo . 00 . 00 . 00
CHEESE PROD . 00 .00 . 00 . 00 . 00
CURD PROD .00 .0 0 .00 .oo . 00
EGGS AND EGG PRODUCT EGGS WHOLE EGG, CHICKEN PROO 22.21 .000 .050 .00 1.11 .00 3 .42
DUCK EGGS PROO .10 .oo . 01 .00 .02
GOOSE EGGS PROO .10 . 00 . 01 .00 . 02
EGG PRODUCTS EGG YOLK PROD .84 .000 . 050 .00 . 04 .00 .13
PRO TE IN PROD .so .oo .03 . 00 .os

ADI Acceptable Da ily Intake (mg/kg body weight)
Model TMDI pesticides in The Netherlands
Calculation of Theoretical Maximum Daily Intake
Consumption Average consumption (g/person/day) of primary agricultural products derived from Dutch National Food Consumption Survey 1992
MRL Maximum Residu Limit (mg/kg)
TMDI Theoretical Maximum Daily Intake (ug/person/day)
ADI% Percentage (%) of ADI
Calculation including MRLs at Level Of Determination (MRL*)
COMPOUND CHLORFENVINPHOS ADI-waarde .ooos
Productgroup Productsubgroup Product Component Consumption MRL MRL*
GAME AND POOLTRY GAME AND POOLTRY DOVE PROD .10 .000 .oso PHEASANT PROD .10
HARE PROD .06
DEER PROD .10
RABBIT, INCL. OOMESTIC RABBIT PROD .23
PARTRIDGE PROD .10
ROE-DEER PROD .03
WILD DUCK PROD .10
WILD PIG, BOAR PROD .10
FISH PRODUCTS FISH (VARIOUS) EEL PROD .40 . 000 .oso RAY PROD .os
FISH (HERRING-TYPE) HERRING PROD 1.92 .ooo . oso ANCHOVY PROD .00
SARDINES PROD .04
FISH (MACKEREL-TYPE) MACKEREL PROD .4S .000 .oso TUNA PROD .23
FISH (CCD- TYPE) CCD PROD 1.16 .000 .oso POLLACK, LYTHE PROD .89
HADOOCK PROD .06
GURNARD PROD .os
FISH (FLAT FISH TYPE ) FLOUNDER, FLUKE PROD .13 .000 . 050
PLAICE PROD 2.70
TMDI TMDI *
.00 .01
.00 . 01
.00 . 00
. 00 .01
. 00 .01
.00 .01
. 00 . 00
. 00 .01
. oo . 01
. 00 .02
. 00 . 00
. 00 .10
.00 .00
.00 .00
. 00 . 02
. 00 . 01
.00 .06
.00 .04
.00 . 00
.0 0 .00
. 00 . 01
. 00 .13
ADI %
.00
. 00
. 00
.00
.00
.00
.00
.00
.00
. 00
.00
.00
.00
.00
. 00
. 00
.00
.00
.00
.00
. 00
.00
ANNEX 3
Page: 10
Date: 05 - 09- 96
ADI %*
.02
.02
.01
.02
.03
.02
.00
.02
.02
. 06
. 01
. 30
.00
.01
.07
.04
.18
.14
. 01
. 01
. 02
.42

ADI Accepeable Daily Ineake (mg/kg body weighe )
Model TMDI peseicides in The Neeherlands
Calculaeion of Theoreeical Maximum Daily Ineake
Consumpeion : Average consumpeion (g/person/day) of primary agriculeural produces derived from Duech Naeional Food Consumpei on Survey 1992
MRL Maximum Residu Limie (mg/kg)
TMDI Theoreeica l Maximum Daily Ineake (ug/person/day)
ADI% : Perceneage (%) of ADI
Calculaeion including MRLs ae Level Of Deeerminaeion (MRL*)
COMPOUND CHLORFENVINPHOS ADI-waarde .OOOS
Producegroup Producesubgroup Produce Componene Consumpeion MRL MRL* TMDI TMDI* ADI %
ANNEX 3
Page: 11
Daee: OS - 09-96
ADI %•
------ --- ----------- ---------- --- ---------- ------- -------------- --- --- ----- --------------- --------- -- ----- ---- -- ------ ----- --- --------- --------- --------- ---- -----FI SH PRODUCTS FISH (FLAT FISH TYPE ) SOLE PROD .os . 000 .oso .oo .00 .00 .01
LEMON SOLE, LIMANDE PROD .os . 00 . 00 . oo .01
FISH (SALMON-TYPE) SALMON PROD .79 . 000 .oso .00 .04 .00 .12
TROUT PROD .02 .oo .00 .00 .00
FISH (CARP-TYPE) CARP PROD .02 .000 .oso . 00 . 00 . 00 .00
FISH (PERCH-TYPE) PERCH PROD .os . 000 .050 . 00 .00 .00 .01
BREAM PROD .02 . 00 . 00 . 00 . oo
CRUSTACEANS CRAB PROD .02 .000 .050 .00 .00 .00 .00
LOBSTER PROD .01 .00 .oo . 00 . 00
SHRIMPS PROD .47 .oo .02 .00 . 07
MOLLUSCS MUSSEL PROD .26 .000 .050 . 00 .01 .00 . 04
OYSTERS PROD .00 .oo . 00 .00 .00
SPAWN SPAWN PROD .10 .000 . oso .00 . 01 . 00 . 02
FISH LIVER LIVER OF HADDOCK PROD .01 .000 .050 .oo . 00 . 00 .00
OCTOPUS/SQUID OCTOPUS PROD .01 . 000 .050 . 00 . 00 . 00 .00
OTHER ANIMAL PRODUCT MEAT OF REPTILES AND AMPHIBIAN MEAT OF REPTILES AND AMPHIBIANS PROD .10 .000 .oso . 00 . 01 .00 .02
FROG PARTS PROD .10 . 00 . 01 . 00 .02
SNAILS SNAIL PROD .03 . 000 .050 .00 .00 .00 .oo

liDI
Consumption
MRL
TMDI )>J)l'i;
l?roductgroup
Acceptable Daily Intake (mg/kg body weight )
Model TMDI pestic ides in The Net herlands
Calculati on of Theoretical Maximum Daily Intake
Average consumption (g/person/day) of primary agricultural products derived from Dutch National Food Consumption Survey 1992
Maximum Residu Limit (mg/kg )
Theoretical Maximum Daily Int ake (ug/person/day )
Percentage (%) of liDI
Calculation including MRLs at Level Of Determination (MRL*)
COMPOUND
Productsubgroup Product
CHLORFENVINPHOS liDI - waarde . 0005
Component Consumption MRL MRL*
OTHER ANIMAL PRODUCT OTHER ANIMAL OILS AND FATS COD-LIVER OIL
ANI MAL OILS AND FATS
PROD .10 . 000 .050
PROD 2.67
HONEY HONEY PROD .82 .000 .050
TMDI
.00
. 00
.00
***** *** * * ******** * * * * ****** ************** **** **** * **** * ** ******** - --- -----139.49
266 rows selected.
TMDI* liDI %
.01 .00
.13 .00
.04 .00
----- --- - ---------175.49 429.21
ANNEX 3
Page: 12
Date : 05- 09-96
liDI 'è*
.02
.41
.13
-- ----- --539.98