project notes pn-45 - tax foundation
TRANSCRIPT


= FOREWORD
=
The mveri r of the tax burden empW
the question of tEa equity of
_our tax system. One aspect of eg6ty is the relative weight of the burdenon tax;ar ers at different income kyels_ Is the total tax burden distribute din some reasonable relation to income throughout the sale of individualaid fimHy income?
-
The present study provides an up-to-date estimate of the distn -.0
of the tax burden on the basis of selected assumptions, together with abrief discussion of the limitations and significance of tax burden estimates .This estiante is basal on. vaborml averages and cannot be applied dwecdyto any state or locality.
George Bishop, Senior Researcher, has had primary responsibility forthe research and drafting of this study.
Tax Foundation, Inc, a nuns-profit organu bon, is engaged in researchand public education on A aspects of government spending and taxation.Its purpose is to aid in the development of more efficient governmentat less cost to the taxpayer. It also serves as a national informationaCency for organized taxpayer research groups throughout the Country _
Twx FbvxDAnoN, Ixc.May, 1960
Copyright 1960
-by
Tax Foundation, Incorporated
•
s
s
First Pcanting, May 1960Second Printin& March I9Q
_
s
s
s
- -
Permission too note from or reproducematerials from this publication is :ranted
when due acknowledgment is made.
-
nix= tx u.s.e .
TALL
Introduction 4
L Name and Limitations of ::stim tes of the Distrt'bation of the
-Tax Burden 3
IL The Statistical Bases for Tax Burden Estimates
III. Estuaated Distr9m ion of the Tax Burden is 1938 . . . . . 13 -
IV. Staffs anee of Tax Burden Estimates for Tax Pulley 2D
-
- APPENDIXEsilu a
the DistribYtion of Caoswnptioa Fxpe*tditures by Inoons eClass, 1954 21
GLOSSARY 24
BIBLIOGRAPHY 24
LIST OF TABLE STAars
PACs
TAaci
PALL
L Estimated Distc3ation of Federal
rporab'
Income
8 P~oentate Distrn~Otionu of Tu Receipts by Sow
an dTax B~Jen
Consumer
f -of
Units
I
.m Class m
br Iaoome Class. Calendar Year 1938 ISSelected Sbiftiog Assa0960036 1959 7
9 Distribution of Total Laeome by Family Personal Incom e2. Total Tax Receipts by Major Source and Lead of Gar Class, Calendar Yur 1958-
16etnmeat, Caleo& Year i9n 9 10. Taxes as a Percentage of Tat-.. Income, Calendar Year3. Disu%ub"on of Families and Lrea"ached Individuals by
1958 17-------------------------------------------- -Income Gass. Calendar Year 1958 101 Bases for Distnbution of Tax Payments by Income Clue 10
11' Deductions fw Stay and Loral Taxes in Relation t oAd,•rnted Gross Income on Federal IndivWaal Incom e
S. Percentage Distri1mbonS of Basic Series Used m Ws Returns with Itemized Deductions, Calendar Year 1956 18U%uting Tax Payments by Lreoore class 11
12. Net National Product and Total Tax Receipts by Leve l6- Average Tax Barden per Family by Level of Income;
of Government and by Type of Tax, Selected Calenda r1958 13
years 1916-1959 187. 116tr1ation of Tax Receipts by Family Personal income
13. Total Tax Receipts as a Percent of Net National ProductClass, Calendar Year 1938 1;
Selected Calendar Years :1916-1959 19
APPENDIX TABLE S_
PALL
TAIM
PALLAL Adjastment of 1950 After-Tax Income To 1958 DoUars
A2- Family Personal Income Distaution and Estimate dand Saving-Income Ratios for 1950 21
Distribution ~ )f Consumption Expenditures, 1958 23
CHAR T1 . Adjusted Saving-Income Ratios for 1950 by Equivalent
1958 Income Levels 22
_3

- : INTROF,
Xti'ho pays the taxes? How much do people pay i ntaxes? These are perennial questions in the field of taxa-tion and government
This study provides a provisional answer to bot hquestions, but it is primarily concerned with the first. Irthis study the "who" in the question refers to people atdifferent income levels ; in other words, hour does thetotal tax burden on families at different income !evelscompare? The "who" might also be used to refer to geo-graphical areas, states, occupations, or some other break-down . However, this study is confined to an estimate o fthe total tax burden, Federal, state and local, on familie sand unattached individuals by income class and by majo rtype of tax.
Studies of the d istribution of the tax burden by incom eclass have a long history. Perhaps the ea: 'giest of suchstudies in the United States was published in 1937 by theTwentieth Century Fund? Since that time there has beena succession of studies by various authors . An extensivediscussion of the nature and methods of these studiesoccurred in 1951 and 1952 when Professor R . A . :Ilus-grave and Dr. Rufus Tucker debated alternative ap-proaches to the problems of estimating the distribution of
'An analysis of the distribution of the Federal tax burden by stat ecan be found in Tax Foundations Research Aid No. 3, AUocatixgshe Federal Tax Burden Among the States (1957) .2 Mabel Newcomer, "Estimate of the Tax Burden on DifferentIncome Classes," in Studies in Current Tax Problsttts, TheTwentieth Century Fund, New York 1937, pp. I-V-
IUMO N
the tax burden.~ This debate, in particular, produced agood deal of agreement on the nature, limitations andsignificance of such studies.
It is not an easy matter to arrive at statistical esti-mates of how the total tax burden and major taxes ar edistributed Not only are official data in:.dequate forthis purpose, but also to arrive at an answer encom-passing all taxes requires assumptions concerting theincidence of taxation. Individual income taxes fill onthe person on whose income they are levied Sales taxe sfall on the consumer w ho purchases the goods and serv-ices subject to tax. There is little agreement, bowever, onwhere the burden of the corporation income tax falls.Whether this tax is assumed to fall upon the stockholde ror to be shifted forward to conswiers makes a very sub-stantial difference to estimates of the distribution of th etotal tax burden.
In a similar way, problems involved in the definitio nof inco.ae must be solved in some way in order to arriveat estimates of how the tax burden varies in relation toincome at different levels of family income .
The present study, following precedents worked ou tin earlier studies, provides an up-to-date estimate o fthe distribution of the tax burden in 1958 by level ofgovernment and major type of tax. It also extends theseestimates over a wider range of income than has hithertobeen possible.
ISee bibliography below, page k4.
4
. NATURE AND LIMITATIONS OF ESTIMATES OF TH EDISTRIBUTION OF THE TAX BURDEN
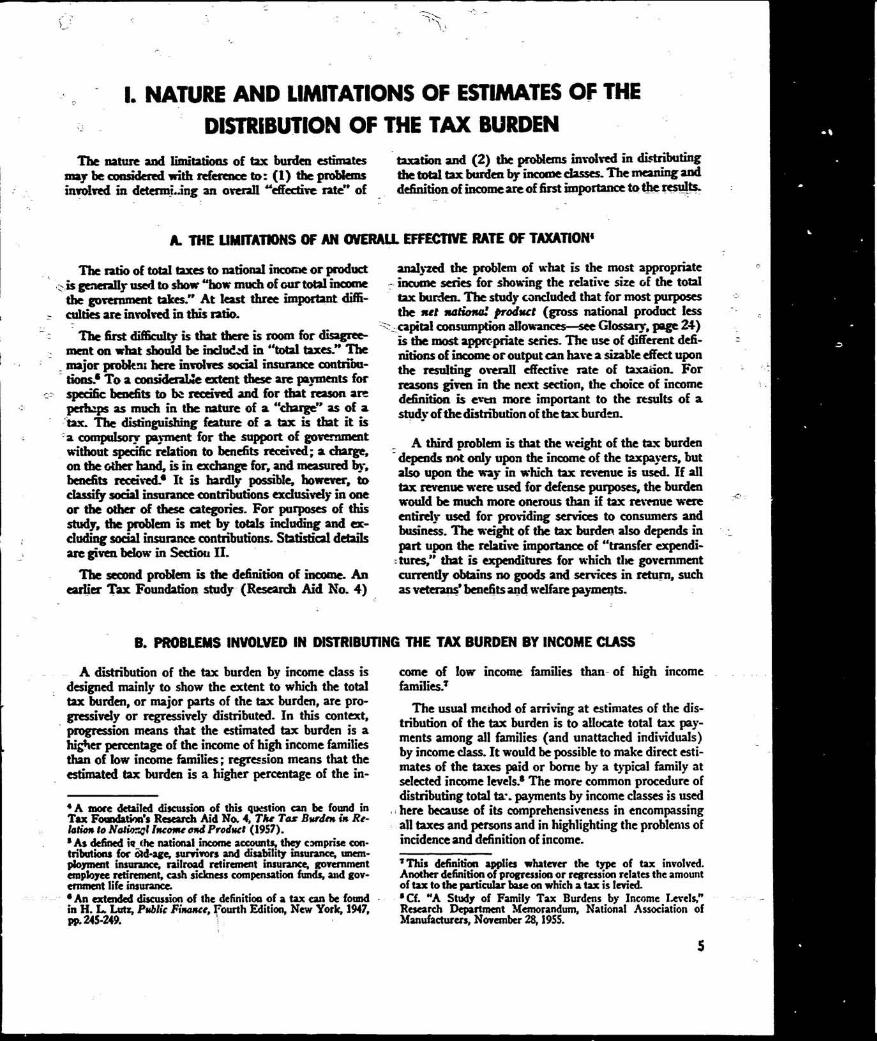
The nature and limitations of tax burden estimates
taxation and (2) the problems involved in di.-tributing
may be considered with reference to : (1) the problems
the total tax burden by income classes . The meaning and
involved in determLing an overall -effective rate" of
definition, of income are of first importance to theresults-
A. THE LIWATIONS OF AN OVERALL EFFECTIVE RATE OF TAXATION "
The ratio of total taxes to national income or produdis gvierally used to show "how much of our total incomethe government takes:" At least three important diffi-culties are involved in this rata.
The first difficulty is that there is room for disagree-ment on what should be includd in "total taxes ." Themajor problem here involves social insurance eontriba-tions.s To a consideraLle cdent these are payments forspecific benefits to be received and for that reason ar eperhaps as muds in the nature of a "charge' as of atax. The distinguishing feature of a tax is that it isa compulsory payment for the support of governnmentwithout specific relation to benefits received ; a charge,on the other hand, is in exchange for, and measured by ,benefits received .' It is hardly possible, however, toclassify social insurance contributions exclusively in oneor the other of these categories. For purposes of thisstudy, the problem is met by totals including and ex-cluding social insurance contributions . Statistical detailsare given below in Sectiou II.
The second problem is the definition of income. Anearlier Tax Foundation study (Research Aid No . 4)
analyzed the problem of what is the most appropriateincome series for showing the relative size of the tota ltax burden. The study concluded that for most purposesthe met xagmd product (gross national product less
,__capital consumption allowances--see Glossary, page 24)is the most appropriate series. The use of different defi-nitions of income or output can have a sizable effect uponthe resulting overall effective rate of taxation . Forreasons given in the next section, the choice of incomedefinition is evert more important to the results of astudy of the distribution of the tax burden.
A third problem is that the weight of the tax burdendepends not only upon the income of the taxpayers, butalso upon the way in which tax revenue is used . If alltax revenue were used for defense purposes, the burde nwould be much more onerous than if tax revenue wereentirely used for providing services to consumers andbusiness. The weight of the tax burden also depends inpart upon the relative importance of "transfer expendi-cures," that is expenditures for which the governmen tcurrently obtains no goods and services in return, suchas veterans' benefits and welfare payments .
8. MBLEMS INVOLVED IN DISTRIBUTING THE TAX BURDEN BY INCOME CLAS S
A distribution of the tax burden by income class i sdesigned mainly to show the extent to which the tota ltax burden, or major parts of the tax burden, are pro-gressively or regressively distributed. In this content,progression means that the estimated tax burden is ahigher percentage of the income of high income familie sthan of low income families ; regression means that theestimated tax burden is a higher percentage of the in -
4 A more detailed discussion of this question an be found i nTax FocmdatiorCs Research Aid Na 4, The Tax Burden in Re-lation to National Income and Product (1957) .+ As defined ie (he national income accounts, they comprise con-tributions for aid-age; survivors and disability insurance, unem-ployment insurance, railroad retirement insurance, governmentemployee retirement, ash sickness compensation funds, and gov-ernment life insurance-4An extended discussion of the definition of a tax an be foundin H. L. Lutz, Public Finance, Fourth Edition, New York, 1947,W 24S-249
come of low intone families than- of high incomefamilies?
The usual method of arriving at estimates of the dis-tribution of the tax burden is to allocate total tax pay-ments among all families (and unattached individuals )by income class. It would be possible to make direct esti -mates of the taxes paid or borne by a typical family atselected income levels" The more common procedure o fdistributing total ter- . payments by income classes is usedhere because of its comprehensiveness in encompassingall taxes and persons and in highlighting the problems o fincidence and definition of income.
7 This definition applies whatever the type of tax involved.Another definition of progression or regression relates the amountof tax to the particular base on which a tax is levied .
- ' Cf. "A Study of Family Tax Burdens by Income Levels,"
-Research Department ?Memorandum, National Association o fManufacturers, November 28,1955 .
5
- f:
But whatever methods are used, the estimation of th edistribution of the total tax burden involves two majo rproblems : (1) the definition of income and (2) the do-termination of the incidence of carious kinds of taxes .
AvatlaWe distributions of the population by incomeclasses are necessarily based on retatn ely narrow income
r> co-teepts. The major sources of information on the dis-trioution of families by size of income are : (1) data fromincome tax returns which are dependent upon the defi-nition of income reportable for tax purposes, (2) data"from household surveys which use a definition of "mone yincome", (3) data from the national income atxourtts,based in part on both the two previous types of data ,showing the distribution of families and "personal in-corue" by personal income classes'
The total money income (or income reportable for taxpurposes) of families and individuals is an appropriatebase with which to compare the direct tasea paid by`families out of this money income, chiefly income taxe sand property taxes on owner-occupied houses. However,its usefulness is very limited in examining the burden ofindirect or hidden taxes- Particularly in the case of thecorporation income tax, the tax may be presumed to fal lin part on income not received by individuals. In so faras the tax reduces dividends paid and retained corpo-rate profits, the burden falls on a part of income not in-cluded in either "money income" or "personal income."If, therefore, the burden of all of these taxes is to be im-puted to individuals, the income on which these taxesmay fall must also be imputed to individuals .
A similar problem is presented by indirect busines staxes-i0 It would appear from the point of view of theindividual that any taxes included in the price of thegoods and services he buys he must pay for out of hisown disposable income. This is another way of sayingthat the burden of these taxes is shifted to the consumer.However, it is quite possible that the burden of thesetaxes falls on "factor payments," that is, that they serveto reduce the payments made for productive service s(traditionally classified as services of labor, land, andcapital) . The various kinds of taxes levied on or collecte d
I "Money income" excludes various kinds of nomnoney income,such as wages in kind, food and fuel produced and consumed byfarm families, imputed net rental income from owner-occupie ddwellings, and imputed interest on bank deposits, which are in-cluded in "personal income." The latter is one of the major con-cepts in the national income and product accounts. An analysis ofthe differences among these and other income concepts can b efound in An Appraisal of the 1950 Ceww Income Data, Studiesin Income and Wealth, XXIII, (National Bureau of Economi cResearch, New York, 1958), Part I . See also Federal Reserv eBullet n, September 1958, pp. 1044-1046,u Indirect business taxes, as defined in the national income ac -counts, include sales and excise taxes, property taxes, and miscel-laneous business taxes. Since home ownership is classified as abusiness in the national income accamts, indirect business taxe sinclude property taxes on home owners . More generally, indirectbusiness taxes are defined as "taxes (other than social insuranc econtributions) that are chargeable to current cost by busines senterprises" (U. S. Department of Commerce, National Income1954, R 55) .
from business represent a prior claim on a firm's grossreceipts, and this claim must be met before funds can be =-considered as mailable for payment for materials and
_
services In the long rtra a tax on a competitive: industrymust be shifted forward as firms whi&. canmt sorer allcosts are eliminated ; but where there are Sar.iers to themobility of eeoaomic resources, a part of the burden mayfall upon the owners of productive :Arvices. If accoun tis taken of the total effects of economy-wide taxes, i tbecomes very difficult to determine tax-incidence_
From the point of view of the economy as a whole, th eassumption that indirect business taxes serve to raiseprices to consumers by a corresponding amount leads tocertain logical .nconsistenaes.11 The major question, sofar as the present study is concerned, is whether the totaloutput of the economy ought to be valued at "mar'.tetprices," i.e, at prices which include ali indirect busines staxes. No attempt is made here to analyse this problan.However, the current practice of the United States De-partment of Commerce is to value output at "marke tprices" and that practice is accepted here"
But if that practice is accepted as reasonable; it followsthat the total tax burden must be compared with the totalvalue of output at "market prices," for with all the un-cert dirties of determining tax incidence, it is impossibleto designate what parts of income or output the taxburden "comes out of." It would be going too far to clai mthat the full tax burden falls exclusively on income actu-ally received by individuals, and to measure the burdenof total taxes against income actually received disregard-ing income produced but not paid out to individuals . Andthere are several very sizable parts of total national out-put to which there are no corresponding payments to
- individuals.
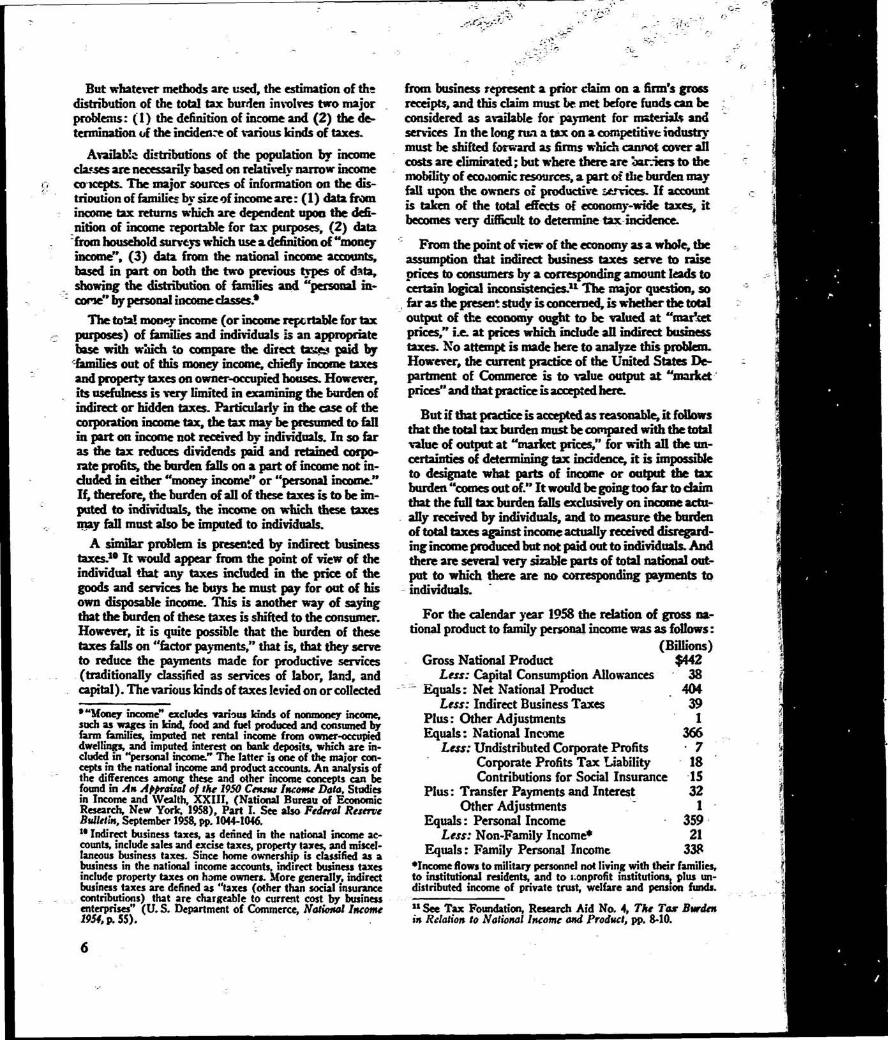
For the calendar year 1958 the relation of gross na-tional product to family personal income was as follows :
(Billions )Gross National Product $442
Less: Capital Consumption Allotrances 38Equals : Net National Product 404
Less: Indirect Business Taxes 39Plus : Other Adjustments 1Equals : National Income 366
Less: Undistributed Corporate Profits 7Corporate Profits Tax Liability 18Contributions for Social Insurance -15
Plus: Transfer Payments and Interest 32Other Adjustments
- 1Equals : Personal Income 359 -
Less : Non-Family Income* 2 1Equals : Family Personal Income 33R
•Income flows to military personnel not living with their families ,to institutional residents, and to ::onprofit institutions, plus un-distributed income of private trust, welfare and pension funds .
n See Tax Foundation, Research Aid No. 4, The Tarr Bwdenin Relation to National Income and Product, pp. 8-10.
6

Table i_ _, :Ir1l1TE0 DISTRIBUTION OF FEDERAL CORPORATION INCOME TAX BURDE N
-
ON CONSUMER UNITS- BY INCOiIIE CLASSESON SELECTED SHIFTING ASSUMPTIONS
Calendar Year 1958
Allocation Gases Percentage of Allocated Corporation Tax to Total Income •Han of Tax One-Third of TaxTotal Tax Allocated on Allocated a n
Adopted an Total Tax Consumption consumption= F.naM Perso++a :
Consrrnptvsnincome Cbssss
-xxpendrtu+es`
Dlvidendsd Consumptgr'MS
Allocated onDividendExpenditurz : Expenditures
(Thousands)
(Percentage DistritK tio_-) Oisetrout Distribirti-n Dividends on DividendsUnder $ 2
4.0
.9 62 1.4 3.8 3.0= 2 Under
4
-
13.2
-=
3.6 5.0 1 .4 3.2 2.64 Udder
6
224
5 .3 4.8 1 .1 3.0 2.46 Under
8
= 202
&a 4.6 1 .3 =
3.0 2.48 Under
10 =
13.3
4.8 4.5 1 .6 3.0 2.610 Under
15
142
10.5 4.1 3.0 3 .6 3.415 and aver
12.8
692 2.8 14.8 8.8 10.8Total
100.0
100.0 4.3 4.3 4.3 4.3
• Fanmiies and unattached 4swiduals .•
- aonppt ~ to Net National Product (see TaWe 9. Wow).Mderivation of lhis distribution see Appendixe Distrloution of dMdends on tax returns for 1957 ._
S--- Based on Tables 5. 7. and 9. below
The net difference between gross national product andpersonal income in 1958 was $83 billion, and there is noway of determining to what extent the tax burden mayfall upon the parts of national output included here. In -deed, taxes have a larger immediate claim on these part sof national output than on income paid to individuals(personal income'= ) . Thus in 1958 the total of taxclaims on parts of output not represented in personal in -come amounted to $72 billion while the total of "personaltaxes" came to $40 billion .
The major items of output or "product" involved ar ecapital consumption allowances (which consist in larg epart of corporation depreciation allowances), indirectbusiness taxes, corporate profits taxes, undistributedcorporate profits and contributions for social insurance .-These items may all be regarded as parts of total nationa lincome and product that are disposed of through variou sforms of collective action without first becoming a partof the income of individuals. But since the tax burdenmay fall in part on such income, that income must be im-pated to individuals if the total tax burden is also to beimputed to individuals .
The tax burden might be compared with gross nationa lproduct or net national product. The gross and ret hererefer to total product before and after deduction of capitalconsumption allowances . In Tax Foundation's study,The Tax Burden in Relation to National Income and
f ° As now defined in the national income accounts, "personalincome includes a substantial amount of income in kind an dimputed income-but 4 is the closest national income concept t oincome payments to individuals (a term formerly used in th enational income accnints) .
Product, it was argued that while in wartime periodsthe tax burden might fall in part on capital consumptionallowances, in peacetime it would not make sense to de-sign policies that would divert resources from maintain-ing private capital equipment to general governmen tuses . For this and other reasons it was concluded thatit is more appropriate to relate the tax burden to netnational product than to gross national product .
The questions of the incidence of various taxes andthe imputation of income have an important effect no tonly upon the measurement of an overall effective rateof taxation but also upon the distribution of the taxburden by income classes. Of major importance is th eincidence of the corporation income tax . The burden o fthe corporation income tax may be assumed to be born ein varying proportions by stockholders and consumers .Table 1 shows the effects upon the distribution of theburden of this tax of varying assumptions as to incidence .Four different shifting assumptions are used : (1) thatthe tax falls entirely on consumers, (2) that the tax fall sentirely on stockholders, (3) that half of the tax falls onconsumers and half on stockholders, and (4) that one -third of the tax falls on consumers and two-thirds o nstockholders. Since consumption expenditures are neces-sarily "regressively" distributed, the corporation ta xwhen distributed on this basis, is regressively distributed .Since dividends are "progressively" distributed, the cor-poration tax when distributed on this basis, is progres-sively distributed. A half and half distribution makes th eburden of the corporation tax appear to be approximatelyproportional up to the $10,000 income level and progres-sive above that level . In addition to the possibilities show nin this table it is also possible, as noted above, that par t

of the burden of the corporation tax is shifted "back profits taxi-s assumed to fall on shareholders substantiall yJ
wards" to employees . raises the total income of top income classes and thereb ylowers the effective rate of tax as compared with esti-
The estimates of the distribution of the tax burden are mates which do not allocate these forms of income to
_
rsimilarly affected by assumptions concerning the inci- individuals. The apparent progressivity of the tax bur-
> <
dence of excise, property and other taxes . However, the den estimates thus is notably affected .
combined studies of R A . "Musgrave and R S. Tucker In revising Federal state, and local tax systems, th ehave shown that reasonable variations in the shifting as- degree of progressivity or regressivity in particular taxe ssumptions have a relatively small effect upon the result- or in a tax system as a whole is only one of many con -ing distribution of total tax payments by income classes ;13 siderations that must enter into tax policy. It is one o fon the other hand, various alternatives that have been the major aspects of the equity of the tax system, butused in the definition and allocation of income substan- other criteria necessarily enter into the determination oftially affect the apparent degree of progressiyity in the a "good" tax system. These include adequacy, diversity,tax burden . In particular the allocation to individual- of ease of administration and compliance, and avoidance ofretained corporate profits and the share of corporate distorting economic effects.'*
_
1'"Further Consideration of the Distribution of the Tax Burden," 1+ A discussion of these criteria can be found in most textboAmNatioaat Tax Jownd, March 19A P.?2
Fr
on public finances
_
-
-
3
,'ter
7
S
-
_
L

III. THE .--STATISTICAL BASES +OR TAX BURDEN ESTIMATES
_ " The statistics available for tax burden estimates may size of income, and (3) data on selected economic serie sbe divided into three groups : (1) data on taxes paid, (2) ; that can be used:for distributing tax payments by incom edata. fin ; the distnbution of families and individnals by -
classes.
-
DATA ON TAX PAYMENTS _
' -
-
-
J
The armor source of data on government is the U. S. _ rately, not only because they are distributed on a separate
cCensus Bureau. The Census Bureau publishes fiscal year `basis, but also beGn_t_ they should be distinguished fromdata on tax; revenue of all governments. However, for other taxes which are generally not earmarked but are . : —=' -
,,-, = purposes of the present: study, the calendar year series 'used for the general purposes of government .
_pent receipts published brthe National Income
==A the Department of -Commerce for the pur-J
! Table 2
= -r `- poses of the nations) income accounts is preferable . It is _ .
preferable, first, because it is somewhat more up-ta-date TOTAL TAX RECEIPTS
=_
(though the data are preliminary) and, secondly, because U
BY , UAM SOURCE AND LEVEL OF CINFERNYEMP =the data on the d istribution of families are also on a cal- -
Calendair Year 195B
-endar year basis arc) come from the national income (MWions)
accounts. In additions the various economic series used sou
ant
vto distribute tax payments by income classes are on_a
TOTAL TAXES, Exduding Social Insurance
` s 95.654-
calendar year _basis . = TOTAL TAXES, Including Sociatklnsumnw _
110.775
Tax payments (equal "receipts") for the calendarFederal Taxes:
Individual Income
,299year 1958 are shown in Table 2. This table gives a break- Income
-
1 177.32 1down bY type of tax and level of government to show Excises and Customs
11,222
_the various parts of the total tax burden that, in this Estate and Giftstudy, are distributed on separate bases. Total. Excluding Social Insurance
65,192, '%Social tnsurawe
-
-_
_
12,468=Data for the calendar year 1958 are the latest available . OAST and Unemployment
They are used despite the fad that the recession of 1958 Empktyer CoatriQrtionsmade tax payments somewhat lower than they otherwise Employee Contributions
4.303
- --
would have been . It should be noted also that corporation Outer
=
= 2,648
-and business tax payments as shown in Table 2 are on a Total. Including Social-Insurance
77,660
liability basis — that is they indicate what was owed on State and Local Taxes:
incomes and transactions of 1958 rather than what wasIndividual Income
1,895
--Corporation Income
863actually paid in 1958. There is a lag of about one-quarter Excises and Sales
13.353of a year in excise tax collections and of roughly half a
--Estate and Gift
-
367year in corporation income tax collections. There is also Property
+3,984some lag in individual income tax collections which is Total, Excluding Social insurance
'30,462part of the difference between collections on a fiscal year Social insurance
2.653basis and tax receipts on a calendar year basis as shown Total, Including Social Insurance
33,!15 `in Table 2. a Total sowmmem nui s less nontax receipts as 'shown 3n ttt o
nations) income and product accounts.Table 2 also shows, social insurance contributions sepa- Source : Department of Commerce.
-
-
B. DATA ON DISTRIBUTION OF FAMILIES BY INCOME CLASS
- -
` ` '
Table 3 shows the distribution of families and un- Other studies of the distribution of the tax burden hav eattached individuals by income class in 1958 . These data used other distributions of families by income class ,have been developed by the U. S . Department of Com- particularly that shown by the Federal Reserve Board'smerce as a part of the national income and products Survey of Consumer Finances. The latter has not been
°°-
-accounts. It is by these personal income classes that -the used here for several reasons. First, it is based on moneytax burden is distributed in the present study . incomes, whereas the Department of Commerce data
9

Table 3
dudes income in kind and certain imputed xeome in_
--- addition to money income. Thus in 1958 total money' OF FAMILIES I
_- =
DISTPtB NDIVI U S B N AND LASSUNATTACHED
income as indicated by the Federal Reserve Board 's-
ND1Y1DA1 BY INCOME CLASS
Sur-vey of Consumer Expenditures amounted to M3 bil-
Calendar Ywr 1958
lion,"' while total family personal income amounted t3 -= Fsmi y Pi. ;c ut
= 'nua+b.rot famltks
$W bullion, -
-
-u,00m•
cnd unattached
Pate l- _
_
Class
tneiridus
oistdbuLOn -_-
-Secondly, the Depattment of Commerce data shorn th e
I
Ceder j 2.000
-
1 .6
_ 14
income classes $10,000 to $15,000, and ever 513,000 ,- =
j 2.000 — 3.999
- -=v - 121
22
while the top income class in the Federa! Reserve Board4.000 — 5.999 J
_
13.6
25 surrey is $10,000 and over. -
-7.999
22
17
=
-
-
-8,000 — : 9.999
5.0
= °
-;0.000—14.999
_4.3
8
Thirdly, it is appropriate to use :. distribution of
15,000 andover
-
25
=
5
families by income class from the sari, basic source a s
Tofa:
-
54.3
=
1►JO
the tax payment data, rather than to annnipt to combine =-
= data from two very diEzrent kinds of sources . _Sxeru= Oepertma+t of _Conwnem .
-
_
~-~
Is Man i kww for 1958, 115,150. multiplied by the number of_show
4personal income and persona: income classes. Per
spnodiaa Waits, 56.8 million . (FiderdI Ruemt Bxlit7u , jar
-
'sonal income is a:more broadly defined series whi& in
1959, M 710,711)
-
-
`.
C. SELECTION OF ECON61h11C SERIES FOR USE -1N DISMEUTING
_THE-TAX BURDEN - BY INCOME ClJ4SS
= The tax payments shorn in Table 2 are distributed
involves two problems. The first is to select an a '?propnamong the income classes shown in Table 3 in accord
1° ate assumption concerning the incidence of each major
_ante with the distribution al various bases as-shovrn,ia
t)pe of tax. The second is to select an appropriate eco-Tables # and S.
=
nomic series, which can be distributed by income classes,
= - .-
-
to-he used for distributing each type of tax ir=accordanc eThe .selection of aA4xationr vases shown in Table 4
with its assumed incidencz.
Table4
=4 _ -
V
BASES FOR DISTRIBUTION OF TAX PAYMENTS BY INCOME CLAS SType of Tax
- FederalIndividual Income-
_
Federal personal income tax IiabiliC7 derived from Department M Commerce data
=on distribution of personal income -
Corporation Intone
`-
-
-One-halt on basis of distribution of ditzdends as shown in Statistics of Incom efor 1957; one-half on basis of distribution of consumption-expenditures
_
= Excises and Customs:
=_ -
Consumption expenditures
Estate and Gift
Assumedjo fall entire y on families with income.. ever j1a,000
_
Social Insuranc eI
-
OAST and Unemployment
uEmrloyer Contributions
Consuinpt;ofi expendruesi
-
Employee Contributions
—
Wages and salaries cover*d by payroll ta xOther Taxes and Contributions'
i'~ages and salaries
F•
y ,
State and Loca lIndividual Income
Wisconsin imwme tee distributk n (1954) -
-
` `Corporation Income
Same as Federal Corporation Income TaxExcises arts Sales
Consumption expendituresEstate and Gift
Assumed to fall entirely on families with incomes over $15,000
=Property
One-half on basis oUconsumption_ exy iditures; ..anefial!_on basis 'ef housing
-exDendihites
-.:Social Insurance
Wages and salaries
-
Without adjustment for differences between tax returns and family units a"d between :mama concerts.
_Inciudas employer and •mpioyea contributions for railroad retirement, railroad uneKployment Insurnme, Federal , civilian Mirerient, an d
`
aovernrnent lie insurance. "
10
J
t_

c
.~
Table 5PERCENTAeE 0MrR%UTW4$- W BASIC SEWS USED IN DISTRIBUTING TAX PAVti1ENTS BY INCOME CLAS S
- Family Personal Irona Class`
$15.000tir7ar
52.004- -
SCOW-
56.000-
36A00-
5'0.000-
an dtai
3.999
5-e99
7 .949
9.999
24.999
over
Total(:) Personal IncomETax,Litality %
1957(FCderai)
.6%
58%
13.7%
-16.8%
11"% '
15.0%
37.3%
100.0%
-
-(2) Di W%nds
.9
-36
53 5.8
- 4-8
10.5
692
100.0(3) Consumption EM)endiLlres - ;'
= 4.0
-
132
~- 224 % 202
133
14.2
in
100.0c,
(4) Wages Coveted by""COYTax %4,2W r , &%Vx.turpj
'73
- 244 -
34.E -J
18.9 . =
&1
4.8
22
100.0(5) Wages aW 5akou on 1soA- .tMble andTAI Vo R-bow.
53
17:4
2&.6 21.6
11J
8.6
6.8
100. 0(6) Wisconsin Ird'rAdw] tntgae
JTax (19"
"
2.8
18.5
23.5 9.5
5.4
9.9
30.3
100.0-
L7)_" dies for Forte
_Operatic!l and Imptovernent
53-
16.7
25.5 19.8
11 .4
9.5
11 .7
100.0_ -
(8) Famity Prsr w rA Itrcome
3
11
20 19
- 13
15
19
100.0(9) Families aria Up attached
Individtsr
14
22
25 17
9
8
5
100.0SenrcK (1) Dwhmw it" 2wom of Cunwrt BeslnoM April 1959, p= 16 (See text Pegg 11): (2) Dividends after exclusions of taxable returns derivedfrom ataWBSca at
n. IndividumL 1957. P. 23. No allowance was made for differences i nriw
definition of inc. (See text pale 11). C) Estimatedbhyy Tax FsunJ± o6 !nom data in Sorvey of Currant Business, April 1959 .
11 . 16 and " Who Saves?'
Friend and
(Sec ppeedix-p. 21)-(4)
t~ ^,errred
tlafiesand
from number of taxable and nontaxable returns in St
of income, Individu4 1957.
. ((6) Taxes assessed in 195 4r, .
Under the +.ssror sin individual income tax, Research
v , - !o the 1957 Wisconsin Legislature. Committee on Revenue Sources . 1957- Volume H._ gg 165; 40) Coeived from Ufa Study of Convertor Expenditures, a 09 using daft from the Survey of Currant Business, April 1959, p . 11 and- :=alesesYts N tttosenel. 1957, P. 9. (See text page 12): (6) and l9) Survey of Current Bosinws, April 1959. p. 11.
_
The individual income tax presents no difficulty . This tributed by the distribution of dividends by incom e_tax can be assumed to fall upon the individual taxpayer, classes as shown in Statistics of Income (Internal Rev-and FArral individual income tax receipts accordingly enue Smice) . No allowance was made for differences
-, Imy be distributed among income classes in accordance in the percentage distribution of dividends that mightwith the distribution of Federal income tax liability result from the difference between the definition of in -which is also shown by the Department of Commerce come for tax purposes and personal income ;'-- nor was
-
analysis of the distribution of personal income (Survey allowance made for differences between the definitionof Current Business, April 1959, p. 16) . of the tax return population and families and individual s
- -
The corporation income tax, as already noted, pre- shown by the Department of Commerce.
_-
--sorts the viost significant question of tax incidence . In Sales, excise taxes and customs duties are assume d-the absence of general agreement on the incidence of this to fall on the consumer and so were distributed in accord-_
tax es it is assumed here that half of the corporation in- ance with the distribution of consumption expenditures .come tax burden is shifted forward to consumers andaccordingly is distributed in accordance with the distri- Estate, gift and inheritance taxes are assumed to fal lbutton of consumption expenditures by income classes . entirely upon people with incemes of over X15,000 .There are unfortunately no recent official data on thedistribution of consumption expenditures by income State income taxes are distributed in accordance wit hclasses . For tLe purpose of the present study the distri- a distribution of Wisconsin incomes taxes,18 which is
_
button of consumption expenditures was estimated on the assumed to be typical, for purposes o this study, of th ebasis of the Bureau of Labor Statisdcs-Wharton study distribution of all state income taxes. This appeared toof consumer finances for 1950. Details of the method of be the best basis available for distributing state incom e
-
estimation are given in the Appendix . taxes.
One-half of the corporation income tax burden is as- Property taxes are distributed one-half on the basis. stoned to fall on stockholders and was accordingly dis- of the distribution of consumption expenditures, an d
u Recent analyses of the incidence of the corporation income tax ~t This meats that no allowance was made for nonreporting ofcan be found in A . C. Harberger, "The Corporation 1,1„ome Tax dividend income The distribution of dividends in Statistics ofAn Empirical Appraisal," Tax Revision Compendium, Com- I>uo>nt is also affected by splitting of family income (Cf . Rufus~1 ddltml of Papas on Broadening the Tax Base, Committee oniNays and Mans, U. S. House of Representatives, November
S. Tucker
Dist: ibuticns of Tax Burdens in 1948. Notional Taxlowntal, gepember, 1951, note p. 284) .
•1959, pp. 231-250, and P. G. Darling, "Income Taxation and 1s Committee on Revenue Sources, Rarearch Report to the 1957Dividend Income,",fi4, pp. 1579,1590.
i ;
,Wisconsin Legislature, Volume II p.165 .


Ill. ESTIMATED DISTRIBUTION OF THE TAX BURDEN IN 195 8
Total tax payments (equal tax receipts) distnbmtedby imoome classes are shown in Table 7 . The percentagedistribution of tax payments are shown in Table 8, an d
_ ayert-te tax-burden per fam illy is sln in Table 6. Thefinal step is to relate tax payments so distrilated to totalincome by iaoorne class. Family personal income as indi-cated about, is too narrow a base with which to com-pare total taxes- In order to avoid overstatement of"effective rates," total taxes are related here to a totaliaaoeime concept corresponding to net national product . I twas therefore necessary to allocate by income lass th eVarious amounts of income not included in hunily per-sonal income. These allocations are shown in Table 9The bases of allocation used are as follows =
Distribution of social in-surance coutriketioosas estimated for thedistribution of tax pawmints
Corporate profits taxes
Undistributed corporatepests
Indirect business taxes
Other
Distribution of familypersonal income
No allowance was made for shifting of families amorgincome classes as a result of these allocations of adeu-tiotal Iands of income in the distribution of fainuy per-sonal income. A comparison of the percentage distribu-tions o= the total ilaofetc (corresponding to net nationa lproduct) au: of family personal income shouts that thereis very little difference between these distributions.
Table 10 shows the resulting incidence of total taxes-'as a percentage of total income by income classes . Thepetcentages indicate that the total tax burden excludingsocial insurance is almost exactly proportional to incomeup to the income level of at least $15,000 . The differences
1 ` as between the income classes under $15,000 are toosmall to be significant in view of the nature of theseestimates. The total tax burden including social insurancedrops off rather noticeably from 28.3 percent for familieswith incomes under $2,000 to 24 percent for families
with income from $10,000 to $15OOU. This drop reBatsthe regressive distti1ntion of -;*cW insurance Uxeswhich, as a percentage of incoa , fall hout 7.4 percentfor fammil with incomes under $2,000 to 14 perioettfor families with incomes of $13,000 and over. In 1958old age and survivors insurance (OASI) taxes appliedonly to the first $4,20 of income.
The tots: Federal tax burden, refieexing the impor-taaoe of the individual and corporation income taxes ,shows a rather progressive distribution. The total burdenrises from 9.6 peroe nt for families with incomes wader$2,000 to 28.6 pemeit for lam it with incomes of$I5.OW and over. On the other hand, the total state an dlocal tax burden falls from 11 .3 percent for famil withmmmts under 5 ,000 to 59 percent for fundies withitnaoanes of $15A00 and over- The estianLrs for state an dlocal taxes are largely dependent upon the estimate of th edistribution of consumes expenditures by mcomme classe s(see Appendix) . The major part of these taxes is ac -counted for by excise and sales taxes and by propertytaxes
Roughly half of property tax levies comes from busi-ness as distinguished from home owms .P' The distribu-tion of the pwpeny tax burden on homeowners is con-sequently considerably different from the distribution ofthe total property tax burden. Table 11 gives a better
"C£ R A. Mw rave. The Indiltu a of the Tax Strocaae andIts E$edsan Cmwmptioo."in Ftiena[ Tar Pettey for Econessie
Belm a the Sabcommium awan Tax P cy byP*=&U
AEmoomc Report, titth Congress, Ist Session, November 9 1435,P.113 .
Table 6
AVERAGE TAX BURDEN PER FAMILYBY LEV& OF RlCOME
1958
AVWW Tax awden Per FunnytnaonfePer Famiep► Total Federal stolesad Local
S I .4.d S
412 S 229 S 1833,751 986 595 3915,934 1.535 972 5638.160 2.097 1.407 690
10,250 2,454 1 .656 79B13.868 3,332 2.382 95032,284 11 .576 9.615 1,961
• kmkw s social k"Wance taxes.*Total bwoma cocromma6m b net national product (See Table WIncome figwss ors sreraps lot income classes shown m Tanta 7 .Source: Tables 3 aed 7.
Tlfr of"Is"Sle
Social insurance contri-_bntncns
Boor ofdttacsfim
Of dividendsand consumption ex-penditures (Same asfor distribution oftaxes )
Distribution of dividends
Distribution of consump-tion eicperiditures
13

A
L.,
Table 7OISUIWUTION OF TAX MMM 8Y FAMILY I11211180NAL INOOML CLASS
@Mwwlar Year 195(MMIM)
Family Pomnal Insome Close
' Undv
KNOW
(4,000•
$61000•
0,000-
1{01 000-
111,000source
12,000
3,111
/,fN
70111
04x/1
Alex"
and Qvw
Tha i
I ,
vwq.
vrY%Uw, Mr1YY111S W~=1 II/ .YIw11Yt VallaaV i,f-VU ii0,W7 i&wIA4w W&WOUra ip+f,NO9 iogr1ff0 i'w,Q"TOTAL TAXES, Including Social Insurance 3,132 11,935 20,873 18,297 32,270 14,329 28,940 110,77 5
Federal Taxes: 1
Individual Income 201 2,040 ON 5,937 3,837 5,288 13,1" 35,299Corporation Income 421 1,453 2,394 2,248 1,563 2,140 7,103 17,32 1Excises and Customs 444 1,478 2,508 2,261 1,490 1,598 3,442 11,222Estate and Gift - - -- -- - - 1,350 1,350
Total, Excluding Social Insurance 1,066 4,971 9,738 10,446 6,890 90026 23,054 65,192Social Insurance 673 2,227 3,480 2,490 1,3P0 1,218 063 12,46 8
Total, Including Social Insurance 1,739 7,198 13,218 12,945 8,280 10,244 24,037 77,660State and Local Texas:
Individual Income 54 351 446 180 103 188 573 3,895Corporation Income 21 73 119 312 78 106 353 863Excisae and Sales 529 1 1 759 2,964 2,691 1,773 1 1901 3 1716 13,353Estate and Olft - -- - -- -- - 367 367Properly 618 0̂ 091 3,347 21796 1,727 3 1 663 . 1,713 13,984
Total, Excluding Social Insurance 1,252 4,274 6,896 51779 3,681 3,858 4,722 30,462Social Insurance 141 463 759 573 309 227 161 2,663
Total, Including Social Insurance 1,393 4,737 7,655 6,352 3,900 4,085 4,903 33,115
Source: Tax recelp" hem Table 2 distributed on bes« ehwm In Tables 4 and 1 . r

0"cn
TAW II
} MtCLNTAOi OWMBUTMI OF TAX RIICRIl r 1'8My 8ouna and by Income Class
Calendar Year 1918
Family Personal Infeffif close
source $ 000 ~i~1M O~fff 11:fff ~~~~N ~I I~fM iM Dwr TotalTOTAL TAXES, Excluding Social Insurance 2.4% 9.7% 17.4% 17.0% 11 .1% 13 .5% 29.0% 100.0%TOTAL TAXES, Including Social Insurance 2.8 10.8 18.8 17.4 11 .1 12 .9 26.1 100. 0
',
federal Taxes.Individual Income .6 5.8 13 .7 16.6 1019 18.0 37.3 100. 0Corporation Income 2.4 8.4 13 .8 13 .0 9 .0 12.4 41 .0 1001 0Excises and Customs 4.0 13 .2 22 .3 20 .1 13.3 14.2 12.8 100. 0Estate and Gift - - -• -- - - 100.0 1001 0
Total, Excluding Social Insurance 1 .6 7 .6 14.9 16.0 1016 13 .8 35.4 100 . 0Social Insurance 5 .4 1719 27.9 20 .0 11 .1 9.8 7.9 1001 0
Total, Including Social Insurance 2.2 9 .3 17.0 16 .7 10 .7 13 .2 31 .0 100. 0State and Local Taxes :
Individual Income 2.8 18 .5 23 .5 915 5 .4 9 .9 30.2 100 . 0Corporation Income 2.4 8 .5 13.8 13 .0 9.0 42 .3 40 .9 100 .0Excises and Sales 4 .0 13 .2 22 .3 20 .2 •13 .3 14.2 14.2 100.0Estate and Gift -- -- - - . .. 100.0 100.0Property 4 .6 15 .0 23.9 20.0 12 .3 1119 12 .2 100 .0
Total, Excluding Social Insurance 4.1 14 .0 22.6 19.0 12 .1 12 .7 15 .5 10^,0Social Insurance 5.3 17.5 28 .6 21 .6 11 .6 8 .6 6 .8 100.0
Total, Including Social Insurance 4.2 14.3 23 .1 19.2 12 .0 12 .3 14 .8 100.0
sauna : Table 7 .
I ,
I .

. 1
V`
i
Table 9'DISTRIBUTION OF TOTAL INCOME BY FAMILY KnSONAL INCOME CLAIM
Calendar Year 1958
Family p ersonal Income Clas s
unde rSource
$2,00012,000-
11,1$1114,000 •8,1"
181 000-7 1 1109
1411 000-0 1 "11
110,000 »14,1"
$11,000and ever Total
» » so.UU Mw Millions uu uo.«..w 00 .... .... ......
Family Income
Z 8,500 $37,100 $67,400 =63 1 900 ;44,200 $51,900 $65,000 $338,000
Plus:Social Insurance Contributions
915 2,564 4,378 3,065 1,614 1 1 186 1,099 15,12 1Undistributed Corporate °rofits
59 234 344 378 311 682 4,504 6,51 2Corporate Profits Taxes
442 1,525 2,513 21 360 1,641 2,247 7,456 18,184Indirect Business Taxes'
1,473 4,899 8,313 7,495 4,940 5,297 4,780 37,19 6
Less: Net of Other Differences i, etween FamilyPersonal incomeand Net National Product"
336 1,233 2,242 2,130 1,457 1,681 2,130 11,206TOTAL INCOME'
11,053 . 45,389 80,706 751068 51,249 69,631 $0,709 403,805i
1» ». .~. . . Percentage Distribution «1 1Family Income
2.5% 11 .0% 19.9, 0 1819% 13 .1% 15.4% 19.2% 100.0%Plus:
. Social Insurance Contributions " `
6 .1 1l.9 29.0 20 .3 10 .7 7.8 7.3 100. 0Undistributed Corporate Profits
.9 3.6 o5.3 5 .8 4 .6 10.5 69.2 100. 0Corporate Profits Taxes'
2.4 8.4 13 .8 13 .0 9.0 12 .4 41 .0 100 .0Indirect Business Taxes'
4.0 13.2 22 .3 20 .2 13.3 14.2 12 .8 10010Less: Net of Other Ol ferences'
3 .0 11 .0 20.0 19.0 A3,0 15 .0 19.0 100 .0TOTAL INCOME4
2.7
- 11 .2 20.0 18 .6 12 .7 14 .6 '20.0 100 . 0
• All taxes that are chargeable as business expense (other than employment taxes), Includes sales, excises, customs and property tames tfarm and non-form dwellinas which amounted to 14.8 billion In 1111.
property taxes Include tames on ewner•oeouple d
• Includes difference between family Income and personal Income which consists mainly of Income In bind . Income to military personnel, Income to Institutional residents, and othe rdifferences composed primarily of government tra ,: efer payments to persons and government Interest payments ,0 Defined as equivalent to net national product .
,Source . Department of Commerce and Tam Foundation (see text p . 13) .

Table 10
TAXES AS A IERCBNTAOE OF TOTAL INCOM EBY SWRCE AND BY INCOME CLAN
Calendar Year 1908
CFamily
lnoemp*Clos
epPomnnl
Source
c .
$2.000 ii~/ff b~fff 1 7 ~~Mfppp,
~i4~fN 41W
r TotalTad
TOTAL TAXES, Excluding Social Insurance 21 .0% 20.4% 20.6% 21 .6% 20,6% 21.6% 34.4X$ 23.7%TOTAL TAXES, Including Social Insurance 28 .3 26.3 25 .9 25.7 23.9 24 .0 35 .9 27 . 4
Federal Taxes:Individual Income 1 .8 4 .5 6.0 7 .9 7.5 8.9 16 .3 8 .7Corporation Income 3 .8 3 .2 3 .0 3.0 310 3 .6 8 .8 4 . 3Excise and Customs 4.0 3 .3 3 .1 3 .0 2.9 2.7 1 .6 2.8Estate and Gift - - - •- - r 1.7 .3
Total, Excluding Social Insurance 9.6 11 .0 .12.1 13 .9 13 .4 15.1 28 .6 161 1Social insurance 6 .1 4 .9 4.3 3.3 2.7 2.0 1.2 13 . 1
Total, Including Social Insurance 15 .7 15 .9 16.4 17 .2 16.2 17.2 29.8 19 . 2State and Local Taxes :
Individual Income .5 .8 .6 .2 . .12 .3 .7 .5Corporation Income .2 .2 11 .1 .2 .2 I
;4 . 2Excises and Sales 3 .9 3 .7 3 .6 3 .5 3 .2 2 .1 3. 3Estate and Gift - - - - - -- .5 1 1
Oroperty 5.9 4.6 4 .1 317 3 .4 2 .8 2.1 3.5Total, Excluding Social Insurance 11 .3 9.4 8 .5 7 .7 7 .2 6 .5 '519 7. 5
Social Insurance 1 .3 1 .0 19 .8 16 .4 .2 . 7Total, Including Social Insurance 12.6 10.4 9 .5 $15 7.8 .619 811 8.2

t~ uDEDUCTIONS FOR STATE AND LOCAL TA)MSS IN RELATIO NTO ADAINTED QROSS INCOME ON FEDERAL VIDII DUA L
INCOME QETURNS WFTH ITEMIM DEDUCTIONSCalendar Yaar 1966
0ede1i.as for stat esod Local Tams
Qrees I~ircese As a lwcsn tCamas
(Tiroaeswdqbux0 a
govoaslTOWasirman)
of AdiesaedGross income
UnderS 2 S LOKA S
55:3 5 15 2 Under
4 11.101 .0 526.1 4.74 Under
6 29.2K7 1.364.0 4.7= 6 Under
8 24.430.7 L150.1 4.78 Under 10 12,53L6 589.6 4.7
10 Under 15 11.869 7 564.7 = 4215 and Oren 29.451 1.273.4 43
Total 11%731A 5.543.2 4,6Seotp ' Thoo-y oepartarerrt.
indication of the distribution of the property tax burde non householders. It shoves the percentage of state andlocal taxes deducted by taxpayers who itemized tfei rdeductions in 195& Throughout the income scale there i sa rather remarkable consistency in the percentage o fthese taxes to total reported income . The major part of
these taxes is accounted for by property taxes on home-ownem
Tables 12 and 13 stow major trends in the maioeulpof the total tax burden since World War II . It is evidentEL oan these tables that the total burden of social insllrineetakes has increased considerably in relation :o net na-Somd product. These taxes armmmted to 3 percent of netnational product in 194k 2.4 percent in 1949 and approm-ir ately 4.1 percent in 1959 This increase rr&tts theincrease in the OASI tax rate from 1 percent on $3,000of taxable income before 1949 to the current rate of 2yapercent on the first $4.800 of taxable wages in 1959 Th eincreased burden of social insurance taxes reflects a sig-nificant extension of the coverage of this insurance sys-tem. Table 13 also stows the relative inaease in stateand local taxes in relation to net national produce; whilethe Federal tax burden has declined in _relation to netnational product since the Korean -Mr_
While there has been some relative shift in the total taxsystem toward these more regressive elements, the totaltax system remams approximately proportional to m-comae for the vast majority of the popubtion. It must beremembered also that social insurance taxes and impor-tant parts of the state-local tax system are largely justi-fied not on grounds of abi'li'ty to pay but rather on groundsof benefits received.
Table 12NET NATIONAL E!' MMM MID TaFAL TAX RECER*T SBY LEM OF GONERI IMW MM BY ME OF TAX
SMaetrtd Calendar Years 191619!9(MIM a)
1916 1919 1952 1966 1961 1969 •
Net National Product $199.969 $240.780 $322.992 $365.483 $403.805 $438.600Total Tax Rece4 ft Exciud'mg Social insurance 43.916 48.795 79.532 87.209 95.654 106̀ 500
W Lard of Government -
-
-Federal 33.409 33.780 59.859 62.772 65.192 73.300Stab and Local 10.507 15.015 19.673 24.437 30.462 33.200
By Type of TaxDirect
_ 27.182 28.037 52.601 -5%978 58.458 66.500Pitrsonal
= 18.071 17.662 33.142 34.151 40.274 43.100Corporation
- 91 111 10.375 19.459 21 .327 18.184 23.400Indirect Business Taxes 16.734 20.758 26.931 31.231 37.196 40.000
Non-Property 11 .896 14.116 18.546 20.797 23.641 25.500Property' 4.836 6.642 8.385 1%434 13.555 14,500'
Social Insurance Contributions 5.981 5.737 8.614 10.995 - - 15.121 17.900Total Tax Receipts, Including Social Insurance 49.897 54.532 88.146 96.204 110.775 124.400
• IraNn"My eetimabs by Council of Economic Advisors .• Includes lures levied on ownoroccupisd houses ; divot personal taus aim Include some property hexes.
Tax Foursource: Oepeellnent of CNn"Mros.
18

Tame 13
-TOTAL TAX RflCEIFFS
AS A PERCENT OF NET NATIONAL PRODUCTBY LEVEL OF 60VERlNiEN17 AND BY a V OF TA X
Sdscdd Calendar Years 1916 .1959
i!K 1949 1952 1955 1958 1959•
Total Tax Reodpts. Exdudirrt Social Inwrance 220% 203% 24.6x. 23.9% 23.7% 24.3%By Lem of GorernnMnI _
Federal 16.7 14.0 18.5 172 16.1 I6.7Stateand Local 53 62 6.1 6.7 7.5 7.6
By Type of Ta xDaect 136 11:6 16.3 15.3 14.5 152
Personal 9.0 73 103 93 10.0 9.8poration 4.6 43 6.0 6.0 4.5 53
Illdirreet &4 8.6 8.3 8.5_
92 9.1_
mon-nowty 5.9 59 5.7 5.7 5.9 5.8Property' 2.4 -2-8 2.6 2.9 3.4 33`
Social Insurance Contruutions 3.0 2.4 27 3.0 3.7 4.1Total Tax Recess, Including Social inwrance 25.0 226 273 26.9 27.4 28.4
- • eastA m P-&-WY et-M. by C..Aer ECOnOrrriC Advisers.• lrrelrrdts ta:•s iteitd on o.ntracarpitd houses. dirtct personal tarts also indudt some property tries.• Tax EarrdM30n ttOmete.Sort: Otpertawnter Cornsrtrp Now Table 121.

IV. SIGNIFICANCE OF TAX BURDEN ESTIMATES FOR TAX POLICYof progressivity or regressivity in particular taxes or i nthe tax system as a whole is only one of marry considera-tions that must enter into tax policy . Other criteria m-dude adequacy, diversity, ease of administration andcompliance, and avoidance of distorting effects on eco-nomic activity. Thus if one tax source is excessively ex-ploited, it is likely to have distorting economic effects .Consequently, there is much to be said for a diversity oftaxes in the tax system. Moreover, the criterion of equityas among persons at different income levels must ofte ngive place to the criterion of simplicity. There is littledoubt that many taxes could be made more equitable i ftaxpayers were willing to accept greater complexity i nthe tax law. Yet the tax law is already extremely compli-cated, and many argue that future changes should be inthe direction of greater simplicity .
Thus the criteria of a good tax system are often con-9icting, and tax policy must involve a continual re -assessment of the relative importance of these criteria a scircumstances change. Estimates of the distribution o fthe tax burden by income class can provide some indica-tion of the equity of the tax system as among families atdifferent income levels.
The major conclusion of this study is that the ta xburden is approximately proportional to income in theincome classes that include most of the population . Thisstudy shows that this rough proportionality extends a tleast up to the $15,000 income level . For all incomesover this level taken together there is a sharp increasein the total tax burden, but the methods and sources usedin this study are inadequate to carry further up theincome sale the estimates of tax burden distribution.Indeed, the higher the income level the more crucialbecomes the problem of definition of income, and th egreater the difficulties of imputation. Correspondingly,it would be a mistake to press too far the estimates ofthe tax burden on the lowest_ income class because thelowest income class in this country is ebaracterized bysuch widely varying circumstances of_3gex financialposition.n
Such estimates as the present study contains cannot bythemsdi-res prove that the tax system is equitable or in -equitable, too progressive or too regressive. The degree
a A detailed analysis can be found in Characteristics oj :he LocoIncome Population and Related Federal Programs, SelectedMaterials ?lsse:abied by the Staff of the Subcommittee on Low-Income Faun-lies. Joint Committee on the Economic Report, 94thCongress, ist session, 1955.
.20

APPENDIXESTIMATING THE DISTRIBUTION OF CONSUMPTIO N
EXPENDITURES BY INCOME CLASS, 195 8This study of the allocation of the tax burden_ by in-
come class is based on the 19:8 distribution of familypersonal income by family personal income classes asshown in the Survey of Current Business, April 1959,p. 11 . The allocation of the tax burden requires an esti-mate of the d istribution of co sumption expenditures b yincome classes for allocating the burden of taxes as-sumed to fall on the consumer. This estimate was madeby applying to aggregate family personal income afte rtax by income classes an estimated ratio of saving to in -come after tax by income classes ; the resulting estimateof aggregate saving was then subtracted from family per -sonal income after tax to obtain the estimate of consump-tion expenditures by income classes . Only a percentagedistribution of the latter was used in allocating the taxburden.
The estimate of the saving income ratio was based on asaving income ratio contained in a study " Nho Saves 7 ' rby Irwin Friend and Stanley Schor, The Review of Eco-nomics and Statistics, May 1959, Part 2. The Friend-Schor study contains several variants of the saving-income ratio. The one used here is the "adjusted saving-income ratio" U. S. urbar,1950 based on B-L.S. NI anonsurvey (Table 7, page 232 of The Re-.1iew) . This ad-justed saving-income ratio in tvarn required furtheradjustments to adapt it to a 1958 study using a persona lincome distribution :
(1) The adjusted saving-income ratio shown in Table 7of The Review is an urban distribution only. No adjust-ment was made in the present study to take account of thedifference between an urban distribution and one fo rtotal U. S. Friend and Schor say (page 233) : "Theurban U. S. saving-income ratios and percentage dis-tribution of net saving among income groups presente din Table 7 can be used as a rough approximation of th esaving position for the total U. S." In any case, th eurban variant was the only one for which Friend an dSchor provided the adjustment noted in the followingparagraph.
(2) The adjustment in the "adjusted saving-income"ratio of Table 7 in the Friend-Schor study is for the
`understatement in the B.L.S : Wharton survey of swingin the form of cash and deposits . Friend and Schor pro-ceeded to adjust this ratio further, as between incom eclasses under and over $10,000, for conceptual difference sbetween the survey definition of saving and the definitio nof personal saving in the national income accounts (TheReview, pp. 234-236) . Because this adjustment was notmade for the detail of income classes under $10,000, no
aAow-a11ce for these conceptual differences was made i nthe present study. Friend and Schor shout that thes econceptual differences result in some understatement o fthe saving income ratio in the income classes ;10,000and over.
(3) The adjusted saving-income ratio of Table 7(Friend-Schor) is a ratio of saving to income after taxesin 1950, and is shown for an income-after-tax class dis-tribution. On the other hand, the distribution of personalincome for 1958, to be used for allocating the tax burden ,is a distibution of personal income before taxes . To makeuse of the saving4ricome ratio from the Friend-Schorstudy therefore required several adjustments, as follows :
(i) The first step was to convert the I950 incomelevels, for which the saving income ratios were available,to 1958 dollars. This was done by raising the average1950 income after tax in each class by the percentageincrease in the consumer _price index 1950 to 1958(Table Al).
(ii) The second step was to derive an estimate of thesaving-income ratios for the 1958 personal income distri -bution. This required, first, plotting in Chart 1 the 1950saving-income ratios by the average after-tax incomes foreach income class (in 1958 dollars) . It required, secondly,finding the average after-tax incomes for each personalincome class in the 1958 distribution ; this was done byusing the average effective rates of Federal income tax
Table AlADJUSTMENT OF 1950 AFTER TAX INCOME TO 195 8
DOLLARS AND SAVINGINCOME RATIOS FOR 195 0By Income Class
Income
COL (1)Class
1950
Expressed
Saving-After Tax
Average After
i . 1958
Income(Thousands)
Tax Income•
Dollars
Ratio•b
(1) (2) (3 )Under $ 2
$ 1,179` $ 1 .416 -21.4%'$ 2
Under
3
2,534 3,043 -1.73
Under
4
3,487 4,188 2.44
Under
5
4,462 5,359 4.55
Under
6
5,483' 6,585 6.56
Under
7.5
6,6754 8,017 10.07.5 Under
10
8,434 10,129 16.310 and Over
15,914 19,113 30.7• BLS—Wharton survey (urban) .► Adjusted for understatement of saving in form of cash and deposits.
Weighted averages of data for first two classes shown in source .e Estimated.Source : Col. (1) and (3) The Review of Economies and Statistics, May1959. Part 2, pp. 217. 232. Col . (2) .- Col. (1) X 1.201 (consumer priceindex 1958 on s base of 1950 — 100) .
21

chat 1ADJUSTED SUING-INCOME RATIOS for 1950
by EQUIVALENT 1058 INCOME 1,EVELB4
!0
INCOME (Thouswnds of 1968 DOWS)s. tnean~ Nwls for 1950 oommd in 1434 dWWs oe On b" of the c&wAi f plc kimSousa : See TOk Al. Cokoft 2 red 3.

Table A2
, .FMYIR.Y PLVKWM. OCOME DOTR MMON
AND ESTIMATED DISTR1BUZON OF CONSUMFFM E OMMURES1958
FFrnenN
Alb
-EsUnudedhimme
Fa~iy►
lrnemt
Ar.rap
Ewm.aa
EMImeted
P Opas
hnenel
heorewe
Nsrereerof
l:—
Swim
comM IN .
Oiaf~butlo nOslsrnTax
Income
Effec"We
AftsrTax
FamNfes
After
moans
Eftwres ofC—npuoo/Thoutends)
(8011oa)
Ts : Rats
UNW- 0
OMWOM)
Tau
ReW
(Qi M.)
Evokift .
a)
(z)
(3)
(4)
(6)
m_
Under $ 2 $ 8.5
239(
$ 8.3
7.6
$1.092
209('
$10.8
4.0°X,2 under 4
37.1
52
352
121
2,909
2
35.9
1324 under 6
67A
6.8
62.8
13.6
4.618
3
60.9
22. 36 under 8
63.9
8.6
58.4
92
W
6
54.9
2018 under 10
44 .2
9.0
402
5.0
8.040
10
362
13310 under 15
51 .9
9.9
46.8
4.3
10,884
17
38.8
14.215 and Ovw
65.0
19.6
52.3
2.5
20.920
33'
35.0
12.8Trial
338.0
304.0
54.3
2725
100.0•F. ISS7.•TSource: Cos. 0 .
of Moa fawes areappeaaYmtlorss from free hand oxtr—
Inasset 1.
some com a r,
pwpoaas of !M)a0ow itaON ~Co1. 13jCot 0) XO
N ~Co11.1(?W). Clot (5) Col. 0) -r Col (4)CoL pl6natad trapChar CotMCot () X (100 — esnss in G-t. (6).L COL (e) aUadated from Col. (7) .
by hu=e classes for 1957 (Table A2, cols. 2 to 5) .
column 6.Thirdly, the estimated swA income ratios for 1958
(iii) Finally, the estimated saving-income ratios for- were estimated from Chart 1 for the respective after-tax
1958 were applied to the aggregate personal incom eincomes in the 1958 Inersonal income distribution. The
after tax to obtain an estimate of aggregate consumptio nresulting saving-income ratios are shown in Table A2
expenditures by income class (Table A2, col . 7) .
J ,-
23 -

Capital OonsumPtlon lllfosratroas a measmae of the plat an dequipment worn ouk damaged or rendered obsokte during aaim period of time. (See also Depreciation Qsrges.)
t~orporala Plofdls Tax I ft Federal and state taxes levied o ncorporate earnings of a given year. This measures taxes fo r3bc year in wba they are incurred, not necessarily for theyear in which they are paid .
Dapraetathor~ 4Srar0 aa charges made by private business an dnon-profit institutions agaunt receipts to account for the de-crease in value of capital assets as a result of war, aeddehta ldamage and, obsolescence; plus an estimate of correspondingdepreciation in owner-occupied dwellings. Thee charges rep- :resent a major part of capital consumption allowances .
Gross NsSanl Product or E*wW trac the total market valueof all final goods and services pcodmocd in the natiWs __ _ _ ywithin a given period of time . Final goods and sertioes are dis-tinguished from "intermediate goods and services which be-coie .elements in the value of other goods aad services.
,71 hrdiraet le a Tax= all taxes kvW an business except cor-porate rnconhe taxes and soda' insurance taxes In the nationalincome and product accounts homeownership is chssified antler"business," so that property taxes on owner-occupied homesare included in indirect business taxes
•Nadmd moon - a measure of the aggregate earnings of thenation's labor and property which arise in prvdncioc goodsand services in a grveo period of time. It is equal to the netnational product less wdirect business taxes and certain :dateditems. This represents the total urahme at factor priors (pricespaid to the factors of production : laisk labor. capital and entre-pnnemship). rather than at market prices . Thais it also equalsren% compensation of employees, rocame of voincorpated en-terprise. undistributed corporate profits, corporate tax liability .dividends, interest and wi%Jties.
Nat National Product : . meashae of the aggregate market valueof all goods and services which do not replace worn outi dam-
_aged or obsolete capital goods and which are prrmdoced by the
_economy within a g ', rm period of time. Thus it equals Ewannational product less capital anosumptiaa allowances.
Nlrsnnal hreoara: natinaal inxa+e less various kids of ?conic
=shot acthnAy recei:tid by indivul als (i a undistributed corpor-ate profits. eocporste taxes, contributions for social insurance)
rplus certain receipts which do not arise from produ&-Alt (ie. -
=transfer payments and government interest) .
=Transfer Paytrrarrt:r payments to individmds by government and
businhess for which no goods or services are currewly remdermsi
_Examples are benefits from social insurance forAs6 relief pay -menus, military pensions, mustering-jar psi. and corporateaft
= to aoaPmfit inutitntians .
_ =" =
~-"`_ -
BIBLIOGRAPHY
-
=
=
Colm, Gerhard and Tarasov, H, "Who Pays the Taxes? ." TNEC Pecluman, Joseph A, "Same Tedmica t Problems in the Masare-3fonogral..': No. 3. Washington : U.S. Government Printing meat of Tax Burdens," Procudacg : of the Forty-Fifth An-office, 1941 . mud Connferexce'af the National Tax'Assoeiation, 1952, 2W
=
Friend, Irwin and Schor. Stanley. "Who Saves?." Review ofEconomics and Statistics, XLI, May 1959, No. 2. Part 2,
22- Pettemgill, Robert B, 'Tax Barden Among Income Groups,''
213-248. American Fide Review, XXX,1940. 60-:1
Goldsmith, Selina F, "Income Distribution by Size--1955-58," Poole. Kenyon E, editor. Fiscal Policies and W A-mericast
_J
Swwy of Current Business, U.S. Department of Commerce, Prentice-Hall, New York 1951.April 1959.9-16. 'Shirras, Fmd3ay G, and Rostas Y.., The Bwdm of British Tax
Musgrave, Richard A. "Distr: butiea of the Tax Bhrdet Under atiox, ~ldacmnllan,1943,240 ppSales and Income T:.xes," B Me& of the NatioealTar Asso- `Staulfacher, Charles, "The Effects of Govaamental Expends-ciation, XXXII, 1946-194?, 16-18.
- tares and Tax Withdrawals Upon inoamr_ Distribution, 1930 -1939," Pn51ic Policy, Vol. II, Harvard University Press, 1941
' . "Distributiaht of
Payments by Income Croups :a Review," Prowedings of the Forty-Fifth Annual Conference"
"
"
- `Tarasov. Helen, Who Dux Pug rhe=Taxes?, Social Research,
- of the National Tax Ass"Wion,1952,179-222 . Supplement IV, 194Z 48 pp.
'On Ihcidnwe," Journal - of Political Economy,Tax Founelatio n, Inc, The Tax Burden in Relation to Nationa l
Income and Product, Research Aid No . 4,1957, 24 pp.
-' Augnnst 1953. 306-24 .
Tucker, Rufus S, "Distribution of Tax Burdens in 1948, " Na-. "The Incidence of the Tax Structure and It- Effects tiond Tax Jownal IV, No. 3, September 1951, 269-286.
on Cansmnotiw," Federal Tax Policy forEronomu Crowtlh "Distribution of Tax Bmudeus in 1948." Procud-amul5tability, .November 9. 195S. 96-113. ~
.s of the Forty-Fifth Annnol Conference of the National'.
Carrall. J . J, Cook, L. D, and Frane, L, "Dis Tar Association, 1952. 195-224tribution of Tax Payments by Income Groups : a ('.ace Study "The Distribution of Government Burdens an dfor 1948," National Tax lomunal, IV. N~.1, March 1951 . 1-54. Renefits," American Economic Review, Papas and Proceed-
_ , and Daicoff, Darwin W, "Who Pays am Michigan inn XLIII, May 1953, No. 2, 518-35.Taxes?" Michigon Tax Study, Staff Paters, 1958, 131-183 `U . S. Department of Commerce, Survey of Current B"ness,
-
Newcomer, Mabel, "Estimates of the Tax Burden on Different July 1959.Incomne Classes," Studies in Current Tax Problems, The
wen U. S. Treasury Department, Internal Revenue Service, Statistiestitth:Century Fund. Ne!w York, 190. " of Income, Individual Income , Tax Returns for 1957. ;
`24