project management achieving problem free project management dr. marian krupa
TRANSCRIPT

PROJECT MANAGEMENT Achieving Problem Free Project Management
Dr. Marian Krupa

1. Management by projects (MBP)2. The dynamic project plan (DPP) 3. Defining the project objectives and tasks 4. Scheduling for being on time5. Budgeting and controlling the cost 6. Enhancements to the dynamic project plan 7. Resources and motivation 8. Reports, Actions, and Solutions 9. Motivation 10.The project manager’s special authority 11.Computer assistance – IT and PM12.Managing time
AGENDA

Design and present one of the selected project listed below:
EXAM
1. The International Conference Project – Gantt Chart (MS Excel, Visio, other)
2. The International Conference Project – PERT (MS Project, Visio, other)
3. The International Conference Project – LOB (MS Excel, Visio, other)
1. Management by projects (MBP)

ProjectProject::
a temporary and one-time endeavor undertaken to create a unique product or service, that brings either beneficial change or added value.
a carefully defined set of activities that use resources (money, people, materials, energy, space, provisions, communication, quality, risk, etc.) to meet the pre-defined objectives.
a temporary endeavor undertaken to create a a temporary endeavor undertaken to create a uniqueunique product or serviceproduct or service.
PROJECT MANAGEMENT - definitions
A Guide to the Project Management Body of Knowledge (PMBOK® Guide), Third Edition, Project Management Institute.
http://en.wikipedia.org/wiki/Project

CoordinatingCoordinating work activities so that they are work activities so that they are completed completed efficientlyefficiently and and effectivelyeffectively with and with and through other people.through other people.
PROJECT MANAGEMENT - definitions
Management:Management:
Robbins, Coulter, Management, Pearson/Prentice Hall, USA 2005, p. 7.Robbins, Coulter, Management, Pearson/Prentice Hall, USA 2005, p. 7.
EfficiencyEfficiency is „doing things right”. is „doing things right”.EffectivnessEffectivness is „doing the right things”. is „doing the right things”.
EfficiencyEfficiency – keeping costs down. – keeping costs down.EffectivnessEffectivness – achieving objectives. – achieving objectives.
WealthWealth creating activity. creating activity.
The The artart of using human and material of using human and material resources to produce and market (sell) resources to produce and market (sell) goods and services (customers’ needs).goods and services (customers’ needs).
PROJECT MANAGEMENT - definitions
Management:Management:
Archer, An Introduction to Canadian Business, McGraaw-Hill Ryerson Ltd, Canada 1982, p. 450.Archer, An Introduction to Canadian Business, McGraaw-Hill Ryerson Ltd, Canada 1982, p. 450.
All about decisionsAll about decisions Risk takingRisk taking ObjectivesObjectives Problem solvingProblem solving Asking right questionsAsking right questions Satisfying peopleSatisfying people Planning, organizing, directing & controllingPlanning, organizing, directing & controlling
PROJECT MANAGEMENT - definitions
Management:Management:
Robbins, Coulter, Management, Pearson/Prentice Hall, USA 2005, p. 9.Robbins, Coulter, Management, Pearson/Prentice Hall, USA 2005, p. 9.
Project ManagementProject Management (PM) / (PM) / Management by Project (MBP):Management by Project (MBP):
the discipline of organizing and managing resources in such a way that these resources deliver all the work required to complete a project within defined scope, quality, time and cost (budget) constraints.
management activity that requires much more detail in planning and control than general management does.
PM covers key business processes, strategic customers, markets, products, divisions etc.
PROJECT MANAGEMENT - definitions
http://en.wikipedia.org/wiki/Project

Project ManagementProject Management (PM) / (MBP): (PM) / (MBP):
Project management is no small task.
Project management has a definite beginning and end. It is not a continuous process.
Project management uses various measurement tools to accomplish and track project tasks. These include Gantt and Pert charts.
Projects frequently need resources on an add-on basis as opposed to organizations who have full-time positions.
PROJECT MANAGEMENT - definitions
www.snc.edu

PROJECT MANAGEMENT - definitions
General ManagementGeneral Management Project Management /MBPProject Management /MBP

PROJECT MANAGEMENT - definitions
PM means & PM means & tools tools
implementationimplementation
Standardization / Standardization / ContinuityContinuity
HighHigh
LowLow
LowLow High High
Management by Management by PROJECTPROJECT
CraftsmanshipCraftsmanship
PMPM
GMGM
2. Project Management Triangle
Project Management TriangleProject Management Triangle::
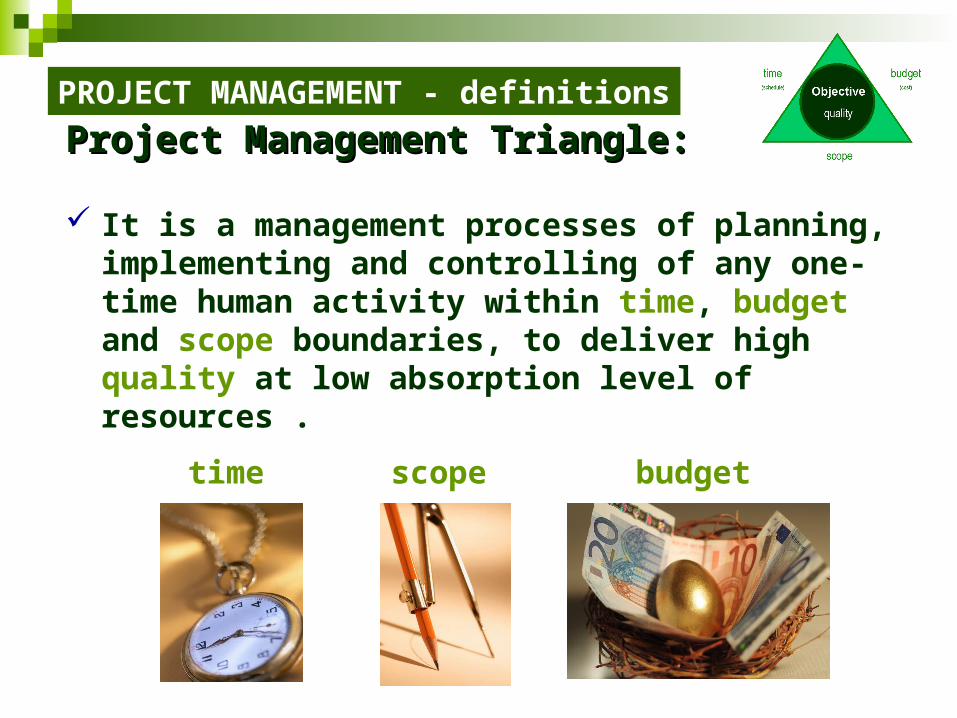
It is a management processes of planning, implementing and controlling of any one-time human activity within time, budget and scope boundaries, to deliver high quality at low absorption level of resources .
PROJECT MANAGEMENT - definitions
time scope budget

Project ManagementProject Management Triangle: Triangle:
PROJECT MANAGEMENT - definitions
time(schedule)
budget(cost)
Scope(tasks)
Objective(s)
quality
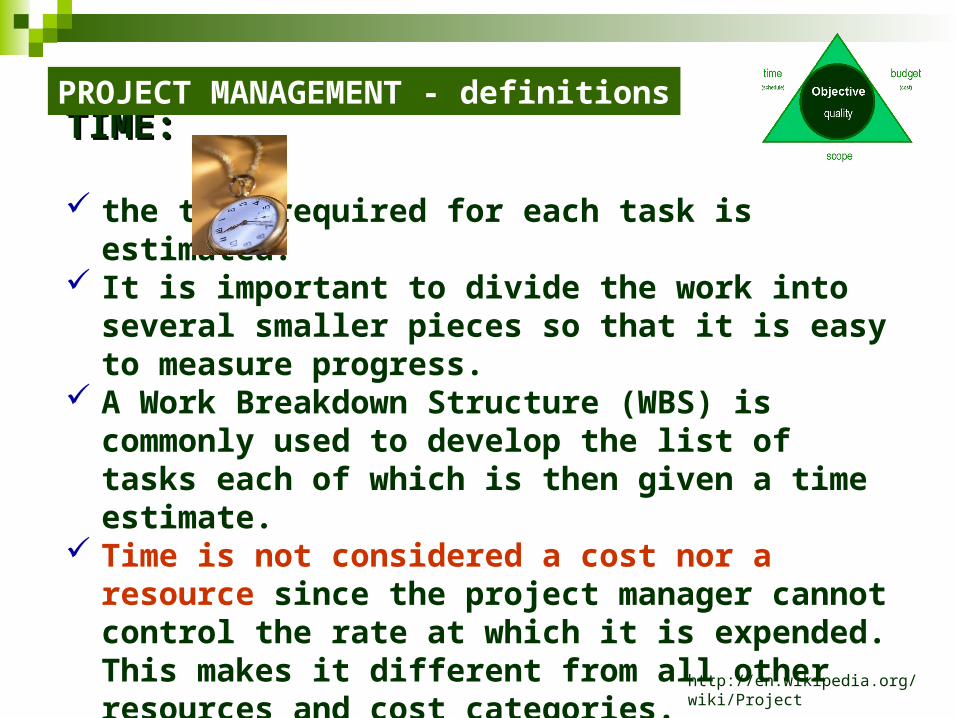
TIME:TIME:
the time required for each task is estimated. It is important to divide the work into several
smaller pieces so that it is easy to measure progress.
A Work Breakdown Structure (WBS) is commonly used to develop the list of tasks each of which is then given a time estimate.
Time is not considered a cost nor a resource since the project manager cannot control the rate at which it is expended. This makes it different from all other resources and cost categories.
PROJECT MANAGEMENT - definitions
http://en.wikipedia.org/wiki/Project

SCOPE:SCOPE:
Requirements specified for the end result. The overall definition of what the project is
supposed to accomplish, and a specific description of what the end result should be or accomplish.
A major component of scope is the quality of the final product.
The amount of time put into individual tasks determines the overall quality of the project.
Over the course of a large project, quality can have a significant impact on time and cost (or vice versa).
PROJECT MANAGEMENT - definitions
http://en.wikipedia.org/wiki/Project
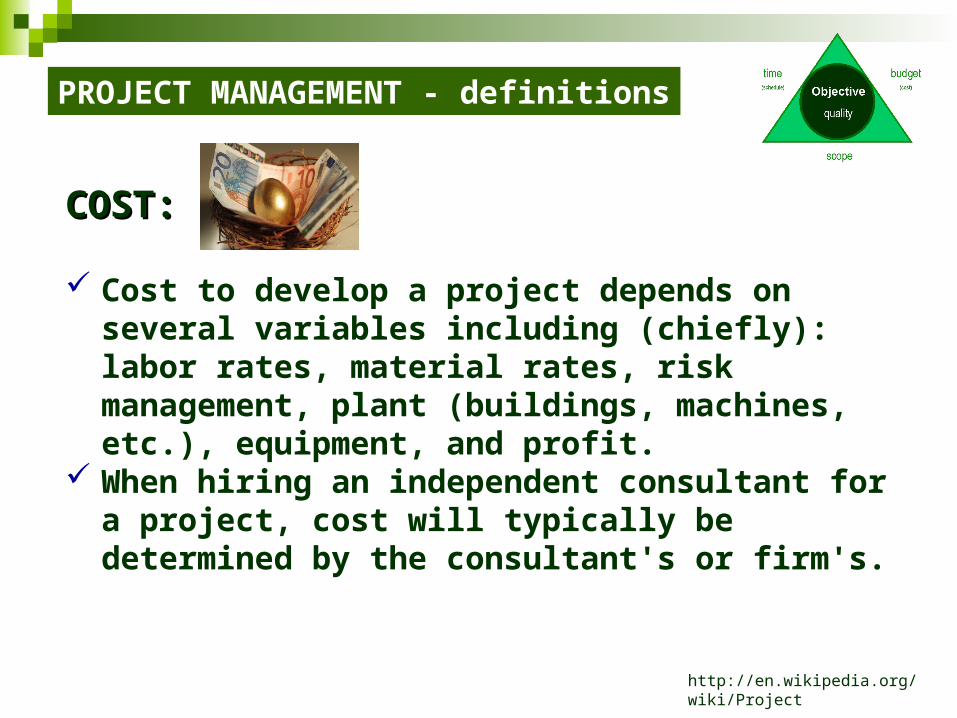
COST:COST:
Cost to develop a project depends on several variables including (chiefly): labor rates, material rates, risk management, plant (buildings, machines, etc.), equipment, and profit.
When hiring an independent consultant for a project, cost will typically be determined by the consultant's or firm's.
PROJECT MANAGEMENT - definitions
http://en.wikipedia.org/wiki/Project
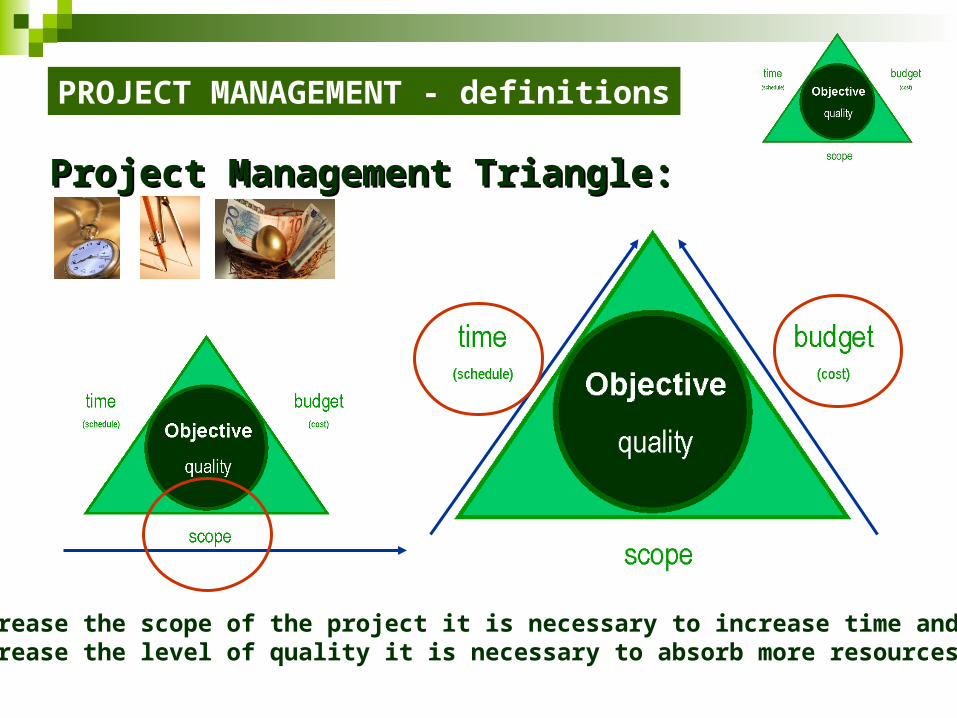
Project ManagementProject Management Triangle: Triangle:
PROJECT MANAGEMENT - definitions
To increase the scope of the project it is necessary to increase time and budget.To increase the level of quality it is necessary to absorb more resources.

Project Management:Project Management: Quality vs ResourcesQuality vs Resources::
PROJECT MANAGEMENT - definitions
Efficiency of the Efficiency of the project:project:
QualityQuality ResourcesResources
??MAXMAX MINMIN
3. Methods and techniques of PM/MBP

Methods and techniques - definitions
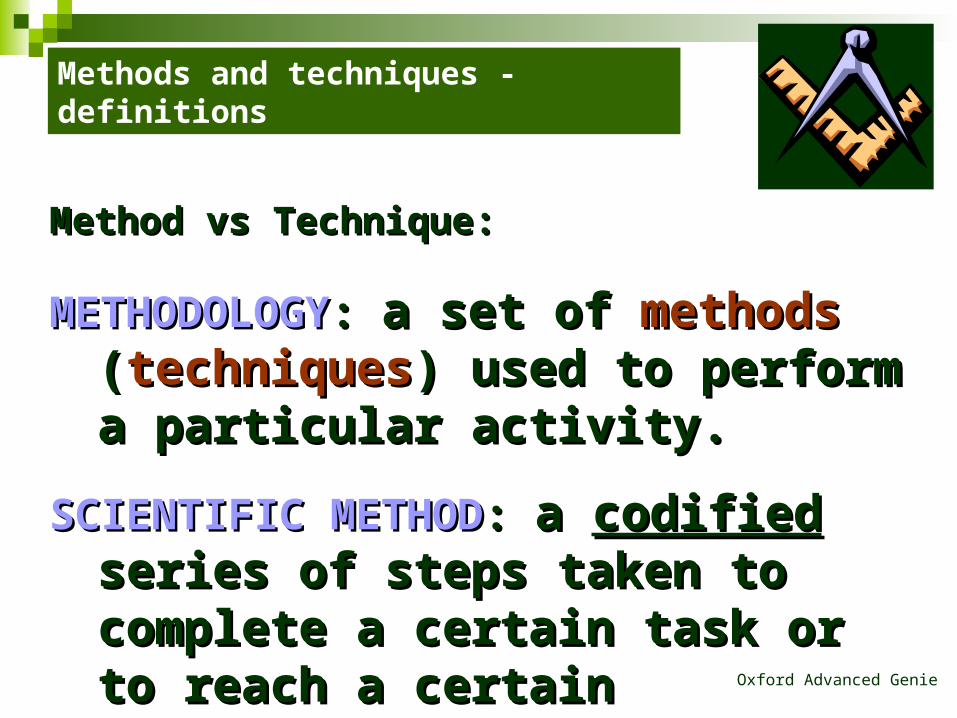
Method vs Technique:Method vs Technique:
METHODMETHOD: a particular way of doing sth: a reliable / : a particular way of doing sth: a reliable / effective / scientific method of data analysis.effective / scientific method of data analysis.
- A new way of solving the problemA new way of solving the problem
- The best solution for arriving at an accurate The best solution for arriving at an accurate prediction of the costs.prediction of the costs.
Oxford Advanced Genie

Methods and techniques - definitions
Method vs Technique:Method vs Technique:
Oxford Advanced Genie
TECHNIQUETECHNIQUE: a particular way of doing sth, : a particular way of doing sth, especially one in which you have to learn especially one in which you have to learn special skillsspecial skills..

Methods and techniques - definitions
Method vs Technique:Method vs Technique:
Oxford Advanced Genie
PRINCIPLEPRINCIPLE: :
a moral rule or a strong belief that influences your a moral rule or a strong belief that influences your actions;actions;
a belief that is accepted as a reason for acting or a belief that is accepted as a reason for acting or thinking in a particular way;thinking in a particular way;
a general or scientific law that explains how sth works or a general or scientific law that explains how sth works or why sth happens.why sth happens.
Methods and techniques - definitions
Method vs Technique:Method vs Technique:
Oxford Advanced Genie
METHODOLOGYMETHODOLOGY: : a set of a set of methodsmethods ( (techniquestechniques) ) used to perform a particular activity.used to perform a particular activity.
SCIENTIFIC METHODSCIENTIFIC METHOD: : a a codified codified series of steps series of steps taken to complete a certain task or to reach taken to complete a certain task or to reach a certain objective, see also algorithm, a certain objective, see also algorithm, methodology.methodology.
Methods and techniques - definitions
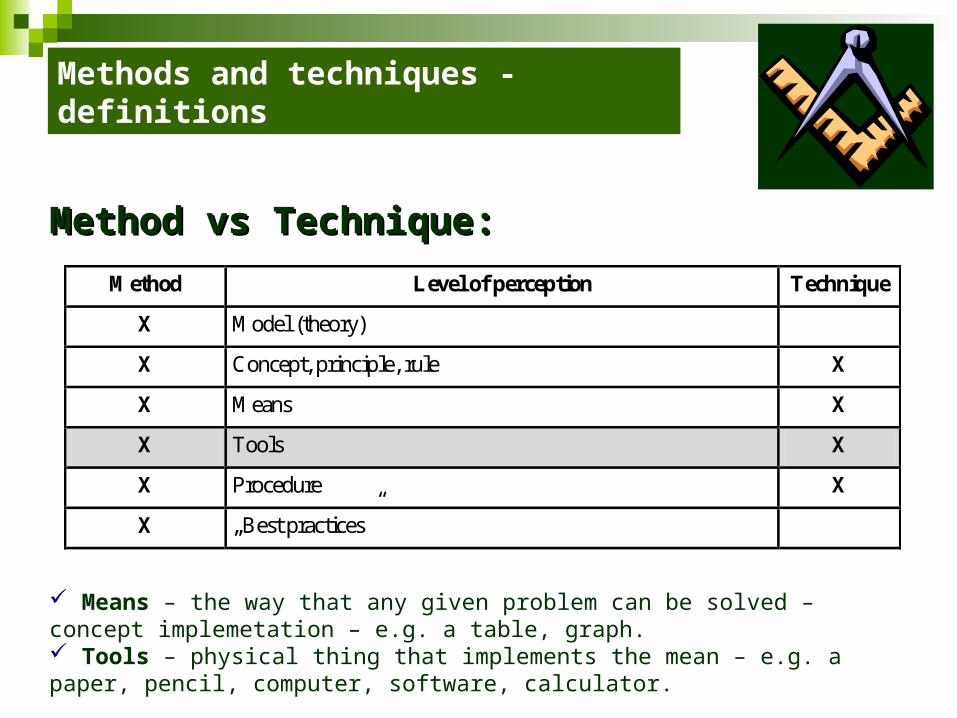
Method Level of perception Technique
X Model (theory)
X Concept, principle, rule X
X Means X
X Tools X
X Procedure X
X „Best practices”
Method vs Technique:Method vs Technique:
Means – the way that any given problem can be solved – concept implemetation – e.g. a table, graph. Tools – physical thing that implements the mean – e.g. a paper, pencil, computer, software, calculator.

Project 1Project 1: Charts analysis
Project Management Triangle
Project 1: Charts analysis - LOB
1. Accordingly to presented data evaluate the project performance. What are positives and negatives?
2. Present graphically your report by using the mean in any form of chart which is the most appropriate. You are allowed to select any tool.
Tasks:Tasks:

Project 1: Charts analysis
1. Project performance data:
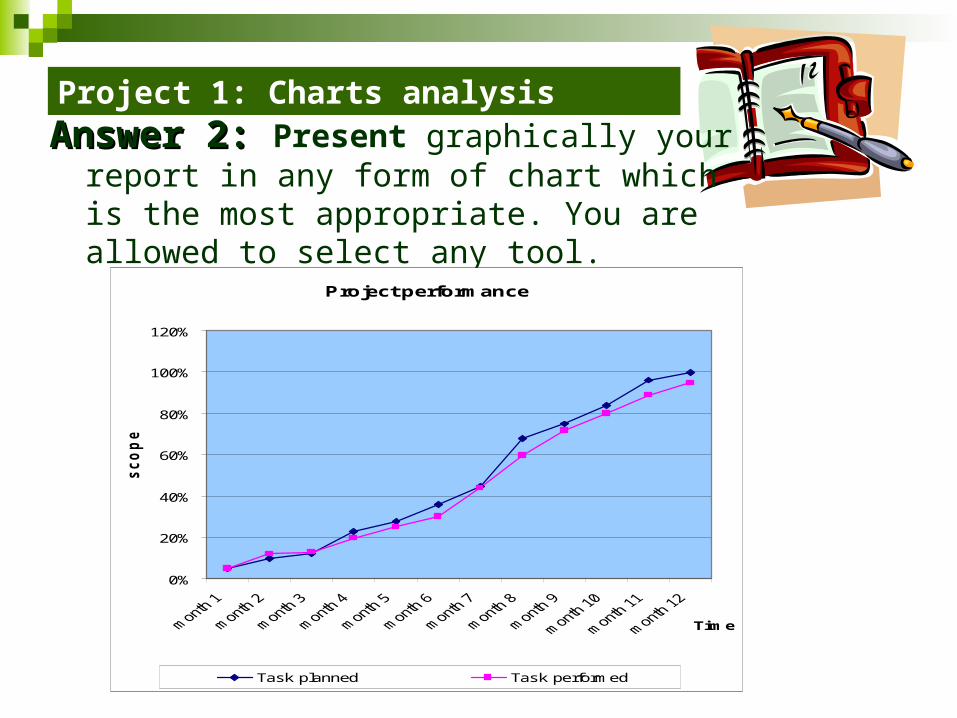
Table 1. Scope perspective [%]Time month 1 month 2 month 3 month 4 month 5 month 6 month 7 month 8 month 9 month 10 month 11 month 12
Task planned 5% 10% 12% 23% 28% 36% 45% 68% 75% 84% 96% 100%Task performed 5% 12% 13% 20% 25% 30% 44% 60% 72% 80% 89% 95%
+/- + + + - - - - - - - - -
Table 2. Budget perspective [EUR]Time month 1 month 2 month 3 month 4 month 5 month 6 month 7 month 8 month 9 month 10 month 11 month 12
Cost planned 1500 1100 1800 2500 1400 1400 1400 2500 2500 3400 3000 5500Cost performed 1500 1200 1900 2500 1500 1500 1700 2800 2500 3500 3200 6800
+/- + - - + - - - - - - - -
POSITIVES NEGATIVES
The project was very well managed at the beggining (first 3-4 months) The project was not complited on time.
In the months 2 and 3 we outperformed the plan. The real cost was higher than planned (by appr. 10%).
No more positives! In general we must improve the quality of the project management
Answer 1: Answer 1: Evaluate the project performance. What are positives and negatives?
Project 1: Charts analysis
Answer 2: Answer 2: Present graphically your report in any form of chart which is the most appropriate. You are allowed to select any tool.
Project performance
0%
20%
40%
60%
80%
100%
120%
Time
sco
pe %
Task planned Task performed

Project 1: Charts analysis
Line of balance (LOB) was devised by George E. Fouch during the 1940’s to monitor production at the Goodyear Tire & Rubber Company.
The line-of-balance (LOB) technique is a linear scheduling method that allows the balancing of the operations such that each activity is continuously and efficiently performed in each consecutive unit.
A graphical display of scheduled units versus actual units over a given set of critical schedule control points on a particular day. The line of balance technique is oriented towards the control of production activities.
Line of Balance (LOB):Line of Balance (LOB):
www.stsc.hill.af www.iit.edu
www.4pm.pl
Project 1: Charts analysis
It allows project managers to see, in the middle of a project, whether they can meet the schedule if they continue working as they have been.
It exposes process bottlenecks, allowing the project manager to focus on those points responsible for slippage.
Line of Balance (LOB):Line of Balance (LOB):
www.stsc.hill.af

4. Charts and Graphs – means as concept implementation

Methods and techniques - definitions
Method Level of perception Technique
X Model (theory)
X Concept, principle, rule X
X Means X
X Tools X
X Procedure X
X „Best practices”
Method vs Technique:Method vs Technique:
Means – the way that any given problem can be solved – concept implemetation – e.g. a table, graph. Tools – physical thing that implements the mean – e.g. a paper, pencil, computer, software, calculator.

Charts and Graphs
http://en.wikipedia.org/wiki/Project
DefinitionsDefinitions: : A chart or graph is a type of information graphicA chart or graph is a type of information graphic - - medium of medium of
communicationcommunication (MK). (MK).
GGraphic organizer that represents tabular numeric data and/or raphic organizer that represents tabular numeric data and/or functions.functions.
Charts are used to make it easier to understand large quantities of Charts are used to make it easier to understand large quantities of data and the relationship between different parts of the data. data and the relationship between different parts of the data.
Charts can usually be read more quickly than the raw data. Charts can usually be read more quickly than the raw data.
They are used in a wide variety of fields, and can be created by They are used in a wide variety of fields, and can be created by hand (often on graph paper) or by computer using a charting hand (often on graph paper) or by computer using a charting application.application.

Charts and Graphs
www.bcdsoftware.com
ExampleExample: :
By using progressive charts and key performance indicatorsPM manager visually improve the communication of your enterprise data
Charts and Graphs
http://en.wikipedia.org/wiki
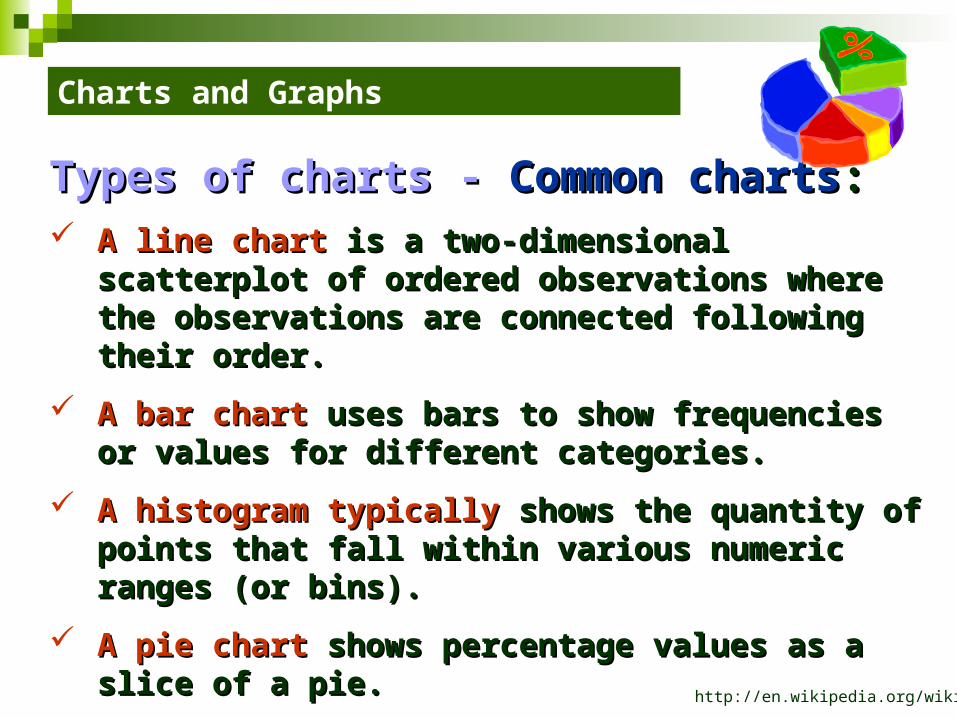
Types of charts - Types of charts - Common chartsCommon charts: : A line chartA line chart is a two-dimensional scatterplot of ordered is a two-dimensional scatterplot of ordered
observations where the observations are connected following observations where the observations are connected following their order. their order.
A bar chart A bar chart uses bars to show frequencies or values for different uses bars to show frequencies or values for different categories.categories.
A histogram typically A histogram typically shows the quantity of points that fall within shows the quantity of points that fall within various numeric ranges (or bins).various numeric ranges (or bins).
A pie chart A pie chart shows percentage values as a slice of a pie.shows percentage values as a slice of a pie.
A scatterplotA scatterplot uses Cartesian coordinates to show the relation of uses Cartesian coordinates to show the relation of two or more quantitative variables.two or more quantitative variables.
Charts and Graphs
http://en.wikipedia.org/wiki
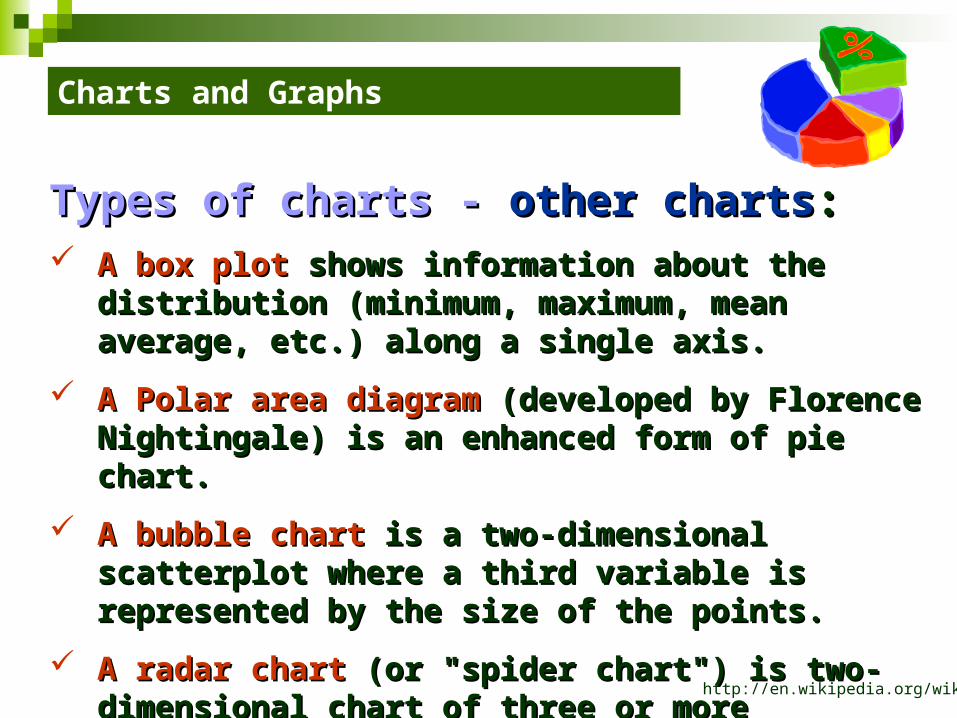
Types of charts - Types of charts - other chartsother charts: : A box plot A box plot shows information about the distribution (minimum, shows information about the distribution (minimum,
maximum, mean average, etc.) along a single axis.maximum, mean average, etc.) along a single axis.
A Polar area diagram A Polar area diagram (developed by Florence Nightingale) is an (developed by Florence Nightingale) is an enhanced form of pie chart.enhanced form of pie chart.
A bubble chart A bubble chart is a two-dimensional scatterplot where a third is a two-dimensional scatterplot where a third variable is represented by the size of the points.variable is represented by the size of the points.
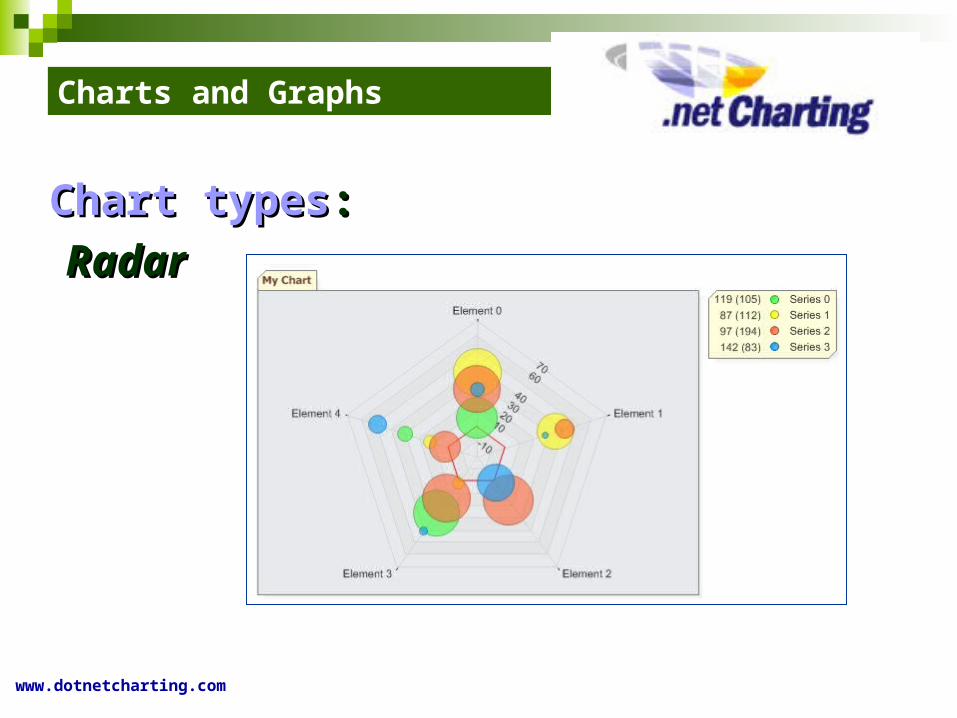
A radar chart A radar chart (or "spider chart") is two-dimensional chart of three (or "spider chart") is two-dimensional chart of three or more quantitative variables represented on axes starting from or more quantitative variables represented on axes starting from the same point.the same point.

Charts and Graphs
http://en.wikipedia.org/wiki
Types of charts - Types of charts - other chartsother charts: : A waterfall chart A waterfall chart is a special type of floating-column chart.is a special type of floating-column chart.
A Doughnut A Doughnut chartchart
A ternary plotA ternary plot..
Charts and Graphs
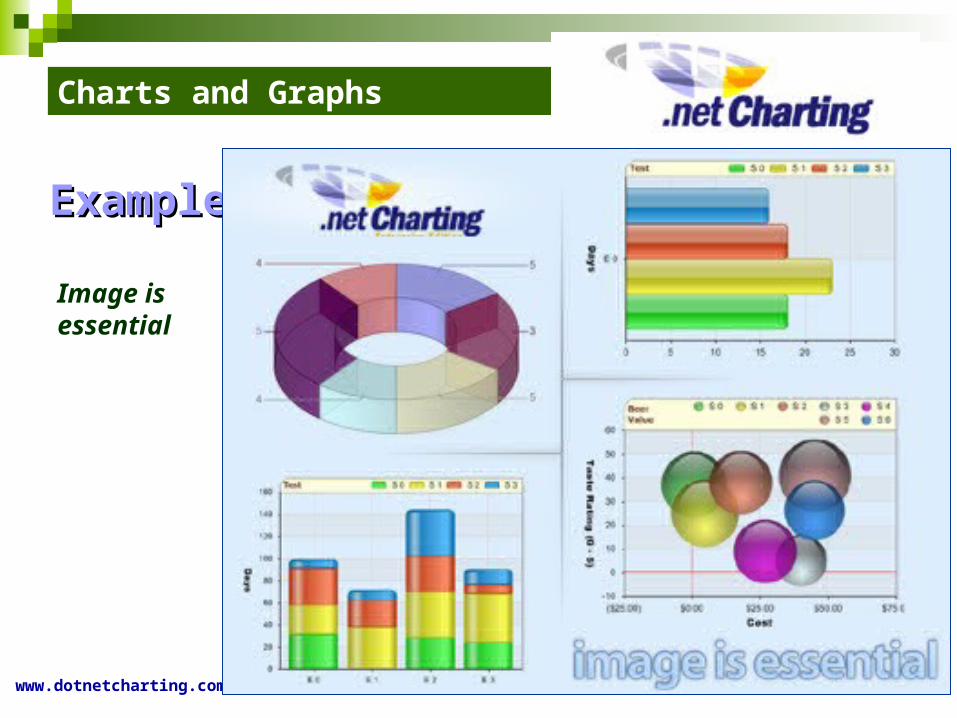
www.dotnetcharting.com
ExampleExample: :
Image is essential
Charts and Graphs
www.dotnetcharting.com
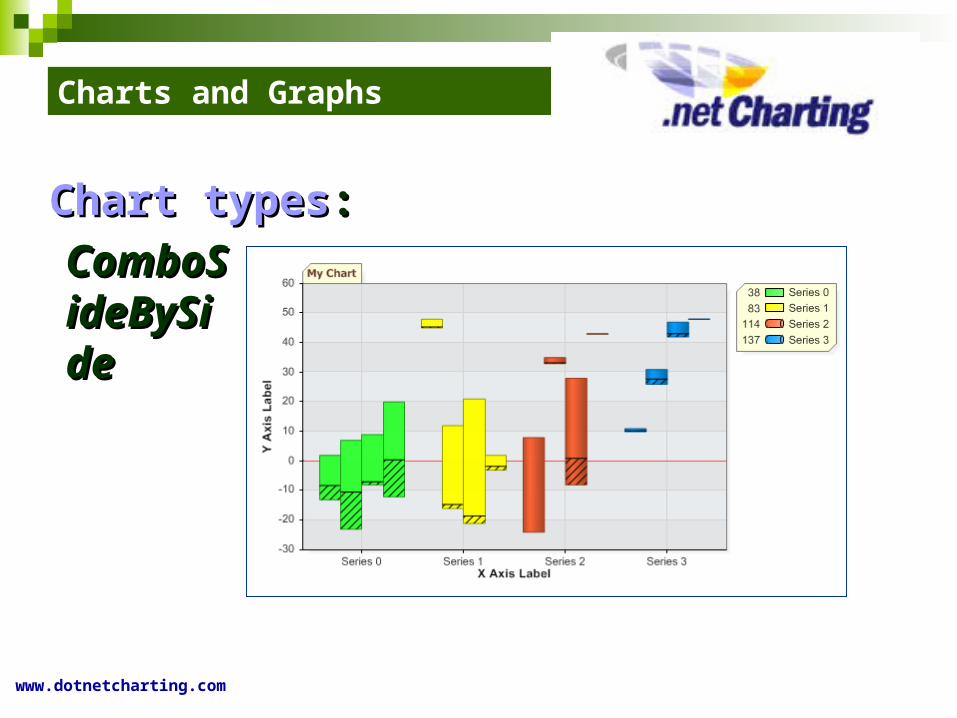
Chart typesChart types: :
ComboCombo
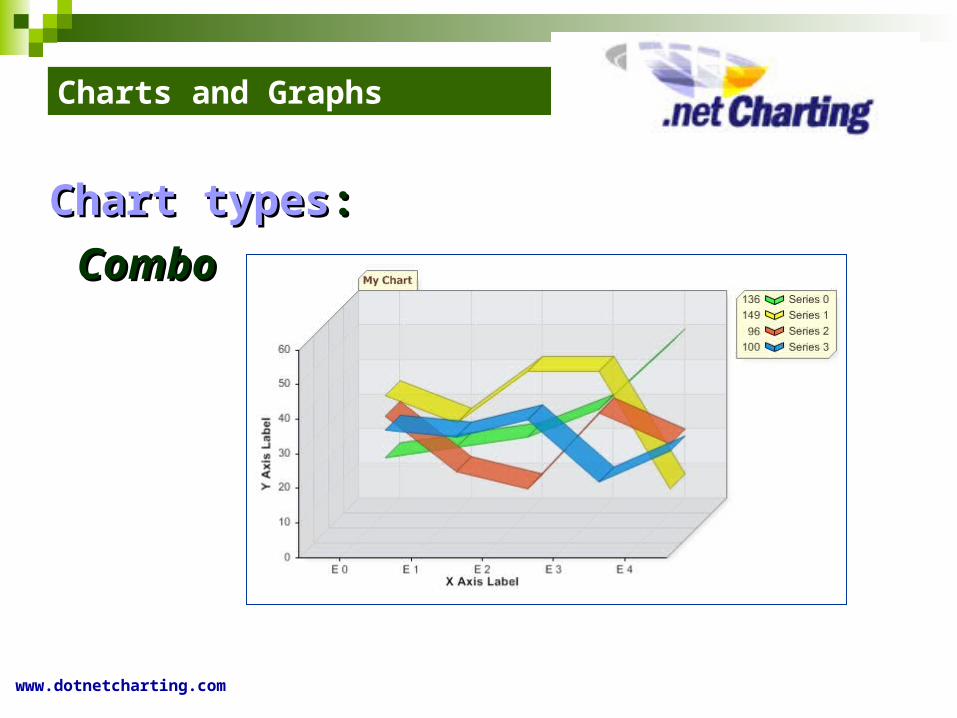
Charts and Graphs
www.dotnetcharting.com
Chart typesChart types: :
ComboComboSideBySideBySideSide
Charts and Graphs
www.dotnetcharting.com
Chart typesChart types: :
RadarRadar
Charts and Graphs
www.dotnetcharting.com
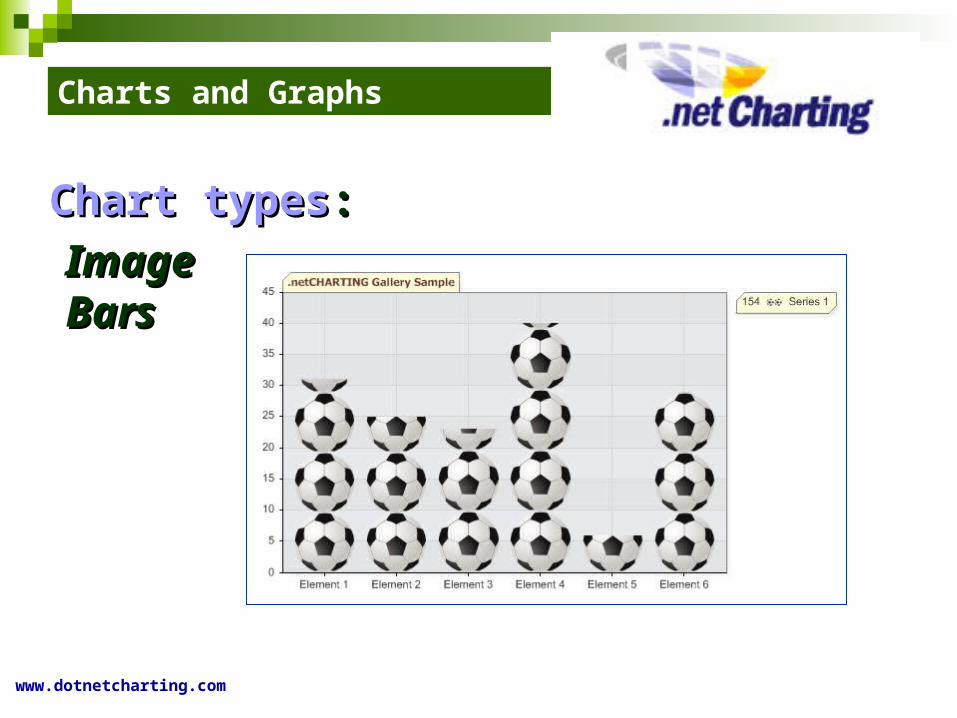
Chart typesChart types: :
Image Image BarsBars
5. GANTT ChartsMethods and techniques of MBP
GANTT Charts
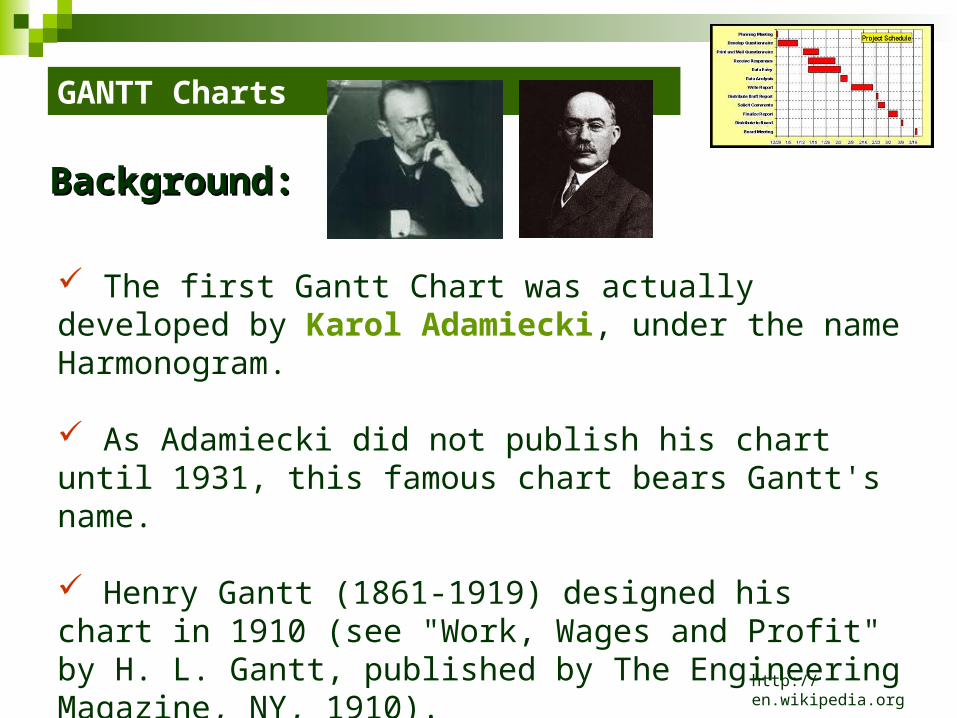
The first Gantt Chart was actually developed by Karol Adamiecki, under the name Harmonogram.
As Adamiecki did not publish his chart until 1931, this famous chart bears Gantt's name.
Henry Gantt (1861-1919) designed his chart in 1910 (see "Work, Wages and Profit" by H. L. Gantt, published by The Engineering Magazine, NY, 1910).
Background:Background:
http://en.wikipedia.org
GANTT Charts
A Gantt chart is a popular type of bar chart that illustrates a project schedule.
Gantt charts illustrate the start and finish dates of the terminal elements and summary elements of a project.
Terminal elements and summary elements comprise the work breakdown structure (WBS) of the project.
The 100% Rule states that the WBS includes 100% of the work defined by the project scope and captures ALL deliverables (objectives).
Definition:Definition:
http://en.wikipedia.org
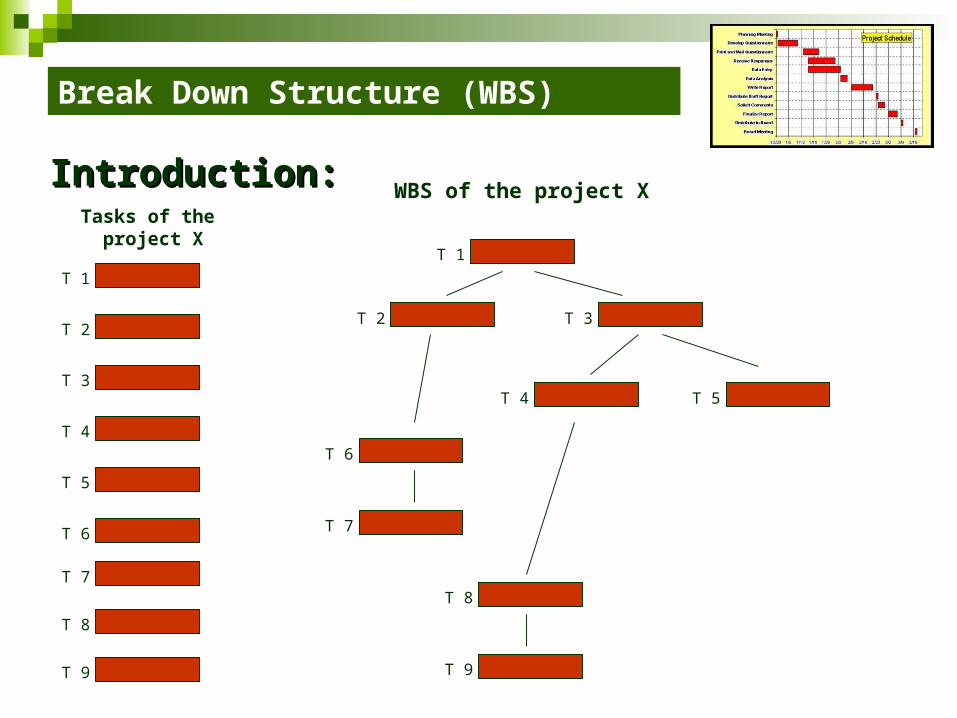
Break Down Structure (WBS)
Introduction:Introduction:
T 1
T 2
T 3
T 4
T 5
T 6
T 7
T 8
T 9
Tasks of the project X
T 1
T 2 T 3
T 4 T 5
T 6
T 7
T 8
T 9
WBS of the project X
GANTT Charts
http://en.wikipedia.org
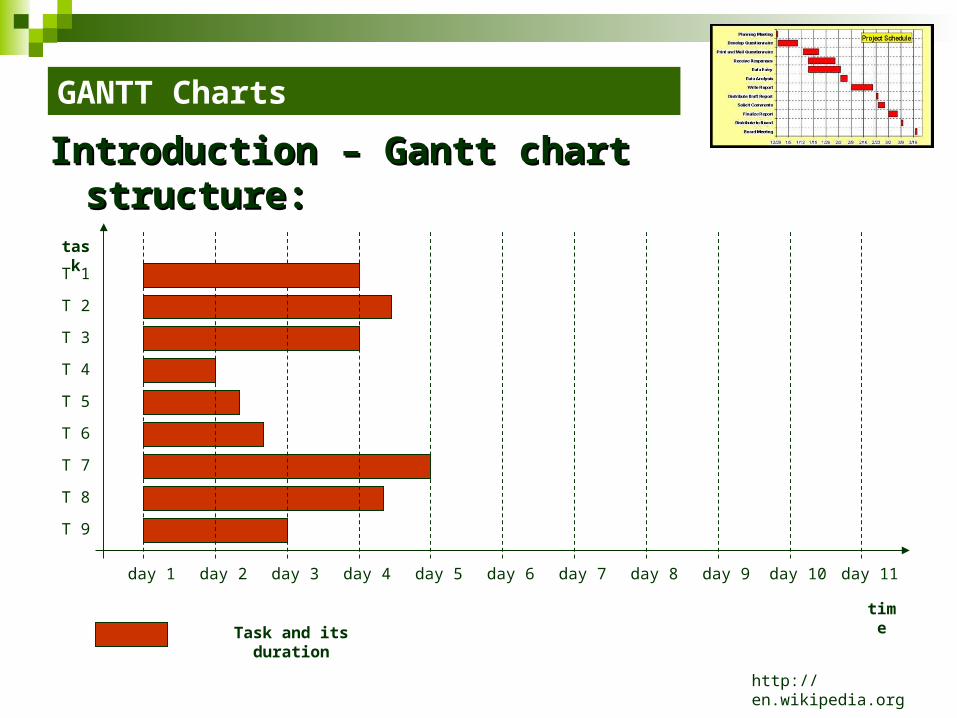
time
task
day 1 day 2 day 3 day 4 day 5 day 6 day 7 day 8 day 9 day 10 day 11
T 1
T 2
T 3
T 4
T 5
T 6
T 7
T 8
T 9
Introduction – Gantt chart structure:Introduction – Gantt chart structure:
Task and its duration

GANTT Charts
http://en.wikipedia.org
time
task
day 1 day 2 day 3 day 4 day 5 day 6 day 7 day 8 day 9 day 10 day 11
T 1
T 2
T 3
T 4
T 5
T 6
T 7
T 8
T 9
Introduction – Gantt chart structure:Introduction – Gantt chart structure:
Phases, tasks groups:

GANTT Charts
http://en.wikipedia.org
time
task
day 1 day 2 day 3 day 4 day 5 day 6 day 7 day 8 day 9 day 10 day 11
T 1
T 2
T 3
T 4
T 5
T 6
T 7
T 8
T 9
Introduction – Gantt chart structure:Introduction – Gantt chart structure:
„start-to-start”; „start-to-finish”„finish-to-finish”
Schedule dependences:

GANTT Charts
http://en.wikipedia.org
time
task
day 1 day 2 day 3 day 4 day 5 day 6 day 7 day 8 day 9 day 10 day 11
T 1
T 2
T 3
T 4
T 5
T 6
T 7
T 8
T 9
Introduction – Gantt chart structure:Introduction – Gantt chart structure:
100% complete
90%
80%
0%
90% complete
Project performance analysis
GANTT Charts
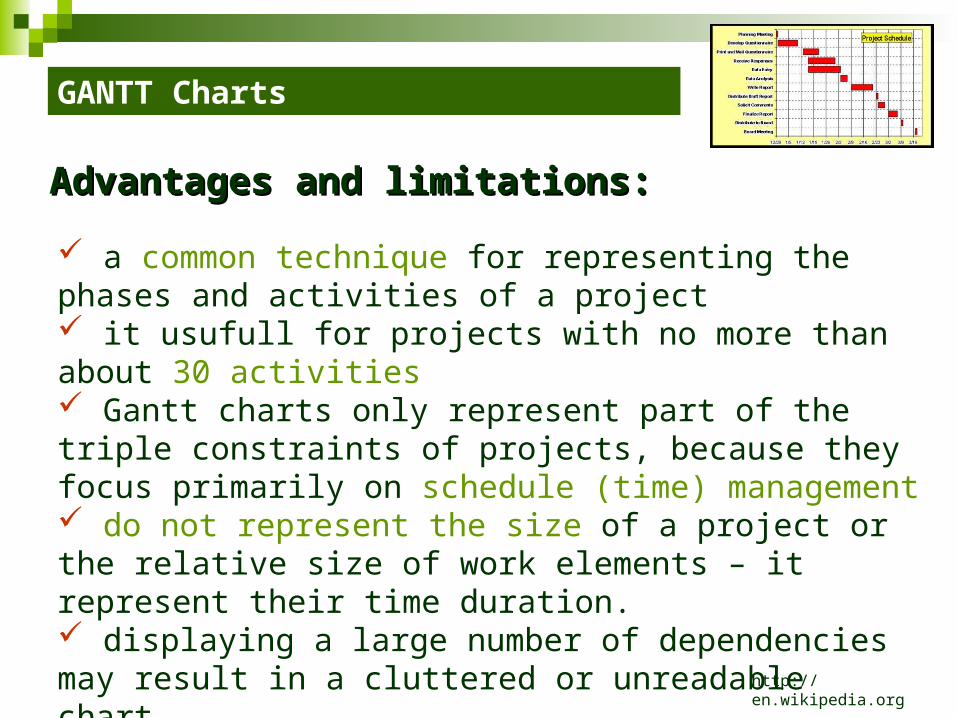
a common technique for representing the phases and activities of a project it usufull for projects with no more than about 30 activities Gantt charts only represent part of the triple constraints of projects, because they focus primarily on schedule (time) management do not represent the size of a project or the relative size of work elements – it represent their time duration. displaying a large number of dependencies may result in a cluttered or unreadable chart.
Advantages and limitations:Advantages and limitations:
http://en.wikipedia.org

GANTT Charts and SAP R/3
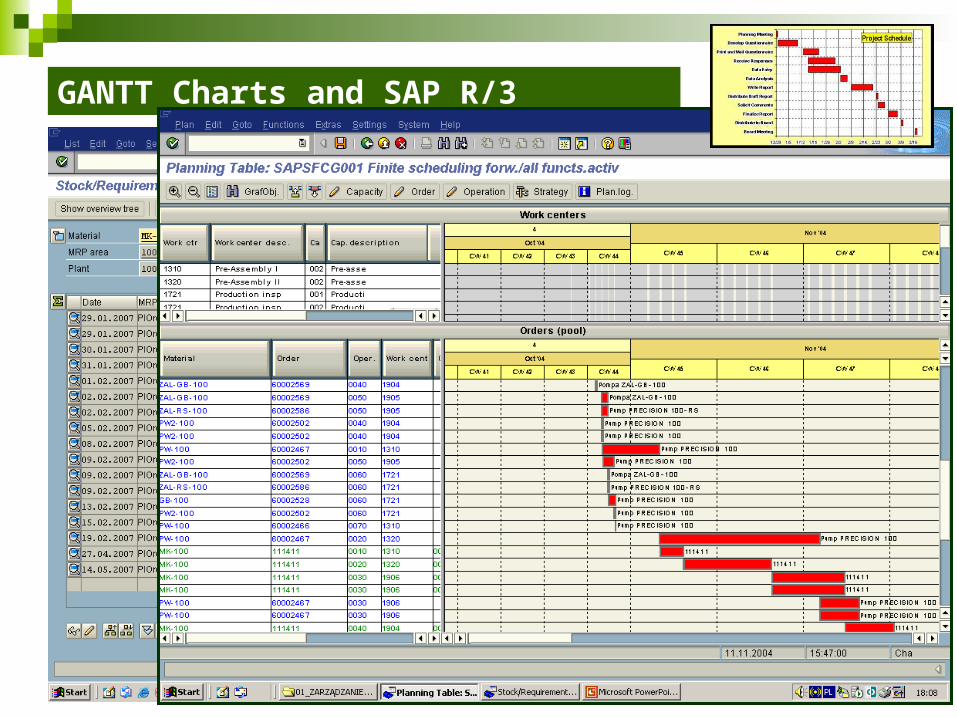
GANTT Charts and SAP R/3

Project 2Project 2: Gantt Chart
The International Conference Project

Project 2: Gantt chart analysis
1. Create a project plan for the International Conference – name, objective, activities, resources etc.
2. Present graphically your plan by using the Gantt chart.
Tasks:Tasks:
Project 2: Gantt Chart
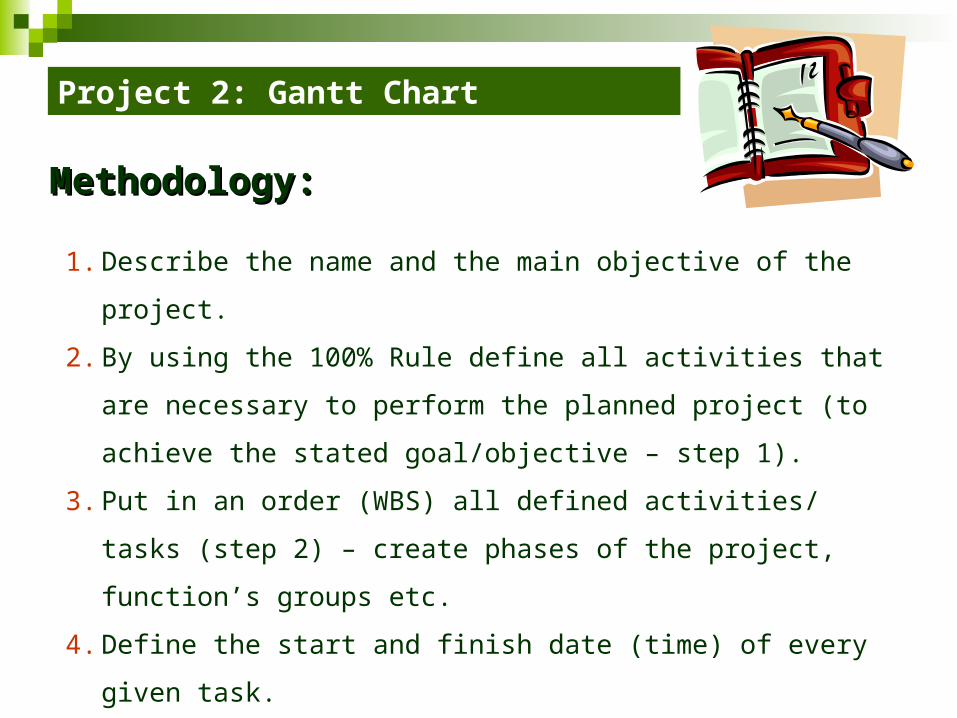
1. Describe the name and the main objective of the project.
2. By using the 100% Rule define all activities that are necessary to
perform the planned project (to achieve the stated goal/objective –
step 1).
3. Put in an order (WBS) all defined activities/ tasks (step 2) – create
phases of the project, function’s groups etc.
4. Define the start and finish date (time) of every given task.
5. By using the Gantt Chart present the plan of the project graphically.
6. Make all necessary descriptions.
Methodology:Methodology:
Project 2: Gantt Chart
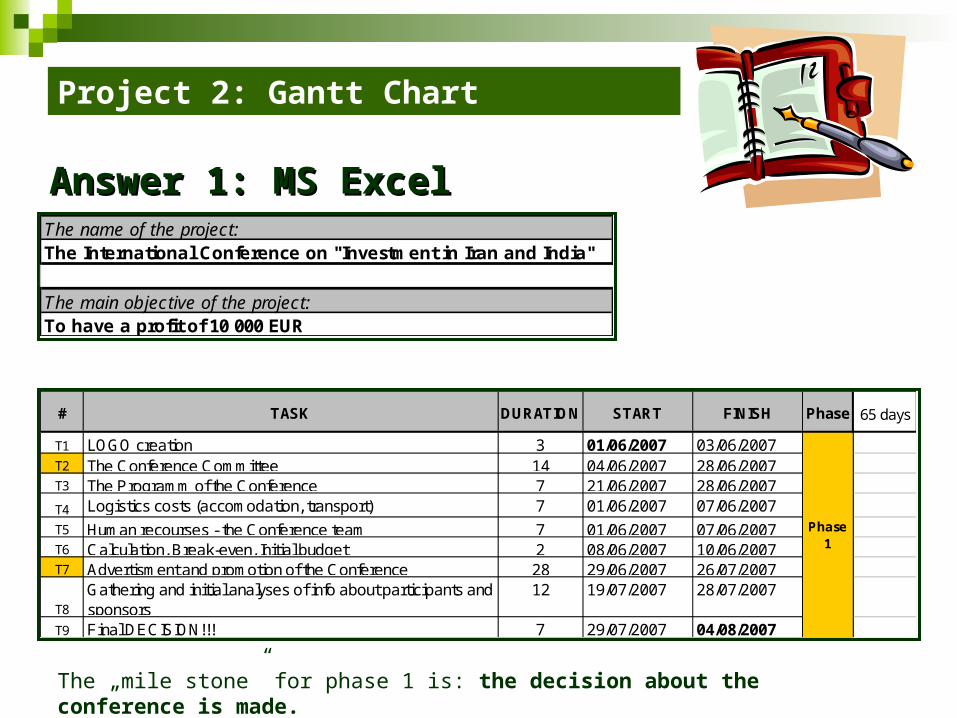
Answer 1: MS ExcelAnswer 1: MS ExcelThe name of the project:The International Conference on "Investment in Iran and India"
The main objective of the project:To have a profit of 10 000 EUR
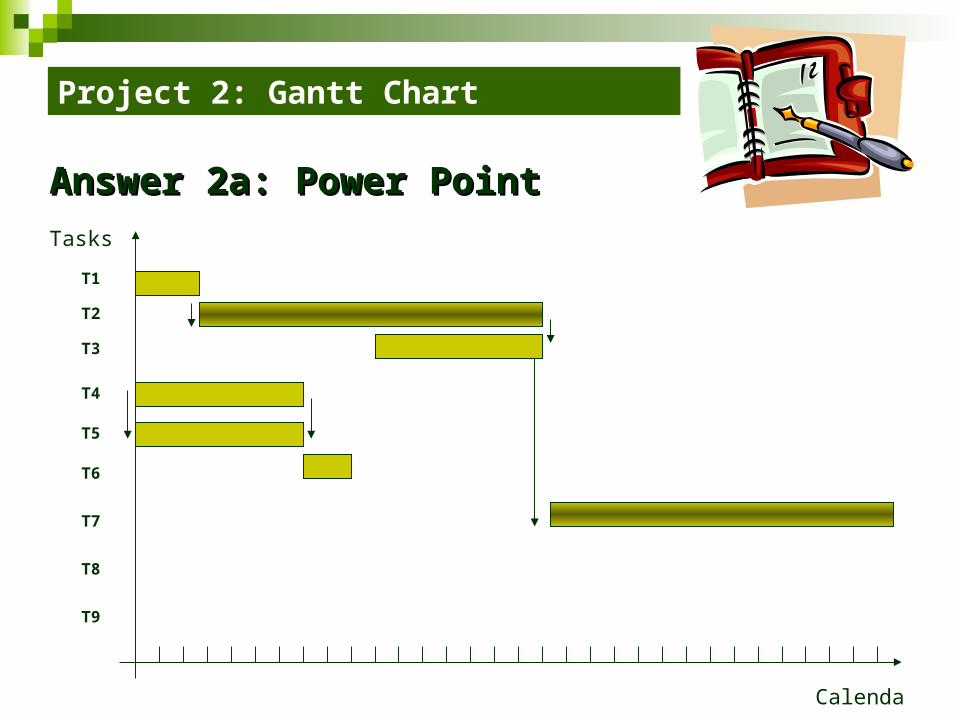
# TASK DURATION START FINISH Phase 65 days
T1 LOGO creation 3 01/06/2007 03/06/2007T2 The Conference Committee 14 04/06/2007 28/06/2007T3 The Programm of the Conference 7 21/06/2007 28/06/2007
T4 Logistics costs (accomodation, transport) 7 01/06/2007 07/06/2007
T5 Human recourses - the Conference team 7 01/06/2007 07/06/2007T6 Calculation, Break-even, Initial budget 2 08/06/2007 10/06/2007T7 Advertisment and promotion of the Conference 28 29/06/2007 26/07/2007
T8
Gathering and initial analyses of info about participants and sponsors
12 19/07/2007 28/07/2007
T9 Final DECISION!!! 7 29/07/2007 04/08/2007
Phase 1
The „mile stone” for phase 1 is: the decision about the conference is made.
Project 2: Gantt Chart
Answer 2a: Power PointAnswer 2a: Power Point
Tasks
Calendar
T1
T2
T3
T4
T5
T6
T7
T8
T9
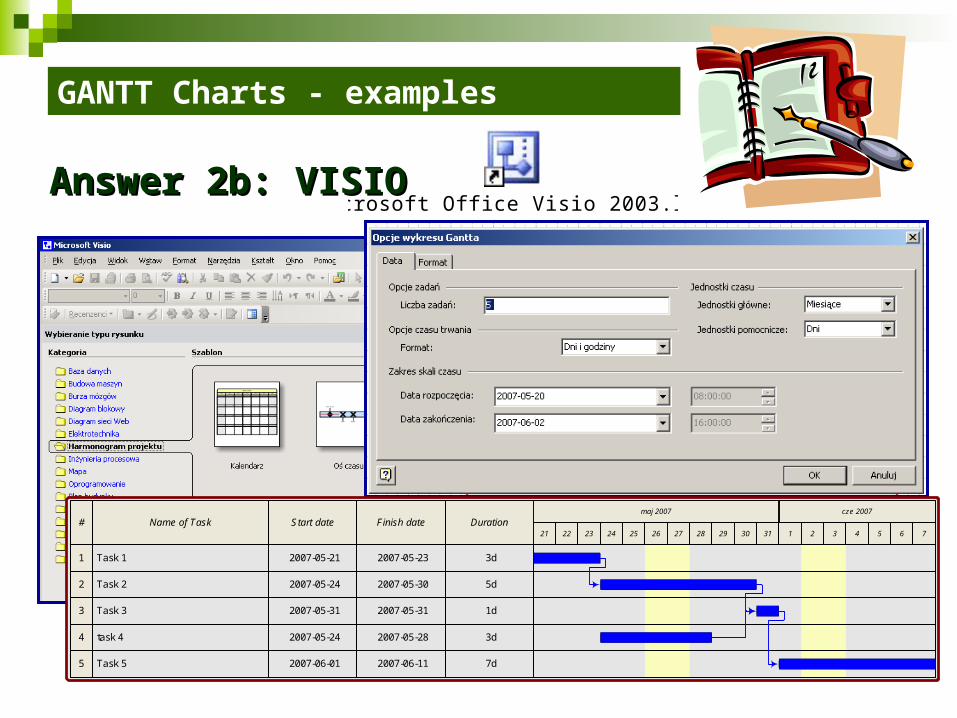
GANTT Charts - examples
Answer 2b: VISIOAnswer 2b: VISIOMicrosoft Office Visio 2003.lnk
# Name of Task Start date Finish date Durationmaj 2007 cze 2007
21 22 23 24 25 26 27 28 29 30 31 1 2 3
1 3d2007-05-232007-05-21Task 1
2 5d2007-05-302007-05-24Task 2
3 1d2007-05-312007-05-31Task 3
4 3d2007-05-282007-05-24task 4
5 7d2007-06-112007-06-01Task 5
4 5 6 7

6. PERT - The Program Evaluation and Review Technique
Methods and techniques of MBP
PERT
The Program Evaluation and Review Technique (PERT)
a technique (mean) that analyzes all tasks involved in completing a given project,
especially to analyze the time needed to complete each task, and identifying the minimum time needed to complete the total project (the critical path).
PERT was developed in the 1950’s, primarily to simplify the planning and scheduling of large and complex projects.
Definition:Definition:
http://en.wikipedia.org
PERT
An arrow-node diagram – a task network for a project made with arrows and small circles.
Definition:Definition:
http://en.wikipedia.org
A precedence diagram – a task network for a project made with boxes and realtionship lines.
PERT
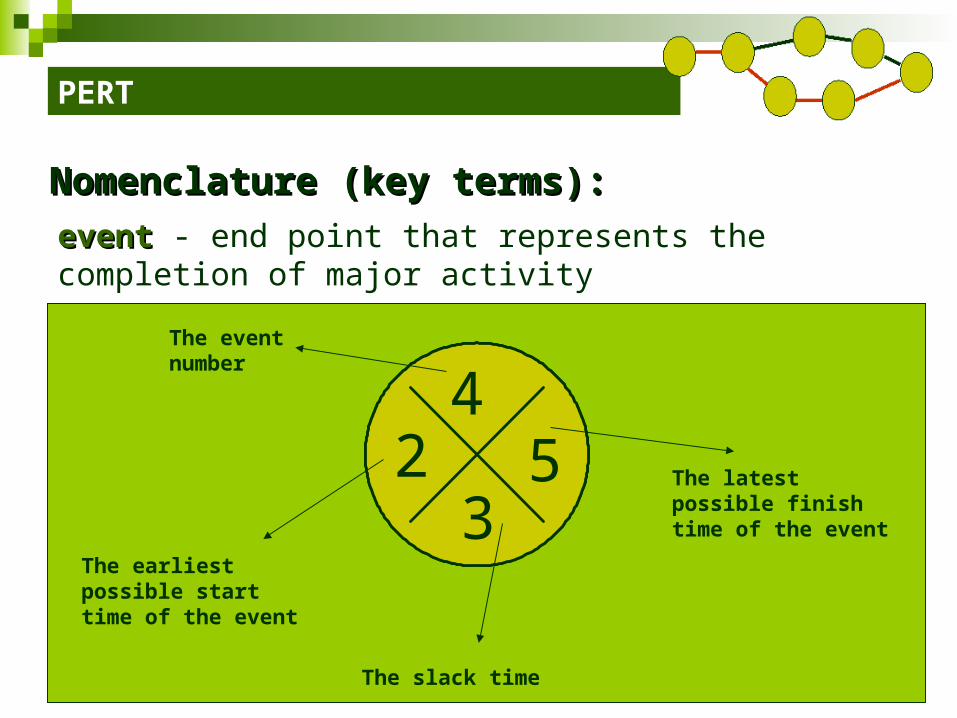
Nomenclature (key terms):Nomenclature (key terms):
23
54
23
54
The event number
The earliest possible start time of the event
The slack time
The latest possible finish time of the event
eventevent - end point that represents the completion of major activity
PERT
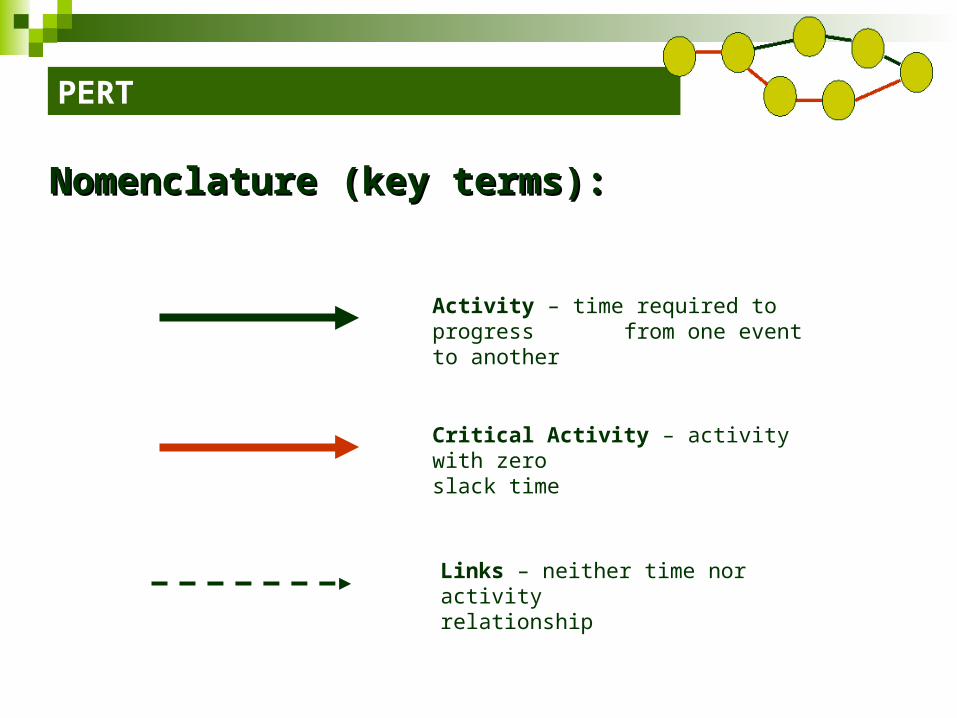
Nomenclature (key terms):Nomenclature (key terms):
Activity – time required to progress from one event to another
Links – neither time nor activity relationship
Critical Activity – activity with zero slack time
PERT
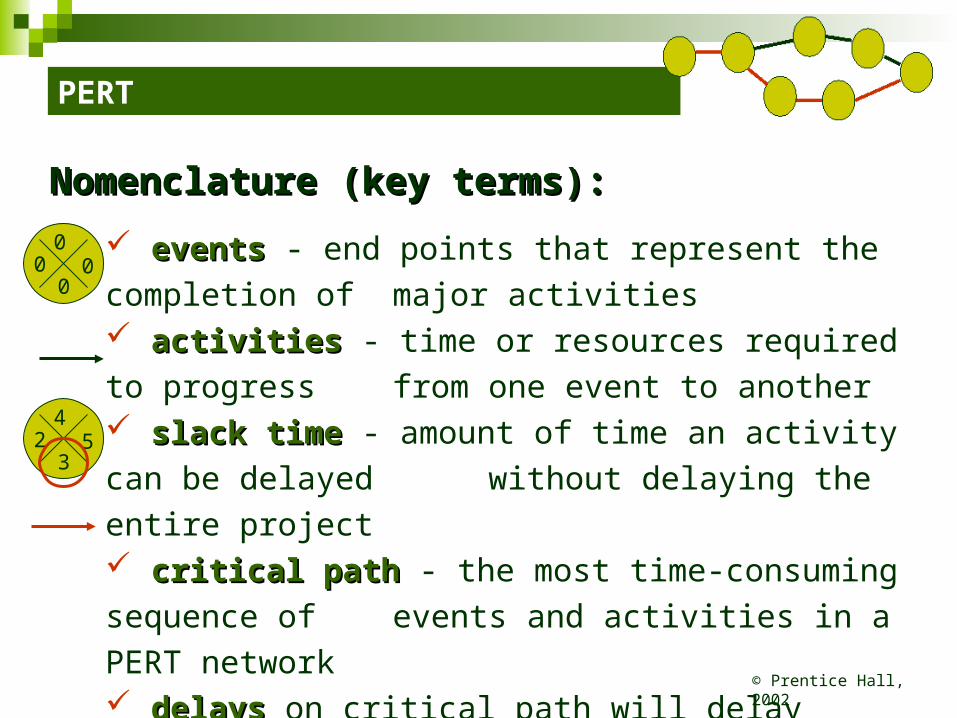
eventsevents - end points that represent the completion of
major activities activitiesactivities - time or resources required to progress
from one event to another slack timeslack time - amount of time an activity can be delayed
without delaying the entire project critical pathcritical path - the most time-consuming sequence of
events and activities in a PERT network delaysdelays on critical path will delay completion of the
entire project (zero slack time)
Nomenclature (key terms):Nomenclature (key terms):
© Prentice Hall, 2002
00
00
23
54
PERT
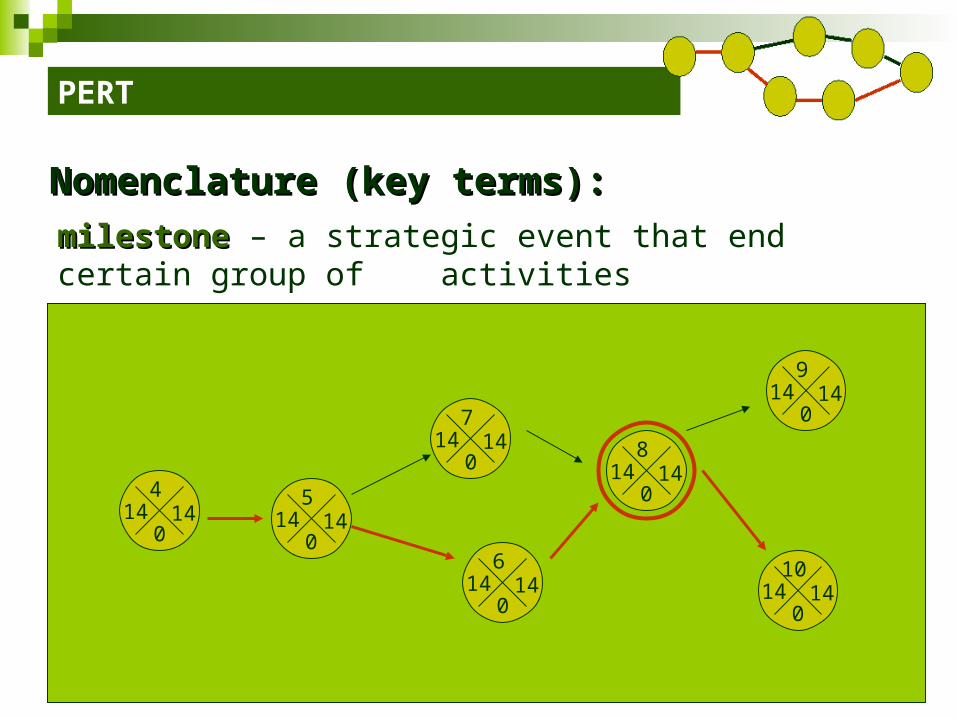
Nomenclature (key terms):Nomenclature (key terms):
milestonemilestone – a strategic event that end certain group of activities
140
14814
014
7
140
146
140
145
140
144
140
149
140
1410

PERT - methodology
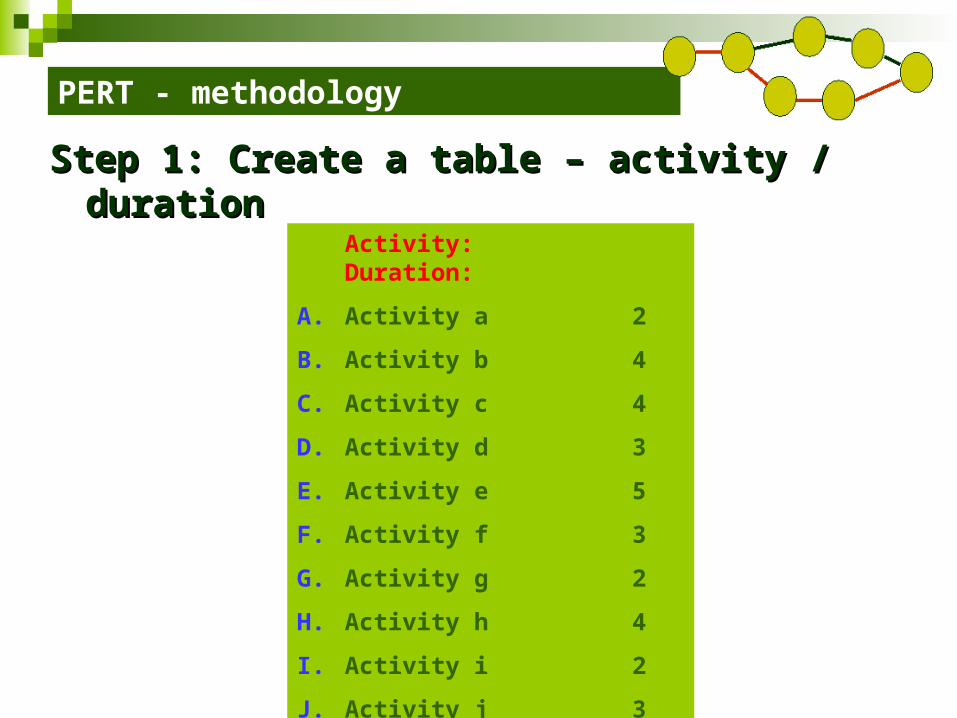
Step 1: Create a table – activity / durationStep 1: Create a table – activity / duration
Step 2: Step 2: NameName events accordingly to the table events accordingly to the table
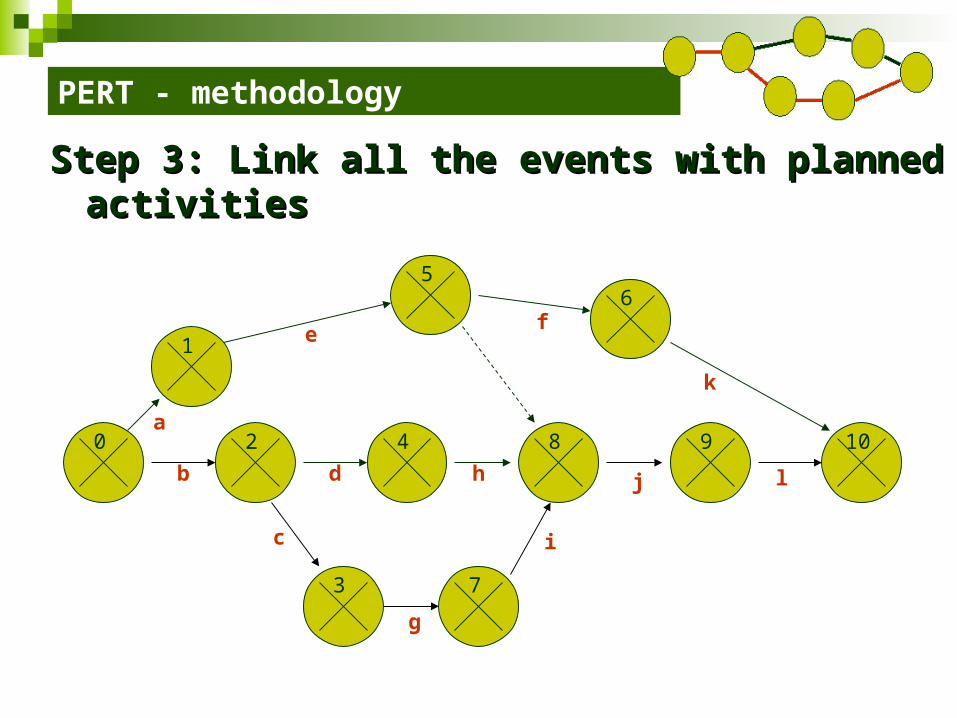
Step 3: Link all the events with planned activitiesStep 3: Link all the events with planned activities
Step 4: Add duration time for each activityStep 4: Add duration time for each activity
Step 5: Enter Step 5: Enter The earliest possible start time The earliest possible start time forfor everyevery event event
Step 6: Enter tStep 6: Enter the latest possible finish time fhe latest possible finish time foror everyevery event event
Step 7: Evaluate the slack time for every eventStep 7: Evaluate the slack time for every event
Step 8: Underline (in red) the critical path of the entire projectStep 8: Underline (in red) the critical path of the entire project
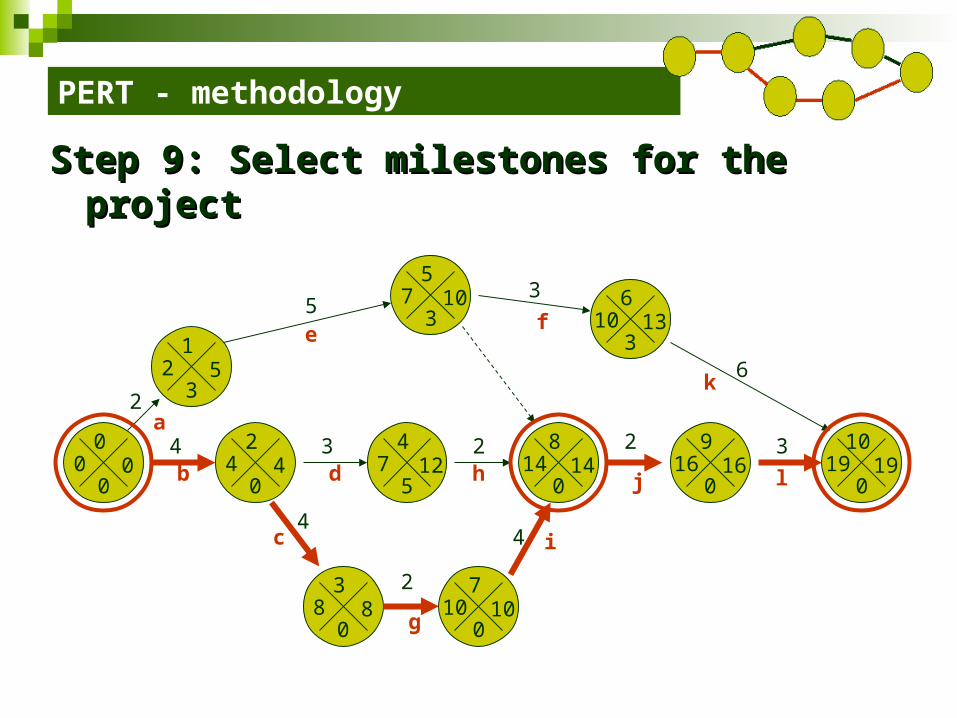
Step 9: Select milestones for the projectStep 9: Select milestones for the project
Procedure „step-by-step”:Procedure „step-by-step”:
PERT - methodology
Activity: Duration:
A. Activity a 2
B. Activity b 4
C. Activity c 4
D. Activity d 3
E. Activity e 5
F. Activity f 3
G. Activity g 2
H. Activity h 4
I. Activity i 2
J. Activity j 3
Step 1: Create a table – activity / durationStep 1: Create a table – activity / duration

PERT - methodology
Step 2: name events accordingly to the tableStep 2: name events accordingly to the table
0 2
4
8 9 10
1
5
3
76
PERT - methodology
Step 3: Link all the events with planned activitiesStep 3: Link all the events with planned activities
0 2 4 8 9 10
1
5
3 7
6
a
b
c
d
ef
g
h
i
j
k
l

PERT - methodology
Step 4: Add duration time for each activityStep 4: Add duration time for each activity
0 2 4 8 9 10
1
5
3 7
6
2
4
4
3
53
6
2
4
2
2 3a
b
c
d
ef
g
h
i
j
k
l

PERT - methodology
Step 5: Enter Step 5: Enter The earliest possible start time The earliest possible start time forfor everyevery event event
00
42
74
148
169
1910
21
75
83
107
106
2
4
4
3
53
6
2
4
2
2 3a
b
c
d
ef
g
h
i
j
k
l

PERT - methodology
Step 6: Enter tStep 6: Enter the latest possible finish time fhe latest possible finish time foror everyevery event event
0 00
4 42
7 124
14 148
16 169
19 1910
2 51
7 105
8 83
10 107
10 136
2
4
4
3
53
6
2
4
2
2 3a
b
c
d
ef
g
h
i
j
k
l

PERT - methodology
Step 7: Evaluate the slack time for every eventStep 7: Evaluate the slack time for every event
00
00
40
42
75
124
140
148
160
169
190
1910
23
51
73
105
80
83
100
107
103
136
2
4
4
3
53
6
2
4
2
2 3a
b
c
d
ef
g
h
i
j
k
l

PERT - methodology
Step 8: Underline (in red) the critical path of the Step 8: Underline (in red) the critical path of the entire projectentire project
00
00
40
42
75
124
140
148
160
169
190
1910
23
51
73
105
80
83
100
107
103
136
2
4
4
3
53
6
2
4
2
2 3a
b
c
d
ef
g
h
i
j
k
l
PERT - methodology
Step 9: Select milestones for the projectStep 9: Select milestones for the project
00
00
40
42
75
124
140
148
160
169
190
1910
23
51
73
105
80
83
100
107
103
136
2
4
4
3
53
6
2
4
2
2 3a
b
c
d
ef
g
h
i
j
k
l

Project 3Project 3: PERT
The International Conference Project

Project 5Project 5: PERT – MS Project
The International Conference Project

7. BEP – Break-even Point analysis
Methods and techniques of MBP

BEP – cost management
The break-even pointbreak-even point is the point at which the income from sales will cover all costs with no profits.
The break-even pointbreak-even point informs the business owner of the level of sales at which the business will realize neither a profit nor a loss.
The BEP technique BEP technique evaluates profit based on total cost and revenues for every given sales level.
The break-even point in economics is the point at which cost or expenses and income are equal.
Definition:Definition:
www.bizbound.com
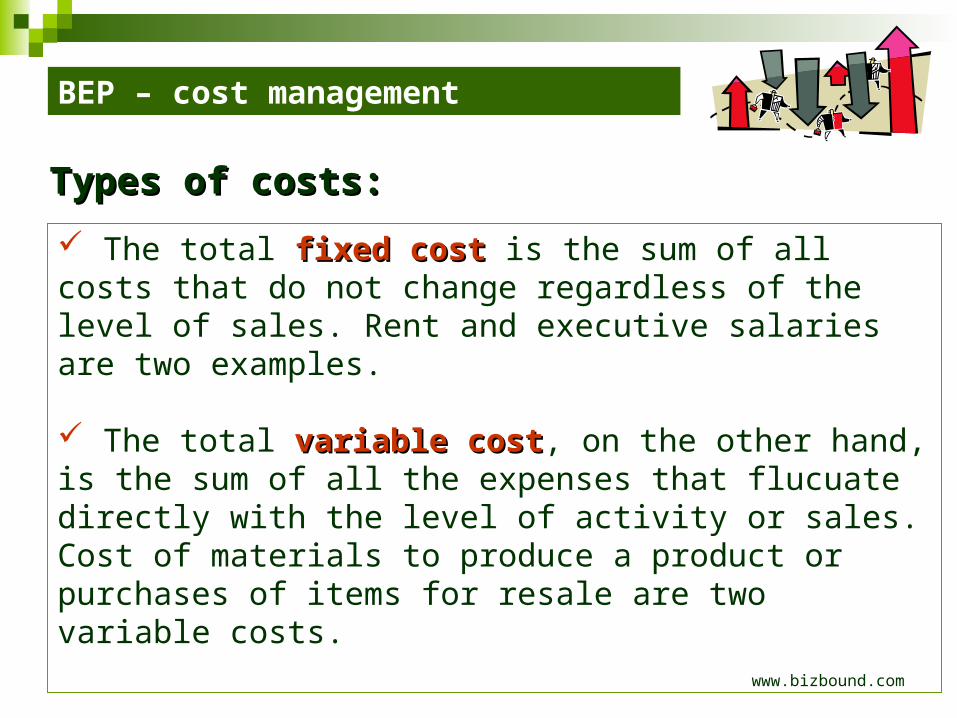
BEP – cost management
The total fixed costfixed cost is the sum of all costs that do not change regardless of the level of sales. Rent and executive salaries are two examples.
The total variable costvariable cost, on the other hand, is the sum of all the expenses that flucuate directly with the level of activity or sales. Cost of materials to produce a product or purchases of items for resale are two variable costs.
Types of costs:Types of costs:
www.bizbound.com

BEP – cost management
Expected unit sales: The number of units that are expected to be sold. Price: Price you will be able to receive per unit. Total costs: Sum of fixed costs and variable costs. Total revenue: Product of price and expected sale unit sales (example 10 units at $10 equals $100 total revenue). Profit: Total revenue minus total costs. Break-even: Number of units required to sell to make a profit of zero.
Definitions:Definitions:
www.bizbound.com
BEP – cost management
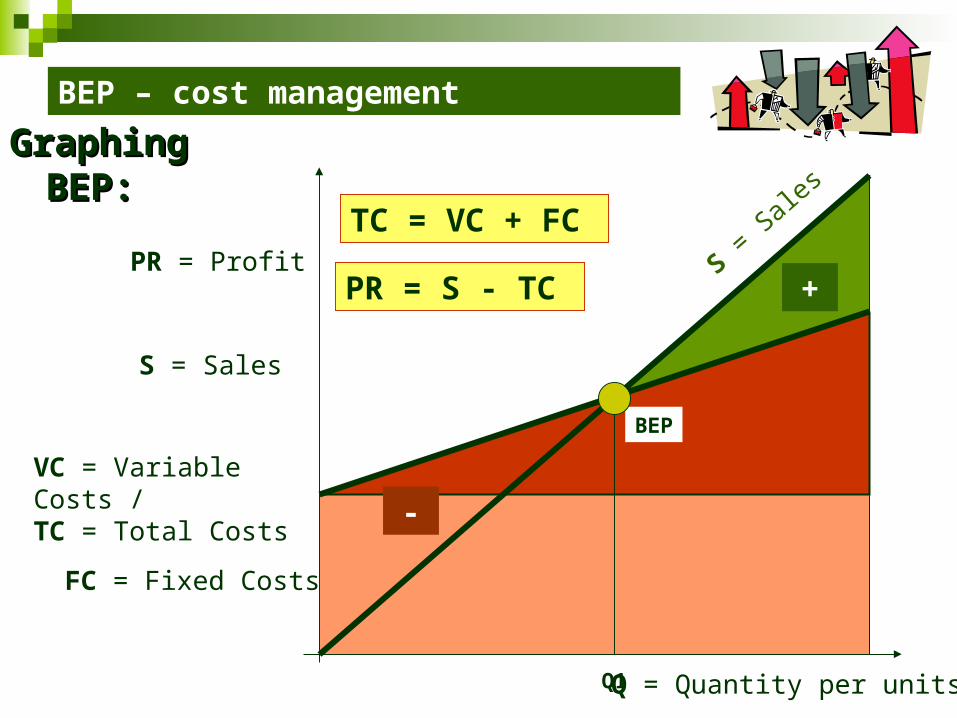
Graphing BEP:Graphing BEP:
FC = Fixed Costs
VC = Variable Costs /TC = Total Costs
S = Sales
Q = Quantity per units
+
-
TC = VC + FC
PR = S - TC PR = Profit
BEP
S = S
ales
Q1
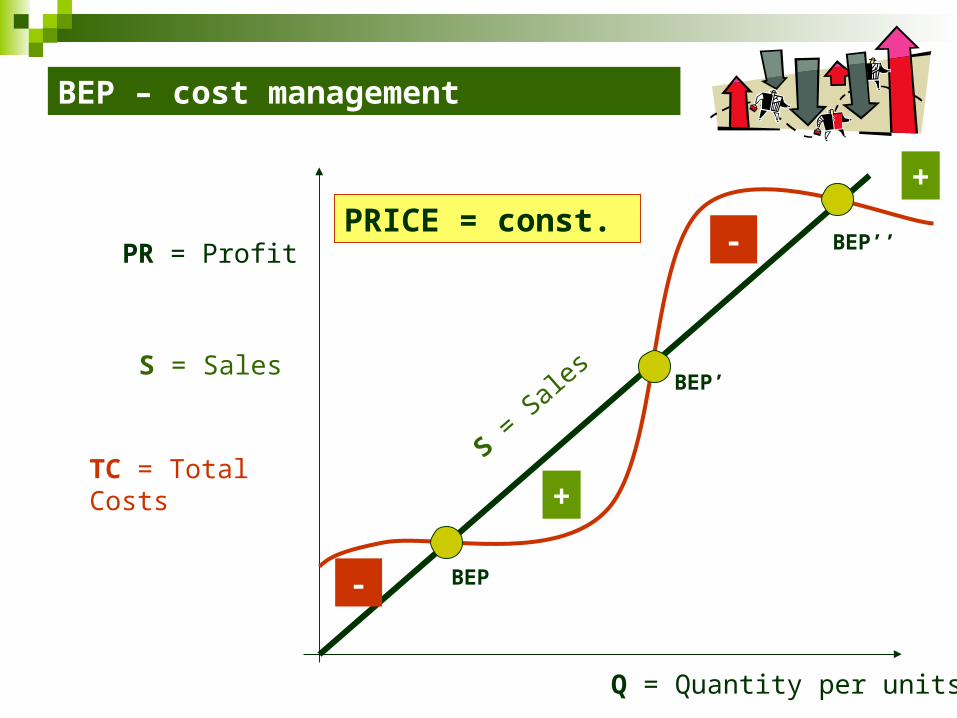
TC = Total Costs
S = Sales
Q = Quantity per units
PRICE = const. PR = Profit
BEP
S = S
ales
BEP – cost management
+
+
-
-
BEP’
BEP’’
BEP – cost management
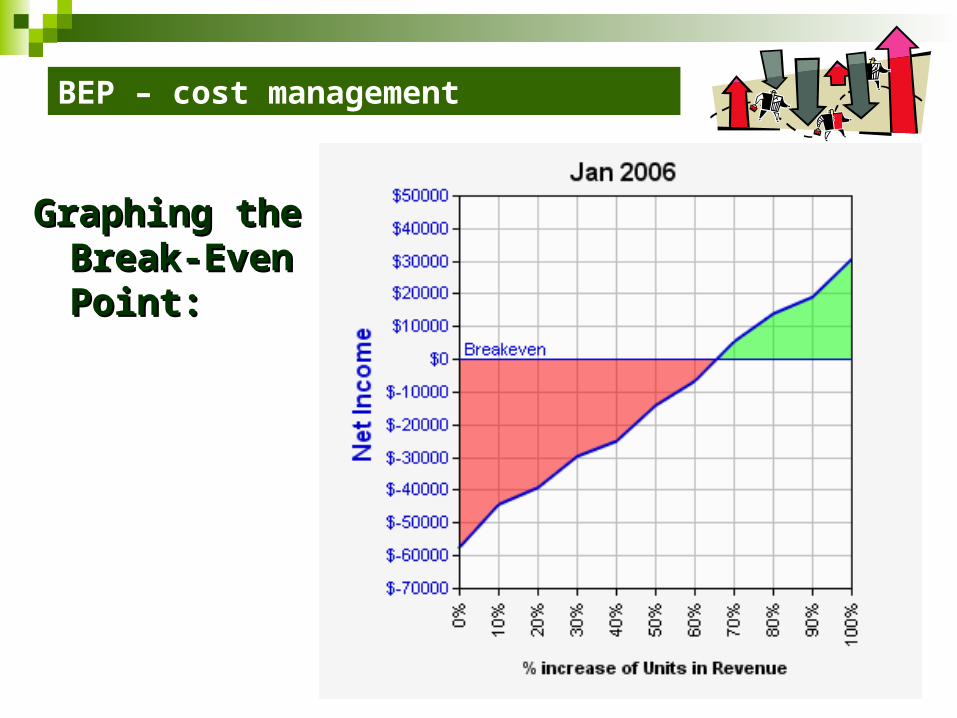
Graphing the Graphing the Break-Even Break-Even Point:Point:

BEP – cost management
BEP general formula:BEP general formula:
Q = FC / (UP - VC)
Q = Break-even Point, i.e., Units of sale (Q),
FC = Fixed Costs,
VC = Variable Costs per Unit
UP = Unit Price (UP > VC)
BEP – cost management
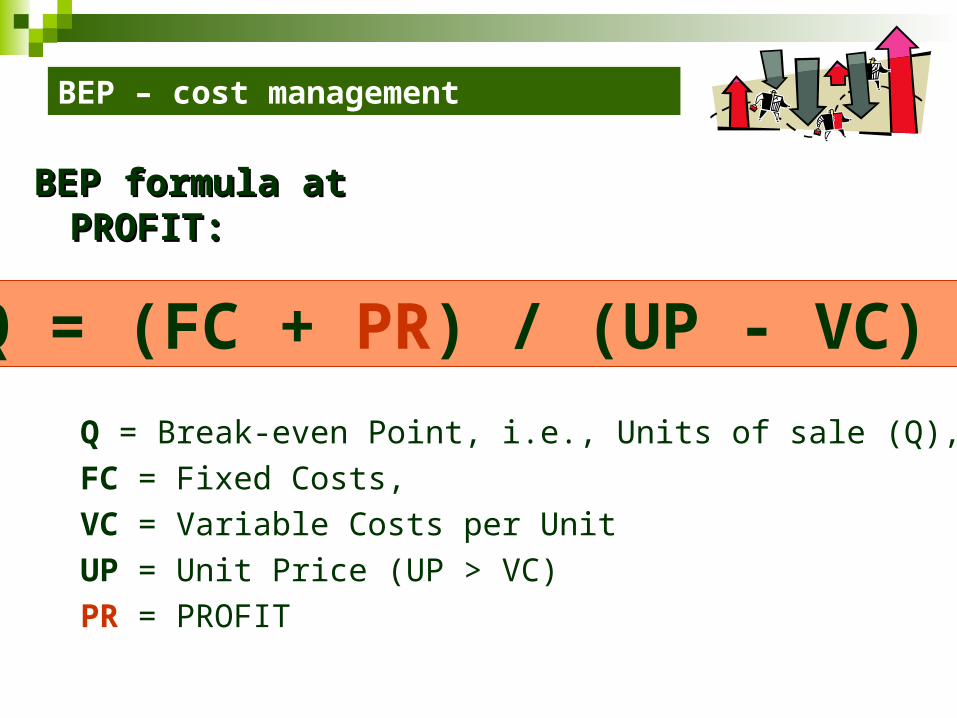
BEP formula at PROFIT:BEP formula at PROFIT:
Q = (FC + PR) / (UP - VC)
Q = Break-even Point, i.e., Units of sale (Q),
FC = Fixed Costs,
VC = Variable Costs per Unit
UP = Unit Price (UP > VC)
PR = PROFIT

Project 6Project 6: BEP analysis
The International Conference Project
Project 6: BEP analysis
1. By implementing BEP technique evaluate the best strategy for the International Conference Project
2. Present graphically your report by using the most appropriate graph model.
Tasks:Tasks:
Project 6: BEP analysis
1. Create a name list of all the Conference costs.2. Estimate the cost level for every cost element.3. Select fixed and variable cost.4. Copy the cost data into the BEP formula and present
deffirent cost strategy for the project.5. Present graphically your results.
Methodology:Methodology:

8. Project resources management
Methods and techniques of MBP
Resource allocation and coordination
Time management: Gantt charts, PERT
Cost management: BEP, budgeting and cost calculation
Task & event planning: 100% rule, WBS, MS Project
Monitoring and control: LOB, Gantt, Pert (MS Project)
Means and tools: software applications (MS Project,
Excel)
Resources allocation and coordination
What is PM ? Overview:What is PM ? Overview:

Resource allocation and coordination
Human resources: by whom?
Office infrustructure: where?
Office equipment: what tools?
Financial resources: how much and when?
Information resources: how? why? what for?
Time resources: how much time?
Cultural resources: what ethical profile?
Types of project resources:Types of project resources:
The International Conference Project
Project 7Project 7: ISO - Resources allocation

Project 7: ISO – resources allocation
Business Process Management by the ISO 9001:2000 Standards.
Main objective (mile stone) Input/ Output – resources / effects Task (functions) sequence list Participants Diagram Improvements !
Introduction:Introduction:

Project 7: ISO – resources allocation
Diagram:Diagram:Graph elements Description
Task / activity
What do you do?
r – responsible; p – partner; c – consulting; a – approve; si –
send information; oi – obtain information
Decision – alternatives – YES or NO
Archive – data collection
Record – track data recording
Another procedure / process integration
Links
p

Project 7: ISO – resources allocation
Example:Example:Participant
# Task
Comments
1
2
3
4
5
6
7
8
To fill in the visa form bythe applicant
Applicant
RR
University SPONSOR Clerk OFFICER
To sort out all visadocuments RR
To deliver the visa form and all documents to Polish Embassy RR
SiSi SiSi
OiOi
To process the visa form byPolish Embassy RRSiSi To perform the interview
SiSi SiSi
RRSiSi PP To make a decision To inform the applicant about the date of the visa delivery RROiOi OiOi OiOi
YES
NO
OiOi
To collect the passport with aprinted Polish visa RR
CC
AA
To start the study at the university in Poland
How to apply for Polish visa in India?
Project 7: ISO – resources allocation
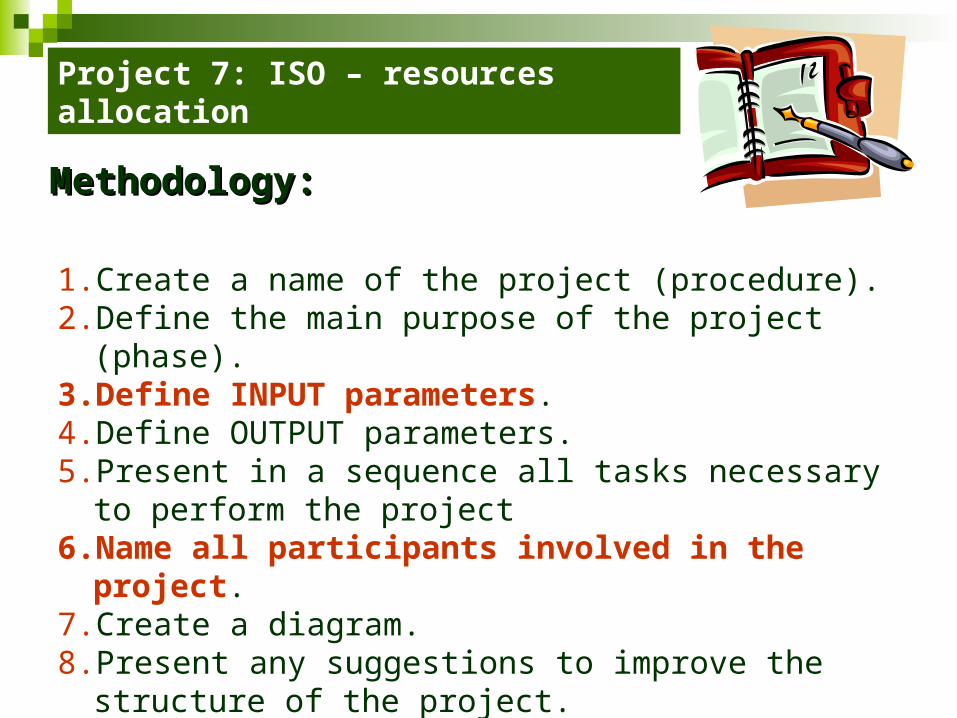
1. Create a name of the project (procedure).2. Define the main purpose of the project (phase).3. Define INPUT parameters.4. Define OUTPUT parameters.5. Present in a sequence all tasks necessary to perform the
project6. Name all participants involved in the project.7. Create a diagram.8. Present any suggestions to improve the structure of the
project.
Methodology:Methodology:
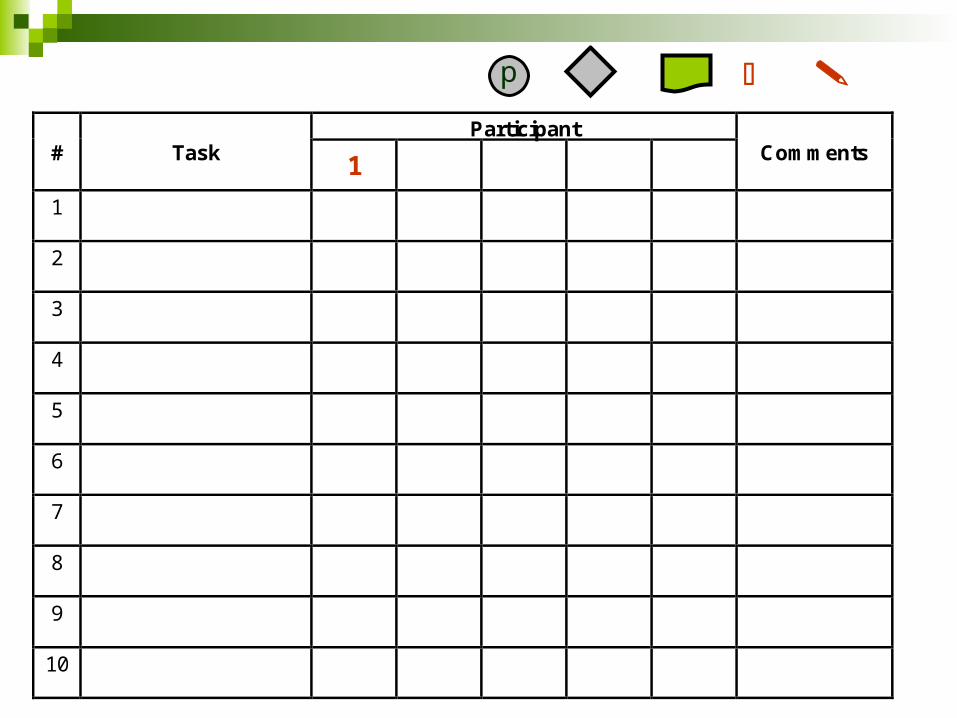
p
1
Participant # Task
Comments
1
2
3
4
5
6
7
8
9
10
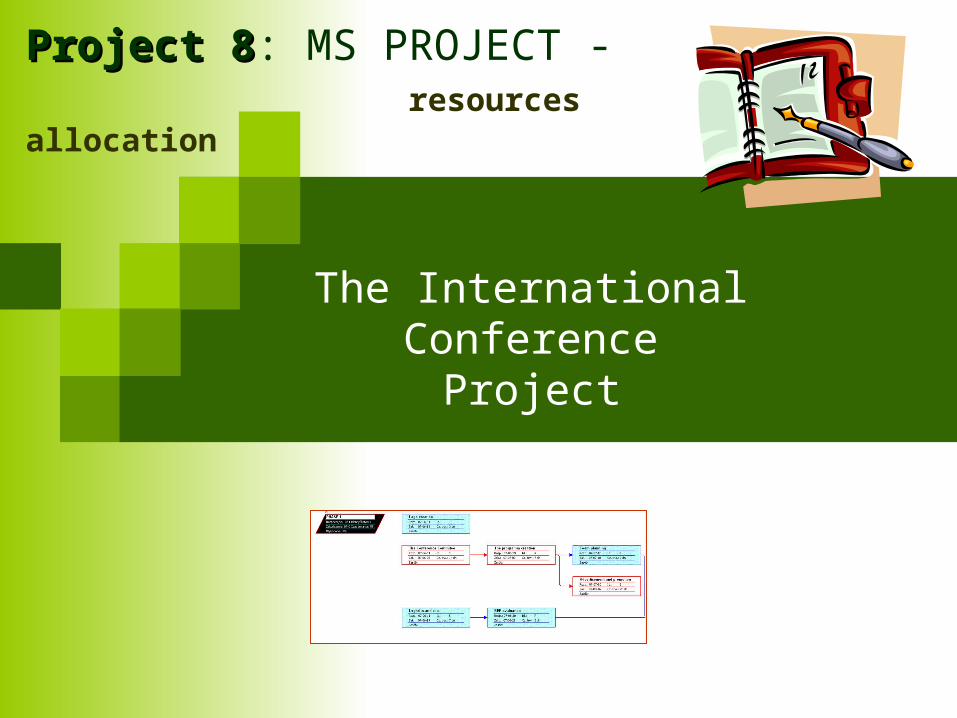
The International Conference Project
Project 8Project 8: MS PROJECT - resources allocation
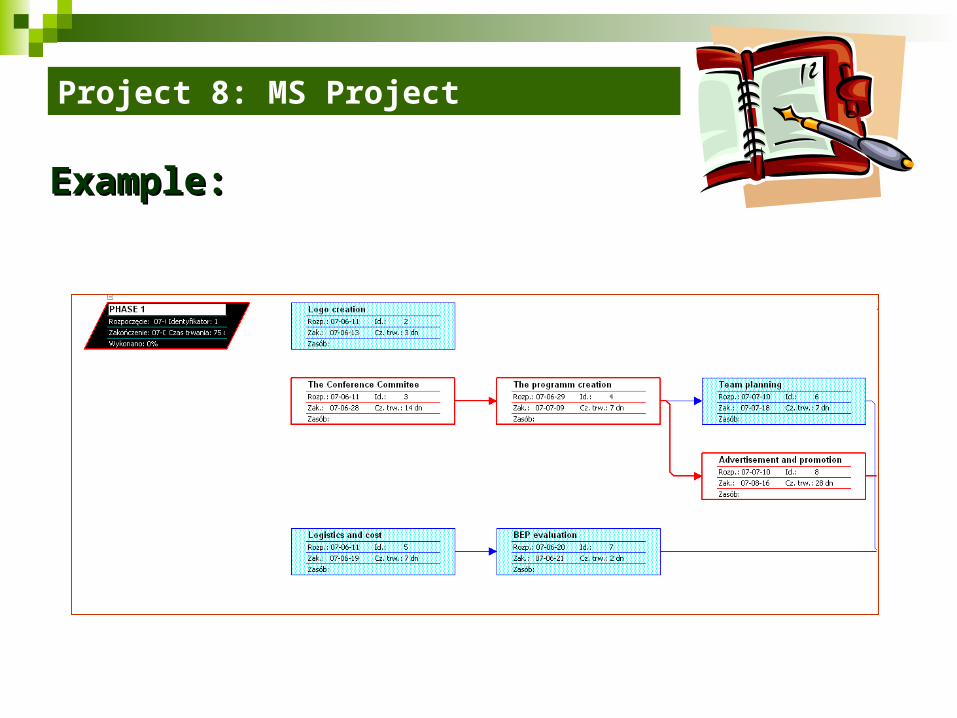
Project 8: MS Project
Example:Example:

The International Conference Project
Project 9Project 9: ECP / MS VISIO - resources allocation
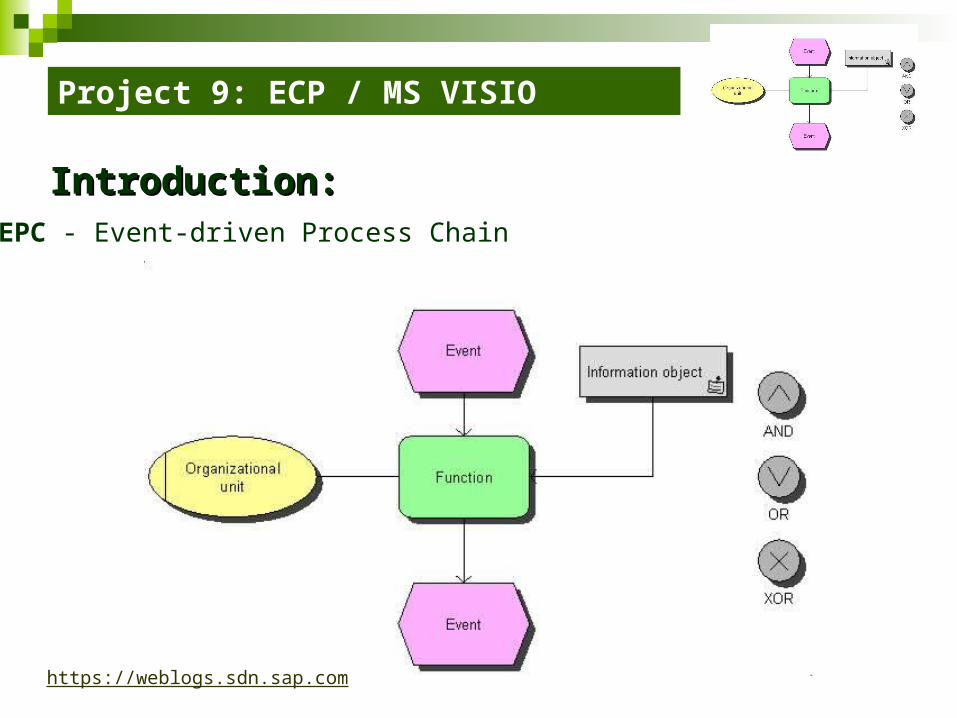
Project 9: ECP / MS VISIO
Introduction:Introduction:
https://weblogs.sdn.sap.com
EPC - Event-driven Process Chain

Project 9: ECP / MS VISIO
Businesses use EPC diagrams to lay out business
process work flows, originally in conjunction with SAP R/3
modeling, but now more widely.
There are a number of tools for creating EPC diagrams,
including ARIS Toolset of IDS Scheer AG.
The EPC method was developed within the framework of
ARIS by Prof. Wilhelm-August Scheer at the Institut für
Wirtschaftsinformatik at the Universität des Saarlandes in
the early 1990s.
Introduction:Introduction:
http://en.wikipedia.org

Project 9: ECP / MS VISIO
An EPC is an ordered graph of events and functions.
It provides various connectors that allow alternative and
parallel execution of processes.
It is specified by the usages of logical operators, such as
OR, AND, and XOR.
A major strength of EPC is claimed to be its simplicity
and easy-to-understand notation. This makes EPC a widely
acceptable technique to denote business processes.
Introduction:Introduction:
http://en.wikipedia.org
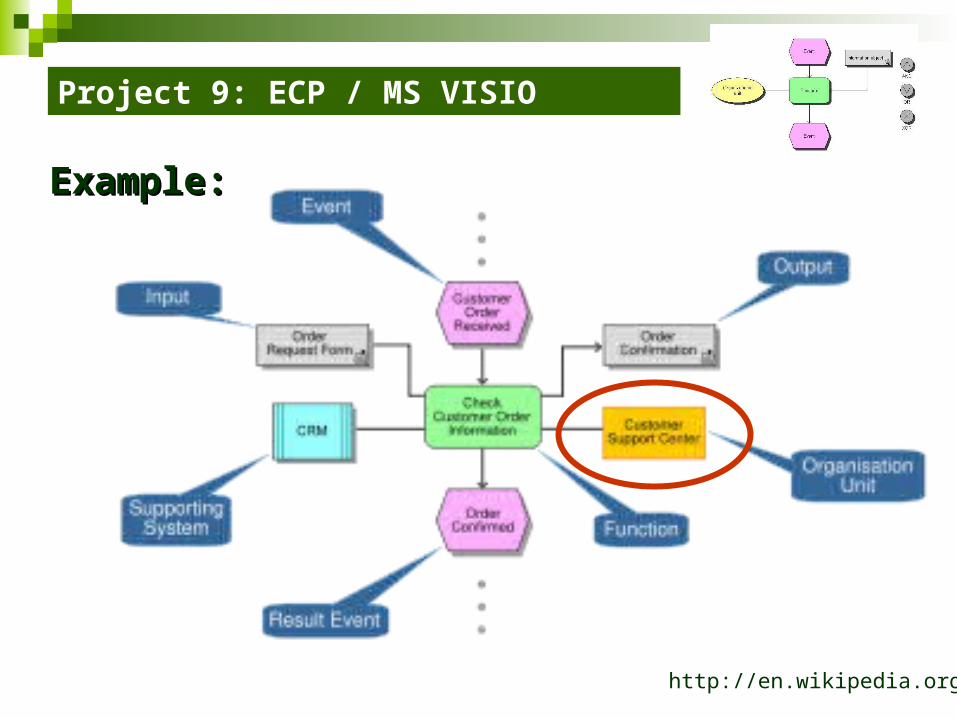
Project 9: ECP / MS VISIO
Example:Example:
http://en.wikipedia.org

Project 9: ECP / MS VISIO
EPC - Event-driven Process Chain
EVENT – describes a change
FUNCTION – describes an activity
PARTICIPANT – defines who performs the
function
LOGIC operator – describes alternatives
Introduction:Introduction:
EVENT FUNCTION
Zapytanie odebrano
Otworzyć Zapytanie
Klienta
Zapytanie Klienta
Otworzono
Skonfigurować Produkt
X
Zapytanie będzie
stworzone
Zapytanie Klienta
Otworzono
PARTICIPANT

Project 9: ECP / MS VISIO
EVENT – it is used to illustrate business
relevant causes and effects of any given action
(function). Every EPC starts and ends with an
event. An event can trigger or be the result of a
function.
Introduction:Introduction:EVENT
Zapytanie odebrano
Otworzyć Zapytanie
Klienta
Zapytanie Klienta
Otworzono
Skonfigurować Produkt
X
Zapytanie będzie
stworzone
Zapytanie Klienta
Otworzono
https://weblogs.sdn.sap.com

Project 9: ECP / MS VISIO
FUNCTION – illustrates actions,
operations or procedures which are business
relevant. They are the connector between the
Events and consume resources and time.
Functions can be modeled linear, parallel
or as alternative branches.
Introduction:Introduction: FUNCTION
Zapytanie odebrano
Otworzyć Zapytanie
Klienta
Zapytanie Klienta
Otworzono
Skonfigurować Produkt
X
Zapytanie będzie
stworzone
Zapytanie Klienta
Otworzono
https://weblogs.sdn.sap.com

Project 9: ECP / MS VISIO
Branch – gives you the possibility to model alternative
tracks of a process. There are three options:
AND AND (conjunction) – every function must be
executed / all events must occur.
OROR (disjunction) – at least one function must be
executed / one event must occur. But it is also
possible that all will be executed respectively occur.
XORXOR (exclusive OR) – exactly one function must be
executed / one event must occur.
Introduction:Introduction:
Zapytanie odebrano
Otworzyć Zapytanie
Klienta
Zapytanie Klienta
Otworzono
Skonfigurować Produkt
X
Zapytanie będzie
stworzone
Zapytanie Klienta
Otworzonohttps://weblogs.sdn.sap.com

Project 9: ECP / MS VISIO
Organizational unit (Participant)Organizational unit (Participant) - Organization units determine which person or
organization within the structure of an enterprise is
responsible for a specific function. Examples are “sales
department”, “sales manager”, “procurement manager”,
etc. It is represented as an ellipse with a vertical line.
Organization unit assignments show the connection
between an organization unit and the function it is
responsible for.
Introduction:Introduction:
Zapytanie odebrano
Otworzyć Zapytanie
Klienta
Zapytanie Klienta
Otworzono
Skonfigurować Produkt
X
Zapytanie będzie
stworzone
Zapytanie Klienta
Otworzono
PARTICIPANT
http://en.wikipedia.org
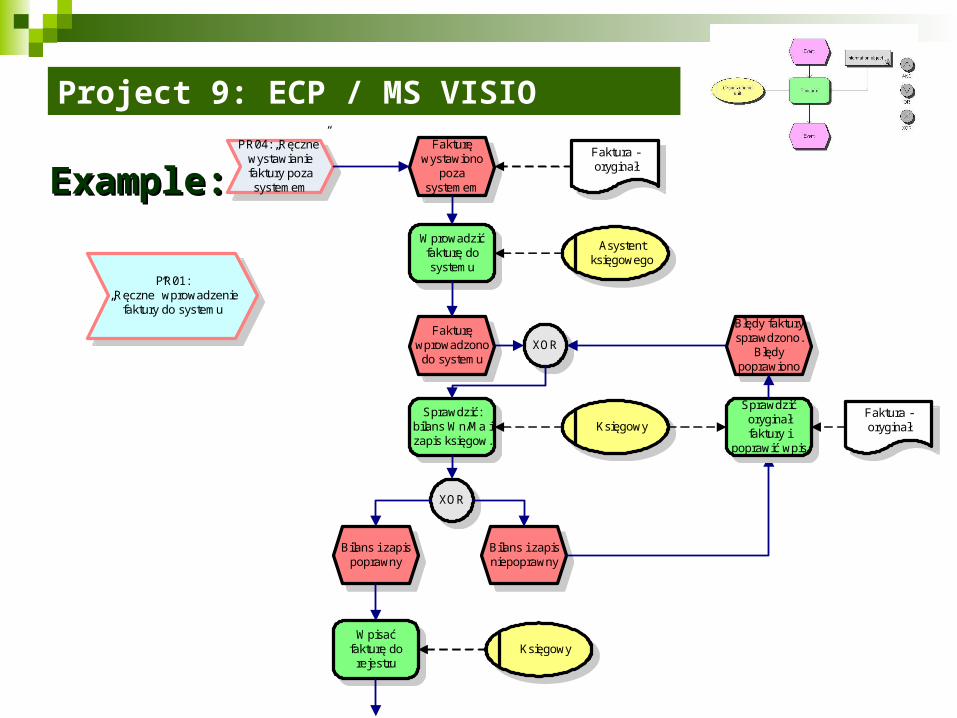
Project 9: ECP / MS VISIO
Example:Example:
PR01: „Ręczne” wprowadzenie
faktury do systemu
Fakturę wystawiono
poza systemem
Wprowadzić fakturę do systemu
Fakturę wprowadzono do systemu
Sprawdzić: bilans Wn/Ma i zapis księgow.
Bilans i zapis poprawny
Bilans i zapis niepoprawny
XOR
Sprawdzić oryginał faktury i
poprawić wpis
Błędy faktury sprawdzono.
Błędy poprawiono
Księgowy
Asystent księgowego
Wpisać fakturę do
rejestruKsięgowy
PR04: „Ręczne” wystawianie faktury poza systemem
XOR
Faktura - oryginał
Faktura - oryginał

Project 9: ECP / MS VISIO
Diagram:Diagram:„„manual”manual”
VISIOVISIO
ARISARIS
9. Cash Flow analysis
Methods and techniques of MBP

Cash Flow analysis: cash streams
t = time
start
Cash at hand
inflow
outflow

10. Communication techniques - information resources
Communication techniques
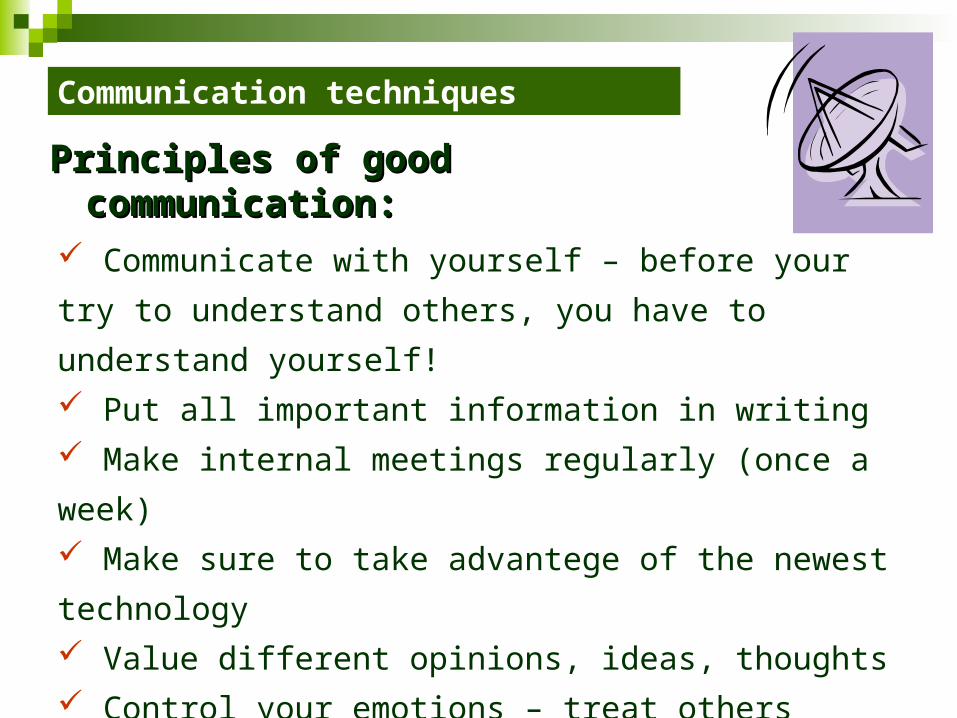
Communicate with yourself – before your try to
understand others, you have to understand yourself!
Put all important information in writing
Make internal meetings regularly (once a week)
Make sure to take advantege of the newest technology
Value different opinions, ideas, thoughts
Control your emotions – treat others right
Listen to your business partners – take your time!
Be open minded, look around – search for new ideas
Principles of good communication:Principles of good communication:

Communication techniques
A new model of organization:A new model of organization:
Communication techniques
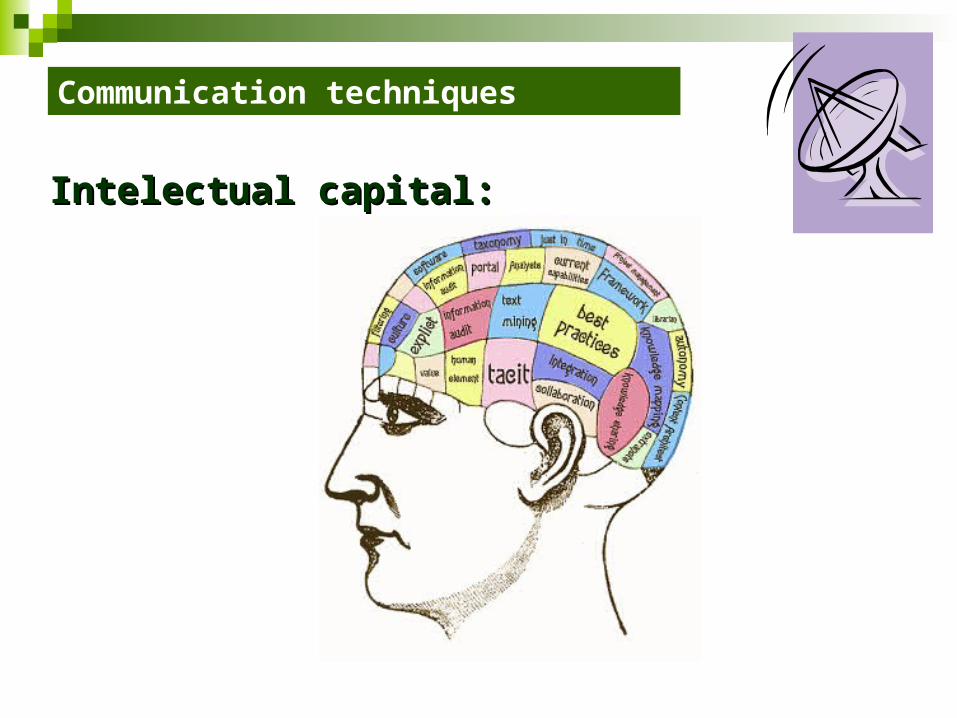
Intelectual capital:Intelectual capital:
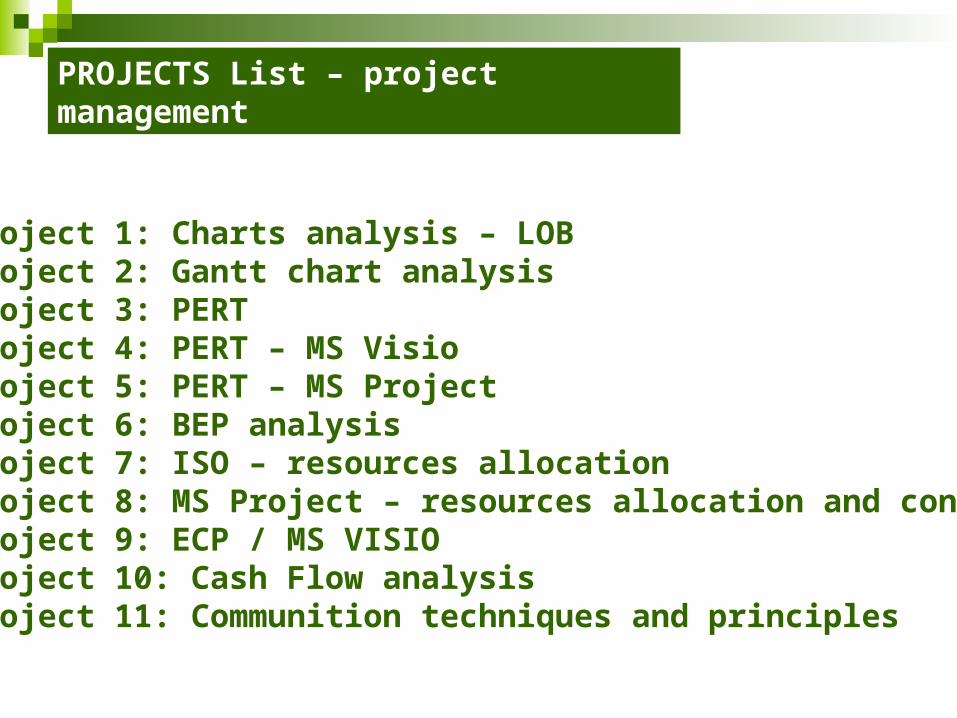
PROJECTS List – project management
Project 1: Charts analysis – LOBProject 2: Gantt chart analysisProject 3: PERTProject 4: PERT – MS VisioProject 5: PERT – MS ProjectProject 6: BEP analysisProject 7: ISO – resources allocationProject 8: MS Project – resources allocation and controlProject 9: ECP / MS VISIOProject 10: Cash Flow analysisProject 11: Communition techniques and principles