project evaluation h.d. kote potable water … · mysore district, karnataka, india february, 1991...
TRANSCRIPT

PROJECT EVALUATION
OF THE
H.D. KOTE POTABLE WATER PROJECT
MYRADA/PLAN - H.D. KOTEMYSORE DISTRICT, KARNATAKA, INDIA
FEBRUARY, 1991
Lyndon NaveraProject Evaluation CoordinatorImpact Evaluation Systems UnitPLAN International

1. EXECUTIVE SUMMARY/
The Myrada/PLAN (M/P) potable water project in H.D. Kote began in FY 1985 under PLAN'Sprimary health care program to provide accessible, sufficient and safe drinking water to thevillages. As of August, 1990, 73 M/P water systems had been initiated and these representa major portion of the existing water systems in H.D. Kote. Although the project has broadpotential Impact on the lives of the village people, It has not achieved its objectives to date:
implementation is burdened with construction delays,
only a minority of the expected beneficiaries have access to the M/P water systems
because few systems have been commissioned, and
based on the test results, water quality Is unsatisfactory in the commissioned systems.
The Project Evaluation (PE) was requested by the International Relations Department fordonor accountability to AIDAB and for institutional learning, it was conducted In August,1990. The PE Report was delayed due to the lack of water test results.
Background
The PLAN field office in H.D. Kote was established in 1982 in partnership with a local non-
government organization, the Myrada Resettlement and Development Association (Myrada). This
partnership was geared towards establishing an integrated rural and community development
program covering all the 317 H.D. Kote villages with the aim at improving the well-being of the
children, the families and their communities.
The potable water project of Myrada/PLAN is in conjunction with the National Rural Water Supply
Program's massive drilling of boreweils undertaken in the early eighties. About 75% of the M/P
initiated water systems were tied to these existing government-drilled boreweils. This project is
being implemented in coordination with the local government unit, Zilla Parishad (Z/P), and each
individual project implementation is broken down into an M/P portion and a Z/P portion. M/P does
the planning and design with the participation of the beneficiaries. The M/P portion includes the
construction of water tanks, the pipeline distribution and the construction of standposts (i.e., taps
supported by concrete slabs). The Z/P handles the drilling of boreweils (through the Public Health
Engineering Department: PHED), construction of the raising main and the installation of the 3-
phase electricity (through the Karnataka Electricity Board: KEB). Operation and maintenance is
handled by the village level government administrative unit, Mandal.
1.1 Planning and Community Participation
The community participates in the planning stage of the project. The village CreditManagement Group {CMG) initiates the project and forms a water committee to mobilize communitycontribution. The committee also monitors the construction of the project.

1.2 Technical Review
1.2.1 Systems Design
Water is distributed to households through centrally located communal standposts. Ideally,taps or standposts should have corresponding platforms and spillways for waste-waterdisposal. The systems design usually does not Include platforms and spillways.
; The wastewater disposal (drainage and spillways) Is not integrated with the planningand design of the water system. Platforms sre not included In the design portion of mostof the FY 1989-90 POOs that were reviewed. While the systems provide drinking water tothe villages, they pose a potential health hazard because of poor drainage.
1.2.2 Water Quality
The government (PHED) does not conduct water quality tests (bacteriological orchemical/physical) on new or existing borewells. M/P also does not conduct such testsbefore or after construction of the tanks. Water testing is not part of the normal procedureof either the government or M/P before commissioning of the systems. The household userstherefore are not assured that what they drink is safe.
The water quality tests show that only 2 out of the 9 samples taken from the mainsources were potable. This was based on the World Health Organization (WHO)guideline values for drinking water. The other 9 samples that were collected fromhousehold containers were all positive with conforms, a group of organisms commonlyused as Indicators of pollution. These test results require follow-up testing to accuratelyassess water quality so that immediate measures are taken to Improve quality.
1.3 Implementation
1.3.1 Construction Phase
There have been regular delays In the construction of both the M/P and the Z/P portionsof projects. The average period of M/P delay is 1 1/2 years snd is due to the contractorsand the current M/P policy of hiring only local (H.D. Kote-based) contractors. The
/ :<•-•"•-' r Contractors' delays are caused by their multiple contracts and also by their limited workingf _ $ f *7j0*"*capital. The M/P policy of hiring only local contractors further delays construction because
00(V/ ' there are few competent contractors in the area. There are only 8 local contractors availableJ/ to build 42 water systems.
iu ' A Three water system projects in the Madapura sub-office are currently delayed due to the^ contractors. In the Sargur sub-office, 4 systems that were started in FY 1988 were delayed,
/ 2 of which are still to be completed (Nanjipura and K.H. Shed).
The average Z/P delay Is 1 year. The delay l« due to the government bureaucracywhich affects the timely disbursements of funds for the project. According to one Project
Officer, about 60% of all M/P water systems have been or are currently delayed.
These construction delays translate Into:
(a) delays In providing water to the villages,
(b) likely increases in the cost of materials by the time purchases are made due toInflation and shortage of supply,
(c) higher depreciation costs Incurred for materials already purchased or installedprior to the commissioning of water systems, and
(d) In some cases, pilferage of available materials.
1.4 Project Results
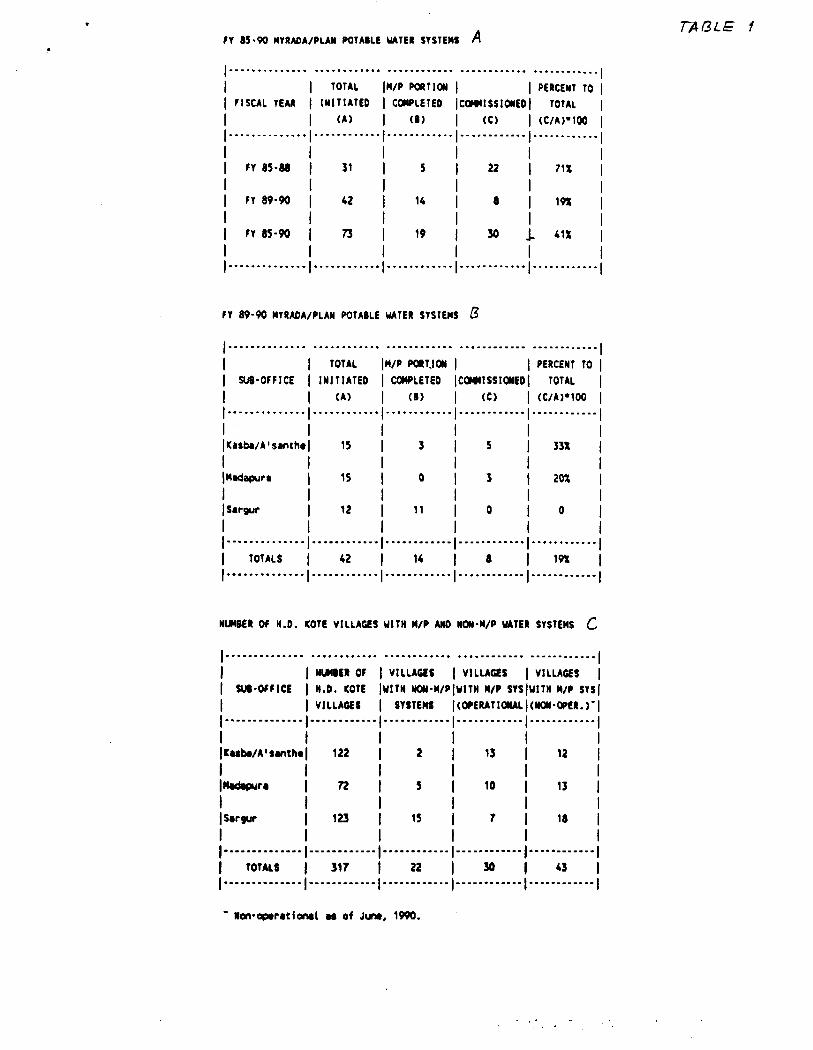
Overall, Myrada/PLAN has initiated a total of 73 water systems for the period FY 1985-90 which
represent 77% of the 95 systems in H.D. Kote Taluk (town). Only 30 (41%) of these M/P systems
have been commissioned or are operational and 19 have their M/P portion completed.
Of these 73 systems, M/P initiated 42 systems during the AIDAB grant years (FY 1989-90) and
to date, only 8 (19%) of the 42 have been commissioned.
This low number of commissioned water systems in relation to the number of systems that had
been initiated was due to delays in the construction and in the release of funds by the Zilla
Parishad. This therefore limits the number of target beneficiaries. In the Kasba/A'santhe sub-
offices, only 5 were commissioned out of the 15 systems that were initiated in FY 1989-90. These
5 systems currently benefit only 755 families (34%) of the expected 2212 family beneficiaries.
BACKGROUND
2.1 General Background
Access to potable water1 is one of PLAN'S health sector goals. The other health goals are childsurvival and sanitation. Under PLAN'S primary health care program, field offices seek to providePLAN families with adequate potable water as part of basic hygiene and sanitation. In India asin other program countries, the construction of water systems is a major activity of the healthsector.
The International Drinking Water Supply and Sanitation Decade (1981-90) was established by theUnited Nations to accelerate progress on potable water and sanitation. For the period 1980-87,56% of the total Indian population (802 million in 1987) had access to clean water, with 80% ofthe urban population and 47% of the rural population having access (The State of the World'sChildren 1989,' UNICEF)- This was a substantial gain from the period 1975-80, when only 41%of the total population had access to clean water. This progress was due to technical advancesand to more efficient strategies that reduced the per capita cost of providing a clean water supply.The average cost for the installation and use of hand-pumps supplying fresh water close topeople's homes in hard-rock areas of India is less than 60 cents per person per year as calculatedby UNICEF's New Delhi office (The State of the World's Children 1985,' UNICEF). More efficientstrategies include community involvement in the planning, siting, construction, installation andmaintenance of its own water supply, and the community's training and education on basichygiene and disease prevention. It is known that clean water has very little impact on healthunless communities are well Informed about hygiene. Also, most governments are now agreedthat piping water to conveniently located standposts in each community (instead of putting tapsin each home) is the strategy that stands the most chance of making clean water available to all2.These gains in both technique and strategy have reduced the cost of clean water supply to about$1 or $2 per person per year in Asia In Africa and Latin America, annual per capita cost is about$5 per person.
Despite this progress, 60% of families in the rural areas of the developing world are still withoutpotable water. In the urban areas, 23% do not have access to clean water. One out of everythree people in the developing world who lack clean water and adequate sanitation, is Indian3.
In light of the above, PLAN field offices have initiated the objective of providing safe drinking
water to PLAN and non-PLAN families through the construction and repair of water systems and
Accessibility refers to the distance of the house to the water source. PLAN'S objective is toput in place the water source within the locally agreed distance (e.g., 100 meters) from housesites through the construction of communal taps.
It should be recognized that a risk of contamination from water point to consumption existsunder this model.
'Safe Water and Waste Disposal for Rural Health: A Program Guide,' USAID, 1982, p. 9.
4

have been educating communities about basic hygiene and the proper use of PLAN'S health-related facilities such as latrines, urinals, health clinics, and drinking water systems.
2.2 Background of H.D. Kote Potable Water Project
Meggadadevanakote (H.D. Kote) is a town (Taluk) in the Mysore district of the state of Karnataka
in the southern part of India It has an area of 1,618 square kilometers and a population of about
35,474 families. The Myrada/PLAN program area covers all the 317 H.D. Kote villages and
currently implements programs which provide assistance to 48% of the total number of families in
the Taluk: 10.447 PLAN families (APR, FY 90) and 6,704 of the 25,027 non-PLAN families (as of
December 1989).
In the early eighties, the government drilled 677 borewells^to provide drinking water to all the
villages in H.D. Kote (SAGE, 1986). As of 1986, only 20% of these borewells proved reliable,
supplying sufficient water. Thirty percent (30%) of the borewells were either dry (100 units) or not
\J) functioning (100 units) due to defective hand pumps, and about fifty percent (50% or 347 units)
' c<y -} were yielding less than 500 gallons per hour. The major sources of drinking water therefore
\% AS* ' remained open wells, ponds and canals.
To provide safe and adequate drinking water year round, Myrada/PLAN (M/P) initiated a potablewater project in H.D. Kote in fiscal year 1985 with the implementation of 7 water systems, fundedsolely by the field office (FO). This involved the construction of M/P-built 4,000-gallon water tanks.In fiscal year 1987, the project was implemented in coordination with and with the contribution ofthe district level government called Zilla Parishad (Z/P). The Z/P handled the drilling, raising main4,and electrification components of water systems. As of August, 1990, there have been 73 watersystems initiated by the FO, 31 of which are commissioned or operational. These water systemsrepresent about 77% of the total (95) water systems in H.D. Kote, operational or underconstruction.
About 75% of the 73 M/P water systems had existing borewells from the government drilling
program described above. Under the National Rural Water Supply Program, hand pumps were
installed to these borewells and in some cases, mini-water tanks (500 gallons) connected to them.
Figure 1 shows the project phases of the potable water project: from the initiation of the villageCredit Management Group (CMG)5 to the preparation of the Project Design Outline (PDO) to thecommitment made by the Z/P. Construction by M/P starts after the selection of a contractor.
Raising main is the pipeline distribution from the borewell to the tank.
The CMG, formerly known as the village development association (VDA), is a small villagefunctional group of PLAN families with similar needs and circumstances. It is organizedaround health, education and income-generation concerns. Its projects are funded byMyrada/PLAN through a revolving fund mechanism. To date, there is a total of 452 CMGs(sanohas) in M/P H.D. Kote.

After full completion of the construction phase, the system is commissioned and is operated andmaintained by the village level government called MandaJ6.
2.3 Myrada/PLAN H.D. Kote Organizational Set-Up
Until the last fiscal year, the FO had 3 sub-offices: Kasba, Madapura and Sargur. This fiscal year,
1991, the Kasba sub-office has been split into Kasba and Antharasanthe sub-offices. A Project
Officer (PO) heads each sub-office and supervises all the decentralized programs of the FO. He
reports to the Project Coordinator (PC) who is equivalent to PLAN'S Field Director.
Each sub-office is further subdivided into 'clusters of villages'. A Cluster Officer supervises hisor her designated cluster of villages and reports to the PO. The Extension Officers handle theCMGs in the villages and report to their Cluster Officers. Each sub-office has also Its own staffof Subject Matter Specialists who handle specific sectoral activities, an Assistant Accountant whomanages the sub-office books of accounts and an administrative group responsible mainly fordonor services. The Subject Matter Specialists (e.g., Health) in the sub-office coordinate activitieswith their corresponding FO Subject Matter Specialists (e.g., FO Health Coordinator).
Figure 2 shows the organizational structure of M/P H.D. Kote.
3 POTABLE WATER PROJECT GOALS AND OBJECTIVES
The SAGE goal for the health sector is to improve the health status of the entire population ofH.D. Kote. An indicator for this improvement is the reduction of the infant mortality rate to 50per 1000 by 1992 (SAGE, 1986)7. Under the primary health care program, one of the majoractivities for achieving this goal is to repair or expand existing government drinking water facilities,and construct new ones. The overall objective of the potable water project therefore is to provideMyrada/PLAN villages access to a safe and adequate drinking water supply, thereby contributingto a reduction in the incidence of water-borne diseases.
4 PROJECT EVALUATION PURPOSE AND METHODOLOGY
The International Relations Department requested that a Project Evaluation (PE) be conducted ofthe H.D. Kote water project for donor accountability to AIDAB and for institutional learning. ThePE set out to assess the magnitude of the project in terms of villages and beneficiaries beingserviced by the Myrada/PLAN water systems. As an input to institutional learning, the PE
Mandal is the smallest government administrative unit. It forms part of the town levelgovernment unit called Taluk (H.D. Kote) which in turn forms part of the district level unitcalled Zilla Parishad (Mysore). The district level government units constitute a province orstate.
The FY 1985 H.D. Kote level of infant mortality (0-1 year old) was 524 per 1000. It issuggested that the more reliable baseline figure for this goal establishment was the Karnatakastate level of 114 per 1000.
6

n . u , iktue. COiABUt WATER PROJECT
CMC
WATERCOMMITTEE
PLANNING
MYRADA/PLAN
RESOLUTION
PDOPREPARATION
EXTENSION OFFICER
CONSTRUCTION ENGINEER
PROJECT OFFICER
PDOWRITE UP
APPRAISALDESICNCOST ESTIMATES
APPROVAL
ZILLA PARISHAD/KYSORE
ZILLA PARISHAD/(H.D. KOTE ENGC)
REVIEW OF H//PCOST ESTIMATES
WATERCOMMITTEE
MOBILIZATIONOF COMMUNITYCONTRIBUTION
M/P CONTRACTSELECTION GROUP
SELECTIONOF CONTRACTOR
M/P PURCHASECOMMITTEE
SELECTIONOF SUPPLIER
CONSTRUCTION
WATERCOMMITTEE
ASSISTS M/PIN MONITORINGCONSTRUCTIONWORK BY CONTRACTOR
MYRADA/PLANCONTRACTOR
OVERHEAD TANK TLPIPELINE {DISTRI-BUTION) JKTAP TE
PKED -DRILLING/BOREWELLS X
ZILLA PARISHAD(H.D. KOTE ENCC)
-RAISING MAIN TK
KEB - 3 PHASE ELECTRICITY 3T
OPERATION MAINTENANCE
MYRADA/PLAN TURN-OVEROF M/P PORTIONOF WATER SYSTEM
MANDALOPERATIONREPAIRMAINTENANCE
PHED - PUBLIC HEALTH & ENGC DEPARTMENTKEB - KARNATAKA ELECTRICITY BOARD
LNAug. T

examined the systems and procedures of the project (e.g., the institutions involved in the planning,construction and operation/maintenance of the potable water systems).
The PE methodology consisted of water quality tests, an informal survey, project site visits, reviewof project documents, and interviews with M/P staff, local government officials and officers of aCMQ.
4.1 Water Quality Test
The water quality test refers only to the bacteriological analysis to determine the presence of
coltform organisms which indicate fecal contamination of the water. The analysis was based
upon 18 samples from 2 types of sources: the main source (taps) and the end user source
(household containers), 9 samples each.
The earlier tests were started in August, 1990 during the PE Coordinator's visit and wereconducted by the Mysore district Department of Health and Family Welfare. The FO HealthCoordinator who is a physician and specializes in tropical medicine, collected the water samples.Only the result of one sample was sent to IH in October, 1990 and the result was not useful.
The Central Food Technological Research Institute of the Government of India, Mysore carriedout the second and latter set of tests with the same number of samples (18). The re-testing wasconducted in November, 1990 and IH received the results end of December. As of this report, IHhas still not received requested details concerning the collection process (e.g., who collected) anda description of the methodology used for the analysis.
4.2 Informal Survey
The informal survey was designed to investigate the status (e.g., reliability) of the existing M/Ppotable water systems and to elicit information on household water use and practices. TheExtension Officers and Animators* conducted the survey under the supervision of the FO HealthCoordinator in 2 types of villages: those with M/P water systems and those with non-M/P watersystems.
Thirty three (33) villages were surveyed: 22 villages (10 households each) out of the 30 villageswith M/P systems, and 11 villages (5 households each) taken from 22 with non-M/P systems.These 33 villages represent 62% of the total H.D. Kote villages (53) with existing water systems,both M/P and non-M/P.
The Survey Questionnaire is in Attachment 1.
* An animator is a village extension worker hired by the CMG to assist in M/P funded activities.He or she functions as a trainer in the CMG literacy project, assists in book keeping and insome cases, assumes the position of the CMG secretary.
8

4.3 Project Site Visits
The PE Coordinator visited 7 M/P water systems in various stages of the project: 2 systems that
were under construction and 5 systems that were operational.
4.4 Review of Project Documents
The review of project documents consisted mainly of Project Design Outline (PDO) reviews (total:
46) for fiscal years 1989-90, the project years with AIDAB grant. Other project documents reviewed
included the Situation Assessment and Goal Establishment (SAGE) Report, Sector Program
Outlines (SPOs), Annual Program Reports (APRs), Project Assessment Face sheets (PAFs), the
Project Cost Control (PCC) sheets and other PDO supporting documents (e.g., system designs
and cost estimates of construction materials). Refer to Attachment 2 for a description of each of
these documents.
Data on actual implementation schedule, type of tanks and project costs of M/P water systems
initiated from FY 1985-88 were also gathered and reviewed. These data are part of the PE fiscal
and project management reviews.
4.5 Interviews
The PE Coordinator interviewed the following:
the project staff (4 sub-offices) on project planning, implementation and management;
a local government chief (Mandal Pradhan D'Sundardas) about the operation and
maintenance of the water systems, the organizational structure of a Mandal. and its functions,
activities, and funding sources;
Officers of a CMG (Nooralkuppe village) involved in the early stages of a project on
the process involved;
Z/P Assistant Executive Engineer (Engr. M.C. Mahadevaiah) on the local government portion
of the construction phase;
Medical officer of the laboratory (Dr. B.N. Sujothi), and
District Health Officer of the Department of Health and Family Welfare (Dr. Thimmaya) about
the PE water test requirements.
PROJECT PHASES
As mentioned in 2.2, the key players in the project are:
the CMG through its water committee for the initiation of the project, and the mobilization of
community contribution,
M/P for planning and design and the construction of tanks, pipeline distribution and taps,
a M/P for planning and design
b. Contractor for construction of tanks, pipeline distribution and taps
9

Z/P for borewells, raising main and 3-phase electricity, anda PHED for drilling of borewells
b. Z/P H.O. Kote Engineering for raising main
c. KEB for 3-phase electricity
the Mandal for operation and maintenance.
5.1 Planning and Community Participation
The Credit Management Group (CMG) in a village, initiates the potable water project. It forms avillage water committee which includes non-CMG members to mobilize community contributionfor the project. The contribution is separate and does not come from the CMG revolving fund.The committee of about 5 members, prepares a resolution signed by the villagers (CMG and non-CMG members) indicating the need for a potable water system in the area and also theircommitment to contribute to the implementation of the project, either in cash or in kind (labor).This resolution is submitted to M/P and is a supporting document to the PDO.
Myrada/PLAN handles the PDO write-up through its Extension Officer, the system design andcost estimates by the sub-office Construction Engineer and the PDO approval by the ProjectOfficer.
In PDO preparation, the water committee participates in the selection of a site for the tank anddetermination of the number and location of taps to be constructed. It provides information onthe borewell yield9 to the sub-office Construction Engineer for the design of the system, particularlyfor the type of tank that is needed. The committee gets this information on borewell yield fromthe Z/P.
During the construction phase, the committee monitors the construction of the M/P portion of the
project In some cases, it becomes a pressure group to hasten the work of the M/P contractor
and/or the work of the Z/P.
5.2 Construction Phase
5.Z1 Pre-Constructton
After the approval of the PDO by the Project Officer, Myrada/PLAN sends a copy of thesystem design and cost estimates to the Z/P H.D. Kote Engineering for review. The ZillaParishad then sends a letter to M/P stating its commitment to contribute to the project.Upon receipt of Z/P's letter of commitment, M/P starts the process of selecting the contractorto do the M/P portion of the project and also the selection of the qualified supplier for theconstruction materials. The CMG's water committee is not involved in the selection process.This phase (pre-construction) is between the planning and construction phases of the project.
Borewell yield is the volume of water that can be pumped during a specific period of time.
10

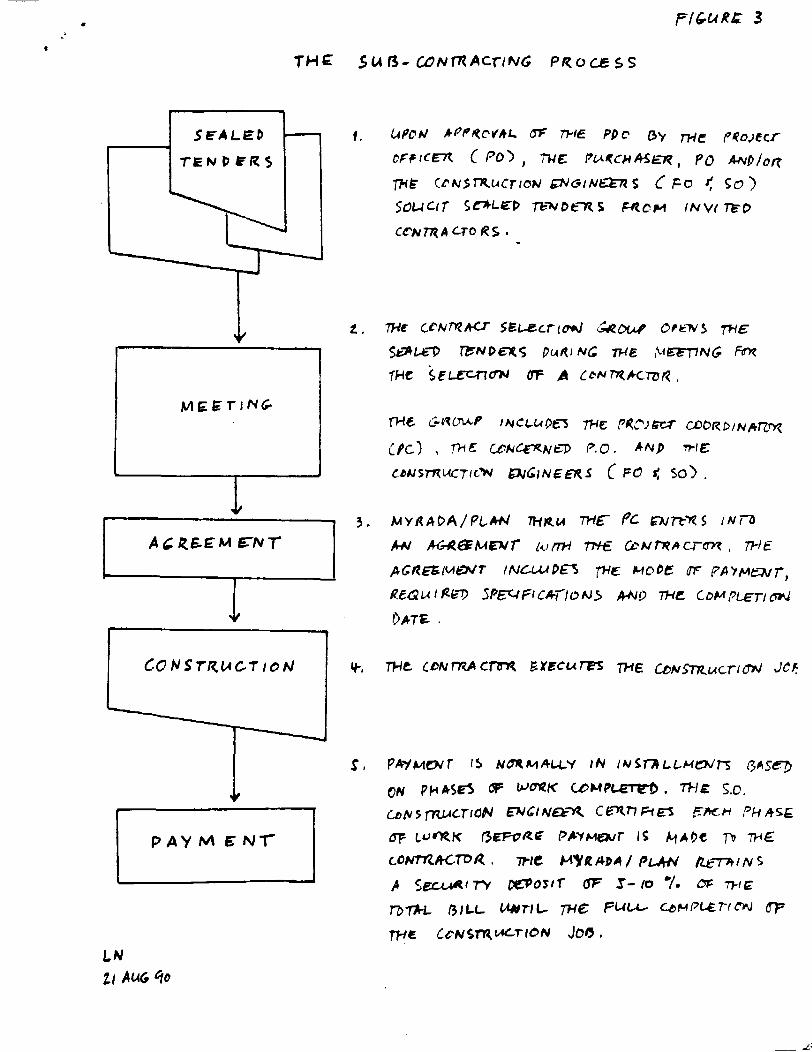
The selection of the contractor is done through sealed tenders from invited contractors.The contract selection group which includes the PC, all POs and the FO ConstructionEngineer, meets and selects the most qualified contractor. M/P then (through the PC) entersinto an agreement with the contractor. The agreement details the mode of payment, requiredspecifications and the completion date. The signatories of the agreement from M/P are thePC, the concerned PO and the Construction Engineers both from the FO and the sub-office(SO).
Payment to the contractor is normally in installments based on phases of work completed.M/P retains a security deposit of 5-10% of the total bill until the full completion of theconstruction job. Refer to Figure 3 for the sub-contracting process.
The purchase committee selects the supplier for the construction materials from sealedquotations of predetermined suppliers. The committee includes the PC, the POs and thePurchaser. Payment is made to the supplier upon receipt of goods. Refer to Figure 4 forthe purchasing process.
5.2.2 Schedule of Completion and Commissioning
The construction phase is divided into M/P portion and Z/P portion. M/P normally constructsthe (overhead) tanks, distribution pipeline and taps. The Z/P portion is further divided into3 construction units: the Public Health Engineering Department (PHED) which does the drillingand borewells, the Z/P H.D. Kote Engineering that constructs the raising main (pipeline fromthe borewell to the tank) and the Karnataka Electricity Board (KEB) that installs the 3-phaseelectricity. M/P coordinates only with the Z/P H.D. Kote Engineering for the whole project andin turn, Z/P H.D. Kote Engineering coordinates with the PHED and the KEB for the entire Z/Pportion.
M/P starts construction of overhead tanks with the borewells already installed by the PHED.When the overhead tank is near completion, the Z/P starts work with the raising main. Beforethe release of funds is made by the Z/P Mysore for the raising main construction, theAssistant Executive Engineer has to certify that the M/P overhead tank is nearly completed.Usually, the raising main is simultaneously undertaken with M/P's construction of distributionpipes and taps. The last stage of construction is the installation of the 3-phase electricity bythe KEB. Having done all these constructions, the system is then commissioned andoperation and maintenance is handled by the Mandal. Refer to Figure 1 for the sequenceunder the construction phase (I through V).
There were 73 M/P potable water systems initiated for the period FY 1985-90. Thirty (30)water systems had been commissioned as of August 1990 and 43 are in various stages ofconstruction. Of these 43 systems, 19 have their M/P portion completed. Table 1A showsthat the 30 commissioned systems represent only 41% of the total 73 systems that had beeninitiated.
11

,JForty two (42) water systems were initiated during the AIDAB years. Only eight (8) of theseif systems or nineteen percent (19%) have been commissioned and fourteen (14) have their M/P
portion completed. Table 1B shows the status of these systems (FY 1989-90) by sub-office.In the Sargur sub-office, none has yet been commissioned out of the 12 systems initiatedalthough 11 have their M/P portion completed. Kasba/A'santhe commissioned 5 or 33% ofthe 15 systems initiated with Madapura having 3 systems commissioned.
Table 1C shows the number of H.O. Kote villages with M/P and non-M/P water systems bysub-office. Twenty two (22) villages have non-M/P water systems which account for sevenpercent (7%) of the total villages (317). The 73 M/P systems that were initiated represent23%, and the 30 commissioned systems account for only 9.5% of the total villages in H.D.Kote. The table illustrates the potential impact that the M/P water systems can have on thelives of the Taluk families since they comprise the major portion of the water systems in H.D.Kote.
5.3 Operation and Maintenance
All commissioned M/P water systems are handed over by the water committee (through M/P) tothe Mandal. Full responsibility over the water system, its operation, repair and maintenance nowrests upon the Mandal. M/P and the CMG through its water committee do not share anyresponsibility for the management of the commissioned water system.
5.3.1 Funding
A Mandal is composed of a number of villages with an average number of about 20. Thereare 16 Mandate in H.D. Kote. For every group of 500 adult villagers (voters), onerepresentative is elected every 5 years to become a Mandal member. The elected Mandalmembers choose among themselves, a chief called Mandal Pradhan and a deputy chief,Mandal Upapradhan. A secretary is appointed and employed by the ZIP Mysore as acustodian of the books of accounts. For villages that pay monthly or yearly user fees, theMandal employs a bid collector and a number of collection assistants depending on thenumber of villages.
Each Mandal's funding for the operation and maintenance of the water systems in its villagescan come from 2 types of source: the Mandal's own revenue generating mechanism and theZ/P's annual budget for maintenance for each Mandal. The Mandal's revenue generatingmechanism operates through the collection of user fees per household and revenues fromvarious village taxes such as business taxes, license fees and property taxes (land sites andhouses). The Z/P allocates an annual budget of 10 Rs per head (voter) for the operation andmaintenance costs of the village facilities such as water systems, health centers, schoolbuildings, etc. The 10 Rs are split into Mandal (7.5) and Z/P (2.5). The Z/P share is for itsadministrative costs.
FT 85-90 MYRADA/PLAN POTABLE WATER STSTEMfTABLE 1
IFISCAL TEAR
II
FT 85-88
IFT 89-90
FT 85-90
TOTALINITIATED
<A>
31
42
73
M/P PORTIONCOMPLETEO
(1)
S
u
19
COMMISSIONED(C)
22
8
30 j
PERCENT TOTOTAL
(C/A)'1OO
71X
m
. 41X
FT 89-90 MTRADA/PLAN POTABLE WATER SYSTEMS B
| SUB-OFFICE
I
TOTAL | M/P POtTJON PERCENT TOINITIATED
(A)COMPLETED [COMMISSIONED! TOTAL
(B) (C) <C/A)*100
I|K«sba/A<santh«|
I|Madapur«
I| Strgur
15
15
12
3
0
11
33X
20%
0
TOTALS 42 14 19X
NUMBER OF N.D. KOTE VILLAGES WITH M/P AND N0N-M/P WATER SYSTEMS C
SUt-OfFICH
II|Katba/A($«nth«|I|M«dapuraI|S«rgur
NUMBER OF | VILLAGES | VILLAGES | VILLAGESH.D. KOTE |WITH NON-M/P|WITH M/P SYS|W1TH M/P SYS|VILLAGES I SYSTEMS |(OPERAT1ONAL|(NON-OPER.)'
•I-
122
72
123
I| TOTALS
I
5
15
13
10
7
12
13
18
317 30 43
Hon-op«P»t1on*t •• Of Juw, 1990.

The operating costs of the water systems include the electricity charges and the wages ofthe system operator10 employed by the Mandal. Maintenance costs are for minor repairs andreplacement of spare parts and cleaning of the tank. -,
5.3.3 User Training A ^ ^ ^ ^ u
The beneficiaries attend a half day orientation (3 hours) on the proper use and maintenanceof the water system before or upon commissioning. The Extension Officer arranges andconducts this orientation with the assistance of the FO Training Officer. This is in connectionwith the FO primary health care program for which potable water is a part.
6 TECHNICAL REVIEW
6.1 Systems Design
During the PDO preparation, the sub-office Construction Engineer draws out the general layoutof the water system portion for which M/P is responsible, giving details of the different parts.This is in consultation with the other sub-office Engineers and with the FO Engineer who thenapproves the final design. The M/P portion of the system normally consists of the water tank,pipeline distribution and the taps.
The system design depends on a number of factors such as the borewell yield, the number ofhousehold beneficiaries, the future or expected water demand and the spread or concentration ofthe house sites. The design is also in accordance with the standard Indian design which requires,among other things, that overhead tanks with a capacity of more than 6,000 gallons must becircular in shape.
6.1.1 Tanks
There are three types of tanks that have been constructed by M/P. The majority of the tanksare the reinforced concrete construction (RCC) overhead tanks with the holding capacity thatranges between 4,000 to 10,000 gallons. M/P also builds the pre-fabricated 500-gallon mini-water tanks and ground floor size stone tanks with the average capacity of about 5,000gallons.
6.1.2 Taps, Platforms and Spillways
Water in all the systems are distributed from the tanks to centrally located standposts (i.e.,taps that are supported by concrete slabs). Ideally, standposts have corresponding platformsand spillways for wastewater.
10 The system operator is a village resident who is chosen and hired by the Mandal membersto oversee the operation and maintenance of the water system. Z/P trains him for the job.At one time, M/P conducted the training for 8 system operators.
14

Platforms should be constructed as concrete standpost bases to prevent flooding and erosionof the surrounding area Spillways are intended to direct the flow of wastewater to designatedsites. Based on the project site visits, they are normally connected to existing ditches or tosimple community drainage systems along the sides of the local roads.
6.2 Water Quality Test
To obtain reliable test results, the water sample must be collected strictly following the standardprocedure that includes:
A water sample between 250 - 300 ml capacity placed in a covered sterile glass bottle. Thewater specimen must not be sent in plastic bottles.The collection must be carried out with meticulous care to avoid any bacterial contaminationfrom the outside source including the hands of the person collecting. All possiblecontamination must be avoided during collection.The bottles containing the specimen must reach the laboratory within 3 hours of collection.If not, the bottled specimen must be placed on a packed-in ice box at temperature 40°C -10°C and must reach the laboratory within 12 hours of collection.
The procedure used in the tests was the Most Probable Number (MPN) to obtain coliform counts.The probable number of coliform bacilli in 100 ml of water are obtained from the variouscombinations of positive and negative results of the tests. A positive result means acid formationand gas production which indicate the growth of coliform bacilli (i.e., indicator organisms of fecalcontamination). An acid formation shows a color change of the media from pink to yellow orgolden yellow and gas production is equated with air bubble production and the durham tubefloats on top of the media in the tube.
Eighteen (18) samples were collected: 9 samples from the main source (taps) and another 9samples from the end user source (household containers). There were 9 villages chosen, 3villages representing each of the 3 sub-offices. Two samples were taken from each village: onefrom a tap of the village water system and another from a household in that same village whichdraws its water from the tested system.
The water tests could have covered more samples or samples from all existing systems but theprocedure was limited by the available technical resources and laboratory facilities. For the earliertests, special arrangements had to made to the district Health Department to get the samplesanalyzed and it took sometime for the FO to find another agency to conduct the latter set of tests.
6.3 Water Quantity and Use ,^ _^ ^^J^A-
yBased on the survey, the average family size in the villages is 6 and the average age of thehousehold water carrier is 28 years old. The carrier is usually the mother of the household. InH.D. Kote, grown-ups are the usual carriers partly because there is frequent 'scramble' in queues
15
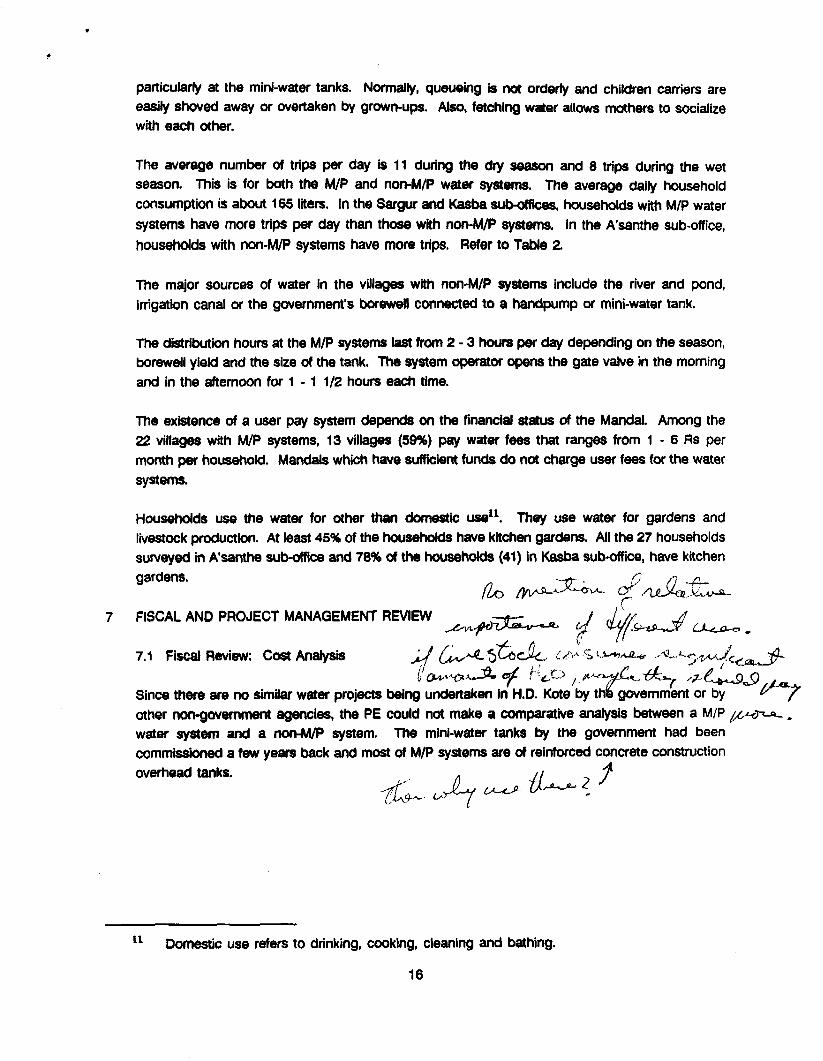
particularly at the mini-water tanks. Normally, queueing is not orderly and children carriers areeasily shoved away or overtaken by grown-ups. Also, fetching water allows mothers to socializewith each other.
The average number of trips per day is 11 during the dry season and 8 trips during the wetseason. This is for both the M/P and non-M/P water systems. The average daily householdconsumption is about 165 liters. In the Sargur and Kasba sub-offices, households with M/P watersystems have more trips per day than those with non-M/P systems. In the A'santhe sub-office,households with non-M/P systems have more trips. Refer to Table 2.
The major sources of water in the villages with non-M/P systems include the river and pond,irrigation canal or the government's borewell connected to a handpump or mini-water tank.
The distribution hours at the M/P systems last from 2 - 3 hours per day depending on the season,borewell yield and the size of the tank. The system operator opens the gate valve in the morningand in the afternoon for 1 - 1 1/2 hours each time.
The existence of a user pay system depends on the financial status of the Mandal. Among the22 villages with M/P systems, 13 villages (59%) pay water fees that ranges from 1 - 6 Rs permonth per household. Mandals which have sufficient funds do not charge user fees for the watersystems.
Households use the water for other than domestic use11. They use water for gardens andlivestock production. At least 45% of the households have kitchen gardens. All the 27 householdssurveyed in A'santhe sub-office and 78% of the households (41) in Kasba sub-office, have kitchengardens. ~Q- , n
7 FISCAL AND PROJECT MANAGEMENT REVIEW
7.1 Fiscal Review: Cost Analysis _^f (^^I&CAL, <:/><£ L^^JU, ,,<I
Since there are no similar water projects being undertaken in H.D. Kote by thfc government or byother non-government agencies, the PE could not make a comparative analysis between a M/Pwater system and a non-M/P system. The mini-water tanks by the government had beencommissioned a few years back and most of M/P systems are of reinforced concrete constructionoverhead tanks. „ / / 4
11 Domestic use refers to drinking, cooking, cleaning and bathing.
16

7.2 Project Management Review
7.2.1 Project Information Management
The PDOs are kept in the sub-offices. Each PDO is filed with a number of supporting
documents such as the village resolution, the lay-out scale of the system, the cost estimates
of construction materials, the brief appraisal report on the area by the SO Construction
Engineer to verify the water needs of the village and the covering memo from the PO which
indicates the PDO approval and stipulates certain expectations and assumptions in the
implementation of the project. The PAF and the PCC sheet plus the payment vouchers are
attached to the PDO at the end of the fiscal year.
7.2.2 Project Staff Responsibilities
The Extension Officer is M/P's link to the villages. He or she handles about 5 or 6 CMGs andprovides technical assistance to CMG members on various activities. Together with otherCMG activities, he or she monitors the progress of the water project implementation andreports these to the Cluster Officer. At the end of the fiscal year, he or she prepares the PAFin consultation with the community. The financial aspect of the PAF is verified by the SOAssistant Accountant. The Assistant Accountant also verifies purchase requisitions andpurchase orders before these are sent to the PO for approval. Checks are always signed bythe PO and the PC or in the absence of the PC, checks are signed by 2 POs. The SOConstruction Engineer certifies the completion of work of the contractor in phases beforepartial payment is made.
8 FINDINGS
8.1 Technical Review
8.1.1 Systems Design
All taps are supported by concrete slabs hence they are called standposts but not all
standposts have corresponding platforms. Although it is not clearly stated from the project
documents reviewed that platforms are required, they are an essential part of the standposts
for health and sanitation reasons. This potable water project is being implemented as part
n i of the primary health care program. The problem is trie lack of consistency In the design
' ^ l.s., some PDOs Include platforms in their dsslgn and some PDOs do not.
In about 70% of the FY 1989*90 PDOs that wsrs rsvlswsd (46), platforms for the
standposts are not Included In the design. In the Kasba/A'santhe sub-offices, 15 of the 16
PDOs reviewed do not include platforms in their design. They have no cost estimates for
platform construction.
17

The wastewater disposal (drainage or spillways) Is not Integrated with the planning anddesign of the potable water system. In the 7 water systems that were visited, only a fewtaps have spillways that go to either kitchen gardens or a ditch.
8.1.2 Water Quality
Water quality tests (bacteriological or chemical/physical) are not conducted on new orexisting borewells, after drilling by the District Public Health Engineering Department.M/P likewise does not conduct quality tests of the water before or after construction ofthe tanks. The analysis is not part of the normal procedure of the local government and M/Pbefore commissioning of the water system. The local government does water testing onlywhen there is an outbreak of water-borne diseases in a particular area or when the districthealth officer suspects water contamination in a water system. According to one ProjectOfficer, the local rule of thumb is that if the water is sweet, then it is considered potable12.
Table 3 shows the results of the water tests. Based on the World Health Organization(WHO) guideline values for drinking water, 7 of the 9 samples from the main sourcesW 4 r a n 0 | C|ean or potable In terms of the number of total conforms and number of faecal
/ J/,HST7K<>^'"r~ conforms.13 This may be due to the contamination of the main sources14 or that the taps
7 7 ? are not being cleaned which is a maintenance issue. This is based on the premise that thestandard water sample collection procedure was followed.
All the water samples from the household or end user did not meet the WHO guidelinevalues. They exceeded the maximum permissible coliform counts. This may be due to thehandling practices of the end users even though they cover and clean their containers as thesurvey revealed. Refer to Attachment 4 for the WHO guideline values.
The test result of the water sample from a household in the Manuganahalli village showsthat it has lesser coliform counts than its main source (tap). One possible explanation for thisis that the household boils its drinking water.
12 Potable in this context refers only to the aesthetic properties of water such as taste, odor andappearance.
13 The Most Probable Number (MPN) was the procedure used to get an estimate of the totalcoliforms or bacteria present in the sample. MPN is a multiple-tube dilution method. Faecalcoliform is a subgroup of total coliform that represents better evidence of faecal contamination.
14 About 75% of the 73 M/P water systems had existing (old) borewells from the governmentdrilling program during the early eighties.
18

^
This situation calls for Immediate revesting and/or regularly scheduled tests to accurately
assess water quality of the systems, so that an appropriate plan of action Is
undertaken.15
8.1.3 Water Quantity and Use
Kasba and Antharasanthe sub-offices, the average number of trips per day is higher than
in Sargur and Madapura sub-offices. Similarly, Kasba and Antharasanthe have higher daily
water consumption. This is partly due to the use of water other than domestic use, i.e., for
gardens and livestock production.
In Sargur and in Kasba sub-offices, villages with M/P systems have more daily trips to thetaps than those with non-M/P systems. This means that the former have higher daily waterconsumption.
Although there were no data gathered on the accessibility of water resources prior to the M/Psystems, improved accessibility is evident with the construction of centrally located standposts.The average distance of houses from the primary source is about 83 meters. This greateraccessibility reflects water sufficiency since existing M/P water systems have so far beenreliable. The Child Survival Baseline (CSB) study shows that in H.D. Kote, water is 'alwayssufficient' for households during the dry and wet seasons (H.O. Kote CSB, September 1990,Table 4.4, p. 11). The CSB study reported that 100% of the households surveyed in theMadapura sub-office had always sufficient water during the wet season. Based on theinformal survey, the major source of water of these households are the taps and the averagewater distance is 104 meters. There are 15 existing water systems in the Madapura sub-office area, 5 of which are non-M/P systems.
8.2 Implementation
8.2.1 Construction Phase
There Is delay In the construction of both the M/P and the Z/P portions of the projects.This in turn delays the commissioning of the systems.
The M/P portion Is delayed due to contractors. The delays are caused by the
contractors' multiple Job contracts and also by their limited working capital. The average
delay period Is 1.5 years. Three water system projects in the Madapura sub-office are
currently delayed due to the contractors. In the Sargur sub-office, 4 systems that have been
15 In addition to the PE-required bacteriological tests, the FO through the Research Instituteconducted the physical and chemical tests of the water samples which included the pH,dissolved solids and iron contents, the alkalinity and total hardness. Although there was nointerpretation made, the results were better than the bacteriological test results. The pH andiron contents were within the permissible level and total hardness was acceptable in mostsamples, 14 out of 18.
19

started in FY1988 were delayed, 2 of which have not been completed to date (Nanjipura and
K.H. Shed).
The current M/P policy Is to hire local contractors (|.e., H.D. Kote-based contractors)
who are limited In number and demonstrate low levels of competence. According to one
PO, the rationale of this policy is to tap and develop local technical manpower and 'outside'
contractors have relatively higher priced quotations16. The FO apparently has not taken any
steps to address this delay by the contractors, except in some cases, e.g. terminating the
contracts of delinquent contractors. There are only about 8 local contractors in the area
compared to the number of water systems (42) that M/P is currently implementing or has
initiated. Only in rare cases do these contractors complete their work on time as agreed
upon in the contracts.
The Z/P portion Is also delayed due to the government bureaucracy which affects the
timely disbursements of funds for the projects. The delay starts from the construction of
the raising main to the installation of the 3-phase electricity by the KEB. The average delay
Is about a year. One PO estimated that 60% of all the M/P water systems have been or
are delayed.
M/P H.D. Kote believes that the only way to solve the delay at the Z/P level is for the FO to
encourage the CMQs and other villagers to pressure (e.g., petition letter) the local government
for the immediate release of funds for projects. In the Sargur sub-office, the PO tried in FY
1990 to take some measures by sending letters to the Z/P requesting the Z/P to put up front,
an amount of least Rs 25,000 for every system before M/P began with its portion so that there
would not be a delay in the release of funds. This was tried in 3 water systems but the Z/P
had not responded to this request and M/P had already completed its portion.
There Is lack of consistency In the Implementation of projects. A case in point is in the
Sargur sub-office where 6 of the 7 water systems that were implemented in FY 1990, had
budgets for platforms (or platforms were part of the design) but were not constructed.
According to the Project Officer, the platforms were not constructed due to a change in the
implementation. The sub-office has requested the Zilla Parishad to share in the construction
cost of the platforms. This change of implementation has consequences on the completion
of these platforms considering the bureaucracy in the release of funds by the local
government. Besides, M/P had already allocated budget for this part of construction.
16 The FO though had previously hired contractors from Mysore during the early years of theproject and these outside contractors are typically competent and are more stable in termsof working capital and work equipments.
20

8.3 Fiscal and Project Management Review
8.3.1 Fiscal Review: Cost Analysis
The FO Is keeping In line with Its budget. Based on the review of the Project Cost Control
(PCC) sheets which are attached to the PAFs and PDOs, the expenditures are within the
budget. Cost overruns are mainly due to price increases of construction materials during
implementation. This is to be expected as delays in other phases relate to cost increases.
8.3.2 Project Management
8.3.2.1 Project Information Management
Practically all the 46 FY 1989-90 PDOs reviewed have no dates of signature by theExtension Officer, Cluster Officer, SO Construction Engineer and the PO. The dateof signature is part of the minimum requirement in the PDO preparation based onPLAN'S Program Manual. According to one Project Officer, the FO does not put datesafter the signatures in the PDO form because the date is indicated in the coveringletter which is an attachment to the PDO. The date of signature by the ExtensionOfficer who prepares and is the first to sign the PDO, is not necessarily of the samedate as in the covering letter. Also, the Cluster Officer and the Construction Engineerstill have to sign before the approval and signature by the PO, and before thecovering letter is prepared.
The PCC sheets are well documented with supporting receipts. There is one PCC
sheet though ai the Madapura sub-office which has incorrect entries and another with
supporting receipts from a different water system construction.
8.3.2.2 Project Staff Responsibilities
There Is control of project activities. The SO Assistant Accountant does the
verification on the financial side and the SO Construction Engineer, on the
construction side. The PO does the overall management of the project
8.4 Sanitation/Environmental Concerns
8.4.1 Wastewater
Ideally, wastewater disposal should be integrated with the M/P water systems both at the
standposts and in the house sites. At the standposts, platforms and spillways are to be
constructed, and in the house sites, spillways, ditches or 'collection points'(for garden and
livestock use) are required.
21

Based on the PDO reviews and the project site visits, wastewater disposal is not integratedwith the construction of the water systems at the standposts. As discussed in 7.1.1, platformsare seldom constructed or included in the design. Hie surrounding area usually gets muddyand there are pockets of stagnant water around the facilities. These are breeding places ofjnsects that pose a potential health hazard. This situation is similar to the PLAN Haiti waterprojects in Croix-des-Bouquets and Jacmel which were evaluated in 1983 by Dr. S. Buzzard.Proper drainage was the most common problem with the water systems constructed in Haiti17.According to the POs in H.D. Kote, they plan to start with the construction of platforms thisFY 1991.
In the house sites, 85% of the 300 households surveyed have spillways for their wastewaterdisposal. In 3 villages in the Madapura sub-office, more households have ditches (20) ratherthan spillways (5). Other households collect wastewater for their seedlings and trees. Thereis no flooding reported in the house sites.
8.4.2 Storage
Households cover their water containers and they have separate containers for drinking andcooking and for other uses. Based on the project site visits, H.D. Kote water carriers cleantheir containers before filling them. This is in contrast with practices observed in thehouseholds in Burkina Faso where water containers are seldom or never cleaned (BurkinaFaso Water Analysis, 1988)ls. In H.D. Kote, although households clean their containers, water
< ^ ^ is polluted as shown by the water test results. This may be due to the contamination from
'< : J^ the taps or to households'handling practices. In the three Burkina Faso FOs (Kaya, Boulsaand Kongoussi), drinking water is polluted either during transport or in the water containersat home.
8.4.3 Prevalence of Diarrhea
Only twelve H.D. Kote households (4%) reported the onset of diarrhea among children, 0 -5 years old during the previous 15 days. There is no comparative data on water-bornediseases before and after the operation of the water systems in the area This therefore limitsthe PE to assess the impact changes on health.
The CSB data show that 26% of the children, 0 - 5 years old had diarrhea in the past 15 days(H.D. Kote CSB, Table 6.1, p. 22, see Attachment 4). Based on the crosstabs using the CSBdata, there is no correlation between the type of water source (open versus closed) and theprevalence of diarrhea among children, 0-5 years old. Similarly, there is no significantdifference regarding the prevalence of diarrhea between sub-offices.
17 The PLAN/Haiti Water Projects in Croix-des-Bouquets and Jacmel: An Evaluation Report,1983, p. 43.
18 Chemical and Bacteriological Analysis of 9 Boreholes, 9 Open Wells and 9 Domestic WaterContainers in Burkina Faso, IWACO, 1988, p. 7.
22

9 CONCLUSIONS
The project's objective is to provide accessible, sufficient and safe drinking water to the villages
in H.D. Kote. This is to contribute to the reduction in the incidence of water-borne diseases under
PLAN'S primary health program.
9.1 Technical Review
9.1.1 Systems Design
The water system design does not Include wastewater disposal and platforms usually
does not go with the construction of standposts. Poor drainage can outweigh the positive
effects of the M/P water systems.
9.1.2 Water Quality
The absence of a regular water teat both by the local government and M/P makessuspect the actual water quality of the commissioned systems. The test results of the 18samples had already shed some light on the reliability of the M/P systems in providing cleanwater. As a basic measure of water quality, (bacteriological) water testing rather than tasting(the aesthetic property and local rule of thumb) assures beneficiaries that what they drink issafe.
9.2 Implementation
9.2.1 Construction Phase
The delay In the construction phase Is two-fold: M/P contractors' delay and the Z/Pdelay In the releass of funds. The average delay period In the construction of the M/Pportion Is 1 1/2 years and In the Z/P portion, 1 year. This delay translates Into:
(a) a delay In providing water to the villages,
(b) likely Increase In the cost of materials by the time the purchase Is made due to
Inflation and shortage of supply,(c) higher depreciation costs incurred for materials already purchased or Installed prior
to the commissioning of the water system, and(d) In some cases, pilferage of available materials.
9.3 Project Results
The M/P potable water project has not achieved its objectives to date due to delays In the
construction phase and In the release of funds by Z/P. Also, the expected project benefits
are reduced by the potential health hazard posed by the lack If not absence of wastewater
disposal (platforms and drainage).
23

So far, a total of 73 water systems have been initiated by M/P. Only 30 (41%) of the 73 systems
have been commissioned and 19 have their M/P portion completed. During the AIDAB years (FY
1989-90), 42 systems were initiated and only 8 systems (19%) were commissioned. This low
number of commissioned water systems delays the provision of water services to the expected
beneficiaries. In FY 1989-90, the Kasba/A'santhe sub-offices initiated 15 systems with an expected
beneficiaries of 2212 families (759 PLAN and 1453 non-PLAN). Only 5 systems were commissioned
that currently benefit 755 families (230 PLAN and 535 non-PLAN) or only 34% of the targeted family
beneficiaries.
Although there were no data gathered on the accessibility of water resources prior to the M/P
systems, improved accessibility is evident with the construction of centrally located standposts.
It is not so much on the reduction of the distance between the house and the water source but
rather on the reduction in queueing time because most of the borewells were already installed
before the M/P water systems. This greater accessibility reflects water sufficiency since existing
M/P systems have so far been reliable. The PE does not, and is not able to measure the social
and economic consequences of this accessibility (i.e., the energy and time saved).
9.4 Sanitation/Environmental Concerns
Wastewater disposal i« not Integrated with the M/P water systems at the standposts but most
of the households surveyed (85%) have spillways and ditches for their wastewater.
9.5 Impact
Impact changes on health cannot be assessed due to the lack of baseline data However, other
studies show that diarrhea! infections are highest among households that are farthest from the
water source19. Based on the informal survey, the average distance of houses from the primary
source is about 83 meters and only 12 (4%) of the 300 households surveyed reported any
incidence of diarrhea among children, 0 • 5 years of age.
9.6 Sustainabiltty
Sustainability of the M/P water systems relies heavily on the shoulders of the Mandals since they
handle the operation and maintenance. Myrada/PLAN indirectly sustains the water systems by
conducting user training and for one time, trained a group of system operators. At best, M/P
currently contributes to this sustainability through its training activities on basic hygiene and
sanitation, and by strengthening the CMGs for mobilization of community contribution. The H.D.
Kote CSB study reported that only 6% of the surveyed households actively participated in the
potable water project over the past year (page 35). This indicates that sustainability in terms of
active participation of household beneficiaries is still low although this low rate of participation
might have reflected only the members of the water committees.
19 'Safe Water and Waste Disposal for Rural Health: A Program Guide', USAID, 1982, p. 11.
24

White M/P has a minimal role In the sustenance of the systems, it has substantial project
contributions. Based on the PDO reviews, M/P contributes on the average, about 63% of the
total project cost compared to the percent shares of the Z/P and of the community. With thismajor financial exposure to the water project, It follows that M/P has a stake In the systemssustalnablllty.
25

IOIRE 2, A PLAH/MRADA OMMnZAIiaKAL CBAU• D tan
MYRADA
Planning3 Myrada
PLJUt/MKKADA•nd Co-ordinatlni C^Dltti*»nd 3 Pl«n R«pr«mit«tlv«f
Projae t Cxicut ion CaaaUttaa1 Myrada *nd 1 PLAN R«prt t*nt t t lv«
PUN
Prejtet Co-otdiMtorK.X. Aiwa
PROGRAMCS
PROJECT omcots
Project
ADHIHISTltATICM( • • • n m t pa|»)
Madapura
EXTENSION (laeh Proj.ct, Offie*)
Clutter(It)
(# ViUu«»)
Extaniion(60)
SUBJECT MATTOt SPECIALISTS(Each Projaet Offlea)
Haalth (3)
't Orgtniiation* (3)
—| Construction (3)
Ineon* OvMratlon (3)
Aninal Huabandry (11)
Atricultur* (4)
Education (3)
Administration (By Project Offle«>
Pro«ranM Admin Asiittanti (3)Saciatarlal/Otfica Aiita <«)Beekkaapor* (3)Donor Sarvieas Paraonnal (3)Labour (S)

FIGURE 20 H.D. KOTE PROGRAMME OFFICE
1SUBJECT MATTERSPECIALISTS(Professional)
ADMINISTRATION
1DONOR SERVICES
1ADMINISTRATION
D.S. Staff (16)
1ACCOUNTS
Gen Admin (5)Gen Services (14)
AccountsStaff (5)
EDUCATION (2)
SOIL CONSERVATION (1)
CONSTRUCTION (1)
HEALTH AND TRAINING (2)
EDUCATION (2)
PROGRAMME/INTERNAL AUDITOR (1)
Auditors (4) Audit Trainers (4)
THE SlA(i~ CONTRACTING
CONSTRUCTION
LN
1.
t.
OF TH£
, rueOK £NGi
TWPfcH
PPc Oy
rA/£E7?S C \
K.% M O M
me, po= o <
INVt
T&NO€X% PuHiNC TUB
THC Pt
p.o. >( FG t, so>
4-, THfc CMrKACim. BXECUTWS THE CckSTJltACrtCM
s,PH ASrS <JF S.O.
, trieA Secc*«'TV DCPOStT (SF S- to 7 . OF 7>/£

THE PROCESS
f,AT
A pURCHASG
C ?0.">
/A/ TKf(>LJCJ*tG.
CN we-
»?PK.OVG% rue.
sp.
p$o. The
ANJ> A C/>/»Y ts
7b
WE FO Srbfl£
z.
<$.ucT*Ticfi/s
5.
(iy
rue
THE.
me Mozr QUAL(PI&T> we ieiecrt
HUG. PLACE .
PURCHASE CfiMHiTTtt 1*CJ-L>(9£-<>
C4OK01 A/ 4T0K C PC) , Thte POz
rue
s,
IN
s.r. Assr
rr (5 5tf*/r 7b The
S.o.
. me
PC

H.D. KOTE POTABLE WATER PROJECT QUESTIONNAIRE
NOTE: For families In an area NOT served bv PLAN'S water systems, answer I. II and V only.
Sub-office:FC Number:Respondent Name:.Family Size:
Village:.
Relation to FC:
I Sufficiency and Use
1.2.3.
4.5.6.
Name of family's frequent carrier: _Age:_ Sex:Average Number of Trips per day: Dry Season WetAverage Number of Pots/Buckets/Galk>ns(meters) of Water Consumed per day (for DomesticUse only): (Domestic use: drinking, cooking, cleaning, bathing)Do you use spilled water_ Yes _ No If yes, for what:Do you use greywater: _ Yes _ No If yes, for what:Use of this water source other than domestic:
Source and Distance
1. Rain2. River/stream/lake/pond3. Public open well4. Public closed wed5. Mobile water tank distribution 9
Primary Source: Dry SeasonSecondary Source: Dry Season
6.7.
&n 9.
Drilled wellCommunity water tap (closedsystem)Water tap in house siteWater tap inside the house
Distance: Wet SeasonDistance: Wet Season
DistanceDistance
Maintenance and Reliability
1. Operation Schedule:Z Maintenance (Repair) Schedule:.3. Do you dean the facility/surroundings before or after use: Yes No
(hours/day) Dry/Wet(monthly)

IV User Pay System
1. How much are the fees: per family
2. Schedule of payment: (weekly/monthly)
3. Who collects:
4. Are you in default: Yes No
V Environmental Concerns
1. Water use practices
1.1 Do you cover your water containers: Yes No
1.2 Do you have separate containers for drinking and cooking: Yes No
2. Wastewater disposal
2.1 Where do you dispose wastewater Spillways _ _ Ditch Others
2.2 Do you clean or clear your spillways: Yes No
2.3 Does flooding occur on house site due to wastewater: Yes No
3. Water-related Diseases
3.1 Mas any child aged 0-5 years old in your family suffered from diarrhea during the last 15
days: Yes No N A (» > 3 loose motions/day)
4. Reforestation
4.1 Have you planted trees or shrubs around the house since operation of the water
systems: Yes No
4.2 Do you have a kitchen garden: Yes No
Date:
Interviewer

ATTACHMENT Z
PLAN INTERNATIONAL PROGRAM DOCUMENTS
1. The Situation Assessment and Goal Establishment (SAGE) Report
The SAGE Report is the primary program planning document and addresses health, education,community development, and income generation. The report has three main components. Firstis an assessment of the social, economic, and cultural conditions of the area families andcommunities as well as an overview of the host country's long-range development plan for thearea. Second is a clear statement of the program approach, which articulates the underlyingprogramming philosophy. The third component of the report establishes realistic andmeasurable long-term goals which ensure program continuity and focus.
2. Sector Program Outline (SPO)
SPOs are prepared for each program sector (health, education, social services, communitydevelopment, and income generation). These documents summarize local conditions, currentprogram status, the linkage with host government planning and support, and state specificsector objectives explaining their relationship to the projects proposed for the next three yearbudget cycle. In some field offices, projects from various sectors are combined to form suchbroader sectors as 'Family Development,' or 'Village Development.'
3. Project Development Outline (POO)
The PDO is an annual planning document containing specific, detailed budgets, time tables,location of project participants, description of activities, and the indicators to measure theprojects' effects.
4. The Annual Program Report (APR)
The APR is a fiscal year end report of all the program activities. It is the overall assessmentof the field office program approach and status in relation to SAGE. The report discussesactual implementation by sector.
5. The Project Assessment Facesheet (PAF)
The PAF is a summary sheet of a project's status prepared at the end of every fiscal year. Thissummary report is designed principally to compare actual implementation with the PDO.
6. The Project Cost Control (PCC) Sheet
The PCC Sheet is a project's expenditure logsheet which details every transaction made duringthe fiscal year.

ATTACHMiMT 36 MORBIDITY
6.1 PREVALENCE OF DIARRHOEA AMONG CHILDREN IN LAST TWO WEEKS
6.1a BY SUBOFFICE
'. OILDEN U-C XV D(*W*ER IN
26% children 0-60 months had suffered from a diarrhoeal episode In the past 2 weeksVariation between suboffices Is not significant (Chi-square test).
6.1b BY AGE GROUP(count, col.t)
DIARRHEATN LAST 7 UFFlf^
YES
NO
TOTAL
0 - 11MONTHS
5034%96
66%
146
AGE GROUP 0-60
12 - 23MONTHS
7236%12664%
198
24 - 35MONTHS
6429%15571%
219
36 • 47MONTHS
4918%22282%
271
48 • 60MONTHS
1313%89
87%
102
TOTAL
24826%68874%
936
The prevalence of diarrhea Is highest in the age group 0-23 months and lowest In the 48-60months age group. Variation between age groups Is significant (p<.000,Chi-square test).
22

SUMMARY RESULTS OF THE INFORMl SUtVEY
Average Average Average Ave Daily Ave DistanceFamily Age Trip*/Day Consumption Primary Source
Sub-office Site Carrier Ory / Wet (Utert) (meters)
Sargur
Madapura
Kasba
Antharasanthe
6
6
7
6
28
28
29
27
7 t
6 i
14 y
16 I
f 5
' 6
' 10
' 11
119
84
238
217
92
104
87
49
AVERAGE 28 11 / 8 165 83
Sargur (M/P)
(non-M/P)
Madapura (N/P)
(non*M/P)
Kasba (M/P)
(non-M/P)
A'santhe (M/P)
(non-M/P)
6
6
6
6
7
5
7
5
28
29
28
29
28
32
24
33
8 ,
6 ,
6 i
6 ,
17 /
6 >
15 /
19 )
/ 6
f 4
f 6
t 6
' 12
' 6
' 11
' 11
134
93
82
88
290
79
206
239

INFORMAL SURVEY RESULTS
Villag*
Avaraga Avarag* tvcrage Ava Daily Priftary Av« DUtancaFamily *g« Trips/Day Consunption Sourca Primary SourcaS u « Carriar Dry / Uat (litarc) Dry I u«t* (mtari)
SARGURNatakara
Nagganoer
Kanchanahatly
Oadadahally
Bankawadi
Mullemaala
Channagundi
Kothvgala*
Sargur*
T-*aW
Jakkahally*
MAOAPURAManaganahatty
I.G. Daily
C.H. Hundi
Natwal
Alanahally
G.I. Saffur
6
7
6
6
5
6
6
7
5
5
7
6
5
6
5
5
6
33
24
27
31
32
23
23
31
24
33
29
21
17
27
40
30
30
8 ,
10 ,
10 ,
8 ,
7 ,
7 i
5 ,
7 t
S t
5 >
7 ;
4 /
10 /
9 /
4 /
4 /
6 /
f 7
1 6
( 8
i 7
f 6
r 6
t 3
' 6
' 3
' 4
' 4
' 3
• 9
' 15
1 4
3
5
143
128
133
168
124
81
159
97
96
58
120
44
101
102
57
45
104
Mini*tank
borawall
bertwalt
t*
i*
t«P
tap
«P
canal
rivar
pond; borawall
t«P
pons
«P
t*
t»P
68
66
102
13
30
16
84
63
100
375
100; 100
40
471
177
18
26
103
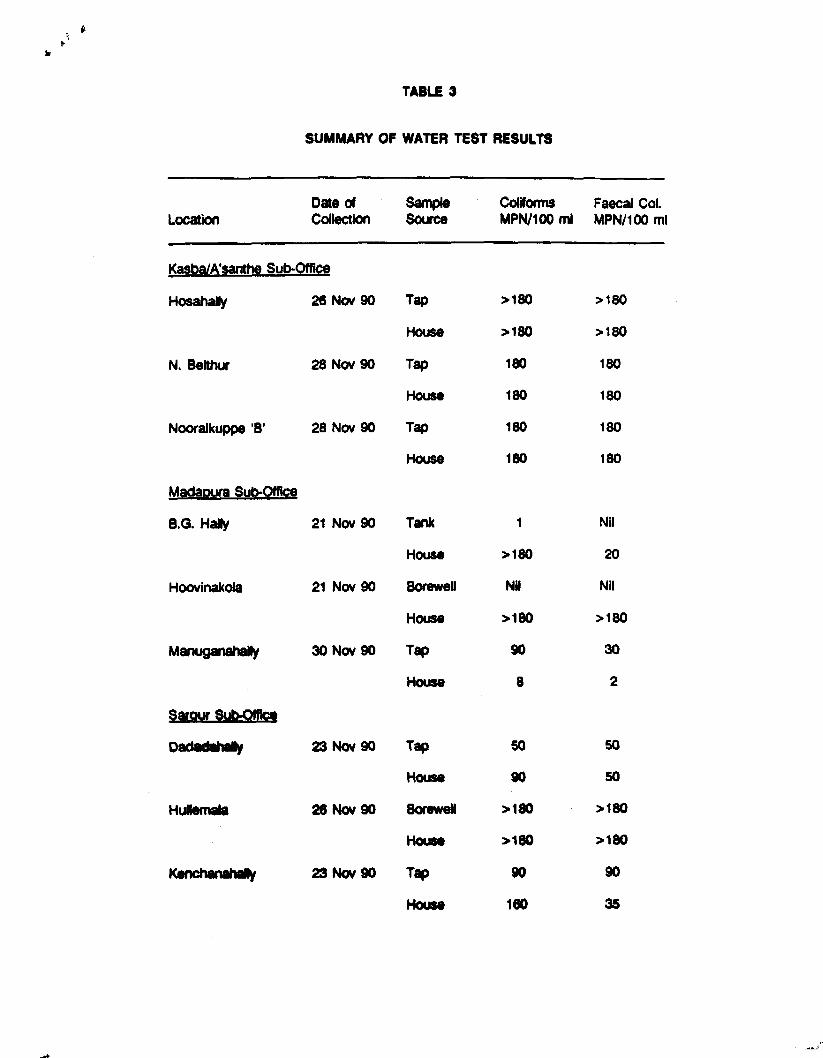
TABLE 3
SUMMARY OF WATER TEST RESULTS
LocationDate ofCollection
Kasba/A'santhe Sub-Office
HosahaUy
N. Belthur
Nooralkuppe B'
Madaoura Sub-Office
B.O. HaJly
Hoovinakda
ManuganahaNy
Saraur Sub-Office
Dadadaha»y
Huilemata
Kenchanahafly
26NOV90
28NOV9O
28NOV9O
•
21 Nov90
21 Nov90
30NOV90
23NOV90
26NOV90
23NOV90
SampleSource
Tap
House
Tap
House
Tap
House
Tank
House
Borewell
House
Tap
House
Tap
House
Borewell
House
Tap
House
ConformsMPN/100 ml
>180
>18O
180
180
180
180
1
>18O
Nil
>180
90
8
so
90
>180
>18O
90
160
Faecal Col.MPN/100 ml
>180
>180
180
180
180
180
NH
20
Nil
>180
30
2
SO
SO
>180
>180
90
35

ATTACHMENT
MICROSIOLOGICAL ASPECTS
Guideline values for bacteriological quality
Organism Unit Guideline value Remarks
A Ptpid wtttr tupplits
A. 1 trttttd wtttr inuring th* distribution sytttm
faecal coliformscoiiform organisms
number/100 mlnumber/100 ml
A 2 Untrtsttd w§t»r tnttnng th§ distribution systtm
faecal coliformscoJiform organisms
number/100 ml
number/100 ml
coiiform organisms number/100 ml
8 Unpiptd wafer supplin
faecal coliformscoiiform organisms
number/100 mlnumber/100 mt
C BottMJrinkingwtttr
faecal coliforms number/100 mlcoiiform organisms number/100 ml
0
0
00
coiiform organisms number/100 ml
A 3 Wattr in tht distribution system
faecal coliformscoiiform organisms
number '100 mlnumber 100 ml
3
00
010
00
turbidity < 1 NTU. for disinfec-tion with chlonne. pH prefer-•bry < 8 0. frae chlorine re-sidual 02-0 5 mg/litre follow-ing 30 minutes (minimum)contact
•n 9 8 % of samples examinedthroughout the year—in thecast of large supplies whensufficient samples artexaminedin an occasional sample, butnot in consecutive samples
in 9 5 % of samples examinedthroughout the year—«n thecase of Urge supplies whensufficient samples are exam-ined
in an occasional sample but notin consecutive samples
should not occur repeatedly; ifoccurrence is frequent and ifsanitary protection cannot beimproved an alternative sourcemust be found if possible
source should be free fromfaecal contamination
O. imwgwicy waur tuppUm
faecal coliforms number/100 mlcoiiform organisms number/100 ml
00
advise public to boil water incase of failure to meet guidelinevalues