project cost risk analysis: the risk driver approach prioritizing
TRANSCRIPT

Project Cost Risk Analysis:The Risk Driver ApproachPrioritizing Project Risks
and Evaluating Risk ResponsesDavid T. Hulett, Ph.D.
Keith Hornbacher, MBAWaylon T. WhiteheadHulett & Associates, LLC
Los Angeles, CA USAwww.projectrisk.com
© 2008 Hulett & Associates, LLC 1
Outline• Some limitations of the traditional 3-point
estimate quantitative risk analysis• Introducing the Risk Driver Method to cost
risk analysis – Method illustrated– Data collection considerations – Some benefits of the Risk Driver approach– Simple refinery construction example
© 2008 Hulett & Associates, LLC 2
Risk Prioritization – New approach• More complete and powerful than the
standard qualitative risk analysis using the Probability and Impact approach
• Compute the effect of individual risks on the cost, then sort risks by priority
• Risks are prioritized by probability and impact as they affect the cost through simulating the model of the project
• Assists risk mitigation decisions
© 2008 Hulett & Associates, LLC 3

Limits of the Traditional 3-point Estimate Approach (1)
• Traditionally we estimated the risk of each line item by applying a 3-point estimate of and a probability distribution to the line item cost
• This approach does not use the results of the qualitative risk analysis well
• We want to know which risks are important to guide risk responses. Instead we find out which line items are important. There is a difference
© 2008 Hulett & Associates, LLC 4

Limits of the Traditional 3-point Estimate Approach (2)
• What is the probability that the risk will occur? Traditional approach assumes 100% risk occurrence and deals with impact uncertainty only
• What is the correlation between activity costs? We will model it instead of estimate it from interviews
• Which risks (not which line items) are most important? If a risk affects several line items it may be more important than it appears at first
© 2008 Hulett & Associates, LLC 5

Benefits of the Risk Driver Approach (1)
• Focus on the risks, not their impact on line item costs
• Provide management with prioritized list of risks, not activities, that need mitigation
• Interviews are conducted at the level of risk where people think of risk, not line items. They are more intuitive for all parties and simpler to verify and validate
• Interviews are generally shorter than when using traditional 3-point estimating
© 2008 Hulett & Associates, LLC 6

Benefits of the Risk Driver Approach (2)
• Correlations occur often in cost risk– If steel prices increase, the prices for structural steel,
pipe and vessels will increase together– If labor productivity declines, direct and indirect labor
will cost more, together• Traditionally we have to estimate correlation
coefficients – not easy because no data, concept is not familiar to most people
• Risk Driver method models how correlations come about due to risks affecting more than one line item. No more guessing at correlation coefficients.
© 2008 Hulett & Associates, LLC 7
Introducing theRisk Driver Method
• Start with the Risk Register risks – the linkage to the qualitative risk analysis exercise is obvious and direct
• Characterize the risks by their probability as well as impact, not just impact range as traditional analysis
• Probability and impact are the TWO dimensions of a risk
© 2008 Hulett & Associates, LLC 8

Risk Driver Methodology
• Identify risks to be included from Risk Register• Quantify risks’ probability and impact range
– The impact is a factor – The line item costs will be multiplied by the factors
• Assign risks to cost line items – Risks can affect several line items– A cost line item can be affected by several risks
• Run Monte Carlo simulation for overall cost risk• Prioritize risks for further mitigation
© 2008 Hulett & Associates, LLC 9

Identify Risk Drivers Use the Risk Register Directly
Risk Register - Model Input Data
ID Risk Name
R.1 Contracting Strategy (LSTK) may cause bidders to bid high
R.2 Design Changes may be greater than anticipated
R.3 Equipment Suppliers may be busy
R.4 Quality Key Staff JV / PMT may not be available
R.5 Number of Bidders may be limited due to availability of other work
R.6 Integration Management of detailed engineering may be inadequate
R.7 Labor Rate may differ from expectations
R.8 Construction Labor Productivity may differ from expectations
R.9 Bulk Material Cost may differ from expectations
R.10 Construction Management Staff may be lacking in experience
© 2008 Hulett & Associates, LLC 10

Discovery of Risk Factors
• From exploratory interviews w/ all project stakeholders to arrive at their general ideas about what the risks are
• From the project risk register• From general knowledge about conditions
that might affect the project• Risks should be independent of each
other. Related risks may be consolidated
© 2008 Hulett & Associates, LLC 11

Detailed Interviews for Information about Risk Factors
• Using the arrived at Risk Factors, conduct interviews to assess their likelihood and impact
• Be alert to the discussion of new risks during the interviews
• The use of pre-read information can assist with the amount of information that can be covered in a time limited interview
© 2008 Hulett & Associates, LLC 12

Applying Risk Factors
• Where possible, cover what type of cost line items the risk factor will apply to
• Be alert to the need for applying the same risk factor with more than one range for different types of costs
• Be alert to the need to divide cost lines in order to discretely apply Risk Factors
© 2008 Hulett & Associates, LLC 13

Use Trigen Function to Correct for Narrow Ranges from Interviews
© 2008 Hulett & Associates, LLC 14
Design Changes 3-point estimate is .95, 1.05, 1.15
Trigen makes it .87, 1.05, 1.23
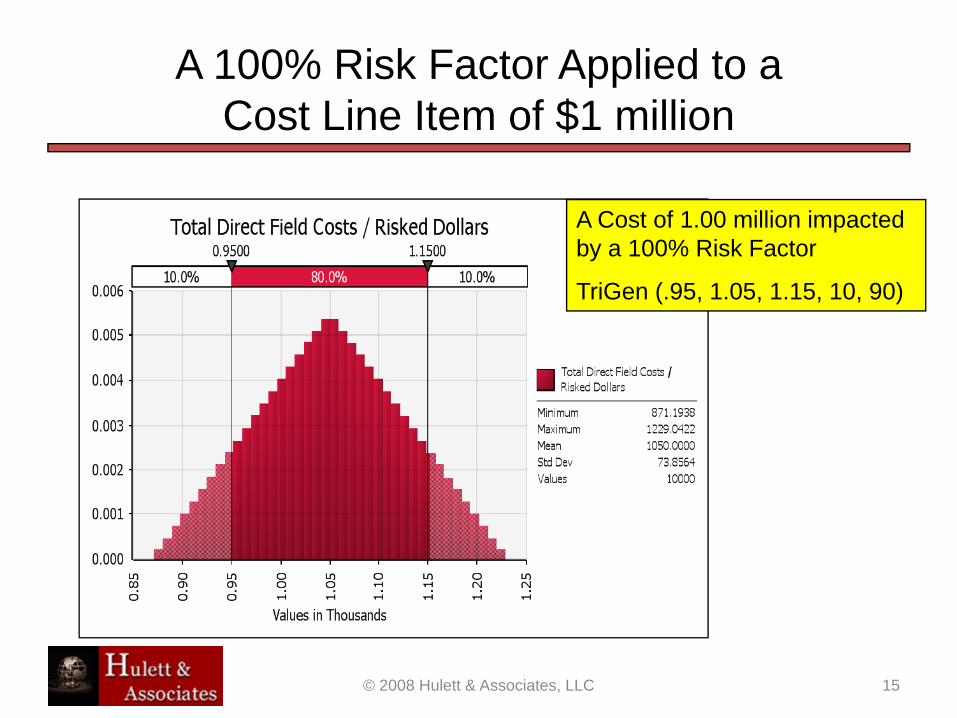
A 100% Risk Factor Applied to a Cost Line Item of $1 million
© 2008 Hulett & Associates, LLC 15
A Cost of 1.00 million impacted by a 100% Risk Factor
TriGen (.95, 1.05, 1.15, 10, 90)

A 40% Risk Factor Applied to Cost Line Item of $1 million
© 2008 Hulett & Associates, LLC 16
A Cost of 1.00 million impacted by a 40% Risk Factor Trigen (.95, 1.05, 1.15, 10, 90)
The spike has 60% of the probability, indicating that the risk occurs only in 40% of the iterations

A Cost of $1.0 million Affected by Two 100% Risk Drivers
© 2008 Hulett & Associates, LLC 17
Affected by Two 100%Trigen (10,90) Risks
(1) .95, 1.05. 1.15
(2) .90, 1.00, 1.05

A Cost of $1.0 million Affected by Two 50% Risk Drivers
© 2008 Hulett & Associates, LLC 18
Affected by Two 50%Trigen (10,90) Risks
(1) .95, 1.05. 1.15
(2) .90, 1.00, 1.05

Risk Factors Model How Correlation OccursCoefficients are Calculated (1)
© 2008 Hulett & Associates, LLC 19
Risk #1P = 50%, Factors
.95, 1.05, 1.15
Cost Item A Cost Item B
Cost Items A and B Correlation is Calculated to be 100%
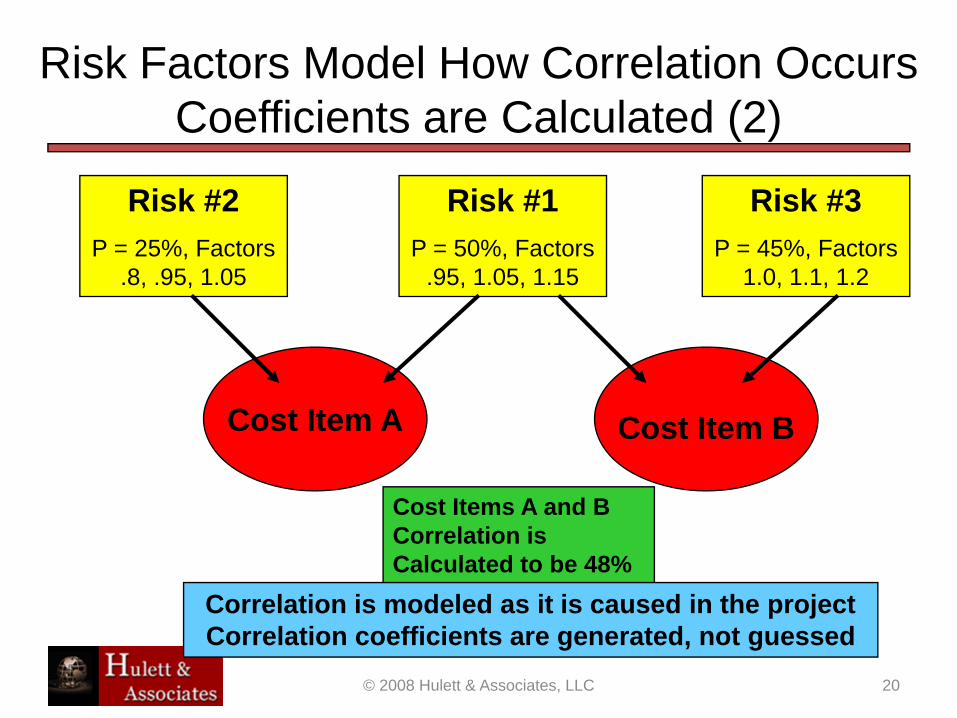
Risk Factors Model How Correlation OccursCoefficients are Calculated (2)
© 2008 Hulett & Associates, LLC 20
Risk #1P = 50%, Factors
.95, 1.05, 1.15
Cost Item A Cost Item B
Cost Items A and B Correlation is Calculated to be 48%
Risk #2P = 25%, Factors
.8, .95, 1.05
Risk #3P = 45%, Factors
1.0, 1.1, 1.2
Correlation is modeled as it is caused in the projectCorrelation coefficients are generated, not guessed

Simplified Cost Model of a Refinery Project (1)
Refinery Construction Project Baseline Estimate (1)
Cost Category Labor Equipment TotalDirect Field Costs ($ millions)
Long Lead Equipment (LLE) 15 330 345Equipment 30 1,200 1,230Materials 288 1,935 2,223Total Direct Field Costs 333 3,465 3,798
Indirect Field CostsSupervision 360 0 360Time-Related Overhead 315 0 315Total Indirect Field Costs 675 0 675
Total Direct & Indirect Costs 1,008 3,465 4,473
© 2008 Hulett & Associates, LLC 21

Simplified Cost Model of a Refinery Project (2)
© 2008 Hulett & Associates, LLC 22
Refinery Construction Project Baseline Estimate (2)
Labor Equipment Total
Cost Category ($ millions)Construction Management 630 630Material Related 180 540 720Home Office Engineering Staff 540 540Overhead & Fees 560
Total Contractor Related 2,358 4,005 6,923Owner-Related
Project Management Team 450 0 450Materials 0 400 400Total Owner-Related 450 400 850
TOTAL BASE ESTIMATE 7,773

Risk Factors Probability and Impact Ranges
© 2008 Hulett & Associates, LLC 23
Risk Drivers and their Properties
ID Name Prob.3-Point Estimate of RiskFactor
Minimum ML Maximum
R.1 Contracting Strategy 40% 0.90 1.10 1.25
R.2 Design Changes 60% 0.95 1.05 1.20
R.3 Equipment Suppliers Busy 45% 1.00 1.05 1.30
R.4 Availability of Key Staff JV / PMT 40% 0.95 1.00 1.20
R.5 Number of Bidders 40% 0.95 1.00 1.50
R.6 Integration Management 40% 1.00 1.05 1.15
R.7 Labor Rate 50% 0.90 1.00 1.20
R.8 Construction Labor Productivity 45% 1.00 1.10 1.30
R.9 Bulk Material Cost 40% 0.90 1.05 1.20
R.10 Construction Management Staff 70% 1.00 1.05 1.15

Assign Risk Drivers to Cost Elements
© 2008 Hulett & Associates, LLC 24
Cost Category Risks
Direct Field Costs ContractStrategy
Design Changes
Equip. Supplier
JV/PMT Staff
# of Bidders
Integ. Mgt.
Labor Rate
Labor Prod.
Bulks Cost CM Staff
Long Lead Equipment (LLE) X X X
Equipment X X X X
Materials X X X X
Total Direct Field CostsDirect & Indirect Labor Costs X X X
Construction Management X
Material Related X XHome Office Engineering Staff X X X
Overhead & Fees X x
Owner-Related Project Management Team X
Materials X

Cost Risk Analysis Results (1)
© 2008 Hulett & Associates, LLC 25
Most Likely cost is about $8 billion

Cost Risk Analysis Results (2)
© 2008 Hulett & Associates, LLC 26
Base Cost is 9.3% likely
80th percentile is $9.53 million for a $1.76 million (23%) Contingency Reserve

Cost Risk Analysis Results (3)
© 2008 Hulett & Associates, LLC 27
Percentile $ mill. %
10% 7,793 0%
20% 7,999 3%
30% 8,183 5%
40% 8,383 8%
50% 8,611 11%
60% 8,866 14%
70% 9,168 18%
80% 9,529 23%
90% 10,118 30%

Risk Sensitivity –Beginning of Risk Prioritization
© 2008 Hulett & Associates, LLC 28

Risk Drivers Listed in Priority Order
© 2008 Hulett & Associates, LLC 29
All Risks Included 9.53Improvement if Mitigated
Risks $ Bill. % SavingsNumber of Bidders 0.42 4%Equipment Suppliers Busy 0.41 4%Contracting Strategy 0.30 3%Design Changes 0.14 1%Bulk Material Cost 0.12 1%Construction Labor Productivity 0.10 1%Availability of Key Staff JV / PMT 0.07 1%Labor Rate 0.04 0%Construction Management Staff 0.02 0%Integration Management 0.01 0%
These risks are prioritized as if they could be completely mitigated. That is not possible, but it indicates the priority for risk mitigation actions.

Partial Risk Mitigation (1)• The number of bidders in today’s heated
oil and gas building environment is problematic and deemed as an important cost risk driver
• With few bidders we expect contractors to feel freer to include high levels of risk premium and profit into their bids
• A similar observation can be made for equipment suppliers that are busy
© 2008 Hulett & Associates, LLC 30

Partial Risk Mitigation (2)
© 2008 Hulett & Associates, LLC 31
•Suppose that we were willing to allow bidders to form Joint Ventures or funding their bidding expenses?. What could happen?
Example of Risk MitigationProb.
3-Point Estimate of RiskFactor
Minimum ML Maximum
Before Risk Mitigation
Number of Bidders 40% 0.95 1.00 1.50
After Risk Mitigation
Number of Bidders 20% 0.90 1.00 1.25

Risk after Mitigating Number of Bidders Risk
© 2008 Hulett & Associates, LLC 32

Number of Bidders is Now Lower on the Priority List
© 2008 Hulett & Associates, LLC 33

Impact of Partially Mitigating the Number of Bidders Risk
© 2008 Hulett & Associates, LLC 34
Partially mitigating Number of Bidders Risk improves the risk at the P-80 level
PercentileNo Mitigation Partial Mitigation
$ mill.
10% 7,793 7,746
20% 7,999 7,920
30% 8,183 8,083
40% 8,383 8,248
50% 8,611 8,424
60% 8,866 8,633
70% 9,168 8,869
80% 9,529 9,185
90% 10,118 9,637

Summary – Quantitative Risk Analysis Results and Risk Prioritization using Risk Drivers
• Project risks are characterized by their:– Probability of occurring– Impact range as a multiplicative factor– Cost line items they impact if they occur
• Monte Carlo simulation develops:– Probability of achieving the cost target (without
contingency)– Contingency reserve of cost needed to satisfy the
organization’s appetite for risk• Risks can be taken out of the simulation one at a time
and their marginal impact (through the cost model) calibrated:– Risk prioritization is based on this analysis– Partial risk mitigation can be studied for benefit/cost
analysis
© 2008 Hulett & Associates, LLC 35

Project Cost Risk Analysis:The Risk Driver ApproachPrioritizing Project Risks
and Evaluating Risk ResponsesDavid T. Hulett, Ph.D.
Keith Hornbacher, MBAWaylon T. WhiteheadHulett & Associates, LLC
Los Angeles, CA USAwww.projectrisk.com
© 2008 Hulett & Associates, LLC 36