project controls expo - 31st oct 2012 - extending earned value methodology to track scope and...
TRANSCRIPT

Copyright @ 2011. All rights reserved
Extending Earned Value Methodology To Track Scope And Performance For Key Labour Categories and Commodity Usage for Small To Large Industrial Projects
Project Controls Expo -‐ 31st Oct 2012 Twickenham Stadium, London

Copyright @ 2011. All rights reserved
About the Speaker Roland Horat, Managing Director of Supertech Project
Management (Australia) Pty Ltd. an international project management consulting company.
Roland is a specialist in Earned Value (EVPM) Based
Project Management and Control systems. Roland’s company has developed the EVENGINE range of
earned value based project control and reporting software in compliance with international and industry best practice. The software is featured at this Expo.

Copyright @ 2011. All rights reserved
To illustrate the process, we draw on Supertech’s participation in the development and maintenance of a number of industry projects such as:
Case Studies:
Jindal Steel and Power’s (JSPL) 12.5 MTA Steel Plant Project Control System. http://www.jindalsteelpower.com/facilities/domestic/orissa/angul.aspx We consider this to be a Large Industrial Project (Mega Project).
Industrial Plants and Refineries etc.
Commercial High Rise

Copyright @ 2011. All rights reserved
Case Study To Illustrate Coding Practice – JSPL Phase 1 (1.5 MTA) the work is divide into controllable and trackable work packs: Nine (9) Technology Based Work Packs: 1. CGP - Coal to Gasification Plant 2. LDP - Lime & Dolomite Plant 3. DRI - Direct Reduced Iron Plant 4. OXP - Oxygen, Nitrogen Plant 5. PB - Process Boilers 6. CAW - Coal Washery 7. SMS - Steel Melt Shop 8. SLC - Slab Caster 9. PML - Plate Mill
How does this translate into a workable control system – the Software used?
• The Work Packs are represented in the Control System as Projects.
• Projects are collectively represented in the Master Schedule to L3 using Microsoft Project 2007, with Units of Work and Material (Commodity) Usage held within the EVENGINE Project Control Software
• Projects are represented to L5 in Detailed Stand Alone Schedules using Primavera P6 Version 7 with assigned activity selected Labour & Non-Labour resources for daily weekly scheduling purposes.
Eight (8) Supporting Infrastructure Work Packs:
1. PWR - HV Power 2. GDS - Gas Distribution System 3. RMHS - Raw Material Handling System 4. CTU - Central Utilities (Water Supply) 5. CCV - Central Civil (Earthworks, Roads &
Drainage) 6. HSE - Housing 7. FGS - Liquid Fuel & Gas Storage 8. CMA – Compressed Air Plant
Copyright @ 2011. All rights reserved
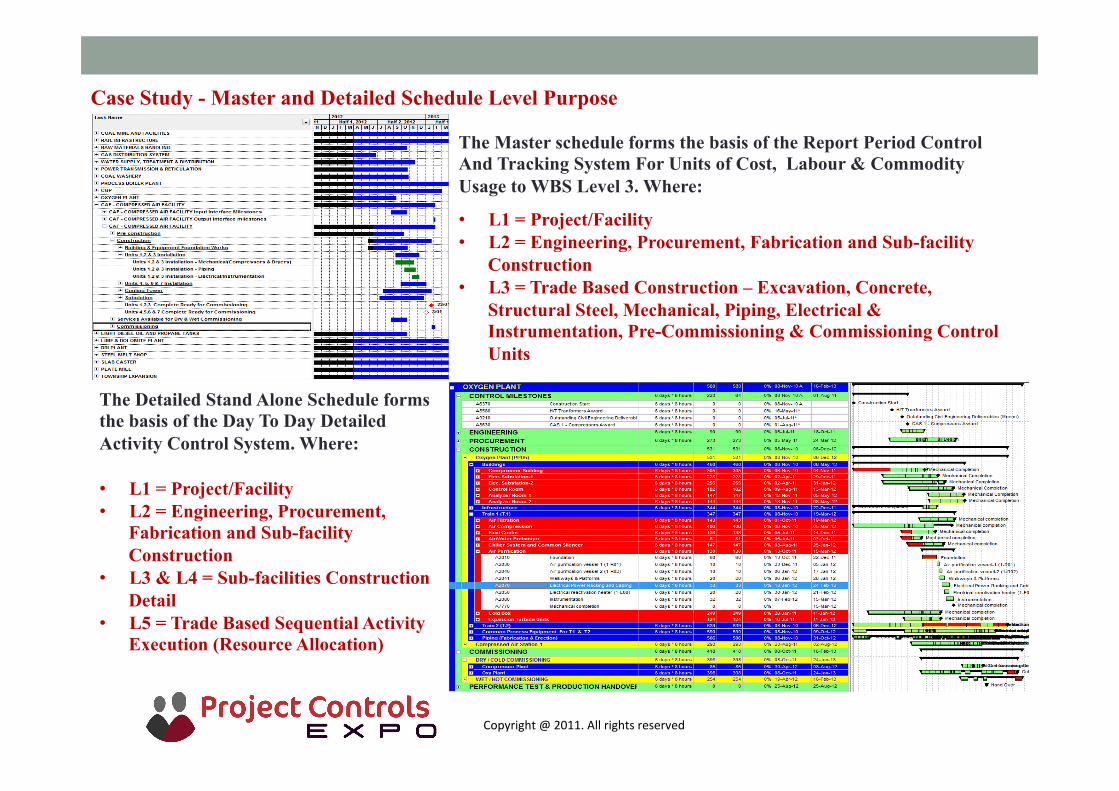
The Master schedule forms the basis of the Report Period Control And Tracking System For Units of Cost, Labour & Commodity Usage to WBS Level 3. Where:
• L1 = Project/Facility • L2 = Engineering, Procurement, Fabrication and Sub-facility
Construction • L3 = Trade Based Construction – Excavation, Concrete,
Structural Steel, Mechanical, Piping, Electrical & Instrumentation, Pre-Commissioning & Commissioning Control Units
The Detailed Stand Alone Schedule forms the basis of the Day To Day Detailed Activity Control System. Where: • L1 = Project/Facility • L2 = Engineering, Procurement,
Fabrication and Sub-facility Construction
• L3 & L4 = Sub-facilities Construction Detail
• L5 = Trade Based Sequential Activity Execution (Resource Allocation)
Case Study - Master and Detailed Schedule Level Purpose

Copyright @ 2011. All rights reserved
Case Study - The Master Schedule > Project Control Software Link
• Primary key used is the Project and Activity Unique ID
• Microsoft Project maintains all of the scheduling information: Current and Baseline
• EVENGINE refreshes by report period current and baseline schedule data
• EVENGINE holds and maintains all current and baseline Earned Value Units for Cost, Work and Material (Commodity) Usage

Copyright @ 2011. All rights reserved
Project Control Data Requirements by Activity to undertake Earned Value Performance Measurement (EVPM) and Cost Engineering Reporting:
Combined data requirements for cost, work and material usage based productivity Indicator analysis:
Mandated data fields are marked (Yes) and optional marked (No).
Additional data requirements for Cost Engineering:
Copyright @ 2011. All rights reserved
Key Data Coding Requirements For Reporting
• The (WBS) Work Breakdown Structure code for defining the Scope of Work and for mapping imported actual units of cost, work and material usage to WBS elements
• The (CA) Control Account code for defining work packages (contractual lumps of work) and for mapping imported actual units of cost, work and material usage to CA groupings of tasks
• The (OBS) Organizational Breakdown Structure code for defining departmental and organizational responsibility
• The Stage/Phase code used group tasks into project development and approval gates mirroring the development lifecycle
• The Area/Facility code used to identify and group dispersed facilities for complex mega projects and used to identify sub-facility work breakdown
• The User Defined Fields 1 & 2 codes used to further group tasks for specific tracking and reporting purposes
• Resource Code to track and group labour and material with common characteristics across the project
Additional Cost Engineering Specific CA Coding for Type Classification
• Awarded or Un-Awarded status – used for commercial and finance control • Commercial Type: Contract or Purchase Order – used for commercial and finance control • Committed or Un-committed status – used for finance control
To facilitate reporting and control the project the following activity and resource codes are required:

Copyright @ 2011. All rights reserved
Case Study - Project Codes For Managing Data:
CA - Control Accounts – Identifies some 250 Contractors & Suppliers, Code describes both facility, contract number Description and Type. OBS - Organizational
Breakdown Structure- Identifies some 19 Departments responsible for project implementation and control.
Stage/Phase - identifies three phases to the project.
Area/Facility - Identifies some 19 vertical technology and common horizontal areas and facilities to the project.
User Defined Code 1 – List of some 292 Sub-facilities
User Defined Code 2 – lists some 158 major contractors and suppliers tracked for the project.

Copyright @ 2011. All rights reserved
Case Study - Resource Codes for Managing Labour and Material (Commodity) Units
Resource Code – Lists some 25 labour and commodity codes being tracked.
• Step 1 - Decide on Key Labour and Commodities for Tracking including their unit of measure
• Step 2 - Define the code list • Step 3 - Assign code and BAC and EAC units to activities for
tracking and reporting
“LIST OF NIGP COMMODITY CODES” http://www.peelregion.ca/finance/purchasing/biddocs/vendapp/comcodes.pdf

Copyright @ 2011. All rights reserved
Application of Combined Filter Codes for Reporting
• User Defined 1&2
• Cost Account (CA)
• WBS
• OBS
• Resource
• Area/Facility
• Project
• Stage/Phase
Purpose of filters is to drill down and focus on selected data depending on the report requirements Type of report are characterised by:
• Contractor Reports • Commodity Specific Reports
• Project Progress Reports • Financial Reports
• Schedule Based Report
• Multiple Filtering Options:

Copyright @ 2011. All rights reserved
Selecting and Grouping Filtered Data for Focusing Reports
User Defined 1&2
Cost Account (CA)
Task
OBS
Resource
Area/Facility
Stage/Phase
Project
Committed/Uncommitted
Awarded/Not Awarded
Purchase Order/Contract
Multiple Data Selection: • Metrics • Indicators • Predictors
Multiple Grouping Options:

Copyright @ 2011. All rights reserved
Project Wide Commodity Specific Time Displacement Specific % S-Curves Representative Examples of Productivity Analysis Reports
• Commodity Time displacement Curves allows analysis of trade separation
• Identification of congestion with possible delay effects
• Identification of acceleration measures for early completion for mechanical, Piping & Electrical Disciplines
Copyright @ 2011. All rights reserved
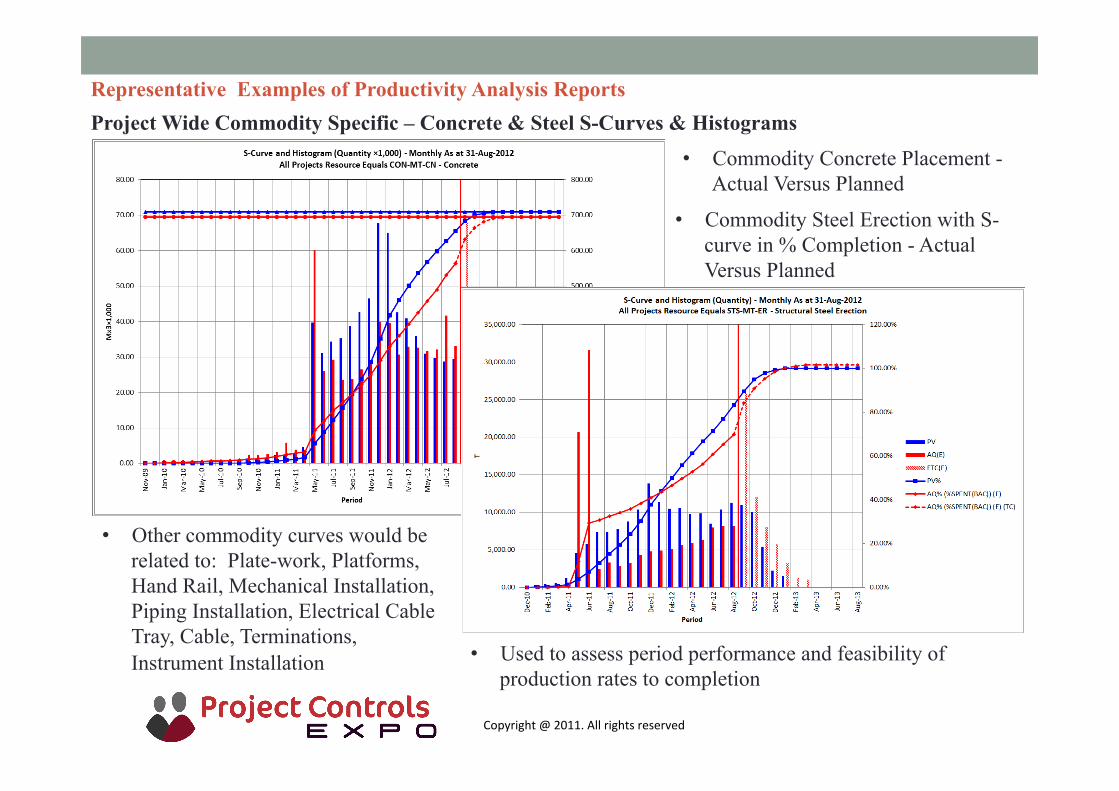
Representative Examples of Productivity Analysis Reports Project Wide Commodity Specific – Concrete & Steel S-Curves & Histograms
• Commodity Concrete Placement - Actual Versus Planned
• Commodity Steel Erection with S-curve in % Completion - Actual Versus Planned
• Other commodity curves would be related to: Plate-work, Platforms, Hand Rail, Mechanical Installation, Piping Installation, Electrical Cable Tray, Cable, Terminations, Instrument Installation • Used to assess period performance and feasibility of
production rates to completion

Copyright @ 2011. All rights reserved
Representative Examples of Productivity Analysis Reports Project Wide Commodity Specific Budgeted Concrete By Facility
• Identifies the allocation of concrete quantities for placement to contractors by facility • Percentage Distribution identifies over or under allocation of work to contractors

Copyright @ 2011. All rights reserved
Representative Examples of Productivity Analysis Reports Project Wide Commodity Specific – Concrete – Remaining Work by Facility
• Identify the remaining quantity of work to be completed by facility by contractor • Identifies over or under loading of contractors, used for redistribution of work

Copyright @ 2011. All rights reserved
Representative Examples of Productivity Analysis Reports Project Wide Commodity Specific Concrete Remaining Quantity Period Targets and Placement Rates.
• Used to analyse Contractor Performance against Baseline (Target) Values • Used to assess the feasibility of meeting remaining target quantities for remaining periods • Totals can be used to assess the requirement for consumables to be held in stock to sustain the work to
completion

Copyright @ 2011. All rights reserved
Representative Productivity Analysis Reports Using Filters for Facility Specific – Time Displacement Specific % S-Curves
• Details the production history and planned work to completion by % and discipline • Identifies trade separation, congestion or acceleration

Copyright @ 2011. All rights reserved
Representative Productivity Analysis Reports Facility Specific – Concrete & Steel S-Curves & Histograms
• Commodity Concrete Placement - Actual Versus Planned
• Commodity Steel Erection with S-curve in % Completion - Actual Versus Planned
• Other commodity curves would be related to: Plate-work, Platforms, Hand Rail, Mechanical Installation, Piping Installation, Electrical Cable Tray, Cable, Terminations, Instrument Installation.

Copyright @ 2011. All rights reserved
Representative Examples of Productivity Analysis Reports Facility Specific – Production Reports
• Contractor allocation of budgeted work for key commodity groupings
• Time phased Actual and Forecast to Completion Quantities against baseline or target period quantities for commodity based contracts
• Data is used to set and track period actuals against targets.

Copyright @ 2011. All rights reserved
• Productivity reports measure and benchmark project performance against industry published Key Performance Indicators [KPIs].
• Benchmarking identifies where improvements can be made to lower costs, increase productivity and profitability.
• Publications with Productivity Constants:
Representative Examples of Productivity Analysis Reports Facility Specific – Commodity Specific Productivity Reports
Copyright @ 2011. All rights reserved
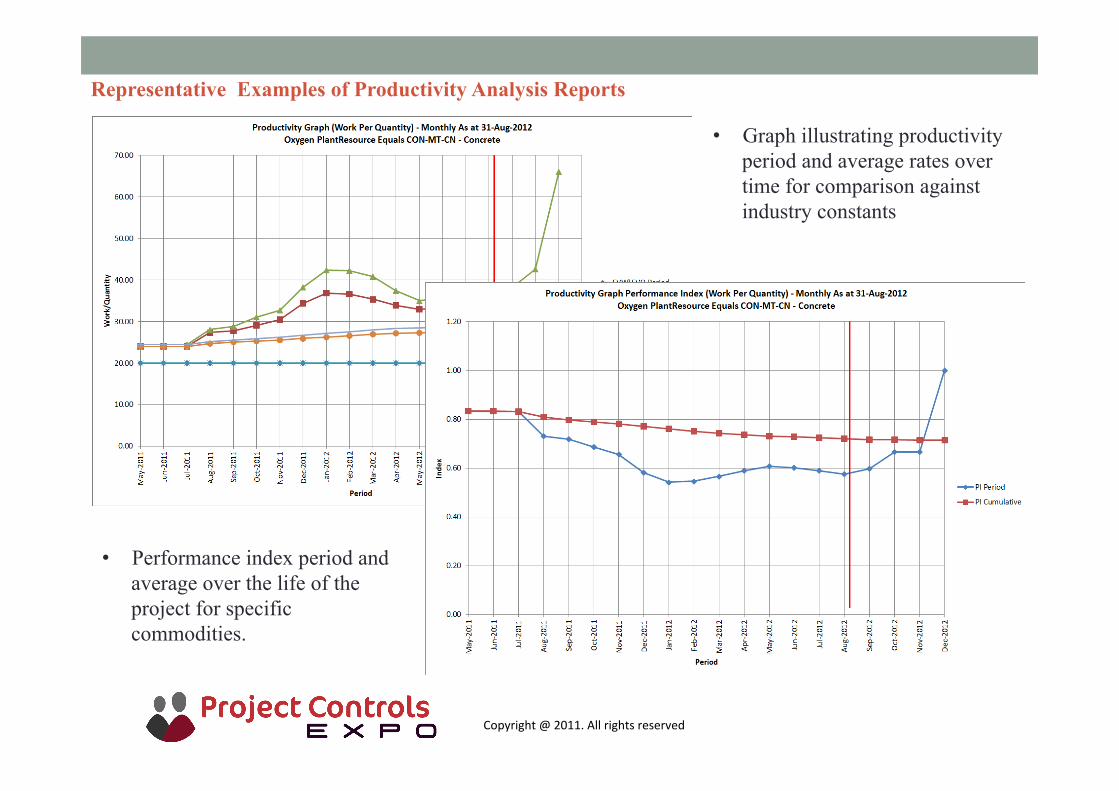
Representative Examples of Productivity Analysis Reports
• Graph illustrating productivity period and average rates over time for comparison against industry constants
• Performance index period and average over the life of the project for specific commodities.
Copyright @ 2011. All rights reserved
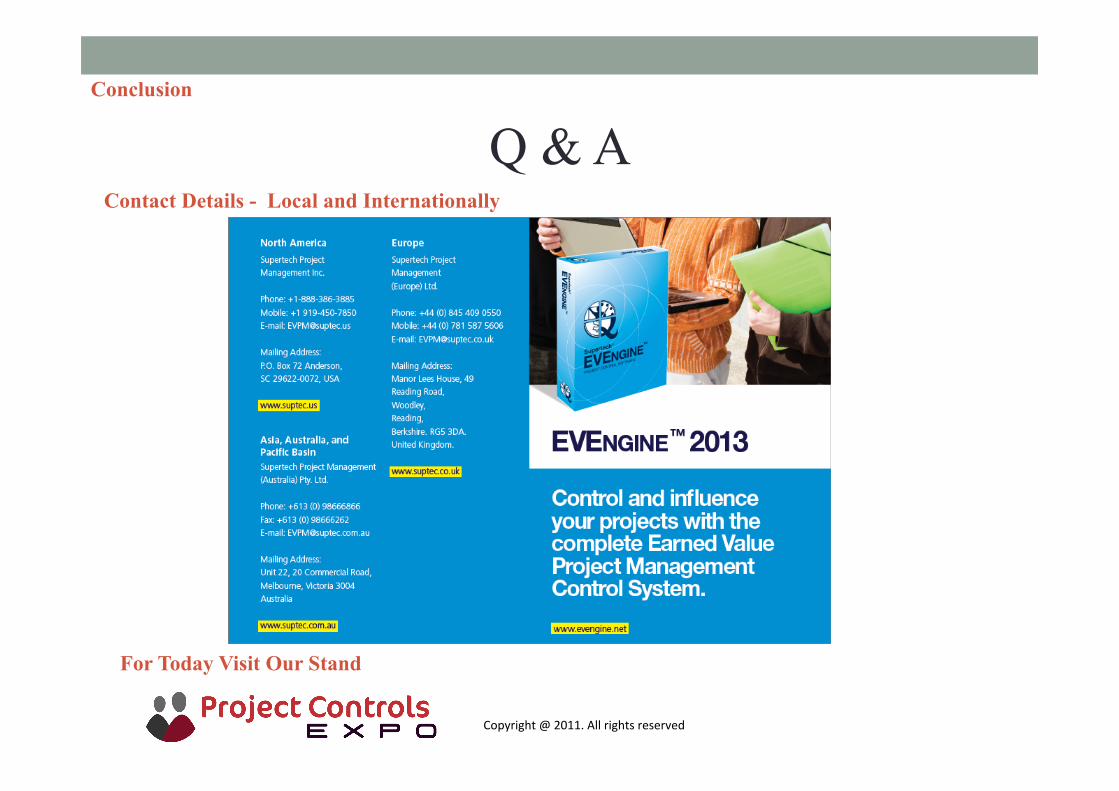
Q & A Conclusion
Contact Details - Local and Internationally
For Today Visit Our Stand