progressive taxes and firm births - hec unil
TRANSCRIPT
Int Tax Public Finance (2013) 20:129–168DOI 10.1007/s10797-012-9218-z
Progressive taxes and firm births
Hans Ulrich Bacher · Marius Brülhart
Published online: 30 March 2012© Springer Science+Business Media, LLC 2012
Abstract Tax reform proposals in the spirit of the “flat tax” model typically aim toreduce three parameters: the average tax burden, the progressivity of the tax sched-ule, and the complexity of the tax code. We explore the implications of changes inthese parameters for entrepreneurial activity, measured by counts of firm births. TheSwiss fiscal system offers sufficient intra-national variation in tax codes to allow usto estimate such effects with considerable precision. We find that high average taxesand complicated tax codes depress firm birth rates, while tax progressivity per se pro-motes firm births. The latter result supports the existence of an insurance effect fromprogressive corporate income taxes for risk-averse entrepreneurs. However, impliedelasticities with respect to the level and complexity of corporate taxes are an order ofmagnitude larger than elasticities with respect to the progressivity of tax schedules.
JEL Classification H32 · H2 · H7 · R3
Keywords Progressive taxation · Entrepreneurship · Risk taking · Firm location ·Count models
H.U. BacherCredit Suisse AG, 8070 Zurich, Switzerlande-mail: [email protected]
M. Brülhart (�)Department of Economics, Faculty of Business and Economics, University of Lausanne,1015 Lausanne, Switzerlande-mail: [email protected]
M. BrülhartCentre for Economic Policy Research, London, UK
130 H.U. Bacher, M. Brülhart
1 Introduction
Despite a recent recession-induced shift toward more progressive taxation, the flat-tax model retains widespread appeal. By March 2012, 26 countries were operatingflat-rate income tax systems, as were seven US states.1 Many other countries andregions have considered reforms that would flatten their tax schedules. The most fre-quently invoked argument in favor of flat taxes is that they simplify both complianceand enforcement, but moving toward flat-rate taxation has a host of other economicimplications, in terms of both efficiency and equity.2 In this paper, we focus on oneefficiency-related dimension of a particular type of flat tax: the impact of flat-ratecorporate income taxes on the generation of new firms.3
The specific choice between flat and progressive corporate tax rates is a topic ofongoing debate in a number of industrialized countries. The United States, for ex-ample, raises a progressive federal corporate income tax, as do Japan and the UnitedKingdom. Conversely, Canada, France, Germany, Italy and Spain apply essentiallyflat-rate corporate taxes (with some exceptions for small businesses). The two ap-proaches sometimes coexist at sub-national level. In the United States, 31 states levyflat-rate corporate income taxes, 17 states levy progressive corporate income taxesand three states do not tax corporate income.
Births of new firms, in turn, are of interest for at least two reasons. First, we con-sider them a proxy for entrepreneurship, which, following Schumpeter, has come tobe regarded as a key driver of economic growth.4 Second, the number of firms choos-ing to start operations in a particular jurisdiction can be taken as a measure of thatjurisdiction’s locational attractiveness.
Our empirical work is based on data for Switzerland, which offers a well suitedsetting for an analysis of this issue. While the Swiss federal government levies a flat-rate corporate income tax, a wide variety of (flat and progressive) tax schedules areapplied at the sub-federal level, by Switzerland’s 26 fiscally autonomous cantons.Furthermore, below the cantonal level, some 2,700 municipalities levy taxes at oftenvery different average rates and with some further variations in progressivity.
We exploit the variation of tax schedules within Switzerland for an analysis ofthe impact of corporate tax progressivity on the creation of new firms. Our analy-sis is organized around three dimensions of corporate income taxes: the implications
1See en.wikipedia.org/wiki/Flat_tax.2See, e.g., Keen et al. (2008) for a general appraisal of recent flat-tax reforms.3By considering corporate taxes in isolation, we take a narrower view than the most radical flat-tax model,in which a single tax rate is applied across all tax bases and corporate income may be taxed only whenpaid out as dividends (see, e.g., Hall and Rabushka 2007).4This intuitive assertion finds theoretical support in endogenous growth models, where entrepreneurs areprimarily cast in the role of conduits between scientific research and market-oriented production (see, e.g.,Michelacci 2003). We can also invoke some relevant empirical evidence. Reynolds et al. (1995) and Au-dretsch and Fritsch (2002) have found that regions with higher firm formation rates enjoy higher growth,in the United States and Germany, respectively. These results were broadly confirmed by a number ofcountry-level studies in the January 2008 special issue of Small Business Economics (see Fritsch 2008).Employing indirect measures of entrepreneurship, Glaeser et al. (1992) have found industry-level employ-ment growth to be higher in US with below-average firm sizes; and Murphy et al. (1991) have reportedpositive growth effects of the share of engineering graduates in a large cross section of countries.
Progressive taxes and firm births 131
of higher or lower average tax burdens (the “level effect”), the implications of pro-gressivity (the “insurance effect”), and the implications of tax complexity. To thebest of our knowledge, ours is the first study to evaluate these three effects jointly.The smallness and regulatory homogeneity of Switzerland coupled with considerableintra-national variance in tax regimes limit the potential for estimation bias due tounobserved locational determinants of firm births.
The remainder of this paper is organized as follows. In the next section we re-view the relevant literatures on firm births, firm location, taxation and risk taking. InSect. 3, we present a simple model of risk taking and progressive taxation to formal-ize the intuition of the insurance effect. In Sect. 4 we present our empirical model andour data set for Switzerland. Estimation results are reported and discussed in Sect. 5.Section 6 concludes.
2 Literature background: taxes and firm births
2.1 The tax level effect
The three dimensions of corporate tax policy we focus on have previously been sub-ject to very different degrees of scientific scrutiny. While relatively little attention hasbeen paid to the effect of corporate tax progressivity, and even less evidence exists onthe implications of tax complexity, there exists an extensive theoretical and empiricalliterature on the effect of changes in the level of (average and marginal) corporate taxrates. The available evidence strongly supports the existence of a moderating impactof the level of corporate taxes on firm births at both the national and the local level.5
In a related strand of literature, economists have explored the impact of corporatetax levels on “income shifting” between the personal and the corporate tax base. Mosttax systems leave considerable room for manoeuvre on this choice, mainly via dif-ferent organizational forms and via flexible accounting rules governing the headingunder which the remuneration of owner-workers is declared. Several available stud-ies show that, not surprisingly, the share of income that is declared as corporate ishigher the lower is the level of corporate relative to personal income taxes (see, e.g.,Gordon and Slemrod 2000; Goolsbee 2004; Cullen and Gordon 2007; and de Mooijand Nicodème 2008). Some of the observed income shifting into the corporate taxbase is due to the incorporation of previously non-corporate organizations or due tothe division of larger corporations into smaller firms. In that sense, income shiftingalso contributes to the creation of new firms.
2.2 The tax progressivity effect (insurance effect)
If tax payers’ decisions are made under uncertainty, the progressivity of tax scheduleswill have implications that differ from those of the level of (average effective) taxes.
5For international evidence, see e.g. de Mooij and Ederveen (2003), Hines (2007), and Da Rin et al. (2011);and for recent intra-national evidence see Feld and Kirchgässner (2003), Guimaraes et al. (2004), Rathelotand Sillard (2008), Duranton et al. (2011), and Brülhart et al. (2012).
132 H.U. Bacher, M. Brülhart
Thus, under uncertainty, the variance of the tax bill matters in addition to the expectedlevel of the tax bill.
Domar and Musgrave (1944) have famously shown that taxation can encouragerisk taking.6 Whilst assuming a flat-tax schedule, they also took account of loss-offset provisions that imply a negative tax in case of losses. A higher tax rate thenreduces both the expected level and the expected variance of post-tax income, which,depending on investor preferences, may make risky ventures relatively more attractiveby reducing risk through an implied insurance effect of taxation.
The Domar–Musgrave model, by featuring a flat tax over positive income, is notwell suited to a formal distinction between the implications of changes in the levelof the expected tax bill and changes in progressivity per se. An intuitive conjecturefrom the Domar–Musgrave result is that increased progressivity, provided it does notaffect the expected tax bill, should be favorable to entrepreneurial risk taking.7 Thisintuition is supported to some extent by formal analysis. Ahsan (1974) considered in-vestment in a risky asset under a flat-rate tax with and without a tax-exempt threshold,the former corresponding to a progressive schedule. Conditional on constant expectedtax revenue, he found that risk taking is greater under the progressive tax than underthe proportional tax, given standard assumptions on investors’ aversion to risk. In asimilar model, Cowell (1975) found that progressivity favors investment in the riskyasset if the utility function is assumed to be quadratic, but may deter risk taking underdifferent preferences.8 Gordon (1985), allowing for a general form of risk aversionand corporate tax progressivity in a general-equilibrium setting, found that raisingthe marginal tax rate, other things equal, promotes investment while raising the aver-age tax rate, other things equal, discourages investment. Waterson (1985) consideredthe implications of a quadratic tax function, again assuming a constant expected taxbill. He concluded that, while the effect of progressivity on risk taking is positive forcertain parameter configurations, its sign cannot be established in general.9
Empirically, the impact of personal income tax progressivity on entry into self-employment has been explored by Gentry and Hubbard (2000, 2005). They reportnegative impacts of personal income progressivity on entrepreneurship. The main ex-planation for these findings is that progressive taxation acts as a “success tax” on prof-itable ventures: since entrepreneurs on average have higher incomes than employees,
6A corresponding analysis concerning personal income taxes has been provided by Varian (1980).7Cullen and Gordon (2006b) have put it as follows: “For any given tax treatment of losses, a progressivetax schedule on profits, holding expected taxes constant, should encourage risk taking. With progressiverather than proportional taxes, the owners get to keep a smaller fraction of large profits but a larger fractionof small profits. If expected tax payments are held fixed, this is a trade-off that any risk-averse individualgains from making.”8Cowell (1975) used the term “compensation” for what we refer to as the “constant expected tax bill”condition.9If entrepreneurial ventures are externally financed and entrepreneurs are subject to moral hazard (i.e. theyhave an incentive to shirk if their stake in the success of the venture is low), then the risk-reducing elementimplicit in progressive taxation may impede entrepreneurship (see e.g. Keuschnigg and Nielsen 2004; andHagen and Sannarnes 2007). To the extent that the incidence of progressive taxation is felt by financiersrather than by entrepreneurs, however, the findings of the earlier literature on taxation and risk taking stillapply.
Progressive taxes and firm births 133
progressive income taxation discourages entrepreneurial risk taking. Crucially, how-ever, this effect confounds the impact of tax progressivity with that of the expectedtax bill.10
Cullen and Gordon (2007) have estimated a model of entrepreneurial risk, con-trolling for both level and progressivity effects of corporate tax schedules using USdata. Entrepreneurial risk taking is defined empirically as the fraction of single taxfilers who report active non-corporate losses in excess of 10 percent of reported wageincome. While their estimated regression coefficients represent the impact of com-posite terms capturing “income shifting” and “combined risk” effects inherent in thetax code, and therefore elude simple interpretation, their derived simulation resultsreported in Cullen and Gordon (2006a) show that a revenue-neutral shift to a flat taxà la Hall and Rabushka (2007) would reduce entrepreneurial risk taking by more thanhalf. Their results are thus consistent with economically significant insurance effects.The main difference between our approach and that of Cullen and Gordon (2006a,2007) is that we explore the impact of taxation on the birth rates of incorporatedfirms across different locations, whereas they focus on entrepreneurial individualsreporting high losses across quantiles of predicted potential earnings. Our empiricalsetting offers inter-jurisdictional variation in the entire tax schedule. It thereby allowsa simple quantification of the various relevant dimensions of tax policy.
2.3 The tax complexity effect
A third way in which a change to a flat corporate income tax could potentially in-fluence entrepreneurship (in sectors other than accounting and legal services) is bysimplifying compliance via a reduction in complexity. Complexity has two compo-nents: the number of tax brackets and the definition of the tax base.
First, calculating tax liabilities is simpler with a single statutory tax rate than witha progressive tax schedule featuring multiple tax brackets. It seems reasonable, how-ever, to question the practical importance of the complexity implied by progressiveschedules alone.11
The most compelling case for the view that complexity raises compliance costscan be made if one moves beyond the narrow implications of progressivity aloneand considers the statutory definitions of the tax base. Administrative complicationsare most evident where numerous different types of tax base are distinguished andwhere the definitions of tax bases are subject to exceptions, deductions, tax creditsand the like. Such complexity is not a necessary correlate of progressivity, but flat-taxproposals usually involve a reduction both in progressivity and in the complexity ofthe determination of the tax base.
10Gentry and Hubbard (2000, 2005) have regressed the probability that an individual switches from em-ployment to self-employment on a set of variables including (a) the projected tax rate in case of unchangedemployment status and (b) a measure of tax progressivity computed as the difference in tax rates between a“successful” scenario, where taxable income increases by x percent, and an “unsuccessful” scenario, wheretaxable income decreases by y percent. They did not, however, control for the expected (i.e. probabilityweighted) tax rate in case of a switch to self-employment.11To cite Slemrod and Bakija (2004, p. 166), “a graduate tax-rate structure does not by itself directlycontribute any significant complexity to the taxpaying process. Once taxable income is computed, lookingup tax liability in the tax tables is a trivial operation (. . . ).”
134 H.U. Bacher, M. Brülhart
Edmiston et al. (2004) found that the number of special corporate tax rates hada significantly negative impact on flows of foreign direct investment into Europeanand Asian transition countries in the 1990s. However, and somewhat paradoxically,they report positive coefficients on an alternative complexity variable defined as thenumber of lines in the respective tax codes (similar to the measure that we will ap-ply).12 We are not aware of any prior empirical work relating firm births to the twocomponents of tax complexity.
3 A simple model of tax progressivity and entrepreneurship
In this section, we present a highly stylized model to formalize the effect of pro-gressivity on entrepreneurial risk taking, given a certain expected tax bill. Asnoted above, this effect has been analyzed before (Ahsan 1974; Cowell 1975;Waterson 1985). We propose a simple framework primarily for its heuristic value.13
Suppose a risk-averse entrepreneur has to choose where to locate her firm. Shewill make a high or low profit at the end of the year with a certain probability. Theonly salient difference between two potential locations arises from their corporateincome tax schedules: one location features a flat tax while the other location has aprogressive schedule. We ask which location the entrepreneur is better off choosing,provided that the expected corporate tax payments are the same in both locations.This constant expected tax bill condition is crucial to our analysis. Keeping the ex-pected after-tax profit constant, progressive taxation reduces the variance of profits bymore than linear taxation. As a consequence, tax progressivity serves as an insurancedevice: in bad times, an entrepreneur has to pay less than under a flat tax, whereas ingood times the tax bill is higher. This, in a nutshell, is how progressivity can favorentrepreneurial risk taking.
To formalize the intuition, consider a risk-averse entrepreneur with a standardBernoulli utility function over income w, U(w), with Uw(w) > 0 and Uww(w) < 0.The entrepreneur faces a simple lottery L = (pL,pH ) over two possible profit out-comes {πL,πH }, with πH > πL and πL �= 0.14
Profits are subject to either a flat or progressive tax schedule, defined as:
• flat tax rate: t
• progressive tax rate: tprogL = t + kL if π = πL and t
progH = t + kH if π = πH with
kL < 0 < kH , where kL, kH are constants.
12Edmiston et al. (2004) explain the apparent positive effect of the length of tax codes by pointing outthat more lines could imply greater legal precision—an aspect which might indeed be relevant in transitioncountries.13The main simplification of our approach compared to existing theory is that we constrain the range ofchoices to two options. This simplification allows us to posit a general (Bernoulli) utility function, which,unlike those adopted in prior studies, need not exhibit increasing absolute risk aversion (see also Feldstein1969). Cullen and Gordon (2006a) propose a similar model, taking utility as the log of income.14This framework also applies to cases where πL < 0. In such cases, the corporate tax rate turns negative,implying a subsidy (e.g. through loss-offset or carry-forward provisions). Since taxation in our model doesnot include a lump-sum tax part (payable independently of the realization of profits), we exclude πL = 0.In our model, if πL = 0, only πH would be taxed (at the same rate as the flat tax rate).
Progressive taxes and firm births 135
In addition, we impose the following three conditions:
Condition 1 (Constant expected tax bill condition) The expected tax bill is constant:
[t + kL]pLπL + [t + kH ]pH πH = tpLπL + tpH πH .
Hence, expected after-tax income is assumed to be the same under the two taxschedules.
Condition 2 (Spread condition)Risk is a function of the spread (the difference) of the two outcomes, πL and πH ,
whereas the probabilities and expected pre-tax profits are held constant.
This defines πL:
πL = Π̄ − p̄H πH
p̄L
, (1)
where Π̄ = pLπL + pH πH ≥ 0 is expected pre-tax profit, and upper bars designconstants.
This condition implies that an increase in the variance of post-tax income w (andthus in risk) follows only from an increase in the spread of the two pre-tax profitlevels. For notational ease, we suppress the upper bars henceforth.15
Conditions 1 and 2 allow us to express kL as a function of πL, πH and kH :
kL = − pH πH
Π − pH πH
kH . (2)
Condition 3 (No-reversal condition) Post-tax income in the low-profit outcome can-not be higher than post-tax income in the high-profit outcome:
[1 − t − kL]πL ≤ [1 − t − kH ]πH .
Hence, tax rates are not allowed to be so progressive as to reverse the ordering ofthe post-tax outcomes relative to the pre-tax outcomes.
Expected utility with a flat-tax schedule then takes the following form:
EU(wflat) = pLU
([1 − t]πL
) + pH U([1 − t]πH
)
= pLU
([1 − t]Π − pH πH
pL
)+ pH U
([1 − t]πH
),
while expected utility with a progressive tax schedule becomes
EU(wprog) = pLU
([1 − t − kL]πL
) + pH U([1 − t − kH ]πH
)
= pLU
([1 − t + pH πH
Π − pH πH
kH
]Π − pH πH
pL
)
+ pH U([1 − t − kH ]πH
).
15In what follows, brackets are used for mathematical operations, whereas parentheses are used for func-tions.
136 H.U. Bacher, M. Brülhart
We can now explore whether a change from a flat to a progressive tax schedulebenefits a risk-averse entrepreneur.
Proposition 1 Expected utility is higher with a progressive tax schedule than with aflat-rate tax:
∂[EU(wprog) − EU(wflat)]∂kH
∣∣∣∣kH =0
> 0.
Proof Taking the derivative with respect to kH around kH = 0 results in
∂�EU(w)
∂kH
∣∣∣∣kH =0
= −pH πH
[Uw
(w
progH
) − Uw
(w
progL
)]> 0,
where �EU(w) = EU(wprog) − EU(wflat), and Uw(wprog� ) = Uw([1 − t − k�]π�),
� = {L,H }. �
This is the insurance effect: progressive taxation reduces the variance (and thusrisk) by more than a flat rate. Therefore, the expected utility of after-tax income ishigher under progressive taxation and a risk-averse entrepreneur prefers progressiveto flat taxation.
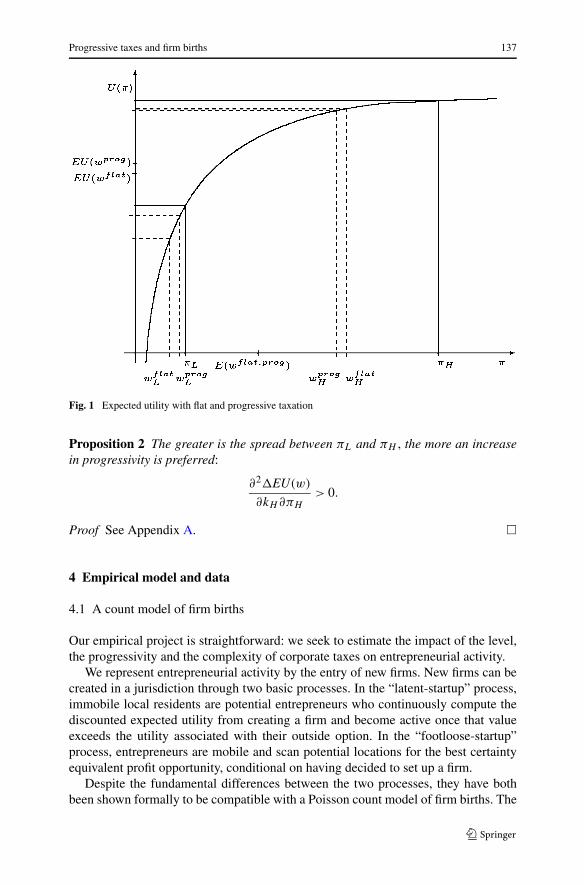
The logic of this simple model can be applied both to the location decision (choicebetween a location with a progressive tax and a location with a flat tax) and theentry-into-self-employment decision. Figure 1 illustrates this. Take the location de-cision, and suppose the two possible realizations πL and πH are equally probable.The entrepreneur can choose between two locations. The first one has a flat tax rate,and the corresponding after-tax realizations of πL and πH are w
flatL and w
flatH , re-
spectively. At the second location, after-tax realizations of π are wprogL and w
progH .
By the definition of progressive taxation and given the no-reversal condition, wflatL
< wprogL < w
progH < w
flatH . From the concavity of the utility function it follows that ex-
pected utility with a progressive tax, EU(wprog), is higher than expected utility witha flat tax, EU(wflat): the entrepreneur prefers the location with the progressive tax.
The same analysis can be applied to the entry decision. Again, suppose equallyprobable realizations πL and πH . Suppose that under a progressive tax the poten-tial entrepreneur is just indifferent between entering self-employment and being em-ployed, in which case she receives a fixed wage corresponding to the certainty equiv-alent of EU(wprog).16 Imagine a switch to a flat tax. As a consequence, and easilyseen in Fig. 1, the expected utility from being self-employed, EU(wflat) decreasesand so does the corresponding certainty equivalent (not drawn). Now, the potentialentrepreneur unequivocally prefers remaining in risk-free employment.
It is intuitive, given the logic of the insurance effect of progressive taxation, thatthis effect becomes more pronounced for riskier ventures: the greater is the disper-sion of uncertain outcomes, the more a potential entrepreneur stands to gain fromprogressive taxation. This can be expressed formally as follows.
16The certainty equivalent of EU(wprog) is not represented in Fig. 1. From Jensen’s inequality it follows
that this point is located to the left of E(wflat, prog).
Progressive taxes and firm births 137
Fig. 1 Expected utility with flat and progressive taxation
Proposition 2 The greater is the spread between πL and πH , the more an increasein progressivity is preferred:
∂2�EU(w)
∂kH ∂πH
> 0.
Proof See Appendix A. �
4 Empirical model and data
4.1 A count model of firm births
Our empirical project is straightforward: we seek to estimate the impact of the level,the progressivity and the complexity of corporate taxes on entrepreneurial activity.
We represent entrepreneurial activity by the entry of new firms. New firms can becreated in a jurisdiction through two basic processes. In the “latent-startup” process,immobile local residents are potential entrepreneurs who continuously compute thediscounted expected utility from creating a firm and become active once that valueexceeds the utility associated with their outside option. In the “footloose-startup”process, entrepreneurs are mobile and scan potential locations for the best certaintyequivalent profit opportunity, conditional on having decided to set up a firm.
Despite the fundamental differences between the two processes, they have bothbeen shown formally to be compatible with a Poisson count model of firm births. The
138 H.U. Bacher, M. Brülhart
latent-startup process has been modeled by Becker and Henderson (2000) and shownto lead directly to a Poisson model, subject to standard regularity conditions. Start-ing with Carlton (1983), the footloose-startup process has traditionally been modeledthrough a conditional logit representation, which can be formally derived from firm-level profit functions. Guimaraes et al. (2003) have demonstrated that Poisson esti-mation with group fixed effects returns identical coefficients to those obtained withconditional logit estimation.17
We can therefore directly write an expression for E(nijt ), the expected number ofnew firms (or of jobs in new firms) created in jurisdiction i, sector j and year t :
E(nijt ) = λijt
= exp(α1 corptaxlevelij t + α2 corptaxprogressivityit
+ α3 riskj ∗ corptaxprogressivityit + α4 corptaxcomplexityit
+ β ′ taxcontrolsij t + γ ′ othercontrolsij t + θ ′dj + ζ ′dt
), (3)
where nijt follows a Poisson distribution, corptaxlevel is a measure of the expectedaverage corporate income tax rate, corptaxprogressivity is a measure of the overallprogressivity of the corporate income tax schedule, corptaxcomplexity is a measure ofthe complexity of the corporate tax code, risk is a measure of the inherent riskiness ofentrepreneurial ventures in sector j , taxcontrols is a vector of variables to representtax burdens other than those on corporate profits, othercontrols is a vector of non-taxfactors influencing the likelihood of firm births, dj is a set of sector dummies, and dt
is a set of year dummies.Our four hypotheses are:
1. α1 < 0 (the effect on firm births of the expected corporate income tax level isnegative),
2. α2 > 0 (following Proposition 1, the effect on firm births of tax progressivity ispositive),
3. α3 > 0 (following Proposition 2, the positive effect of tax progressivity is strongerin inherently riskier sectors), and
4. α4 < 0 (the effect on firm births of tax schedule complexity is negative).
4.2 Identification and inference
When seeking to identify the coefficients of our empirical model (3), we face thepotential problem that, in general, corporate tax rules may be both cause and con-sequence of firms’ location choices. Resident firms influence local tax provisionsthrough the local tax base or through the political process of local tax setting. Ourstrategy for avoiding potential simultaneity bias is to study location choices of newfirms in narrow sectors. While it is easy to conceive how existing firms in a jurisdic-tion together may influence local taxation, we consider it highly unlikely that entrants
17The interpretation of the estimated coefficients, can be quite different; with the conditional logit implyinga “zero-sum” reallocation of a fixed number of firms and the Poisson implying a pure “positive-sum” tax-induced generation of new firms (Schmidheiny and Brülhart 2011).
Progressive taxes and firm births 139
in a particular sector, location and period exert significant and systematic influenceon pre-existing local tax rates. In our empirical setting, local jurisdictions are legallybound to apply identical statutory taxes across all sectors.18 We therefore considertax rates to be exogenous not only from the viewpoint of an individual firm but alsofrom that of a cohort of new firms in a particular sector, location and period.19
Another challenge to identification concerns the variable corptaxlevel, whichstands for the expected corporate tax rate. With progressive tax schedules, the ex-pected tax rate depends on expected profitability, which also affects the rate of firmbirths. Hence, our estimates of α1 might be biased. Furthermore, to underestimateexpected profitability would tend to bias estimates of α2 and α3 downward, and tooverestimate it would tend to bias them upward, because progressivity would thencorrelate with the mismeasured expected tax rate. Specifically, when expected prof-itability is underestimated, this will tend to induce a positive correlation between theunobserved component of the true expected tax rate and the progressivity measure,thus biasing downward the estimated α2. It is therefore important to take account ofany systematic differences in expected profitability. We compute corptaxlevel sep-arately for each sector-location pair, based on observed sector-average profitabilityrates. To the extent that firms’ expected profitability is sector specific conditional onthe included regressors, our coefficient estimates will be unbiased.
Finally, we need to think carefully about potential specification and omitted-variable bias. In the absence of a natural experiment and of sufficient intertemporalvariation, we have to rely essentially on cross-section identification. Our approach isto control for all conceivably relevant determinants of firm births in addition to thetax variables and to test the robustness of the estimated tax effects across a range ofspecifications. The smallness and institutional homogeneity of Switzerland plays toour advantage in this respect, as it facilitates our task of generating an exhaustive setof controls.
Some features of our research design affect inference. First, the Poisson modelimplies that the expected count, λijt , is equal to the variance of nijt . This is a strongassumption in our applications, as the variance mostly exceeds the expected count(overdispersion), and as we observe a large number of zero observations on thedependent variable. Second, our model includes several explanatory variables thatare purely municipality-year specific (such as the progressivity of the corporate taxschedule), while the dependent variable is municipality-sector-year specific. Suchaggregate variables bias the estimated standard errors downward if not correctly ad-justed for (Moulton 1986). Third, we observe firm startups over five years. We cannot
18Corporate taxation in Switzerland is based on legally binding statutory rates that depend solely on firms’profitability and capital base. The definitions of these tax bases have been harmonized countrywide by afederal law that has been in force since 1993 and that foresees no firm-specific or sector-specific regimesexcept for some clauses to avoid double taxation of holding companies. Some (mainly industrial) firmscan be offered tax rebates for a maximum of ten years after setting up a new operation. Available evidencesuggests that they affect less than 4 percent of new firms (Brülhart et al. 2012).19In principle, there could be unobserved exogenous shocks that have direct causal effects on both theprogressivity of local tax schedules and on sector-level firm births, thus potentially biasing our estimatedtax effects. While such a configuration does not strike us as likely, we cannot rule it out categorically, asour data do not allow us to instrument the tax variables. We seek to mitigate this potential problem byincluding a large set of controls.

140 H.U. Bacher, M. Brülhart
exploit this panel structure by including location-sector fixed effects, as the changesover time in our main explanatory are too small for the identification of any statisti-cally significant effects. However, the possible presence of location-sector random ef-fects needs to be taken into account when estimating standard errors. All three issuesare addressed by clustering standard errors in the two dimensions: by municipality-year and by municipality-sector. We therefore apply multi-way clustering as proposedby Cameron et al. (2011). Clustering by municipality-year takes care of the second is-sue discussed above, clustering by municipality-sector addresses the third issue, andeither of the clusters automatically accommodates the first issue.20
4.3 Data
4.3.1 The Swiss corporate tax system
Several features of its political structure and tax system make Switzerland particu-larly well suited to serve as a laboratory for research on the effects of fiscal policy.Specifically, the Swiss system features three propitious characteristics.
1. Local tax autonomySwiss taxes on corporate as well as on personal income are levied at three
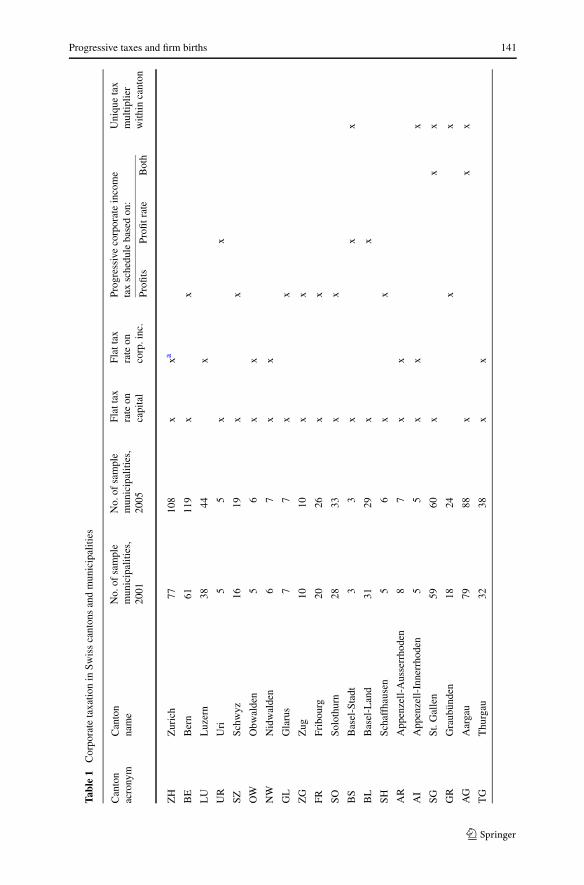
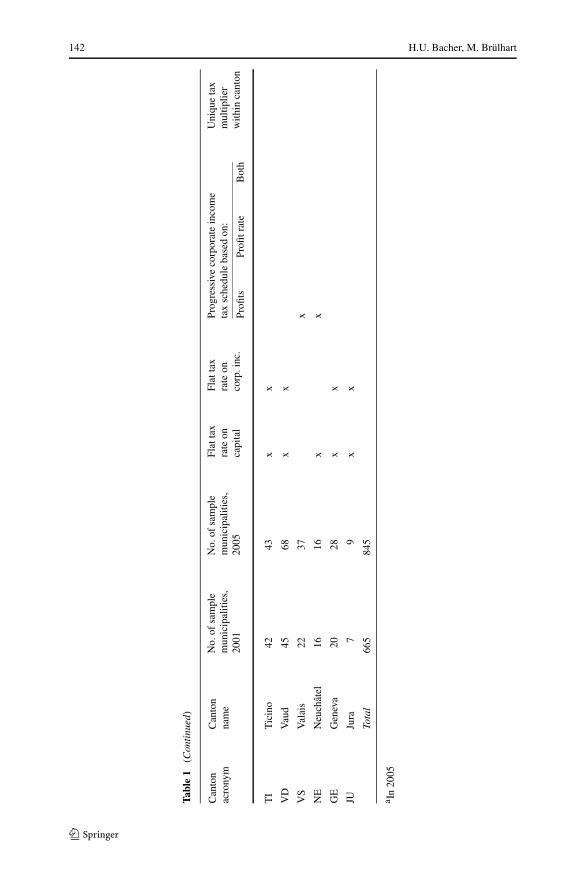
hierarchically nested jurisdictional levels: by the federal government, by the 26cantons and by some 2,700 municipalities. The federal government taxes prof-its at a flat rate of 8.5 % and does not tax corporate capital. The cantons enjoycomplete autonomy in the setting of their tax schedules. They all levy taxes onprofits and corporate capital as well as on personal income and wealth. In 21 ofthe 26 cantons, municipalities apply a single multiplier to the applicable cantonaltax schedules.21 In the remaining cantons, the same multiplier applies to all mu-nicipalities within the canton, implying no municipal autonomy (see Table 1, lastcolumn).
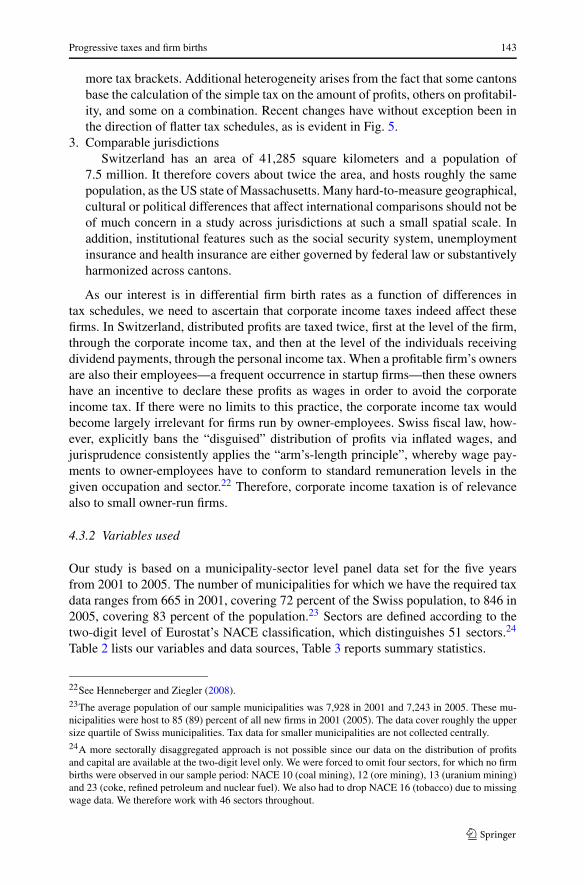
2. Heterogenous tax schedulesThe autonomy of local tax setters yields large intra-national variance in taxa-
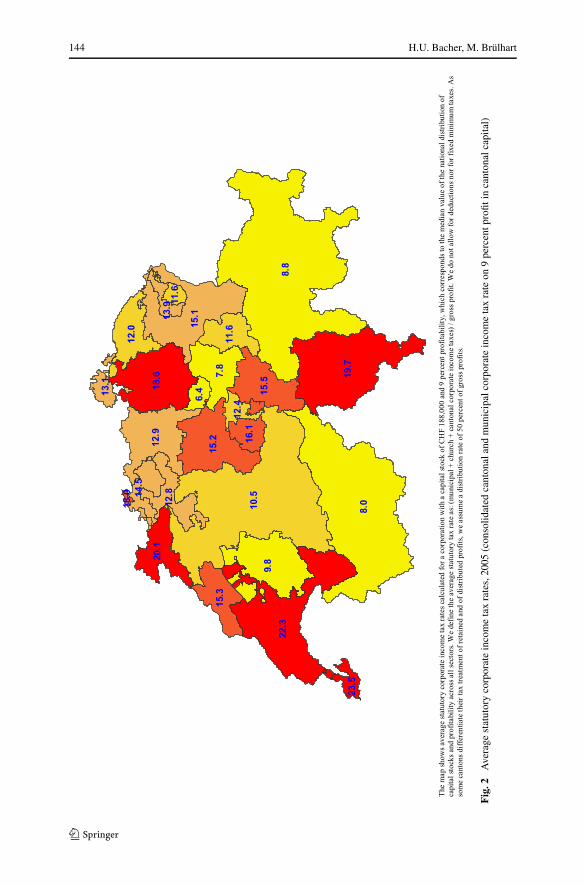
tion. The geography of corporate tax burdens is illustrated in Fig. 2, which showsconsolidated cantonal and municipal average corporate income tax rates on a rep-resentative firm for the 26 cantonal capitals. The highest tax rate (Geneva, 23.5 %)exceeds the lowest tax rate (Zug, 6.4 %) by a factor of nearly four. As can begleaned from Figs. 3 and 4 for 2001 and 2005, respectively, the progressivity ofthese tax schedules exhibits similar intra-national heterogeneity. Eleven cantons,among them the cantons of Zurich (since 2005) and Geneva, apply a flat tax rateon profits. The remaining fifteen cantons apply progressive schedules with two or
20Clustering being a variant of the Eicker–White “sandwich” variance estimator, it provides consistentstandard error estimates even in the presence of overdispersion (see e.g. Cameron and Trivedi 1998, p.65f.). We also estimated our standard errors using one-way clustering by municipality and three-way clus-tering by municipality, sector and year, but did not find our inference results to be significantly affected.21In 8 of those 21 cantons, municipalities decide on a single multiplier that applies to both personal andcorporate taxes. In the remaining 13 cantons, at least some municipalities apply separate multipliers to thetwo tax bases. See also Brülhart and Jametti (2006).
Progressive taxes and firm births 141
Tabl
e1
Cor
pora
teta
xatio
nin
Swis
sca
nton
san
dm
unic
ipal
ities
Can
ton
acro
nym
Can
ton
nam
eN
o.of
sam
ple
mun
icip
aliti
es,
2001
No.
ofsa
mpl
em
unic
ipal
ities
,20
05
Flat
tax
rate
onca
pita
l
Flat
tax
rate
onco
rp.i
nc.
Prog
ress
ive
corp
orat
ein
com
eta
xsc
hedu
leba
sed
on:
Uni
que
tax
mul
tiplie
rw
ithin
cant
onPr
ofits
Profi
trat
eB
oth
ZH
Zur
ich
7710
8x
xa
BE
Ber
n61
119
xx
LU
Luz
ern
3844
x
UR
Uri
55
xx
SZSc
hwyz
1619
xx
OW
Obw
alde
n5
6x
x
NW
Nid
wal
den
67
xx
GL
Gla
rus
77
xx
ZG
Zug
1010
xx
FRFr
ibou
rg20
26x
x
SOSo
loth
urn
2833
xx
BS
Bas
el-S
tadt
33
xx
x
BL
Bas
el-L
and
3129
xx
SHSc
haff
haus
en5
6x
x
AR
App
enze
ll-A
usse
rrho
den
87
xx
AI
App
enze
ll-In
nerr
hode
n5
5x
xx
SGSt
.Gal
len
5960
xx
x
GR
Gra
ubün
den
1824
xx
AG
Aar
gau
7988
xx
x
TG
Thu
rgau
3238
xx
142 H.U. Bacher, M. Brülhart
Tabl
e1
(Con
tinu
ed)
Can
ton
acro
nym
Can
ton
nam
eN
o.of
sam
ple
mun
icip
aliti
es,
2001
No.
ofsa
mpl
em
unic
ipal
ities
,20
05
Flat
tax
rate
onca
pita
l
Flat
tax
rate
onco
rp.i
nc.
Prog
ress
ive
corp
orat
ein
com
eta
xsc
hedu
leba
sed
on:
Uni
que
tax
mul
tiplie
rw
ithin
cant
onPr
ofits
Profi
trat
eB
oth
TI
Tic
ino
4243
xx
VD
Vau
d45
68x
x
VS
Val
ais
2237
x
NE
Neu
chât
el16
16x
x
GE
Gen
eva
2028
xx
JUJu
ra7
9x
x
Tota
l66
584
5
a In
2005
Progressive taxes and firm births 143
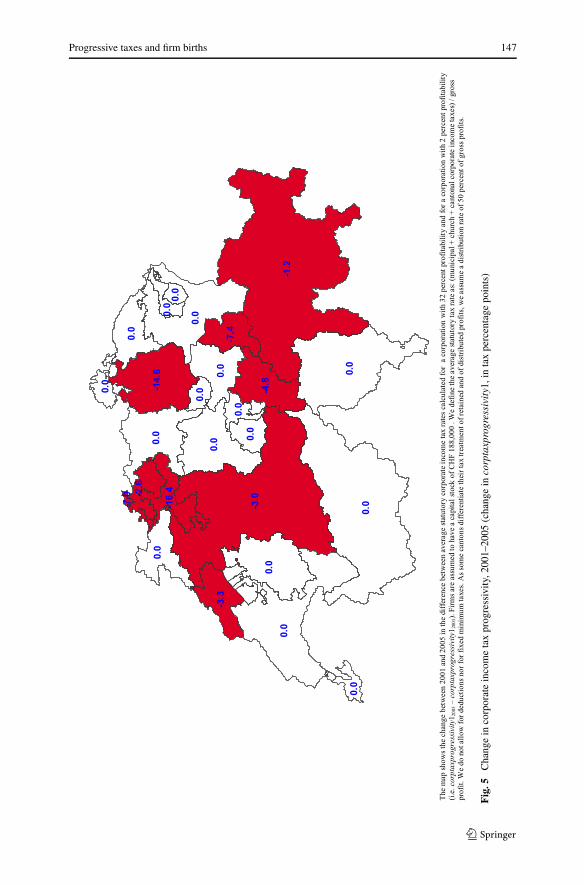
more tax brackets. Additional heterogeneity arises from the fact that some cantonsbase the calculation of the simple tax on the amount of profits, others on profitabil-ity, and some on a combination. Recent changes have without exception been inthe direction of flatter tax schedules, as is evident in Fig. 5.
3. Comparable jurisdictionsSwitzerland has an area of 41,285 square kilometers and a population of
7.5 million. It therefore covers about twice the area, and hosts roughly the samepopulation, as the US state of Massachusetts. Many hard-to-measure geographical,cultural or political differences that affect international comparisons should not beof much concern in a study across jurisdictions at such a small spatial scale. Inaddition, institutional features such as the social security system, unemploymentinsurance and health insurance are either governed by federal law or substantivelyharmonized across cantons.
As our interest is in differential firm birth rates as a function of differences intax schedules, we need to ascertain that corporate income taxes indeed affect thesefirms. In Switzerland, distributed profits are taxed twice, first at the level of the firm,through the corporate income tax, and then at the level of the individuals receivingdividend payments, through the personal income tax. When a profitable firm’s ownersare also their employees—a frequent occurrence in startup firms—then these ownershave an incentive to declare these profits as wages in order to avoid the corporateincome tax. If there were no limits to this practice, the corporate income tax wouldbecome largely irrelevant for firms run by owner-employees. Swiss fiscal law, how-ever, explicitly bans the “disguised” distribution of profits via inflated wages, andjurisprudence consistently applies the “arm’s-length principle”, whereby wage pay-ments to owner-employees have to conform to standard remuneration levels in thegiven occupation and sector.22 Therefore, corporate income taxation is of relevancealso to small owner-run firms.
4.3.2 Variables used
Our study is based on a municipality-sector level panel data set for the five yearsfrom 2001 to 2005. The number of municipalities for which we have the required taxdata ranges from 665 in 2001, covering 72 percent of the Swiss population, to 846 in2005, covering 83 percent of the population.23 Sectors are defined according to thetwo-digit level of Eurostat’s NACE classification, which distinguishes 51 sectors.24
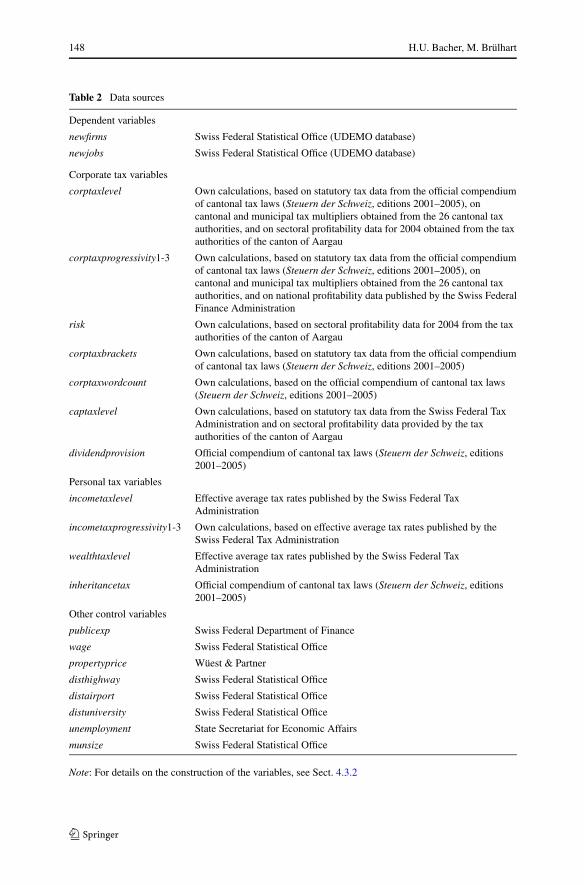
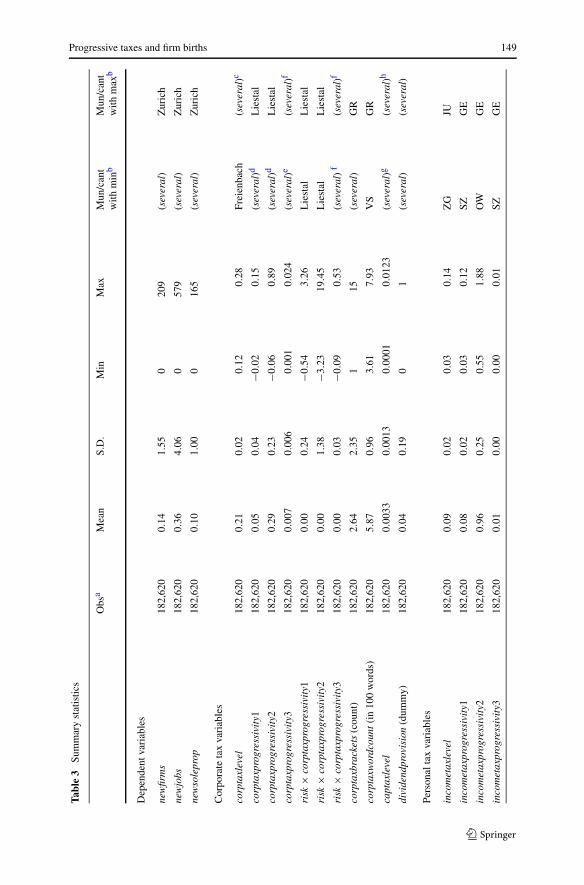
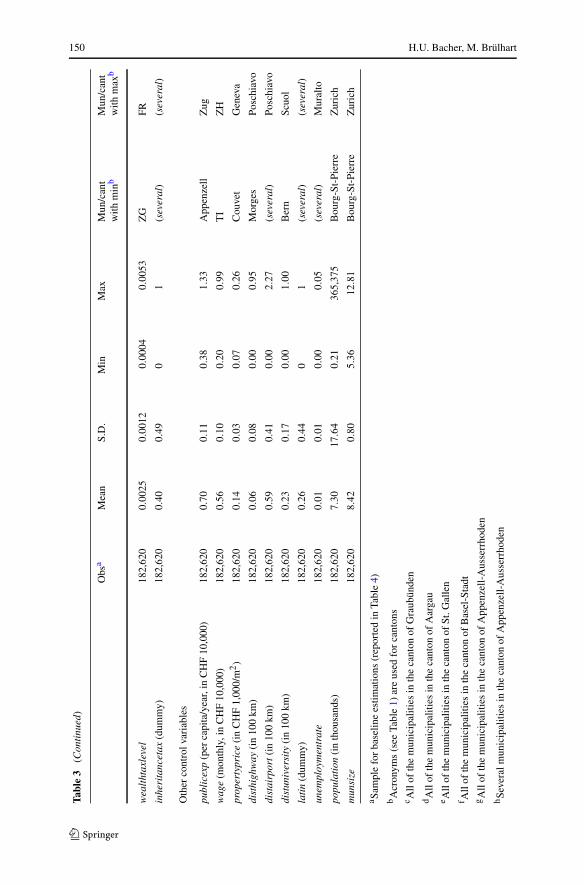
Table 2 lists our variables and data sources, Table 3 reports summary statistics.
22See Henneberger and Ziegler (2008).23The average population of our sample municipalities was 7,928 in 2001 and 7,243 in 2005. These mu-nicipalities were host to 85 (89) percent of all new firms in 2001 (2005). The data cover roughly the uppersize quartile of Swiss municipalities. Tax data for smaller municipalities are not collected centrally.24A more sectorally disaggregated approach is not possible since our data on the distribution of profitsand capital are available at the two-digit level only. We were forced to omit four sectors, for which no firmbirths were observed in our sample period: NACE 10 (coal mining), 12 (ore mining), 13 (uranium mining)and 23 (coke, refined petroleum and nuclear fuel). We also had to drop NACE 16 (tobacco) due to missingwage data. We therefore work with 46 sectors throughout.
144 H.U. Bacher, M. Brülhart
Fig
.2A
vera
gest
atut
ory
corp
orat
ein
com
eta
xra
tes,
2005
(con
solid
ated
cant
onal
and
mun
icip
alco
rpor
ate
inco
me
tax
rate
on9
perc
entp
rofit
inca
nton
alca
pita
l)
Progressive taxes and firm births 145
Fig
.3A
vera
gest
atut
ory
corp
orat
ein
com
eta
xsc
hedu
les,
2001
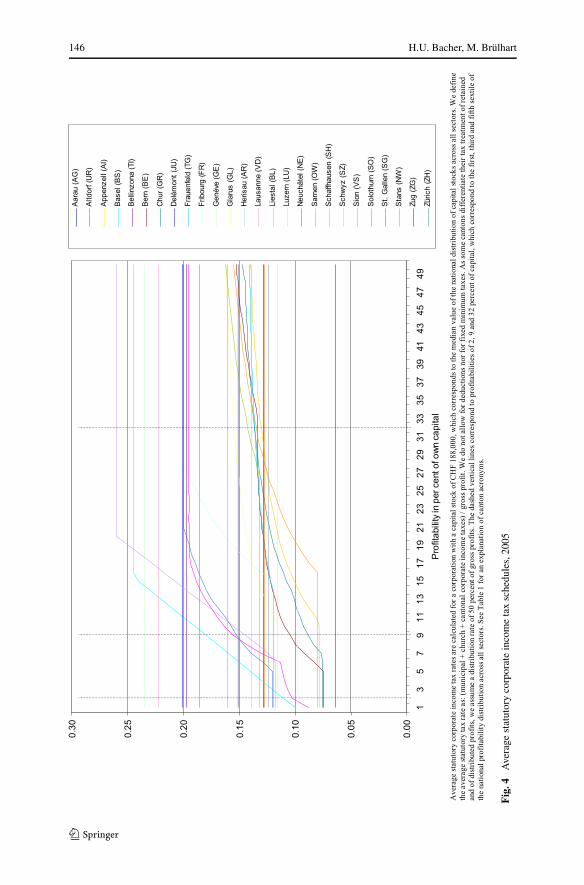
146 H.U. Bacher, M. Brülhart
Fig
.4A
vera
gest
atut
ory
corp
orat
ein
com
eta
xsc
hedu
les,
2005
Progressive taxes and firm births 147
Fig
.5C
hang
ein
corp
orat
ein
com
eta
xpr
ogre
ssiv
ity,2
001–
2005
(cha
nge
inco
rpta
xpro
gres
sivi
ty1,
inta
xpe
rcen
tage
poin
ts)
148 H.U. Bacher, M. Brülhart
Table 2 Data sources
Dependent variables
newfirms Swiss Federal Statistical Office (UDEMO database)
newjobs Swiss Federal Statistical Office (UDEMO database)
Corporate tax variables
corptaxlevel Own calculations, based on statutory tax data from the official compendiumof cantonal tax laws (Steuern der Schweiz, editions 2001–2005), oncantonal and municipal tax multipliers obtained from the 26 cantonal taxauthorities, and on sectoral profitability data for 2004 obtained from the taxauthorities of the canton of Aargau
corptaxprogressivity1-3 Own calculations, based on statutory tax data from the official compendiumof cantonal tax laws (Steuern der Schweiz, editions 2001–2005), oncantonal and municipal tax multipliers obtained from the 26 cantonal taxauthorities, and on national profitability data published by the Swiss FederalFinance Administration
risk Own calculations, based on sectoral profitability data for 2004 from the taxauthorities of the canton of Aargau
corptaxbrackets Own calculations, based on statutory tax data from the official compendiumof cantonal tax laws (Steuern der Schweiz, editions 2001–2005)
corptaxwordcount Own calculations, based on the official compendium of cantonal tax laws(Steuern der Schweiz, editions 2001–2005)
captaxlevel Own calculations, based on statutory tax data from the Swiss Federal TaxAdministration and on sectoral profitability data provided by the taxauthorities of the canton of Aargau
dividendprovision Official compendium of cantonal tax laws (Steuern der Schweiz, editions2001–2005)
Personal tax variables
incometaxlevel Effective average tax rates published by the Swiss Federal TaxAdministration
incometaxprogressivity1-3 Own calculations, based on effective average tax rates published by theSwiss Federal Tax Administration
wealthtaxlevel Effective average tax rates published by the Swiss Federal TaxAdministration
inheritancetax Official compendium of cantonal tax laws (Steuern der Schweiz, editions2001–2005)
Other control variables
publicexp Swiss Federal Department of Finance
wage Swiss Federal Statistical Office
propertyprice Wüest & Partner
disthighway Swiss Federal Statistical Office
distairport Swiss Federal Statistical Office
distuniversity Swiss Federal Statistical Office
unemployment State Secretariat for Economic Affairs
munsize Swiss Federal Statistical Office
Note: For details on the construction of the variables, see Sect. 4.3.2
Progressive taxes and firm births 149
Tabl
e3
Sum
mar
yst
atis
tics
Obs
aM
ean
S.D
.M
inM
axM
un/c
ant
with
min
bM
un/c
ant
with
max
b
Dep
ende
ntva
riab
les
new
firm
s18
2,62
00.
141.
550
209
(sev
eral
)Z
uric
h
new
jobs
182,
620
0.36
4.06
057
9(s
ever
al)
Zur
ich
new
sole
prop
182,
620
0.10
1.00
016
5(s
ever
al)
Zur
ich
Cor
pora
teta
xva
riab
les
corp
taxl
evel
182,
620
0.21
0.02
0.12
0.28
Frei
enba
ch(s
ever
al)c
corp
taxp
rogr
essi
vity
118
2,62
00.
050.
04−0
.02
0.15
(sev
eral
)dL
iest
al
corp
taxp
rogr
essi
vity
218
2,62
00.
290.
23−0
.06
0.89
(sev
eral
)dL
iest
al
corp
taxp
rogr
essi
vity
318
2,62
00.
007
0.00
60.
001
0.02
4(s
ever
al)e
(sev
eral
)f
risk
×co
rpta
xpro
gres
sivi
ty1
182,
620
0.00
0.24
−0.5
43.
26L
iest
alL
iest
al
risk
×co
rpta
xpro
gres
sivi
ty2
182,
620
0.00
1.38
−3.2
319
.45
Lie
stal
Lie
stal
risk
×co
rpta
xpro
gres
sivi
ty3
182,
620
0.00
0.03
−0.0
90.
53(s
ever
al)
f(s
ever
al)f
corp
taxb
rack
ets
(cou
nt)
182,
620
2.64
2.35
115
(sev
eral
)G
R
corp
taxw
ordc
ount
(in
100
wor
ds)
182,
620
5.87
0.96
3.61
7.93
VS
GR
capt
axle
vel
182,
620
0.00
330.
0013
0.00
010.
0123
(sev
eral
)g(s
ever
al)h
divi
dend
prov
isio
n(d
umm
y)18
2,62
00.
040.
190
1(s
ever
al)
(sev
eral
)
Pers
onal
tax
vari
able
s
inco
met
axle
vel
182,
620
0.09
0.02
0.03
0.14
ZG
JU
inco
met
axpr
ogre
ssiv
ity1
182,
620
0.08
0.02
0.03
0.12
SZG
E
inco
met
axpr
ogre
ssiv
ity2
182,
620
0.96
0.25
0.55
1.88
OW
GE
inco
met
axpr
ogre
ssiv
ity3
182,
620
0.01
0.00
0.00
0.01
SZG
E
150 H.U. Bacher, M. Brülhart
Tabl
e3
(Con
tinu
ed)
Obs
aM
ean
S.D
.M
inM
axM
un/c
ant
with
min
bM
un/c
ant
with
max
b
wea
ltht
axle
vel
182,
620
0.00
250.
0012
0.00
040.
0053
ZG
FR
inhe
rita
ncet
ax(d
umm
y)18
2,62
00.
400.
490
1(s
ever
al)
(sev
eral
)
Oth
erco
ntro
lvar
iabl
es
publ
icex
p(p
erca
pita
/yea
r,in
CH
F10
,000
)18
2,62
00.
700.
110.
381.
33A
ppen
zell
Zug
wag
e(m
onth
ly,i
nC
HF
10,0
00)
182,
620
0.56
0.10
0.20
0.99
TI
ZH
prop
erty
pric
e(i
nC
HF
1,00
0/m
2)
182,
620
0.14
0.03
0.07
0.26
Cou
vet
Gen
eva
dist
high
way
(in
100
km)
182,
620
0.06
0.08
0.00
0.95
Mor
ges
Posc
hiav
o
dist
airp
ort
(in
100
km)
182,
620
0.59
0.41
0.00
2.27
(sev
eral
)Po
schi
avo
dist
univ
ersi
ty(i
n10
0km
)18
2,62
00.
230.
170.
001.
00B
ern
Scuo
l
lati
n(d
umm
y)18
2,62
00.
260.
440
1(s
ever
al)
(sev
eral
)
unem
ploy
men
trat
e18
2,62
00.
010.
010.
000.
05(s
ever
al)
Mur
alto
popu
lati
on(i
nth
ousa
nds)
182,
620
7.30
17.6
40.
2136
5,37
5B
ourg
-St-
Pier
reZ
uric
h
mun
size
182,
620
8.42
0.80
5.36
12.8
1B
ourg
-St-
Pier
reZ
uric
h
a Sam
ple
for
base
line
estim
atio
ns(r
epor
ted
inTa
ble
4)
bA
cron
yms
(see
Tabl
e1)
are
used
for
cant
ons
c All
ofth
em
unic
ipal
ities
inth
eca
nton
ofG
raub
ünde
n
dA
llof
the
mun
icip
aliti
esin
the
cant
onof
Aar
gau
e All
ofth
em
unic
ipal
ities
inth
eca
nton
ofSt
.Gal
len
f All
ofth
em
unic
ipal
ities
inth
eca
nton
ofB
asel
-Sta
dtgA
llof
the
mun
icip
aliti
esin
the
cant
onof
App
enze
ll-A
usse
rrho
den
hSe
vera
lmun
icip
aliti
esin
the
cant
onof
App
enze
ll-A
usse
rrho
den
Progressive taxes and firm births 151
Our dependent variable, newfirms, is the count of new firms per municipality, sec-tor and year. The alternative dependent variable, newjobs, is the count of full-timeand part-time jobs created by those new firms. The data set covers all new firms cre-ated in Switzerland between 2001 and 2005. The average new firm has 2.6 employeesat birth, and 43 percent of new firms have a single employee. Using newjobs as analternative regressand may be useful by reducing the weight of one-person firms indriving our results. Firms are defined as market-oriented incorporated organizationsthat are operating for at least 20 hours per week. New entities created by mergers,takeovers, breakups or changes of legal form are not counted. Foreign firms’ firstsubsidiary in Switzerland, however, is considered a new firm. This provides us withdata for 25,419 new firms and 64,927 new jobs created over the sample period.
The main component of the explanatory part of our model are corporate tax bur-dens. In order to construct sector-specific representative corporate tax rates, we firstneed data on representative profits and capital stocks. While nation-wide statisticsexist neither at the level of firms nor at the level of sectors, we can draw on a firm-level data set for one of the 26 cantons (Aargau). This data set, obtained from thecantonal tax authority, reports pre-tax profits and capital bases for 2004. It covers theuniverse of 15,731 firms based in that canton, which represents 11 percent of Swissfirms in 2004. We have several reasons to be confident that the micro data for Aargauare representative of patterns for Switzerland at large. First, the overall distributionof firm-level profits in that canton closely matches that for the whole country.25 Sec-ond, the corporate tax burden in the canton of Aargau, computed by the federal taxadministration, is very close to the national average.26 Third, Aargau’s sectoral com-position is very close to the national average. The correlation between the share ofNACE two-digit firms in Aargau and the corresponding national total 0.99 (data fromthe 2001 establishment census). Finally, Aargau is quite representative also in termsof urbanization—probably the most important covariate of firm structure. Accordingto federal statistics, the proportion of Aargau residents living in urban areas was 0.58in 2001. The corresponding national share was 0.68. Given that the standard devi-ation of these shares across cantons was 0.20, Aargau is close to the middle of thedistribution in this respect as well.
From the Aargau data we can compute average profits, average capital stocks andaverage profitability for corporations with positive profits per two-digit sector.
Based on these data, we then construct sector-specific corporate income tax mea-sures.
25The first, third and fifth sextiles for pre-tax rate of returns are 3, 12 and 37 percent (canton of Aar-gau) against 2, 9 and 32 percent (Switzerland). The quantiles for Aargau are based on firm-level reportedprofit data, whereas the national quantiles are calculated using the national profit and capital distributionspublished by the Federal Tax Administration.26The index of the corporate income tax burden computed by the Federal Tax Administration for the year2004 has a value of 97.4 for the canton of Aargau. The national average is 100, with values ranging from57.3 (Schwyz) to 126.7 (Geneva). Aargau levies a minimum corporate tax of 500 Swiss francs (≈500 USdollars) on profits and capital together. Therefore, to calculate sector averages, we excluded all observa-tions with a simple tax of 500 francs, even if they declared positive but very low profits. Furthermore, weconsidered observations with an implied pre-tax rate of return of more than 200 percent to be unreliableand excluded them.
152 H.U. Bacher, M. Brülhart
• Level of the corporate income tax (corptaxlevel): Based on statutory tax ratesand estimated industry-level average profits and capital stocks, we calculate theindustry-specific effective average tax rate (EATR) on profits for all sample mu-nicipalities and years.27
• Progressivity of the corporate income tax (corptaxprogressivity): Based on the na-tional distribution of capital and profitability across all sectors, we collected taxrates for first, third and fifth sextile profitability firms, characterized by profitsamounting to 2, 9 and 32 percent, respectively, of own capital.28 This was doneseparately for three capital levels, representing the first, second and third quartileof the distribution of capital. Our three alternative progressivity measures are thencomputed as weighted averages across the three representative capital levels.29
The first progressivity measure, corptaxprogressivity1, is the difference betweenthe EATR for firms with high (32 percent) and low (2 percent) profitability. Thesecond progressivity measure, corptaxprogressivity2, corrects for the tax level: wedivide corptaxprogressivity1 by the arithmetic mean of the EATR for firms withlow, median and high profitability. A third measure of progressivity, corptaxpro-gressivity3, measures the redistributive impact of a given tax schedule comparedwith a proportional tax. By construction, this index ranges from −1 to +1. A valueof corptaxprogressivity3 > 0 (< 0) indicates a progressive (regressive) tax sys-tem, while corptaxprogressivity3 = 0 stands for a proportional system.30 Thesethree measures are highly but not perfectly correlated, with correlation coefficientsranging from 0.89 to 0.98.
• Industry-specific risk (risk): In accordance with Condition 2, we define risk asthe standard deviation of industry profits, expressed as a deviation from the cross-sector average standard deviation (risk therefore has mean zero), and based on the
27The Swiss corporate tax system allows corporations to deduct actual tax payments from their pre-tax
income. Therefore, our EATRs are defined as tπ (π−tKK)(1+tπ )π
, where π denotes pre-tax profits, K is own
capital, tπ is the statutory corporate income tax rate and tK is the statutory capital tax rate.28Due to some small cell sizes, the Aargau data do not allow us to calculate sufficiently reliable sector-leveldistributions. We therefore prefer to rely on frequency distributions for Switzerland as a whole (availableaggregated across sectors) for the profitability dispersion measure.29The weights applied are 0.375 for the cases of low and high capital and 0.25 for the median-capital case,thus taking into account that the low and high cases refer to the upper end of the first and third quartile, re-spectively. The fact that two of our progressivity measures have negative minima (see Table 3) is explainedby one canton (Aargau) applying a fixed minimum tax of CHF 500 on all incorporated firms, which impliesregressive taxation for certain small firms with low profitability. Furthermore, the definition of EATRs im-plies that there is some small within-canton variation in progressivity even though municipalities applya single multiplier to the canton-level tax schedule. Eliminating this variation by taking averages of theprogressivity measures within each canton and year has no discernible impact on our results.30This measure is known as a “relative share adjustment” (see, e.g., Kesselman and Cheung 2004). It is
a weighted average of a local index of tax progressivity, RSAk , where RSAk = 1−ATRk1−ATR − 1. ATRk is the
average tax rate for the kth income group, and ATR is the aggregate average tax rate. RSAk has an intuitiveinterpretation, since it can be used to calculate the gain or loss to a specific income group of switchingto a fully proportional tax. For example, if RSAk = 0.03, a k-type taxpayer would suffer an income lossof 3 percent if the existing system were replaced by a proportional tax. The global index of progressivity,RSAG, is then calculated as follows: RSAG = ∑K
k=1 φkRSAk , where φk = θk(θk + 2∑K
l=k+1 θl), and
θk = wk∑Kk=1 wk
is post-tax income share of the kth taxpayer (wk being post-tax income of the kth taxpayer).
Progressive taxes and firm births 153
firm-level data for Aargau. This variable is then interacted with the three measuresof corporate tax progressivity to provide a test of Proposition 2.
• Complexity of the corporate income tax schedule (corptaxbrackets): FollowingSlemrod (2005), we define corptaxbrackets as the number of different statutorycorporate income tax brackets.
• Complexity of the entire corporate tax code (corptaxwordcount): We define thisvariable as the count of words in the cantonal corporate tax codes.31
In our baseline specification, we control for a range of additional potentially rele-vant tax variables concerning both corporate and personal income (taxcontrols) andfor non-tax explanatory variables that are also likely to determine firm birth rates(othercontrols). The list of those variables is given in Appendix B.
5 Results
5.1 Baseline estimates
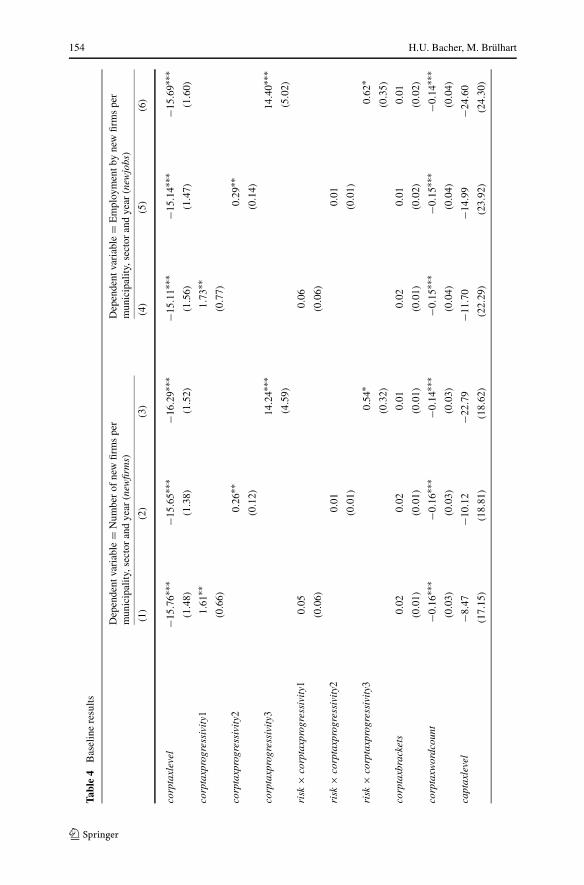
We estimate equation (3) using fixed effects Poisson regression with two-way clus-tered standard errors. Table 4 reports the baseline estimations for six different variantsof our empirical model.
Our results are reassuringly consistent across specifications: all corporate tax vari-ables and all statistically significant controls retain their sign across the six regressionruns. Whether we define our dependent variable as counts of new firms (columns 1–3)or as counts of jobs created by those new firms (columns 4–6), is of little consequenceto our estimates. Any observed regularities, therefore, do not seem to be driven byparticularly small or particularly large new firms. The estimated coefficient signs gen-erally conform with expectations. Numbers of firm births are relatively high in largemunicipalities, in municipalities with high (non-transfer) public expenditure and inmunicipalities with high rates of unemployment (which imply fewer outside optionsfor “latent entrepreneurs”). Conversely, firm birth rates are relatively low in remotemunicipalities (in terms of distance from the highway network). The one counterintu-itive statistically significant result on the control variables concerns property prices,for which we estimate a positive coefficient. This result very likely reflects the factthat property prices correlate with certain relevant but unobserved location-specificfeatures without fully capitalizing them.
Turning to the corporate tax variables, we find confirmation for our main hypothe-ses.
31Word counts are based on the official compendium of cantonal tax laws Steuern der Schweiz. Thiscompendium reproduces the content of all cantonal tax laws in a standardized format. It has the advantageof using harmonized terminology and thus allowing meaningful comparisons of word counts. The fact thatthree Swiss cantons are officially bilingual and have identical tax codes in both French and German allowsus to quantify the “excess words” in tax codes due to the French language. In the canton of Berne, theFrench version of the tax code is 36 percent longer than the German one, and in the cantons of Fribourgand Valais, these differences correspond to 44 and 29 percent, respectively. Thus, the average “surplusword count” due to the French language is 37 percent. Therefore, we divide the word count for Latincantons by 1.37 (the tax code for the Italian-speaking canton of Ticino being recorded in French in thecompendium).
154 H.U. Bacher, M. Brülhart
Tabl
e4
Bas
elin
ere
sults
Dep
ende
ntva
riab
le=
Num
ber
ofne
wfir
ms
per
mun
icip
ality
,sec
tor
and
year
(new
firm
s)D
epen
dent
vari
able
=E
mpl
oym
entb
yne
wfir
ms
per
mun
icip
ality
,sec
tor
and
year
(new
jobs
)
(1)
(2)
(3)
(4)
(5)
(6)
corp
taxl
evel
−15.
76∗∗
∗−1
5.65
∗∗∗
−16.
29∗∗
∗−1
5.11
∗∗∗
−15.
14∗∗
∗−1
5.69
∗∗∗
(1.4
8)(1
.38)
(1.5
2)(1
.56)
(1.4
7)(1
.60)
corp
taxp
rogr
essi
vity
11.
61∗∗
1.73
∗∗(0
.66)
(0.7
7)
corp
taxp
rogr
essi
vity
20.
26∗∗
0.29
∗∗(0
.12)
(0.1
4)
corp
taxp
rogr
essi
vity
314
.24∗
∗∗14
.40∗
∗∗(4
.59)
(5.0
2)
risk
×co
rpta
xpro
gres
sivi
ty1
0.05
0.06
(0.0
6)(0
.06)
risk
×co
rpta
xpro
gres
sivi
ty2
0.01
0.01
(0.0
1)(0
.01)
risk
×co
rpta
xpro
gres
sivi
ty3
0.54
∗0.
62∗
(0.3
2)(0
.35)
corp
taxb
rack
ets
0.02
0.02
0.01
0.02
0.01
0.01
(0.0
1)(0
.01)
(0.0
1)(0
.01)
(0.0
2)(0
.02)
corp
taxw
ordc
ount
−0.1
6∗∗∗
−0.1
6∗∗∗
−0.1
4∗∗∗
−0.1
5∗∗∗
−0.1
5∗∗∗
−0.1
4∗∗∗
(0.0
3)(0
.03)
(0.0
3)(0
.04)
(0.0
4)(0
.04)
capt
axle
vel
−8.4
7−1
0.12
−22.
79−1
1.70
−14.
99−2
4.60
(17.
15)
(18.
81)
(18.
62)
(22.
29)
(23.
92)
(24.
30)
Progressive taxes and firm births 155
Tabl
e4
(Con
tinu
ed)
Dep
ende
ntva
riab
le=
Num
ber
ofne
wfir
ms
per
mun
icip
ality
,sec
tor
and
year
(new
firm
s)D
epen
dent
vari
able
=E
mpl
oym
entb
yne
wfir
ms
per
mun
icip
ality
,sec
tor
and
year
(new
jobs
)
(1)
(2)
(3)
(4)
(5)
(6)
divi
dend
prov
isio
n−0
.004
0.01
0.02
−0.0
7−0
.05
−0.0
5
(0.0
8)(0
.08)
(0.0
8)(0
.14)
(0.1
3)(0
.14)
inco
met
axle
vel
−12.
14∗∗
∗−1
3.00
∗∗∗
−11.
57∗∗
∗−8
.39∗
∗∗−9
.56∗
∗∗−7
.58∗
∗∗(2
.34)
(2.8
5)(2
.23)
(2.5
6)(3
.11)
(2.4
7)
inco
met
axpr
ogre
ssiv
ity1
−1.2
6−2
.14
(1.7
5)(1
.88)
inco
met
axpr
ogre
ssiv
ity2
−0.1
00.
14
(0.1
3)(0
.13)
inco
met
axpr
ogre
ssiv
ity3
−9.3
4−1
6.95
(15.
15)
(16.
15)
wea
ltht
axle
vel
101.
17∗∗
∗93
.73∗
∗10
5.60
∗∗∗
66.3
954
.32
67.8
5∗(3
8.51
)(3
7.52
)(3
7.84
)(4
1.48
)(4
1.20
)(4
0.45
)
inhe
rita
ncet
ax−0
.15∗
∗∗−0
.14∗
∗∗−0
.14∗
∗∗−0
.13∗
∗−0
.14∗
∗−0
.13∗
∗(0
.05)
(0.0
5)(0
.04)
(0.0
6)(0
.06)
(0.0
5)
publ
icex
p0.
69∗∗
∗0.
72∗∗
∗0.
77∗∗
∗0.
58∗∗
0.61
∗∗0.
67∗∗
∗(0
.25)
(0.2
6)(0
.25)
(0.2
6)(0
.26)
(0.2
6)
wag
e0.
130.
080.
06−0
.08
−0.1
0−0
.14
(0.4
1)(0
.41)
(0.4
2)(0
.43)
(0.4
4)(0
.44)
prop
erty
pric
e6.
65∗∗
∗6.
62∗∗
∗6.
55∗∗
∗6.
03∗∗
∗5.
95∗∗
∗5.
93∗∗
∗(0
.72)
(0.7
3)(0
.72)
(0.8
7)(0
.89)
(0.8
6)
dist
high
way
−1.1
1∗∗∗
−1.1
2∗∗∗
−1.1
0∗∗∗
−1.4
7∗∗∗
−1.4
8∗∗∗
−1.4
7∗∗∗
(0.3
0)(0
.30)
(0.3
0)(0
.39)
(0.3
9)(0
.40)
156 H.U. Bacher, M. Brülhart
Tabl
e4
(Con
tinu
ed)
Dep
ende
ntva
riab
le=
Num
ber
ofne
wfir
ms
per
mun
icip
ality
,sec
tor
and
year
(new
firm
s)D
epen
dent
vari
able
=E
mpl
oym
entb
yne
wfir
ms
per
mun
icip
ality
,sec
tor
and
year
(new
jobs
)
(1)
(2)
(3)
(4)
(5)
(6)
dist
airp
ort
0.06
0.06
0.06
0.06
0.05
0.06
(0.0
8)(0
.08)
(0.0
8)(0
.09)
(0.0
9)(0
.09)
dist
univ
ersi
ty−0
.09
−0.1
0−0
.06
−0.0
7−0
.07
−0.0
3
(0.1
4)(0
.14)
(0.1
4)(0
.16)
(0.1
6)(0
.16)
lati
n−0
.23∗
∗−0
.21∗
−0.1
7−0
.17
−0.1
4−0
.11
(0.1
1)(0
.11)
(0.1
1)(0
.11)
(0.1
2)(0
.12)
unem
ploy
men
trat
e20
.95∗
∗∗21
.09∗
∗∗21
.33∗
∗∗22
.45∗
∗∗22
.48∗
∗∗22
.83∗
∗∗(3
.19)
(3.2
7)(3
.12)
(3.8
4)(4
.01)
(3.7
9)
mun
size
0.97
∗∗∗
0.97
∗∗∗
0.97
∗∗∗
1.01
∗∗∗
1.01
∗∗∗
1.01
∗∗∗
(0.0
2)(0
.03)
(0.0
2)(0
.03)
(0.0
3)(0
.03)
Log
likel
ihoo
d−3
8,08
1−3
8,08
1−3
8,06
3−9
4,75
6−9
4,75
9−9
4,70
7
Not
es:P
oiss
ones
timat
ion;
182,
620
obse
rvat
ions
;fixe
def
fect
sin
clud
edfo
r46
sect
ors
and
5ye
ars
butn
otre
port
ed;s
tand
ard
erro
rsin
pare
nthe
ses;
∗∗∗ p
<0.
01,∗
∗ p<
0.05
,∗ p
<0.
1;st
anda
rder
rors
clus
tere
dtw
ow
ays
(by
mun
icip
ality
-yea
ran
dby
mun
icip
ality
-sec
tor)
Progressive taxes and firm births 157
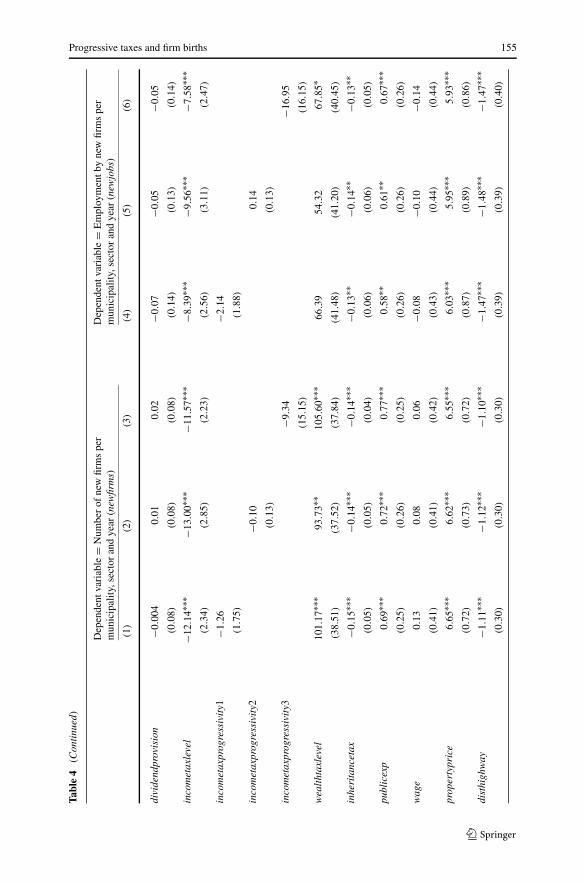
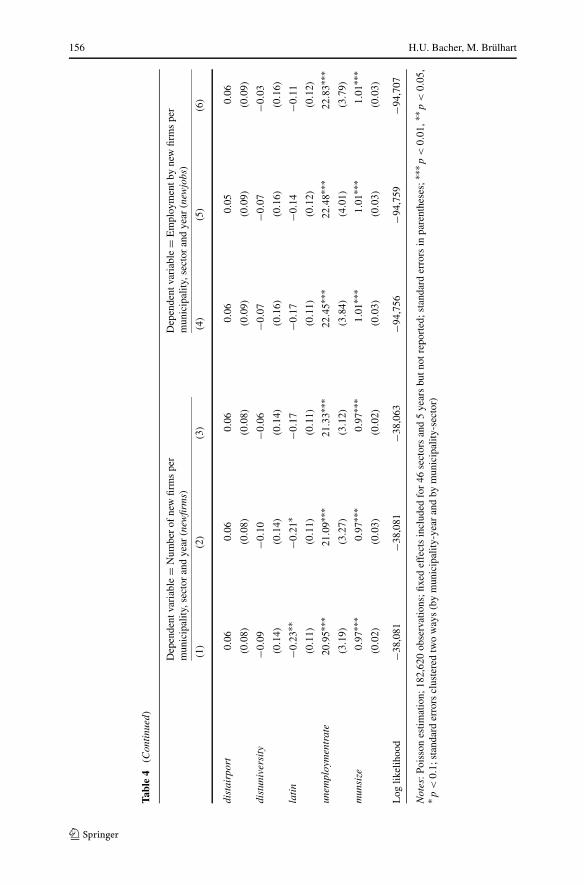
1. The level of taxation has a statistically significantly negative impact, with ourcorporate income tax variable corptaxlevel returning precisely estimated negativecoefficients throughout. The existence of a negative tax level effect is corrobo-rated by the finding that capital taxes (captaxlevel), personal income taxes (in-cometaxlevel) and inheritance taxes (inheritancetax) also consistently yield statis-tically negative coefficient estimates. The only exception are wealth taxes (wealth-taxlevel), for which we obtain positive coefficients. A possible explanation for thisresult is that high wealth taxes act as an incentive for investing in privately heldcorporations. Overall, however, the conclusion that high average taxes depressfirm births is strongly supported.
2. The estimated effects of tax progressivity are positive throughout, in line with ourProposition 1. These coefficients are generally measured somewhat less preciselythan those on the tax level variables. Nonetheless, all six coefficients estimated onthe variants of corptaxprogressivity are found to be statistically significant at leastat the five percent level. Our estimated coefficients on the interactions of corporateincome tax progressivity with our proxy measures for sector-specific risk are allpositive, which is in line with Proposition 2. Only two of these interaction termsare statistically significant (at the ten percent level), which is very likely due to theinevitably approximate measure of risk in our empirical context. Taken together,these estimates lend support to the prediction that, given a certain expected taxbill, progressivity promotes firm births.
3. We find no significant evidence that the complexity of the corporate income taxschedule itself (corptaxbrackets) affects the rate of firm births. The number ofdifferent tax brackets per se therefore seems to be of no consequence for en-trepreneurial activity. In contrast, the complexity of the overall corporate taxcode, measured via corptaxwordcount, has a statistically significantly negativeimpact. Hence, entrepreneurship-promoting simplification of corporate taxationwould seem to be best achieved not by reducing the number of brackets of the taxschedule but by simplifying the tax code.
Our reported estimates are identified primarily from cross-sectional variationacross municipality-sector pairs. We have also experimented with specifications thatinclude municipality fixed effects, thus identifying coefficients from year-on-yearchanges in regressors.32 Given the slow-moving nature of most of our explanatoryvariables, it is not surprising that these estimates have much lower explanatory powerand are mostly statistically insignificant. Interestingly, however, these estimates re-turn statistically significantly positive coefficient estimates on the interaction termsrisk × corptaxprogressivity, thus further corroborating the presence of an insuranceeffect.
5.2 Robustness
In Table 5, we report variations on the baseline estimates of Table 4, in order to gaugetheir sensitivity. Given the similarity of the two sets of estimates reported in Table 4,we now limit our analysis to specifications with firm counts as the dependent variable.
32These results can be obtained from the authors upon request.
158 H.U. Bacher, M. Brülhart
We report estimates for 15 specifications. In the first 12 runs, we alternativelydrop variables from the baseline regressions. In columns 1 to 3, we drop the controlfor the sector-specific expected level of the corporate income tax bill, corptaxlevel.This reverses the sign of the coefficients on corporate tax progressivity, implying anegative effect of progressivity—in line with the “success tax” argument proposed byGentry and Hubbard (2000, 2005). These estimations show clearly that any verdicton the implications of tax progressivity hinges on whether or not one controls for theexpected tax bill.
We also experiment with dropping the two complexity measures, corptaxbrackets(columns 4 to 6) and corptaxwordcount (columns 7 to 9). These changes turn outnot to affect any of our coefficient estimates qualitatively, but they strengthen themeasured positive impact of corporate tax progressivity. This could suggest that pro-gressivity tends to be associated with more complex tax codes. However, we observethat it is especially the omission of the complexity measure corptaxwordcount thatboosts the estimated coefficients on the progressivity measures (columns 7 to 9), al-though these variables are basically uncorrelated in the raw data. The low bivariatecorrelations suggest that progressive schedules are perfectly compatible with simpletax codes. The regression results, however, imply that, conditional on other factors,these two variables do comove, and that this comovement to some extent dampensthe measured positive effect of corporate tax progressivity.
Next, we drop all variables not related to corporate taxation bar the scaling variablemunsize. These results are shown in columns 10 to 12 of Table 5. The signs and sig-nificance levels on our coefficients of interest are reassuringly similar to those foundfor the full model in Table 4. Unlike in the baseline estimations, the impact of capitaltaxes is now estimated to be statistically significantly negative. The coefficients oncorptaxwordcount are up to 40 percent smaller, but they remain statistically signifi-cantly negative throughout. Less plausibly, the coefficient on dividendprovision turnsstatistically significant negative. Our main results, however, do not seem to be drivenby the particular set of conditioning variables chosen for the baseline estimations.
As a final robustness test, we replace the dependent variable by the count of newsole proprietorships (newsoleprop), the main legal form of non-incorporated businessventures.33 Since these organizations are not subject to corporate taxation, we expectcorporate tax-related regressors to have less of an influence. However, we do not ex-pect corporate taxes to irrelevant, as many new firms start out as sole proprietorshipswith the aim of incorporating later. Hence, rational forward-looking entrepreneurswill be sensitive to corporate taxation even if they choose to operate (initially) as soleproprietorships. This is indeed what we find (see columns 13–15 of Table 5). Thelevel effect of corporate taxes remains statistically significant, but the size of the co-efficient shrinks by more than one-half. None of the progressivity variables remainsstatistically significant. It is furthermore reassuring to note that the coefficients ondividendprovision are statistically significantly negative, indicating that such provi-sions indeed reduce recourse to non-incorporated organizational forms.
We have conducted a number of additional sensitivity tests not reported here butavailable on request. The main alternatives we tried were (a) models with newjobs
33We thank an anonymous referee for suggesting us to consider also non-incorporated organizations.
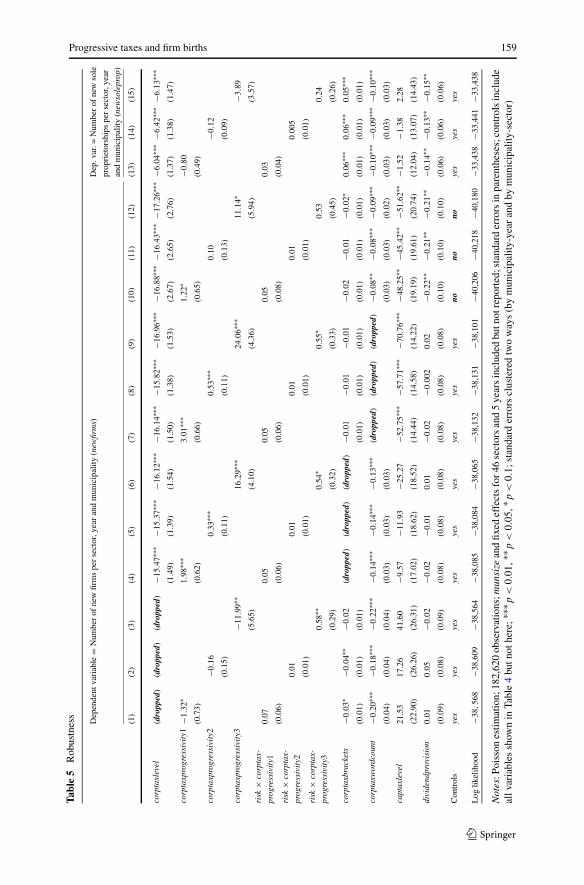
Progressive taxes and firm births 159
Tabl
e5
Rob
ustn
ess
Dep
ende
ntva
riab
le=
Num
ber
ofne
wfir
ms
per
sect
or,y
ear
and
mun
icip
ality
(new
firm
s)D
ep.v
ar.=
Num
ber
ofne
wso
lepr
opri
etor
ship
spe
rse
ctor
,yea
ran
dm
unic
ipal
ity(n
ewso
lepr
op)
(1)
(2)
(3)
(4)
(5)
(6)
(7)
(8)
(9)
(10)
(11)
(12)
(13)
(14)
(15)
corp
taxl
evel
(dro
pped
)(d
ropp
ed)
(dro
pped
)−1
5.47
∗∗∗
−15.
37∗∗
∗−1
6.12
∗∗∗
−16.
14∗∗
∗−1
5.82
∗∗∗
−16.
96∗∗
∗−1
6.88
∗∗∗
−16.
43∗∗
∗−1
7.26
∗∗∗
−6.0
4∗∗∗
−6.4
2∗∗∗
−6.1
3∗∗∗
(1.4
9)(1
.39)
(1.5
4)(1
.50)
(1.3
8)(1
.53)
(2.6
7)(2
.65)
(2.7
6)(1
.37)
(1.3
8)(1
.47)
corp
taxp
rogr
essi
vity
1−1
.32∗
1.98
∗∗∗
3.01
∗∗∗
1.22
∗−0
.80
(0.7
3)(0
.62)
(0.6
6)(0
.65)
(0.4
9)
corp
taxp
rogr
essi
vity
2−0
.16
0.33
∗∗∗
0.53
∗∗∗
0.10
−0.1
2
(0.1
5)(0
.11)
(0.1
1)(0
.13)
(0.0
9)
corp
taxp
rogr
essi
vity
3−1
1.99
∗∗16
.29∗
∗∗24
.06∗
∗∗11
.14∗
−3.8
9
(5.6
5)(4
.10)
(4.3
6)(5
.94)
(3.5
7)ri
sk×
corp
tax-
prog
ress
ivit
y10.
070.
050.
050.
050.
03
(0.0
6)(0
.06)
(0.0
6)(0
.08)
(0.0
4)ri
sk×
corp
tax-
prog
ress
ivit
y20.
010.
010.
010.
010.
005
(0.0
1)(0
.01)
(0.0
1)(0
.01)
(0.0
1)ri
sk×
corp
tax-
prog
ress
ivit
y30.
58∗∗
0.54
∗0.
55∗
0.53
0.24
(0.2
9)(0
.32)
(0.3
3)(0
.45)
(0.2
6)
corp
taxb
rack
ets
−0.0
3∗−0
.04∗
∗−0
.02
(dro
pped
)(d
ropp
ed)
(dro
pped
)−0
.01
−0.0
1−0
.01
−0.0
2−0
.01
−0.0
2∗0.
06∗∗
∗0.
06∗∗
∗0.
05∗∗
∗
(0.0
1)(0
.01)
(0.0
1)(0
.01)
(0.0
1)(0
.01)
(0.0
1)(0
.01)
(0.0
1)(0
.01)
(0.0
1)(0
.01)
corp
taxw
ordc
ount
−0.2
0∗∗∗
−0.1
8∗∗∗
−0.2
2∗∗∗
−0.1
4∗∗∗
−0.1
4∗∗∗
−0.1
3∗∗∗
(dro
pped
)(d
ropp
ed)
(dro
pped
)−0
.08∗
∗−0
.08∗
∗∗−0
.09∗
∗∗−0
.10∗
∗∗−0
.09∗
∗∗−0
.10∗
∗∗
(0.0
4)(0
.04)
(0.0
4)(0
.03)
(0.0
3)(0
.03)
(0.0
3)(0
.03)
(0.0
2)(0
.03)
(0.0
3)(0
.03)
capt
axle
vel
21.5
317
.26
41.6
0−9
.57
−11.
93−2
5.27
−52.
75∗∗
∗−5
7.71
∗∗∗
−70.
76∗∗
∗−4
8.25
∗∗−4
5.42
∗∗−5
1.62
∗∗−1
.52
−1.3
82.
28
(22.
90)
(26.
26)
(26.
31)
(17.
02)
(18.
62)
(18.
52)
(14.
44)
(14.
58)
(14.
22)
(19.
19)
(19.
61)
(20.
74)
(12.
04)
(13.
07)
(14.
43)
divi
dend
prov
isio
n0.
010.
05−0
.02
−0.0
2−0
.01
0.01
−0.0
2−0
.002
0.02
−0.2
2∗∗
−0.2
1∗∗
−0.2
1∗∗
−0.1
4∗∗
−0.1
3∗∗
−0.1
5∗∗
(0.0
9)(0
.08)
(0.0
9)(0
.08)
(0.0
8)(0
.08)
(0.0
8)(0
.08)
(0.0
8)(0
.10)
(0.1
0)(0
.10)
(0.0
6)(0
.06)
(0.0
6)
Con
trol
sye
sye
sye
sye
sye
sye
sye
sye
sye
sno
nono
yes
yes
yes
Log
likel
ihoo
d−3
8,56
8−3
8,60
9−3
8,56
4−3
8,08
5−3
8,08
4−3
8,06
5−3
8,13
2−3
8,13
1−3
8,10
1−4
0,20
6−4
0,21
8−4
0,18
0−3
3,43
8−3
3,44
1−3
3,43
8
Not
es:P
oiss
ones
timat
ion;
182,
620
obse
rvat
ions
;mun
size
and
fixed
effe
cts
for4
6se
ctor
san
d5
year
sin
clud
edbu
tnot
repo
rted
;sta
ndar
der
rors
inpa
rent
hese
s;co
ntro
lsin
clud
eal
lvar
iabl
essh
own
inTa
ble
4bu
tnot
here
;∗∗∗
p<
0.01
,∗∗ p
<0.
05,∗
p<
0.1;
stan
dard
erro
rscl
uste
red
two
way
s(b
ym
unic
ipal
ity-y
ear
and
bym
unic
ipal
ity-s
ecto
r)
160 H.U. Bacher, M. Brülhart
as the dependent variable, (b) models with the coefficient on the exposure variablemunsize forced to unity, (c) models with municipality-level fixed effects, (d) modelswith canton-level instead of municipality-level personal tax variables, (e) models withsector-level coefficient estimates on wage and propertyprice to account for differentfactor intensities, and (f) models with additional controls (for municipal debt burdens,urban areas, length of lake shores, individual components of public expenditure, andlocal unemployment rates). To the extent that they were still identified with thesealternative specifications, none of our qualitative findings turned out to be affected.
5.3 Quantitative effects
Our central research question is qualitative in nature: does corporate tax progressivitypromote firm births, given the expected corporate tax bill? The answer appears to beyes. We can go further than this, however, and evaluate the magnitudes of the variousdeterminants of firm births, related to taxes and otherwise. The Poisson coefficientsreported so far are semielasticities, measuring the proportionate change in the condi-tional mean of firm births for a one-unit change in the respective regressor. Since thescales of our regressors differ considerably (see Table 3), these semielasticities arenot directly comparable.
In Table 6, we therefore show transformations of the baseline estimates that can becompared across variables. Columns 4 to 6 report elasticities, computed as the prod-uct of the Poisson coefficients (columns 1–3) and the means of the relevant regressors(column 10). These numbers give the percentage effect of a one-percent change in thevalue of the respective regressor. As an alternative, we report semistandardized coef-ficients in columns 7 to 9, defined as the product of the Poisson coefficients (columns1–3) and the standard deviations of the relevant regressors (column 11). The semi-standardized coefficients quantify the percentage effect of a one-standard-deviationchange in the value of the respective regressors.
Both sets of transformed coefficients highlight the importance of taxes for firmbirths. Of all regressors included in our model, by far the strongest effects are mea-sured for corporate tax levels, with an elasticity of around 3.3 in absolute value. Dif-ferences in corporate income tax levels clearly have strong effects on firm formationrates across Swiss municipalities.34
Our estimated percentage response of firm births with respect to a percentage-point change in the corporate tax level (i.e. the implied semi-elasticity) is around−0.2. This estimate can be compared to related studies that use intra-national dataon firm births. Not surprisingly, it is close to that found in Swiss data by Brülhart etal. (2012), whose mean Poisson estimate is −0.3. It falls between the values foundby two other European studies. Using British data, Duranton et al. (2011) detectedno statistically significant effect on establishment entry. Rathelot and Sillard (2008),using French data, estimated a semi-elasticity of −1.2. These differences in esti-mated elasticities are likely due to differences in tax systems and in definitions of
34Our estimates suggest a more than proportional reaction of firm births to changes in corporate tax levels.It would of course be erroneous to read into this a potential for revenue-increasing tax cuts, as our modeldoes not capture responses of the entire tax base.
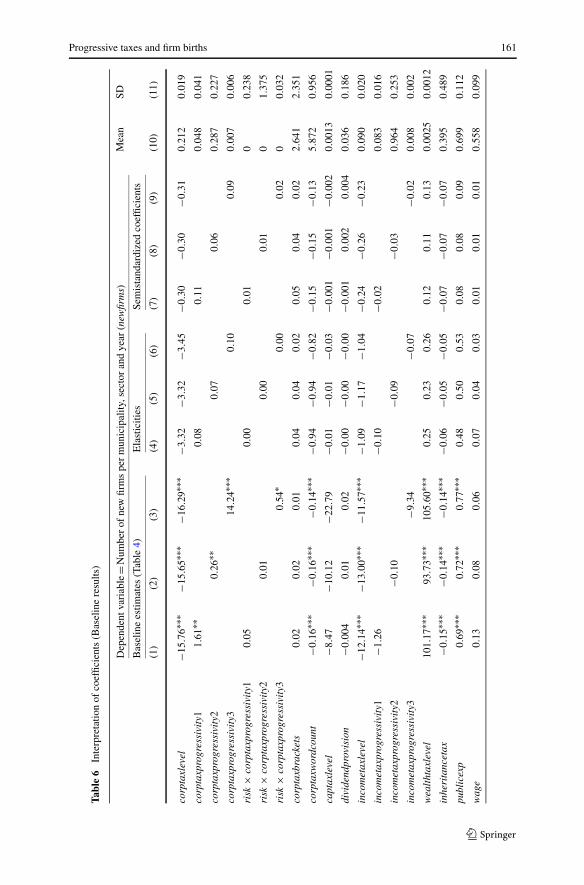
Progressive taxes and firm births 161
Tabl
e6
Inte
rpre
tatio
nof
coef
ficie
nts
(Bas
elin
ere
sults
)
Dep
ende
ntva
riab
le=N
umbe
rof
new
firm
spe
rm
unic
ipal
ity,s
ecto
ran
dye
ar(n
ewfir
ms)
Mea
nSD
Bas
elin
ees
timat
es(T
able
4)E
last
iciti
esSe
mis
tand
ardi
zed
coef
ficie
nts
(1)
(2)
(3)
(4)
(5)
(6)
(7)
(8)
(9)
(10)
(11)
corp
taxl
evel
−15.
76∗∗
∗−1
5.65
∗∗∗
−16.
29∗∗
∗−3
.32
−3.3
2−3
.45
−0.3
0−0
.30
−0.3
10.
212
0.01
9
corp
taxp
rogr
essi
vity
11.
61∗∗
0.08
0.11
0.04
80.
041
corp
taxp
rogr
essi
vity
20.
26∗∗
0.07
0.06
0.28
70.
227
corp
taxp
rogr
essi
vity
314
.24∗
∗∗0.
100.
090.
007
0.00
6
risk
×co
rpta
xpro
gres
sivi
ty1
0.05
0.00
0.01
00.
238
risk
×co
rpta
xpro
gres
sivi
ty2
0.01
0.00
0.01
01.
375
risk
×co
rpta
xpro
gres
sivi
ty3
0.54
∗0.
000.
020
0.03
2
corp
taxb
rack
ets
0.02
0.02
0.01
0.04
0.04
0.02
0.05
0.04
0.02
2.64
12.
351
corp
taxw
ordc
ount
−0.1
6∗∗∗
−0.1
6∗∗∗
−0.1
4∗∗∗
−0.9
4−0
.94
−0.8
2−0
.15
−0.1
5−0
.13
5.87
20.
956
capt
axle
vel
−8.4
7−1
0.12
−22.
79−0
.01
−0.0
1−0
.03
−0.0
01−0
.001
−0.0
020.
0013
0.00
01
divi
dend
prov
isio
n−0
.004
0.01
0.02
−0.0
0−0
.00
−0.0
0−0
.001
0.00
20.
004
0.03
60.
186
inco
met
axle
vel
−12.
14∗∗
∗−1
3.00
∗∗∗
−11.
57∗∗
∗−1
.09
−1.1
7−1
.04
−0.2
4−0
.26
−0.2
30.
090
0.02
0
inco
met
axpr
ogre
ssiv
ity1
−1.2
6−0
.10
−0.0
20.
083
0.01
6
inco
met
axpr
ogre
ssiv
ity2
−0.1
0−0
.09
−0.0
30.
964
0.25
3
inco
met
axpr
ogre
ssiv
ity3
−9.3
4−0
.07
−0.0
20.
008
0.00
2
wea
ltht
axle
vel
101.
17∗∗
∗93
.73∗
∗∗10
5.60
∗∗∗
0.25
0.23
0.26
0.12
0.11
0.13
0.00
250.
0012
inhe
rita
ncet
ax−0
.15∗
∗∗−0
.14∗
∗∗−0
.14∗
∗∗−0
.06
−0.0
5−0
.05
−0.0
7−0
.07
−0.0
70.
395
0.48
9
publ
icex
p0.
69∗∗
∗0.
72∗∗
∗0.
77∗∗
∗0.
480.
500.
530.
080.
080.
090.
699
0.11
2
wag
e0.
130.
080.
060.
070.
040.
030.
010.
010.
010.
558
0.09
9
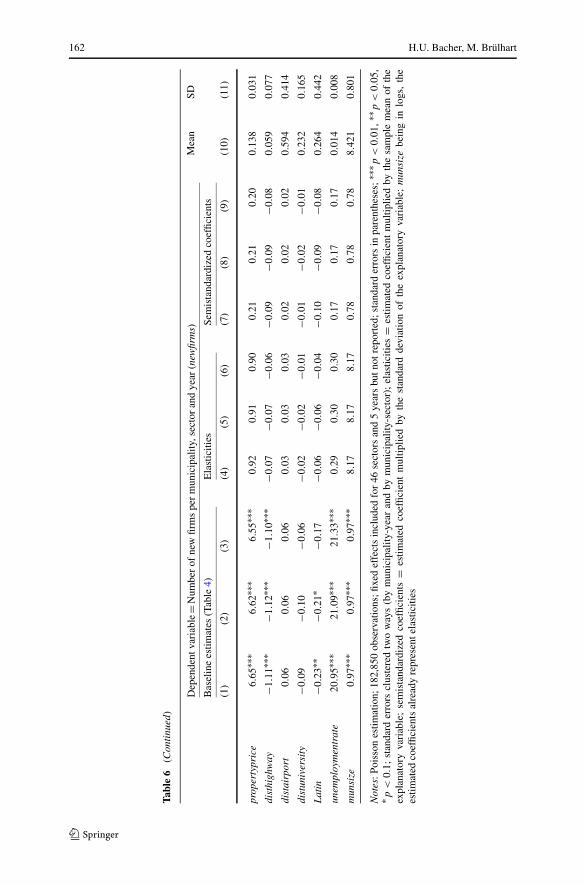
162 H.U. Bacher, M. Brülhart
Tabl
e6
(Con
tinu
ed)
Dep
ende
ntva
riab
le=N
umbe
rof
new
firm
spe
rm
unic
ipal
ity,s
ecto
ran
dye
ar(n
ewfir
ms)
Mea
nSD
Bas
elin
ees
timat
es(T
able
4)E
last
iciti
esSe
mis
tand
ardi
zed
coef
ficie
nts
(1)
(2)
(3)
(4)
(5)
(6)
(7)
(8)
(9)
(10)
(11)
prop
erty
pric
e6.
65∗∗
∗6.
62∗∗
∗6.
55∗∗
∗0.
920.
910.
900.
210.
210.
200.
138
0.03
1
dist
high
way
−1.1
1∗∗∗
−1.1
2∗∗∗
−1.1
0∗∗∗
−0.0
7−0
.07
−0.0
6−0
.09
−0.0
9−0
.08
0.05
90.
077
dist
airp
ort
0.06
0.06
0.06
0.03
0.03
0.03
0.02
0.02
0.02
0.59
40.
414
dist
univ
ersi
ty−0
.09
−0.1
0−0
.06
−0.0
2−0
.02
−0.0
1−0
.01
−0.0
2−0
.01
0.23
20.
165
Lat
in−0
.23∗
∗−0
.21∗
−0.1
7−0
.06
−0.0
6−0
.04
−0.1
0−0
.09
−0.0
80.
264
0.44
2
unem
ploy
men
trat
e20
.95∗
∗∗21
.09∗
∗∗21
.33∗
∗∗0.
290.
300.
300.
170.
170.
170.
014
0.00
8
mun
size
0.97
∗∗∗
0.97
∗∗∗
0.97
∗∗∗
8.17
8.17
8.17
0.78
0.78
0.78
8.42
10.
801
Not
es:P
oiss
ones
timat
ion;
182,
850
obse
rvat
ions
;fixe
def
fect
sin
clud
edfo
r46
sect
ors
and
5ye
ars
butn
otre
port
ed;s
tand
ard
erro
rsin
pare
nthe
ses;
∗∗∗ p
<0.
01,∗
∗ p<
0.05
,∗ p
<0.
1;st
anda
rder
rors
clus
tere
dtw
ow
ays
(by
mun
icip
ality
-yea
ran
dby
mun
icip
ality
-sec
tor)
;el
astic
ities
=es
timat
edco
effic
ient
mul
tiplie
dby
the
sam
ple
mea
nof
the
expl
anat
ory
vari
able
;se
mis
tand
ardi
zed
coef
ficie
nts
=es
timat
edco
effic
ient
mul
tiplie
dby
the
stan
dard
devi
atio
nof
the
expl
anat
ory
vari
able
;m
unsi
zebe
ing
inlo
gs,
the
estim
ated
coef
ficie
nts
alre
ady
repr
esen
tela
stic
ities
Progressive taxes and firm births 163
“new firms”. In particular, Swiss local corporate taxes are levied on profits whiletheir British and French counterparts are, respectively, levied on property areas andphysical capital. Since national corporate taxes are predominantly levied on profits,the Swiss local context arguably offers a better approximation to international corpo-rate tax differentials.
Second to the impact of the expected level of the corporate tax bill comes theimpact of the expected level of the personal tax bill, with an elasticity of slightlyabove 1 in absolute value. Given the difficulty of attributing relevant personal taxvariables to municipalities (due to commuting), this variable likely suffers from somemismeasurement. This in turn implies attenuation bias for the coefficient estimate,which makes the strong estimated effect of personal taxes all the more noteworthy.The third most important dimension of taxation is the complexity of the corporate taxcode (corptaxwordcount), with an elasticity of around −0.9. All other aspects of thetax code have comparatively minor effects on firm births. The average elasticity withrespect to the progressivity of corporate taxes is estimated at around 0.08—an orderof magnitude smaller than the complexity effect. The smallest quantitative effect ofall tax variables is found for corptaxbrackets and dividendprovision, with an averageelasticity of very close to zero.
In sum, we find a clear hierarchy of tax effects, with tax levels having by farthe strongest impact on firm birth rates, the complexity of tax codes coming second,and the progressivity of tax schedules having a comparatively small but statisticallysignificantly positive impact.
6 Conclusion
Tax reforms in the spirit of the “flat-tax” model aim to reduce three parameters: theaverage tax rate, the progressivity of the tax schedule, and the complexity of the taxcode. Using data on sub-federal jurisdictions in Switzerland, we estimate the separateeffects of these three components of corporate income taxes on the incidence of firmbirths. Although we work with panel data, the slow-moving nature of the tax variablesimplies that identification is based mainly on cross-sectional variation.
Our results confirm that lower average tax rates and reduced complexity of the taxcode promote firm births. Controlling for these effects, we find evidence that reducedprogressivity inhibits firm births. Our reading of this result is that tax progressivityhas an insurance effect that facilitates entrepreneurial risk taking.35
The positive effects of lower tax levels and reduced complexity are estimated to besignificantly stronger than the negative effect of reduced progressivity. To the extentthat firm births reflect desirable entrepreneurial dynamism, it is not the flatteningof tax schedules that is key to successful tax reforms, but the lowering of average
35An alternative interpretation could be that new firms prefer more progressive tax schedules, given anexpected tax bill, because they are credit constrained: the lower tax liability in case of a bad profit outcomemay offer a greater gain in terms of access to external funding than the loss implied by a higher tax liabilityin case of a good outcome. See Keuschnigg and Ribi (2009) for a model of corporate income taxation withcredit-constrained firms.

164 H.U. Bacher, M. Brülhart
tax burdens and the simplification of tax codes.36 Flatness per se is of secondaryimportance and even appears to be detrimental to firm births.
Acknowledgements We thank the editor (Dhammika Dharmapala), two anonymous referees, ThiessBuettner, Mario Jametti and seminar participants at the University of Barcelona (IEB) for helpful com-ments; and Roland Aregger (Aargau tax authority), Andrea Grossi (Federal Statistical Office), DieterMarmet (Wüest & Partner), Raphaël Parchet and Werner Tanner (State Secretariat for Economic Affairs)for the generous provision of data. Financial support from the EU’s Sixth Framework Programme (“Micro-Dyn”project) and from the Swiss National Science Foundation (grants 612-065970, CRSI11_130648 and“NCCR Trade”) is gratefully acknowledged.
Appendix A: Proof of Proposition 2
From (1) and (2) it follows that
∂πL
∂πH
= −pH
pL
, (4)
and∂kL
∂πH
= − ΠpH kH
(Π − pH πH )2. (5)
Then Proposition 1 and (4) and (5) imply
∂2�EU(w)
∂kH ∂πH
= −pH �Uw
(wprog)
− pH πH
[Uww(w
progH )[1 − t − kH ]
−Uww(wprogL )[− ∂kL
∂πHπL + [1 − t − kL] ∂πL
∂πH]]
= −pH �Uw
(wprog)
− pH πH
⎡
⎢⎣
Uww(wprogH )[1 − t − kH ]
−Uww(wprogL )
[ΠpH kH
(Π−pH πH )2Π−pH πH
pL
−[1 − t + pH πH
Π−pH πHkH ]pH
pL
]⎤
⎥⎦
= −pH �Uw
(wprog)
− pH πH [1 − t − kH ][Uww
(w
progH
) + pH
pL
Uww
(w
progL
)]
> 0,
where
Uww
(w
progL
) = Uww
([1 − t − kL]πL
)< 0,
Uww
(w
progH
) = Uww
([1 − t − kH ]πH
)< 0,
�Uw
(wprog) = Uw
(w
progH
) − Uw
(w
progL
)< 0.
36Firm births in our data could in principle also be the result of “income shifting” from bigger to smallerincorporated units, or through the incorporation of sole proprietorships. Data permitting, it would be inter-esting in future work to analyze these two margins separately from genuine startup ventures.
Progressive taxes and firm births 165
Appendix B: Control variables
The list of baseline explanatory tax variables (taxcontrols) is as follows.
• Level of capital tax (captaxlevel): We calculate an industry-specific EATR on cor-porate capital for all municipalities and years.
• Provisions to alleviate double taxation of dividends (dividendprovision): Dummyvariable which is set equal to 1 if a canton has a reduced tax rate on dividendincome and to 0 otherwise.
• Level of the personal income tax (incometaxlevel): The Swiss federal tax adminis-tration publishes representative EATRs on personal income for all of the munici-palities in our sample.37 As we cannot know what municipality the owners of oursample firms reside in, we have considered two hypotheses for all personal taxes:(a) firm owners live in the municipality their firm is located in, or (b) owners livein the canton their firm is located in. Since the results do not differ significantly,we report results based on the second hypothesis. We thus compute incometaxlevelas the weighted average personal income tax burden, using the published cantonalsample mean of the EATR on low, median and high income households (corre-sponding to the first, third and fifth sextile of the national household income distri-bution).
• Progressivity of the personal income tax (incometaxprogressivity): Based onthe published canton-average EATR on low, median and high income, we de-fine incometaxprogressivity1, incometaxprogressivity2 and incometaxprogressiv-ity3 analogously to corptaxprogressivity1-3.
• Level of the wealth tax (wealthtaxlevel): We compute this variable as the cantonal-average EATRs for a person with taxable wealth of 300,000 Swiss francs(≈300,000 US dollars), which corresponds approximately to the mean wealth levelamong individuals with non-zero declared wealth over our sample period.
• Inheritance tax (inheritancetax): This variable takes the value of 1 if a canton hasan inheritance tax for direct descendants in a given year and 0 otherwise.
The list of baseline non-tax explanatory variables (othercontrols) is as follows.
• Public expenditure (publicexp): Firms not only pay taxes, they may also benefitfrom public spending. We construct this variable as the sum of municipal and can-tonal per-capita public spending, excluding social transfers and deflated with theconsumer price index. The public spending items included in publicexp are pub-lic administration, security, education, culture and sports, roads, and public trans-port.38
37The published EATRs correspond to average cantonal, municipal and church tax rates for a representa-tive household (married couple with two children) and for a range of reference incomes.38Annual municipal expenditures are only available for the 26 canton capitals and 16 other municipalities.However, the Swiss Federal Finance Administration publishes overall annual municipal spending for eachcanton. We compute annual municipal spending for the other municipalities by subtracting the expenditureof the (26+16) municipalities from overall municipal expenditures and then dividing it by the populationof the remaining municipalities. Thereby, the remaining municipalities are attributed identical values ofpublicexp within each canton.
166 H.U. Bacher, M. Brülhart
• Wage level (wage): We control for average monthly wages per sector and region,deflated by the consumer price index.39
• Property prices (propertyprice): This variable is defined as the unweighted averageof median municipality–year-level market prices per square meter of retail space,office space and industrial real estate, deflated by the consumer price index.40
• Geography: To capture accessibility (and thus potentially agglomeration effects),we include three additional control variables: disthighway, the road distance fromevery municipality to the nearest highway access, distairport, the road distanceto the nearest international airport, and distuniversity, the distance to the nearestuniversity.
• Culture (latin): We control for potential cultural and attitudinal differences by in-troducing the dummy variable latin that takes the value of 1 if the main languageof a canton is French or Italian and 0 if it is German.
• Unemployment (unemploymentrate): We control for the population share of regis-tered unemployed workers by municipality and year.
• Size of the municipality (munsize): We use the log of the average resident popula-tion per year and municipality as the exposure variable.
References
Ahsan, S. M. (1974). Progression and risk-taking. Oxford Economic Papers, 26, 318–328.Audretsch, D. B., & Fritsch, M. (2002). Growth regimes over time and space. Regional Studies, 36(2),
113–124.Becker, R., & Henderson, V. (2000). Effects of air quality regulations on polluting industries. Journal of
Political Economy, 108, 379–421.Brülhart, M., & Jametti, M. (2006). Vertical versus horizontal tax externalities: an empirical test. Journal
of Public Economics, 90(10–11), 2027–2062.Brülhart, M., Jametti, M., & Schmidheiny, K. (2012) Do agglomeration economies reduce the sensitivity
of firm location to tax differentials? Economic Journal, forthcoming.Cameron, A. C., & Trivedi, P. K. (1998). Regression analysis of count data. Cambridge: Cambridge Uni-
versity Press.Cameron, A. C., Gelbach, J. B., & Miller, D. L. (2011). Robust inference with multi-way clustering.
Journal of Business & Economic Statistics, 29(2), 238–249.Carlton, D. (1983). The location and employment choices of new firms: an econometric model with dis-
crete and continuous endogenous variables. Review of Economics and Statistics, 65, 440–449.Cowell, F. A. (1975). Some notes on progression and risk-taking. Economica, 42, 313–318.Cullen, J. B., & Gordon, R. (2006a). Tax reform and entrepreneurial activity. In J.M. Poterba (Ed.), Tax
policy and the economy (Vol. 20, pp. 41–71). Cambridge: MIT Press.Cullen, J. B., & Gordon, R. (2006b). How do taxes affect entrepreneurial activity? A comparison of U.S.
and Swedish law (in Swedish). In P. Braunerhjelm & J. Wiklund (Eds.), Entreprenörskap och tillväxt(pp. 71–93). Stockholm: Swedish Foundation for Small Business Research.
Cullen, J. B., & Gordon, R. H. (2007). Taxes and entrepreneurial risk-taking: theory and evidence for theU.S. Journal of Public Economics, 91, 1479–1505.
Da Rin, M., Di Giacomo, M., & Sembenelli, A. (2011). Entrepreneurship, firm entry, and the taxation ofcorporate income: Evidence from Europe. Journal of Public Economics, 95(9–10), 1048–1066.
39Wage data are compiled by the Swiss Federal Statistical Office for seven Swiss regions, five of whichcomprise several cantons (the cantons of Zurich and Ticino representing regions on their own), and forsectoral aggregates that correspond roughly to the NACE 1-digit level. These data are available for theyears 2002 and 2004. We linearly extrapolate wage for the remaining years.40We obtained these data from the consultancy firm Wüest & Partner.
Progressive taxes and firm births 167
de Mooij, R. A., & Ederveen, S. (2003). Taxation and foreign direct investment: a synthesis of empiricalresearch. International Tax and Public Finance, 10, 673–693.
de Mooij, R. A., & Nicodème, G. (2008). Corporate tax policy, entrepreneurship and incorporation in theEU. International Tax and Public Finance, 15, 478–498.
Domar, E. D., & Musgrave, R. A. (1944). Proportional income taxation and risk-taking. The QuarterlyJournal of Economics, 58, 388–422.
Duranton, G., Gobillon, L., & Overman, H. G. (2011). Assessing the effects of local taxation using micro-geographic data. Economic Journal, 121(555), 1017–1046.
Edmiston, K., Mudd, S., & Valev, N. (2004). Tax structures and FDI: the deterrent effects of complexityand uncertainty. Fiscal Studies, 24, 341–359.
Feld, L. P., & Kirchgässner, G. (2003). The impact of corporate and personal income taxes on the lo-cation of firms and on employment: some panel evidence for the Swiss cantons. Journal of PublicEconomics, 87, 129–155.
Feldstein, M. (1969). The effects of taxation on risk taking. Journal of Political Economy, 77, 755–764.Fritsch, M. (2008). How does new business formation affect regional development? Introduction to the
special issue. Small Business Economics, 30(1), 1–14.Gentry, W. M., & Hubbard, G. (2000). Tax policy and entrepreneurial entry. American Economic Review,
90, 283–287.Gentry, W. M., & Hubbard, G. (2005). “Success taxes”, entrepreneurial entry and innovation. In A. B. Jaffe,
J. Lerner, & S. Stern (Eds.), Innovation policy and the economy (Vol. 5). Cambridge: NBER/MITPress.
Glaeser, E. L., Kallal, H. D., Scheinkman, J. A., & Shleifer, A. (1992). Growth in cities. Journal of PoliticalEconomy, 100(6), 1126–1152.
Goolsbee, A. (2004). The impact of the corporate income tax: evidence from state organizational formdata. Journal of Public Economics, 88, 2283–2299.
Gordon, R. H. (1985). Taxation of corporate capital income: tax revenues versus tax distortions. The Quar-terly Journal of Economics, 100(1), 1–27.
Gordon, R. H., & Slemrod, J. (2000). Are “real” responses to taxes simply income shifting between cor-porate and personal tax bases. In J. Slemrod (Ed.), Does atlas shrug? The economic consequences oftaxing the rich. Cambridge: Harvard University Press.
Guimaraes, P., Figuieredo, O., & Woodward, D. (2003). A tractable approach to the firm location decisionproblem. Review of Economics and Statistics, 85, 201–204.
Guimaraes, P., Figueiredo, O., & Woodward, D. (2004). Industrial location modeling: extending the ran-dom utility framework. Journal of Regional Science, 44, 1–20.
Hagen, K. P., & Sannarnes, J. G. (2007). Taxation of uncertain business profits, private risk markets andoptimal allocation of risk. Journal of Public Economics, 91, 1507–1517.
Hall, R. E., & Rabushka, A. (2007). The flat tax (2nd ed.). Stanford: Hoover Institution, Stanford Univer-sity.
Henneberger, F., & Ziegler, A. (2008). Eine Methode zur objektiven Bestimmung von Ober- und Unter-grenzen marktkonformer Aktionä rsgehälter. Der Schweizer Treuhänder, 2008(1–2), 69–79.
Hines, J. R. (2007). Corporate taxation and international competition. In A. J. Auerbach, J. R. Hines, &J. Slemrod (Eds.), Taxing corporate income in the 21st century. Cambridge: Cambridge UniversityPress.
Keen, M., Kim, Y., & Varsano, R. (2008). The flat tax(es): principles and evidence. International Tax andPublic Finance, 15, 712–751.
Kesselman, J. R., & Cheung, R. (2004). Tax incidence, progressivity, and inequality in Canada. CanadianTax Journal, 52, 709–789.
Keuschnigg, C., & Nielsen, S. B. (2004). Progressive taxation, moral hazard, and entrepreneurship. Journalof Public Economic Theory, 6, 471–490.
Keuschnigg, C., & Ribi, E. (2009). Profit taxation and finance constraints (CEPR Discussion Paper#7433).London: Centre for Economic Policy Research.
Michelacci, C. (2003). Low returns in R&D due to the lack of entrepreneurial skills. Economic Journal,113(484), 207–225.
Moulton, B. R. (1986). Random group effects and the precision of regression estimates. Journal of Econo-metrics, 32(3), 385–397.
Murphy, K. M., Shleifer, A., & Vishny, R. W. (1991). The allocation of talent: implications for growth.The Quarterly Journal of Economics, 106(2), 503–530.
Rathelot, R., & Sillard, P. (2008). The importance of local corporate taxes in business location decisions:evidence from French micro data. Economic Journal, 118, 499–514.

168 H.U. Bacher, M. Brülhart
Reynolds, P. D., Miller, B., & Maki, W. R. (1995). Explaining regional variation in business births anddeaths: US 1976–1988. Small Business Economics, 7(5), 389–407.
Schmidheiny, K., & Brülhart, M. (2011). On the equivalence of location choice models: conditional logit,nested logit and Poisson. Journal of Urban Economics, 69(2), 214–222.
Slemrod, J. (2005). The etiology of tax complexity: evidence from U.S. state income tax systems. PublicFinance Review, 33, 279–299.
Slemrod, J., & Bakija, J. (2004). Taxing ourselves (3rd ed.). Cambridge: MIT Press.Varian, H. R. (1980). Redistributive taxation as social insurance. Journal of Public Economics, 14(1),
49–68.Waterson, M. (1985). On progressive taxation and risk-taking. Oxford Economic Papers, 37, 510–519.