progression from the south the deloitte south island index · ebos group (up $813.0 million). •...
TRANSCRIPT

Progression from the South The Deloitte South Island IndexA review of the performance of South Island listed companies during the quarter ending 30 September 2018
November 2018 43rd Edition

2
The Deloitte South Island Index | 43rd Edition
IntroductionWelcome to the 43rd edition of the Deloitte South Island Index.
In this edition we look back on the performance of South Island listed companies during the most recent quarter to 30 September 2018.
The September 2018 quarter built on second quarter growth as the Deloitte South Island Index recorded growth of $2,190.8 million (8.8%), after a subdued first quarter and strong second quarter of the 2018 year.
Movements in September 2018For the month ended 30 September 2018 the Deloitte South Island Index recorded a decline of 0.4%, as did the S&P/NZX 50 Capital Index down 0.5% and the ASX All Ords down 1.6%. The Dow Jones was the only index tracked that recorded growth for the month ended 30 September 2018, up 1.9%.
Quarterly movements – Q3 2018The third quarter of 2018 saw the Deloitte South Island Index increase its market capitalisation by $2,190.8 million (8.8%). The increase was driven by five out of the seven sectors tracked. The Manufacturing
& Distribution sector recorded the highest growth in terms of market capitalisation increasing 20.3% and at the other end of the scale the Primary Sector recorded the largest decline for the quarter, falling 1.6%.
Annual movements – September 2017 to September 2018The Deloitte South Island Index grew by $6,028.5 million (28.8%) during the twelve months to 30 September 2018. Growth was also recorded by all the other indices tracked. The Deloitte South Island Index’s closest rival in terms of market capitalisation growth was the Dow Jones, up 28.1% for the year to 30 September 2018. At the other end of the scale the index tracked with the smallest recorded growth was the ASX All Ords, growing 10.1% over the twelve months to 30 September 2018.

3
The Deloitte South Island Index | 43rd Edition
Key points for the third quarter of 2018 include:
• The Deloitte South Island Index increased by $2,190.8 million (8.8%) during the quarter to 30 September 2018. All other indices tracked recorded increases over the same period with the Dow Jones finishing ahead of the Deloitte South Island Index, increasing by 9.0%. This was followed by the S&P/NZX 50 Capital Index increasing by 3.4% and the ASX All Ords increasing by 0.6% in terms of market capitalisation.
• There has been movement in the companies that have a market capitalisation of greater than $1.0 billion again this quarter. Skyline Enterprises was the fifth company on the Deloitte South Island Index to achieve market capitalisation greater than $1.0 billion during the 30 June 2018 quarter. However during the 30 September 2018 quarter a 4.3% decline resulted in them falling below the $1.0 billion benchmark and therefore falling out of the ‘Top Five’ Companies.
• The collective increase of the four companies whose market capitalisation is greater than $1.0 billion (the Top Four companies) was $2.02 billion (10.8%).
• Ryman Healthcare recorded the largest increase in market capitalisation, increasing by $1,015.0 million (17.0%), followed by EBOS Group $687.9 million (21.5%). Meridian Energy recorded a $422.9 million (5.3%) increase for the September quarter. Synlait Milk’s golden run paused during the September 2018 quarter as they suffered the largest decline (in dollar terms), falling by $105.7 million (5.2%).
• The smallest 10 companies collectively grew, recording a $2.1 million (2.3%) increase in market capitalisation.
• Outside of the Top Four, the Index’s best performers (in percentage terms) were Energy Mad whose market capitalisation increased 114.3% ($1.6 million) during the September quarter followed by BLIS Technologies who increased their market capitalisation by 38.2% ($5.5 million).
• Significant declines in the Index this quarter were led by SeaDragon, who dropped 33.3% ($4.5 million), followed by Smiths City Group who fell by a 22.9% ($4.7 million) and Scott Technology who dropped 12.6% ($33.4 million).
Key points for the 12 months to September 2018 include:
• Over the twelve months to 30 September 2018 the top performers, in percentage terms, were some of the smaller players, Energy Mad (up 913.7%), Windflow Technology (up 156.8%) and Connexionz (up 110.0%). In dollar terms the list looks different with Ryman Healthcare topping the table with growth of $2,365.0 million over the past twelve months, followed by Meridian Energy (up $1,127.7 million) and EBOS Group (up $813.0 million).
• The largest declines over the 12 months in percentage terms were SeaDragon (down 66.7%), Smiths City Group (down 53.1%) and BLIS Technologies (down 37.9%). In dollar terms the largest declines were Pacific Edge (down $35.9 million), Syft Technologies (down $28.3 million) and SeaDragon (down $18.1 million).
Executive summaryThe Deloitte South Island Index has continued to build on its second quarter performance driven by The Top Four Companies.

4
Energy Mad
114.3%
Meridian Energy
5.3%
BLIS Technologies
38.2%
Scott Technology
12.6%
SeaDragon
33.3%
1.6%
Windflow Technologies
30.0%
Smiths City Group
22.9%
Snylait Milk
5.2%
EBOS Group
21.5%
Ryman Healthcare
17.0%Manufacturing &
Distribution sector
20.3%
Aged Care sector
16.0%
Retail sector
12.9%
Technology sector
10.6%
Energy & Mining sector
5.3%
$6.0bn(28.8%)
The DeloitteSouth Island Index
over the last 12 months grew by
5/7Sectors
record growth during September 2018
quarter
sectors record declines during the
September 2018quarter
Topgains
Top performing company over 12
months, Energy Mad grew by:
913.7%
TheTop 4
companiesSeptember 2018
quarter
September 2018 quarter
Topdeclines
Primary
0.9%Other
September 2018 quarter
September 2018 quarter
2/7Sectors
5
The Deloitte South Island Index | 43rd Edition
Quarter to 30 September 2018
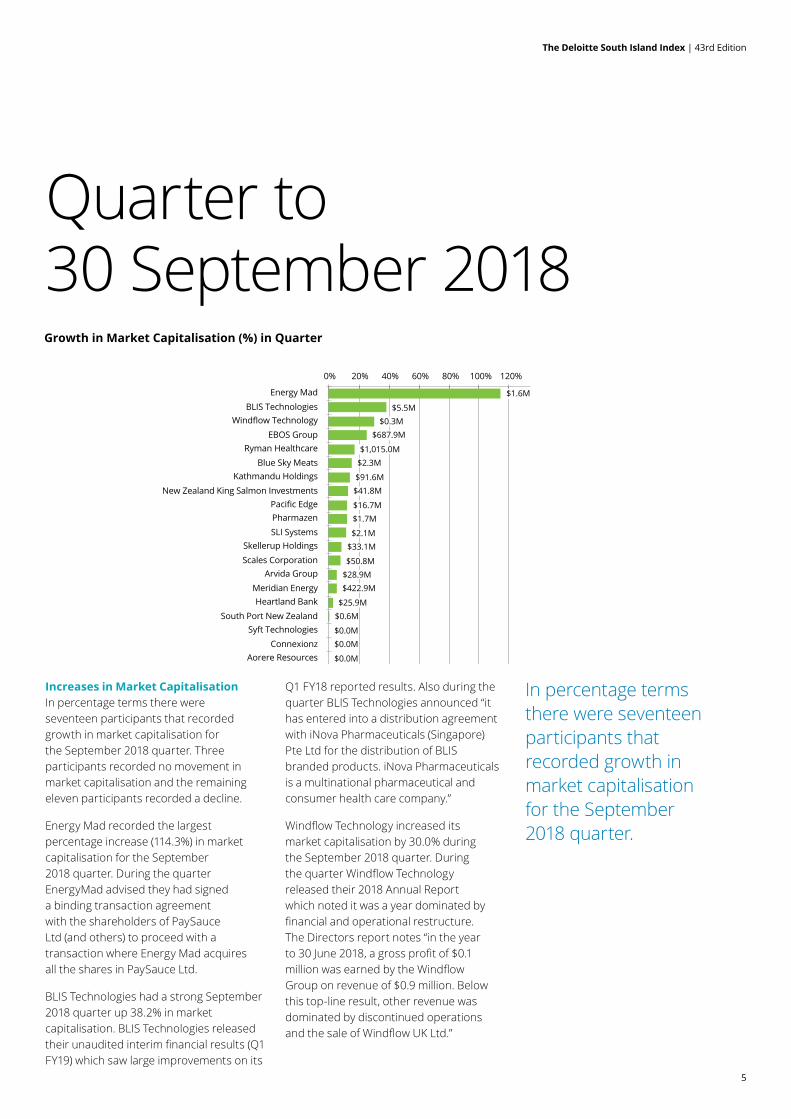
Increases in Market Capitalisation In percentage terms there were seventeen participants that recorded growth in market capitalisation for the September 2018 quarter. Three participants recorded no movement in market capitalisation and the remaining eleven participants recorded a decline.
Energy Mad recorded the largest percentage increase (114.3%) in market capitalisation for the September 2018 quarter. During the quarter EnergyMad advised they had signed a binding transaction agreement with the shareholders of PaySauce Ltd (and others) to proceed with a transaction where Energy Mad acquires all the shares in PaySauce Ltd.
BLIS Technologies had a strong September 2018 quarter up 38.2% in market capitalisation. BLIS Technologies released their unaudited interim financial results (Q1 FY19) which saw large improvements on its
Q1 FY18 reported results. Also during the quarter BLIS Technologies announced “it has entered into a distribution agreement with iNova Pharmaceuticals (Singapore) Pte Ltd for the distribution of BLIS branded products. iNova Pharmaceuticals is a multinational pharmaceutical and consumer health care company.”
Windflow Technology increased its market capitalisation by 30.0% during the September 2018 quarter. During the quarter Windflow Technology released their 2018 Annual Report which noted it was a year dominated by financial and operational restructure. The Directors report notes “in the year to 30 June 2018, a gross profit of $0.1 million was earned by the Windflow Group on revenue of $0.9 million. Below this top-line result, other revenue was dominated by discontinued operations and the sale of Windflow UK Ltd.”
Growth in Market Capitalisation (%) in Quarter
$5.5M
$0.6M
$0.0M$0.0M
$0.0M
0% 20% 40% 60% 80% 100% 120%
Energy MadBLIS Technologies
Windflow TechnologyEBOS Group
Ryman HealthcareBlue Sky Meats
Kathmandu HoldingsNew Zealand King Salmon Investments
Pacific EdgePharmazenSLI Systems
Skellerup HoldingsScales Corporation
Arvida GroupMeridian EnergyHeartland Bank
South Port New ZealandSyft Technologies
ConnexionzAorere Resources
$(105.7)M
$(37.7)M
$(2.2)M
(35%) (25%) (15%) (5%) 0%
Foley Family Wines
Chatham Rock Phosphate
Silver Fern Farms
Marlborough Wine Estates Group
Skyline Enterprises
Synlait Milk
PGG Wrightson
Moa Group
Scott Technology
Smiths City Group
SeaDragon
$1.6M
$0.3M$687.9M
$1,015.0M$2.3M
$91.6M$41.8M
$16.7M$1.7M
$2.1M$33.1M
$50.8M$28.9M$422.9M
$25.9M
$(0.5)M
$(0.1)M
$(33.4)M
$(4.7)M
$(4.5)M
Decline in Market Capitalisation (%) in Quarter
$(2.0)M
$(2.9)M
$(44.2)M
In percentage terms there were seventeen participants that recorded growth in market capitalisation for the September 2018 quarter.
6
The Deloitte South Island Index | 43rd Edition
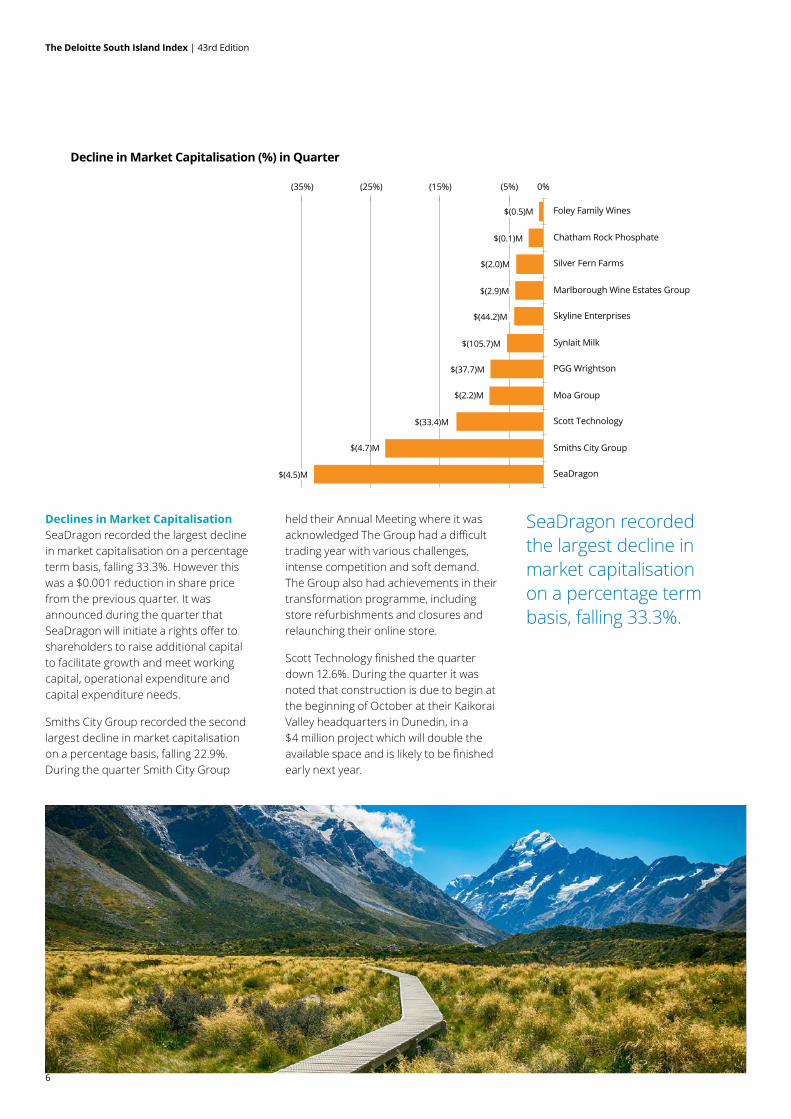
SeaDragon recorded the largest decline in market capitalisation on a percentage term basis, falling 33.3%.
Declines in Market CapitalisationSeaDragon recorded the largest decline in market capitalisation on a percentage term basis, falling 33.3%. However this was a $0.001 reduction in share price from the previous quarter. It was announced during the quarter that SeaDragon will initiate a rights offer to shareholders to raise additional capital to facilitate growth and meet working capital, operational expenditure and capital expenditure needs.
Smiths City Group recorded the second largest decline in market capitalisation on a percentage basis, falling 22.9%. During the quarter Smith City Group
held their Annual Meeting where it was acknowledged The Group had a difficult trading year with various challenges, intense competition and soft demand. The Group also had achievements in their transformation programme, including store refurbishments and closures and relaunching their online store.
Scott Technology finished the quarter down 12.6%. During the quarter it was noted that construction is due to begin at the beginning of October at their Kaikorai Valley headquarters in Dunedin, in a $4 million project which will double the available space and is likely to be finished early next year.
Growth in Market Capitalisation (%) in Quarter
$5.5M
$0.6M
$0.0M$0.0M
$0.0M
0% 20% 40% 60% 80% 100% 120%
Energy MadBLIS Technologies
Windflow TechnologyEBOS Group
Ryman HealthcareBlue Sky Meats
Kathmandu HoldingsNew Zealand King Salmon Investments
Pacific EdgePharmazenSLI Systems
Skellerup HoldingsScales Corporation
Arvida GroupMeridian EnergyHeartland Bank
South Port New ZealandSyft Technologies
ConnexionzAorere Resources
$(105.7)M
$(37.7)M
$(2.2)M
(35%) (25%) (15%) (5%) 0%
Foley Family Wines
Chatham Rock Phosphate
Silver Fern Farms
Marlborough Wine Estates Group
Skyline Enterprises
Synlait Milk
PGG Wrightson
Moa Group
Scott Technology
Smiths City Group
SeaDragon
$1.6M
$0.3M$687.9M
$1,015.0M$2.3M
$91.6M$41.8M
$16.7M$1.7M
$2.1M$33.1M
$50.8M$28.9M$422.9M
$25.9M
$(0.5)M
$(0.1)M
$(33.4)M
$(4.7)M
$(4.5)M
Decline in Market Capitalisation (%) in Quarter
$(2.0)M
$(2.9)M
$(44.2)M

7
The Deloitte South Island Index | 43rd Edition
Sector movementsQuarter to 30 September 2018In percentage terms, the growth of the Index was led by the Manufacturing & Distribution sector which grew by 20.3%. Energy Mad’s quarterly performance which saw it increase by $1.6 million (114.3%) was followed by EBOS Group who increased their market capitalisation by 25.1%. Skellerup Holdings was also up 8.6% after increasing their shares on issue by 1.9 million during the quarter. Scott Technology was the only sector participant to decline, falling 12.6% for the September 2018 quarter.
Aged Care had a strong September quarter with Ryman Healthcare out performing Arvida Group to increase their market capitalisations by 17.0% and 5.5% respectively during the quarter. Arvida Group announced an unconditional agreement to acquire land in Kerikeri to build a new retirement village.
Retail had a mixed bag of results, with Kathmandu experiencing a strong quarter finishing with an increase of
14.0%. During the quarter Kathmandu released their annual financial results for the 12 months ending 31 July 2018, with revenues up 11.7% and net profit attributable to shareholders up 32.8%. On the flip side Smith City recorded a decline in market capitalisation, down 22.9%.
The Technology sector was one of the two sectors where no participants recorded declines, growing 10.6% (26.0m) in market capitalisation during the quarter. BLIS Technologies took the lead and recorded a 38.2% increase in market capitalisation ($5.5m). Both Syft Technologies Limited and Connexionz recorded no change in market capitalisation for the September 2018 quarter.
Energy & Mining was up 5.3% for the September 2018 quarter. Windflow Technology took out first place with the highest percentage growth of 30.0% ($0.3m). Meridian Energy increased its market capitalisation by 5.3% for the quarter ($422.9m), Aorere Resources recorded no change
in market capitalisation and Chatham Rock Phosphate fell 2.1% ($0.1m) as it continues during this quarter to bid for a marine consent from the Environmental Protection Authority (EPA) to mine off the South Island’s east coast.
The Primary Sector recorded the largest decline in percentage terms for the quarter, with six out of the nine participants recording declines. SeaDragon and PGG Wrightson had the largest percentage declines, falling 33.3% and 7.6% respectively. Growth was seen in Blue Sky Meats, New Zealand King Salmon and Scales Corporation, increasing 15.3%, 12.6% and 7.8% respectively. Blue Sky Meats saw a significant improvement in performance during their financial year with their annual results released during the quarter reporting a net operating profit of $3.75 million compared to a $2.25 million loss the previous year.
Base period - December 2006 = 1.00
(5%)
0%
5%
10%
15%
20%
25%
Technology Energy& Mining
Manufacturing& Distribution
Primary Aged Care Retail Other
% M
ovem
ent i
n In
dex
Sector
Movement in Sector Indices - Quarter to September 2018
Performance of Deloitte South Island Index vs Major Indices
ASX All Ords
0.50
0.75 1.00
1.25 1.50
1.75 2.00
2.25 2.50
2.75 3.00
3.25 3.50
3.75
4.00 4.25
30 Sep2016
31 Dec2016
31 Mar2017
30 Jun2017
30 Sep2017
31 Dec2017
31 Mar2018
30 Jun2018
30 Sep2018
Tota
l Mar
ket C
apit
alis
atio
n (r
elat
ive
to o
ne)
Deloitte SI Index S&P/NZX 50 Capital Index Dow Jones

8
The Deloitte South Island Index | 43rd Edition
Industry Number of Companies
30 Sept 2018
$ million
30 June 2018
$ million
Mvmt in Quarter $
million
% change in Mkt Cap
during quarter
% of Index
Technology 6 $270.6 $244.6 $26.0 10.6% 1.0%
Energy & Mining 4 $8,427.0 $8,003.9 $423.1 5.3% 31.3%
Manufactoring & Distribution 4 $4,078.1 $3,388.9 $689.2 20.3% 15.1%
Primary 9 $3,702.2 $3,760.6 $(58.4) (1.6)% 13.7%
Aged Care 2 $7,558.8 $6,514.9 $1,043.9 16.0% 28.0%
Retail 2 $763.1 $676.2 $86.9 12.9% 2.8%
Other 4 $2,165.5 $2,185.4 $(19.9) (0.9)% 8.0%
TOTAL 31 $26,965.3 $24,774.5 $2,190.8 8.8% 100.0%

9
The Deloitte South Island Index | 43rd Edition
BenchmarkingThe Deloitte South Island Index started 2018 down 1.5%, the second quarter saw a brighter pace with the Index up 10.3% and the third quarter saw the Deloitte South Island Index grow at a softer pace, but still up 8.8%.
The other indices tracked also experienced positive third quarters with the Dow Jones outperforming the Deloitte South Island Index increasing 9.0% during the quarter. The S&P/NZX 50 Capital Index also had a strong quarter up 3.4%. The ASX All Ords recorded the lowest growth percentage for the quarter, up 0.6%.
The Deloitte South Island Index started 2018 down 1.5%, the second quarter saw a brighter pace with the Index up 10.3% and the third quarter saw the Deloitte South Island Index grow at a softer pace, but still up 8.8%.
Base period - December 2006 = 1.00
(5%)
0%
5%
10%
15%
20%
25%
Technology Energy& Mining
Manufacturing& Distribution
Primary Aged Care Retail Other
% M
ovem
ent i
n In
dex
Sector
Movement in Sector Indices - Quarter to September 2018
Performance of Deloitte South Island Index vs Major Indices
ASX All Ords
0.50
0.75 1.00
1.25 1.50
1.75 2.00
2.25 2.50
2.75 3.00
3.25 3.50
3.75
4.00 4.25
30 Sep2016
31 Dec2016
31 Mar2017
30 Jun2017
30 Sep2017
31 Dec2017
31 Mar2018
30 Jun2018
30 Sep2018
Tota
l Mar
ket C
apit
alis
atio
n (r
elat
ive
to o
ne)
Deloitte SI Index S&P/NZX 50 Capital Index Dow Jones

10
Of the 31 companies currently listed on the Deloitte South Island Index, 17 (55%) experienced a rise in market capitalisation during the quarter to 30 September 2018, 11 declined and 3 remained unchanged.
The full Deloitte South Island Index for the quarter ended 30 September 2018, ranked by market capitalisation, is set out in the table below.
Deloitte South Island Index – September 2018
Sept 2018 Rank
June 2018 Rank
Ticker Company Sector Mcap Sept 2018
($m)
Mcap June 2018
($m)
Change in Mcap ($m) in
Quarter
Change in Mcap (%)
in Quarter
Share Price 30
Jun 2018
1 1 MEL Meridian Energy Energy & Mining $8,419.5 $7,996.6 $422.9 5.3% $3.285
2 2 RYM Ryman Healthcare Aged Care $7,000.0 $5,985.0 $1,015.0 17.0% $14.000
3 3 EBO EBOS GroupManufacturing & Distribution
$3,426.0 $2,738.1 $687.9 25.1% $22.460
4 4 SML Synlait Milk Primary $1,944.6 $2,050.3 $(105.7) (5.2)% $10.850
5 6 HBL Heartland Bank Other $978.2 $952.3 $25.9 2.7% $1.730
6 5 SKYLINE Skyline Enterprises Other $977.2 $1,021.4 $(44.2) (4.3)% $28.700
7 7 KMD Kathmandu Holdings Retail $747.3 $655.7 $91.6 14.0% $3.310
8 8 SCL Scales Corporation Primary $705.5 $654.7 $50.8 7.8% $5.000
9 9 ARV Arvida Group Aged Care $558.8 $529.9 $28.9 5.5% $1.350
10 10 PGW PGG Wrightson Primary $460.5 $498.2 $(37.7) (7.6)% $0.610
11 11 SKL Skellerup HoldingsManufacturing & Distribution
$416.8 $383.7 $33.1 8.6% $2.140
12 12 NZKNew Zealand King Salmon Investments
Primary $372.8 $331.0 $41.8 12.6% $2.690
13 13 SCT Scott Technology Manufacturing & Distribution
$232.3 $265.7 $(33.4) (12.6)% $3.060
14 14 SPN South Port New Zealand Other $184.2 $183.6 $0.6 0.3% $7.020
15 15 PEB Pacific Edge Technology $151.9 $135.2 $16.7 12.4% $0.320
16 16 FFW Foley Family Wines Primary $76.8 $77.3 $(0.5) (0.6)% $1.450
17 17 MWEMarlborough Wine Estates Group
Primary $67.5 $70.4 $(2.9) (4.1)% $0.230
18 18 SYF Syft Technologies Technology $57.0 $57.0 $0.0 0.0% $0.800
19 19 SFF Silver Fern Farms Primary $48.2 $50.2 $(2.0) (4.0)% $0.480
20 20 MOA Moa Group Other $25.9 $28.1 $(2.2) (7.8)% $0.430
21 22 SLI SLI Systems Technology $20.5 $18.4 $2.1 11.4% $0.330
22 24 BLT BLIS Technologies Technology $19.9 $14.4 $5.5 38.2% $0.018
23 23 BLUESKY Blue Sky Meats Primary $17.3 $15.0 $2.3 15.3% $1.500
24 21 SCY Smiths City Group Retail $15.8 $20.5 $(4.7) (22.9)% $0.300
25 25 PAZ Pharmazen Technology $15.6 $13.9 $1.7 12.2% $0.071
26 26 SEA SeaDragon Primary $9.0 $13.5 $(4.5) (33.3)% $0.002
27 27 CNX Connexionz Technology $5.7 $5.7 $0.0 0.0% $0.105
28 28 CRP Chatham Rock Phosphate Energy & Mining $4.7 $4.8 $(0.1) (2.1)% $0.265
29 30 MAD Energy MadManufacturing & Distribution
$3.0 $1.4 $1.6 114.3% $0.017
30 29 AOR Aorere Resources Energy & Mining $1.5 $1.5 $0.0 0.0% $0.001
31 31 WTL Windflow Technology Energy & Mining $1.3 $1.0 $0.3 30.0% $0.014
31 31 TOTAL $26,965.3 $24,774.5 $2,190.8 8.8.%

11
The Deloitte South Island Index | 43rd Edition
Compilation of the Deloitte South Island IndexThe Deloitte South Island Index (‘the Index’) is compiled from information provided by the NZX, and Unlisted on the market capitalisation of each South-Island based listed company. Broadly, a company is included in the Index where its registered office is in the South Island and/or a substantial portion of its operations are focused in the South Island. The information on South Island listed companies is extracted and totalled to provide a cumulative market capitalisation for all South Island listed companies.
The base period of the Deloitte South Island Index is 31 December 2006 and for the purposes of the Index this data is given a notional value of one. All subsequent quarterly cumulative market capitalisation totals are divided by the totals for the December 2006 quarter to obtain a relative movement. Market capitalisation will move as a result of capital injections, payments of dividends and capital returns. If a new South Island based company lists on the NZX or Unlisted they will be reflected in the Index as though they were present in the base period. Accordingly, the Index will only reflect changes in market capitalisation subsequent to listing. If a company is suspended or delisted during a quarter, no data will be included for the company, including any historical data, until the company is re-listed or the suspension lifted.
For the purposes of the sector analysis some sector segments have been grouped to provide a more meaningful analysis.
InformationDeloitte Corporate Finance is the firm’s specialist corporate finance practice. For information regarding the Deloitte South Island Index or any of the services that we offer please contact any of our South Island based team below.
Christchurch
Scott McClayPartner | Corporate Finance+64 (03) 363 [email protected]
Kyle CallowDirector | Corporate Finance+64 (03) 363 [email protected]
Aaron ThornPartner | Tax & Private+64 (03) 363 [email protected]
Steve LawPartner | ConsultingDirect : +64 (03) 363 [email protected]
Mike HawkenPartner | AuditDirect : +64 (03) 474 [email protected]
Daniel HellyerPartner | Tax & PrivateDirect : +64 (03) 901 [email protected]
Phil StevensonPartner | Tax & PrivateDirect : +64 (03) 474 [email protected]
Kyle CameronPartner | Tax & PrivateDirect : +64 (03) 474 [email protected]
Mike HornePartner | Tax & PrivateDirect : +64 (03) 474 [email protected]
Shari CarterPartner | Tax & PrivateDirect : +64 (03) 363 [email protected]
Mike HoshekPartner | AuditDirect : +64 (03) 363 [email protected]
Rob McDonaldDirector | Corporate Finance+64 (03) 363 [email protected]
Richard BaileyPartner | Corporate Finance+64 (03) 363 [email protected]
Dunedin Queenstown
Christchurch 151 Cambridge Terrance, Christchurch 8013PO Box 248, Christchurch 8140New ZealandTel: +64 (0) 3 379 7010Fax: +64 (0) 3 366 6539www.deloitte.co.nz
DunedinOtago House, 481 Moray Place, Dunedin 9016PO Box 1245, Dunedin 9054New ZealandTel: +64 (0) 3 474 8630 Fax: +64 (0) 3 474 8650www.deloitte.co.nz
QueenstownLevel 2, 10 Memorial StreetPO Box 794, Queenstown 9348New ZealandTel: +64 (0) 3 901 0570 Fax: +64 (0) 3 901 0571www.deloitte.co.nz
Deloitte refers to one or more of Deloitte Touche Tohmatsu Limited, a UK private company limited by guarantee (“DTTL”), its network of member firms, and their related entities. DTTL and each of its member firms are legally separate and independent entities. DTTL (also referred to as “Deloitte Global”) does not provide services to clients. Please see www.deloitte.com/about for a more detailed description of DTTL and its member firms.
Deloitte provides audit, consulting, financial advisory, risk management, tax and related services to public and private clients spanning multiple industries. Deloitte serves four out of five Fortune Global 500® companies through a globally connected network of member firms in more than 150 countries bringing world-class capabilities, insights, and high-quality service to address clients’ most complex business challenges. To learn more about how Deloitte’s approximately 245,000 professionals make an impact that matters, please connect with us on Facebook, LinkedIn, or Twitter.
Deloitte New Zealand brings together more than 1200 specialist professionals providing audit, tax, technology and systems, strategy and performance improvement, risk management, corporate finance, business recovery, forensic and accounting services. Our people are based in Auckland, Hamilton, Rotorua, Wellington, Christchurch, Queenstown and Dunedin serving clients that range from New Zealand’s largest companies and public sector organisations to smaller businesses with ambition to grow. For more information about Deloitte in New Zealand, look to our website www.deloitte.co.nz.
This communication contains general information only, and none of Deloitte Touche Tohmatsu Limited, its member firms, or their related entities (collectively, the “Deloitte Network”) is, by means of this communication, rendering professional advice or services. Before making any decision or taking any action that may affect your finances or your business, you should consult a qualified professional adviser. No entity in the Deloitte Network shall be responsible for any loss whatsoever sustained by any person who relies on this communication.
© 2018. For information, contact Deloitte Touche Tohmatsu Limited.