progress within the f-trace project...progress within the f-trace project environmental research...
TRANSCRIPT

Progress within the F-TRACE Project
Environmental Research Group Fukushima Environmental Safety CenterJapan Atomic Energy Agency (JAEA)
2nd Caesium Workshop: meeting challenges for Fukushima recovery on 6th Oct. 2014
We are here!
Tadafumi NIIZATO, Takahiro NAKANISHI, Hironori FUNAKITadahiko TSURUTA and Kazuki IIJIMA
Objectives of the F-TRACE project 2
AdvectionAdvection
Transport / accumulation in a river system
Transport pathways & processes
Develop phenomenological models to describe quantitatively transport of radioisotopes(especially radioactive Cs) along water systems
y
Desorption / coagulation by saline waterTransport by ocean currents
Transport behavior of Cs to be modeled
Behavior of radioCs flowing into living-sphereevaluate external irradiation in the living-sphere
Behavior of each species of radioCs in river system evaluate internal exposure by intake of water
apply to evaluate Cs uptake by agricultural/aquatic products
Behavior of each species of radioCs in forests evaluate external irradiation of forestry workers apply to evaluate cycle of Cs in forested ecosystem
Erosion
transportpsedimentation
Soil loss
Processes of soil loss
Air dose rate/h, 31st May, 2011
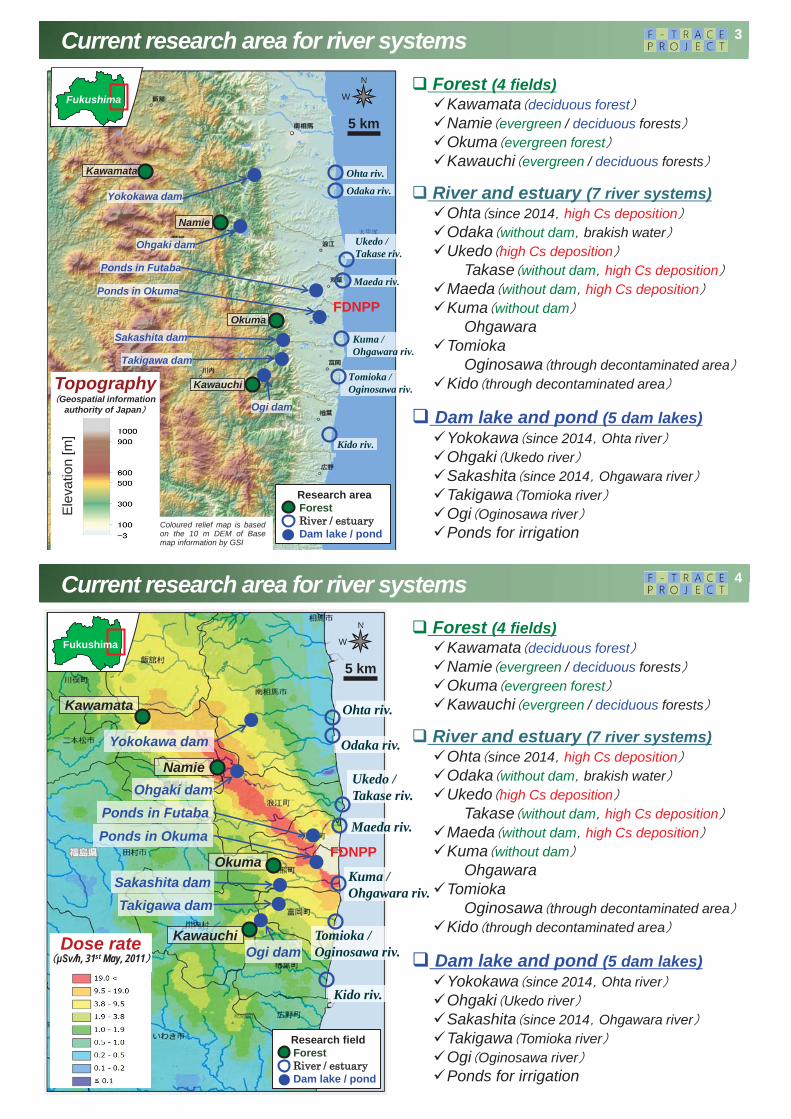
Current research area for river systems
Forest (4 fields)Kawamata deciduous forestNamie evergreen / deciduous forestsOkuma evergreen forestKawauchi evergreen / deciduous forests
River and estuary (7 river systems)Ohta since 2014 high Cs depositionOdaka without dam brakish waterUkedo high Cs deposition
Takase without dam high Cs depositionMaeda without dam high Cs depositionKuma without dam
OhgawaraTomioka
Oginosawa through decontaminated areaKido through decontaminated area
Dam lake and pond (5 dam lakes)Yokokawa since 2014 Ohta riverOhgaki Ukedo riverSakashita since 2014 Ohgawara riverTakigawa Tomioka riverOgi Oginosawa riverPonds for irrigation
FDNPP
5 km
N
W
N
W
Research area Forest River / estuary Dam lake / pond
Takigawa dam
Ogi dam
Ohgaki dam
Ponds in Okuma
Ponds in Futaba
Kawamata
Kawauchi
Namie
Okuma
Odaka riv.
Ukedo /Takase riv.
Maeda riv.
Kuma /Ohgawara riv.
Tomioka /Oginosawa riv.
Kido riv.
Ohta riv.
Sakashita dam
Yokokawa dam
3
Fukushima
TopographyGeospatial information
authority of Japan
Ele
vatio
n [m
]
Coloured relief map is basedon the 10 m DEM of Basemap information by GSI
Current research area for river systems
4
Forest (4 fields)Kawamata deciduous forestNamie evergreen / deciduous forestsOkuma evergreen forestKawauchi evergreen / deciduous forests
River and estuary (7 river systems)Ohta since 2014 high Cs depositionOdaka without dam brakish waterUkedo high Cs deposition
Takase without dam high Cs depositionMaeda without dam high Cs depositionKuma without dam
OhgawaraTomioka
Oginosawa through decontaminated areaKido through decontaminated area
Dam lake and pond (5 dam lakes)Yokokawa since 2014 Ohta riverOhgaki Ukedo riverSakashita since 2014 Ohgawara riverTakigawa Tomioka riverOgi Oginosawa riverPonds for irrigation
FDNPP
5 km
N
W
N
W
Dose rate/h, 31st May, 2011
Research field Forest River / estuary Dam lake / pond
Takigawa dam
Ogi dam
Ohgaki dam
Ponds in OkumaPonds in Futaba
Kawamata
Kawauchi
Namie
Okuma
Odaka riv.
Ukedo /Takase riv.
Maeda riv.
Kuma /Ohgawara riv.
Tomioka /Oginosawa riv.
Kido riv.
Ohta riv.
Sakashita dam
Yokokawa dam
4
Fukushima

5Overview of the numerical models
1D/2D river models: TODAM, iRIC
3D reservoir/coastal models: FLESCOT, ROMS
Soil and Cs transport model: SACT
Amounts from upper stream and sides
Amounts from land surface
Amounts from rivers
Future radio-cesium distribution map
Future radio-cesium distribution on river basins
Future radio-cesium distribution on
coastal field Air dose evaluation models:PHITS, MCNP
Forest investigation
6
Ogi, Kawauchi(deciduous broad-leaved forest)
Ubagami, Okumaevergreen coniferous
forest & deciduous broad-leaved forest
Ogi, Kawauchi(evergreen
coniferous forest)

7
Kawauchi
Fukushiam
10 km
N
W
N
W
Vegetation Topography Soil1)Kawamata Town, Sakashita
Deciduous broad-leaved forest
South-facing valleyGentle to steep slope
Brown forest soil
2) Namie Town, Kawafusa (Ukedo River & Ogaki dam lake)
Evergreen needle-leaved forest (lower stream)Deciduous broad-leaved forest (upper stream)
East-facing valley, steep slopeGully erosion Transported
soil
3) Okuma Town, Ubagami (Kuma River)
Evergreen needle-leaved forest
North-facing, gentle to intermediate slopeGully erosion
Brownforest soil (thick A horizon)
4) Kawauchi Village, Ogi (Ogi dam lake)
< Ogi A >Evergreen needle-leaved forest
North-facing valleyIntermediate to steep slope
Brown forest soil
< Ogi B >Evergreen needle-leaved forest
South-facingvalleySteep slope
Brown forest soil
< Ogi C >Deciduous broad-leaved forest
South-facing slopeIntermediate to steep slope
Brown forest soil (thick organic layer)Transportedsoil
1) Sakashita,Kawamata
4) Ogi,Kawauchi
2) Kawafusa,Namie
3) Ubagami,Okuma
Ogaki dam lake
KumaRiver
Ogi dam lake
Namie
Okuma
Coloured relief map is based on the 10 m DEM of Base map information by GSI
Forest: Investigation area 7
Forest : Investigation area
Ogaki dam lake
Fukushima5 kmN
W
N
WW
KumaRiver
Ogi dam lake
Dos
e ra
te, 1
m a
bove
gr
ound
sur
face
[/h
]
19.5 9.5 – 19.03.8 - 9.51.9 - 3.81.0 - 1.90.5 - 1.00.2 - 0.50.1 - 0.2
0.1
Distribution Map of Radiation Dose
- Airborne monitoring -
MINISTRY OF EDUCATION,CULTURE, SPORTS,SCIENCE AND TECHNOLOGY JAPAN
Sakashita,Kawamata
Ogi,Kawauchi
Kawafusa,Namie
Ubagami,Okuma
8
Vegetation Topography Soil1)Kawamata Town, Sakashita
Deciduous broad-leaved forest
South-facing valleyGentle to steep slope
Brown forest soil
2) Namie Town, Kawafusa (Ukedo River & Ogaki dam lake)
Evergreen needle-leaved forest (lower stream)Deciduous broad-leaved forest (upper stream)
East-facing valley, steep slopeGully erosion Transported
soil
3) Okuma Town, Ubagami (Kuma River)
Evergreen needle-leaved forest
North-facing, gentle to intermediate slopeGully erosion
Brownforest soil (thick A horizon)
4) Kawauchi Village, Ogi (Ogi dam lake)
< Ogi A >Evergreen needle-leaved forest
North-facing valleyIntermediate to steep slope
Brown forest soil
< Ogi B >Evergreen needle-leaved forest
South-facingvalleySteep slope
Brown forest soil
< Ogi C >Deciduous broad-leaved forest
South-facing slopeIntermediate to steep slope
Brown forest soil (thick organic layer)Transportedsoil

9
Soil (field investigation, lab analysis)Soil type, distribution, soil horizon sequence, sampling, grain size distribution, mineral composition, radioCs concentration
Vegetation field investigation, remote sensingTree species, height, tree density, undergrowthLitter fall, liter composition, litter samplingVegetation and land use mapping
Topography field investigation, DEM analysis)Topographic surveying, micro topography & its distributionSlope map, slope orientation map, sedimentation point
Tree height measurement
Forest: Site characteristics and radioCs distribution
Relationship among vegetation-topography-soil characteristics-radioCs concentration & distributionConceptualisation of real transport processes of radioCs
Vegetation map
[m]Investigation area
Japanese cedar
Red pine
Hardwood
Deciduous shrub
Transport processDose rateForest floor, slope
Dose rate measurement
Soil loss on the mountain slope
Soil sampling by scraper platesampling interval: 1 cm
ation
Soil thickness measurement by penetration test
10
ca.6 m
Rainfall (gross precipitation)
ThroughfallStem flow
Surface runoff & Soil loss
Transport of radioCs with Surface runoff & Soil losson the forest slope
Assessment of radioCs input and output in the forest floor per unit period and area from
forest [ex. Bq/m2/year]
ca. 20 cm height
Precipitation gauge
Stem flow tank (70 L)
Tanks for soil & water catchment (200 L x 2)
Water Level gauge
Water level gauge
Solar battery panel
Turbidity gauge
Triangular weir(W 30cm, H 25cm, D 60cm)
Water sampler(10 L) (throughfall)
Forest : Monitoring of surface runoff and soil loss
Gauge ofsoil moisture
Flowing into river system

Forest: Transport and sedimentation processes in the forest floor
Transport & sedimentation processes
by RainfallRainfall run-off (overland flow, downslope flow)Raindrop erosionStem flowLitter flow (run-off over the litter layer, esp. broad-leaved forest)Rainy season July to OctoberWhole forested area
by Frost actionFreezing and thawing action (frost heave, frost creep)Downslope transport of thawing soil Winter season (December, January to February)South-facing forested area, thin litter layer
by Mass movementSmall-scale mudslideVery steep forest slopeMainly, rainy season and snowmelt season (late Feburary to March)Small area in the forest
by Snow movement and Snow melting
Erosion by melting waterShaving and grooving of top soilSnow season and snow melt seasonSmall area in the forest
11
20cm20cm
Outflow of soil at the base of tree
Soil pillar by raindrop erosion
Sedimentation of litter at the forest edge
Downslope slip of thawing soil
Mudslide on the gully slope
Sampling point
Forest: Depth distribution of radioCs (Evergreen coniferous forest)
NN 50 mA
B
0 20 40 60 80 100 120
Distance [m]
380
400
420
Elev
ati
AB
Red Relief Image Map, patent technology by Asia Air Survey Co.Ltd.
Contour intervals: 1 m Sample No. : PAK-1,
at crest flat
Brown forest soil Sampling date: January 2013
12
Dep
th [c
m]
Concentration [kBq/kg]
Dep
th [c
m]
Concentration [kBq/kg]
Dep
th [c
m]
Concentration [kBq/kg]
Sample No. : SUP-6• Footslope• Slope dip: 16• Litter layer: 9 cm
Dep
th [c
m]
Cs-137 Cs-137
Sample No. : SUP-4• Sideslope• Slope dip: 30• Litter layer: 2.5 – 3 cm
Sample No.: SUP-1• Crest flat• Slope dip: 8• Litter layer: 3.5 cm
Cs-137
Dep
th [c
m]
Sideslope ( =1.24)Footslope ( =0.55)
0
Dep
th [c
m]
Concentration [kBq/kg]
Cx = C0 exp(- )+Q
<Schematic diagram>

Kawauchi
Fukushiam
10 km
N
W
N
W
Ogaki dam lake
Ogi dam lake
Namie
Okuma
Coloured relief map is based on the 10 m DEM of Base map information by GSI
Snow season
Snowseason
JMA: Tsushima
Annual precipitation- average in the past 30 years 1,345.9 mm- 2011 1,211 mm 2013 1,374 mm
Observation period at KA-plot
13
Sakashita,Kawamata
Town
Ogi,Kawauchi
Village JMA: Kawauch
[mm]
Annual precipitation- average in the past 30 years 1,511 mm- 2011 1,320 mm 2013 1,234 mm[mm]
Observation period at KE-plot
Forest: Precipitation near the observation plot (AMeDAS, Japan Meteorological Agency)
0
100
200
300
400
J F M A M J J A S O N D
0
100
200
300
400
J F M A M J J A S O N D
<Ogi, Kawauchi Village_KA-plot>Outflow of radioCs: 1,100 Bq/m2/yearOutfow rate of radioCs: 0.2 % per year
<Sakashita, Kawamata Town_KE-plot>Outflow of radioCs: 470 Bq/m2/yearOutfow rate of radioCs: 0.1 % per year
JMA: Tsushima
JMA: Kawauch
Rain fal l
Stem
flow
Leaf
(litt
er) f
all
Leaf
drip
Thro
ughf
all
Gross precipitationNot detectable(less than 1.8 Bq/L)
Stem flow 27-175 L/m2 yrInput to the forest floor
21 268 Bq/m2 4 weeksDeciduous broad-leaved forest;
78 – 310 Bq/m2 4 weeks
Litter fall(pre-existing data in )
Input to the forest floorJapanese cedar forest
3,125 4,250Bq/m2 4 weeks
1,238 Bq/m2 4 weeks
Surface runoff1.1 L/m2 4 weeks (Sept.)Output from forest floor
18 - 28 Bq/ m2 4 weeks
Soil loss (rainy season)1.2 - 4.2 g/m2 4 weeksOutput from forest floor36 - 84 Bq/m2 4 weeks
14
Infil
trat
ion
Surface runoffSoil loss
Throughfall756 mm/yr (Japanese Cedar, Kawauchi)Input to the forest floor
155 Bq/m2 4 weeks
Relatively higher pH in forest soil in the vicinity of the stand
InputInput
Output
Input
Input
Gro
ss
prec
ipita
tion
I tut
Forest floor: Input (104) Output (101 - 102)[Bq/m2 4 weeks]
Forest: Input - output budget of the mountain forest
Depth profiles of radioCs are related to the geomorphology,mainly exist until 5 cm depth
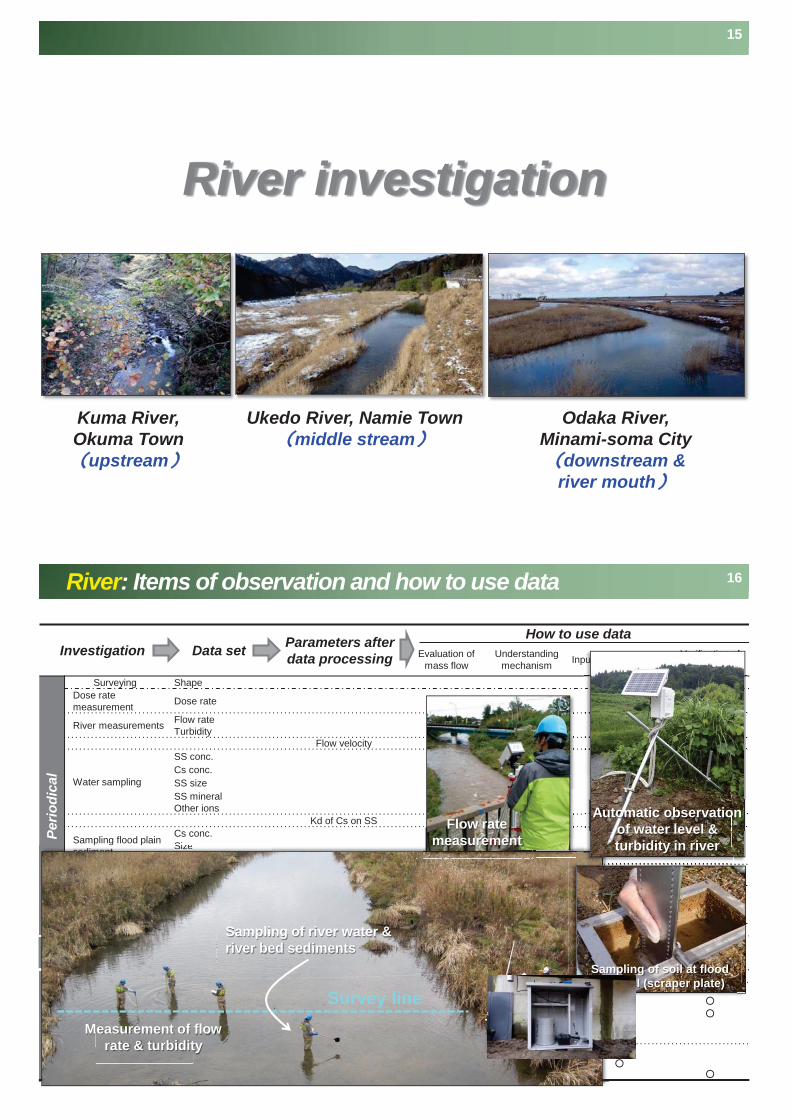
River investigation
15
Kuma River, Okuma Town
upstream
Odaka River, Minami-soma City
downstream & river mouth
Ukedo River, Namie Townmiddle stream
River: Items of observation and how to use data
Investigation Data set Parameters after data processing
How to use dataEvaluation of
mass flowUnderstanding
mechanism Input for TODAM, etc. Verification of TODAM, etc.
Perio
dica
l
Surveying ShapeDose rate measurement Dose rate
River measurements Flow rateTurbidity
Flow velocity
Water sampling
SS conc.Cs conc.SS sizeSS mineralOther ions
Kd of Cs on SS
Sampling flood plain sediment
Cs conc.SizeMineral
Kd of Cs on sediment
Sampling soil fordepth profile evaluation
Cs conc.SizeMineral
Cs deposition in soil Continuous measurement
Water levelTurbidity
Hig
h w
ater
leve
l Flow rate
Water sampling
SS conc.Cs conc.SS sizeSS mineralOther ions
Water level Flow curveFlow rate SS conc.&size
Flow rate SS Kd
16
p g psediment Size
Sampling of river water & river bed sediments
Measurement of flow rate & turbidity
Topographical surveying
Survey line
Sampling of soil at flood channel (scraper plate)
pu V ifi ti f
Automatic observation of water level & turbidity in river
Flow rate measurement
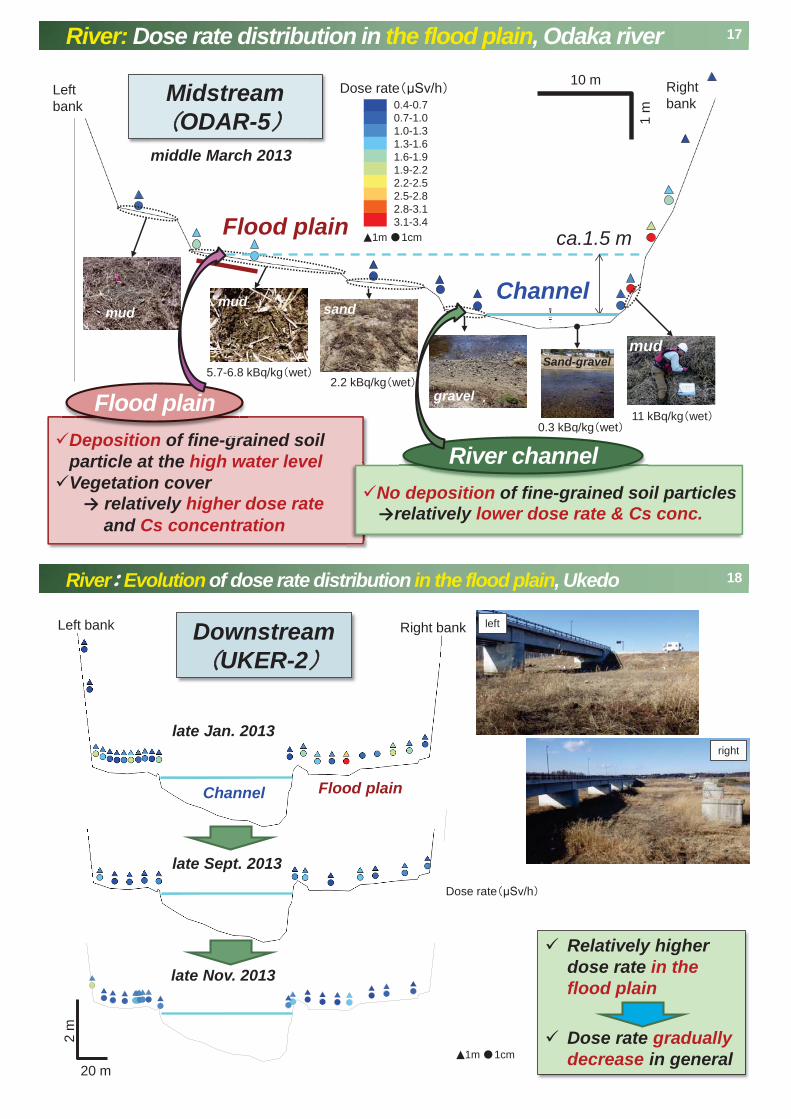
17
Dose rate /h
gravel
sandmudmud
0.4-0.70.7-1.01.0-1.31.3-1.61.6-1.91.9-2.22.2-2.52.5-2.82.8-3.13.1-3.4
mudSand-gravel
MidstreamODAR-5
Channel
Deposition of fine-grained soil particle at the high water levelVegetation cover
relatively higher dose rate and Cs concentration
No deposition of fine-grained soil particlesrelatively lower dose rate & Cs conc.
ca.1.5 m1m 1cm
5.7-6.8 kBq/kg wet2.2 kBq/kg wet
0.3 kBq/kg wet11 kBq/kg wet
River: Dose rate distribution in the flood plain, Odaka river
Flood plain
1 m
10 m
position of fine grained
q g
River channel
Right bank
Deposition of fine gr
Flood plain
middle March 2013
Left bank
18River Evolution of dose rate distribution in the flood plain, Ukedo
Relatively higher dose rate in the flood plain
Dose rate gradually decrease in general
left
Air dose rate
10.51 - 11.60 9.41 - 10.51 8.31 - 9.41 7.22 - 8.31 6.13 - 7.22 5.03 - 6.13 3.94 - 5.03 2.84 - 3.94 1.75 - 2.84 0.65 - 1.75
late Sept. 2013
DownstreamUKER-2
late Jan. 2013
Left bank Right bank
late Nov. 2013
1m 1cm
Dose rate /h
right
2 m
20 m
Channel Flood plain

19
Air do
2.9 2.7 2.5 2.3 2.1 1.9 1.7 1.5 1.3 1.1
late Nov. 2013
late Sept. 2013
River Evolution of dose rate distribution in the flood plain Ogi
2 m
2 m
Mountain riverOGIR-3
Leftbank
Rightbank
Leftbank
Rightbank
middle March 2013
1m 1cm
Dose rate /h 2.92 - 3.12 2.73 - 2.92 2.53 - 2.73 2.33 - 2.53 2.13 - 2.33 1.94 - 2.13 1.74 - 1.94 1.54 - 1.74 1.35 - 1.54 1.15 - 1.35
ChannelFlood plain
Mountain forest (edge)
Relatively higher dose rate near the bottom of mountain slope & river wall
Decontamination & typhoon event (June to Sept. 2013)
No deposition of fine-grained soil particles in the flood plain
relatively low dose rateRelatively higher dose rate in the mountain slope & near the bottom of river wallTransportation and accumulation
of fine-grained soil particles
Accumulation of Cs-137 in the Flood plain & the area of high vegetation cover rateNo accumulation near the channel
20River: Inventory of Cs-137 on the flood plain, Ukedo river
0
20
40
60
80
100
0 500
20
40
60
80
100
120
140
160
0 50 100 150
137Cs conc.(kBq/kg) 137Cs conc.(kBq/kg)
Mas
s de
pth
(kg/
m2 )
6,800kBq/m2
137Cs conc.(kBq/kg)
0
20
40
60
0 50 100 150 200
3,000kBq/m2
0
20
40
60
80
100
0 50 100 150
137Cs conc. (kBq/kg)
1,400kBq/m2
340kBq/m2
1m 1cmDose rate /h
137C (kB /k )
Midstream UKER-10
1 m
10 m channel

21
30001000 - 30000600 - 10000300 - 6000100 - 3000060 - 1000030 - 600010 - 30000 0010
Deposition densities of Cs-137
[kBq/m2](as of March 2013)
Odaka riv.
Ukedo riv. & Takase riv.
Maeda riv.
Kuma riv.
Tomioka riv. & Ogi-no-sawa riv.
without damInflow of sea water at the river mouth
with dam (Ukedo riv.)without dam (Takase riv.)relatively higher Cs inventory in the watershed area
without dam
Flowing through thedecontaminated area
without damrelatively higher Cs inventory in the watershed areainflow of sea water at the river mouth
Inventory of Cs-137 in the flood pain of downstream depends on the condition of Cs-137 accumulation in the watershed area due to the transportation of the sediments
River Inventory of Cs-137 in the flood plain (Sept. to Dec. 2013)
22
12 10 8 6 4 2 0
12 10 8 6 4 2 0
12 10 8 6 4 2 0
12 10 8 6 4 2 014
12 10 8 6 4 2 014
35 30 25 20 1015 540 0
Odaka riv. flood plain airborne survey
Ukedo riv. flood plain airborne survey
Takase riv. flood plain airborne survey
Maeda riv. flood plain airborne survey
Kuma riv. flood plain airborne survey
Tomioka riv. flood plain airborne survey
Cs-
137
(kB
q/m
2 )
Cs-
137
(kB
q/m
2 )
104
103
102
100
101
105
104
103
102
100
101
105
104
103
102
100
101
105
104
103
102
100
101
105
104
103
102
100
101
105
104
103
102
100
101
105
N=3-6 at each point
N=3-6 at each point
N=3-6 at each point
N=3-6 at each point
N=3-6 at each point
N=3-6 at each point
River Inventory of Cs-137 in the flood plain (Sept. to Dec. 2013)
Distance from river mouth (km)Distance from river mouth (km)
upstream downstream upstream downstream

23
0
100
200
300
400
500
600
0 100 200 300 400
Cs-
137
conc
. in
Ss(k
Bq/
kg)
Turbidity (mg/L)
ODARUKERTAKRMAERKUMRTOMROGIR
Concentration of Cs-137 in suspended sediment (Ss) decreased with increase in Ss concentration.
This tendency can be explained by the increase of particle size of Ssaccompanied with increase of flow rate.
Dependency of distribution coefficients on the particle size of Ss can be modeled.
River Turbidity vs Cs conc. of suspended sediment (Ss)
Odaka riv.Ukedo riv.Takase riv.Maeda riv.Kuma riv.Tomioka riv.Ogi-no-sawa riv.
Dam lake investigation
24
Ogi dam lake, Kawauchi Ogaki dam lake, Namie TownTakikawa dam lake,Tomioka Town
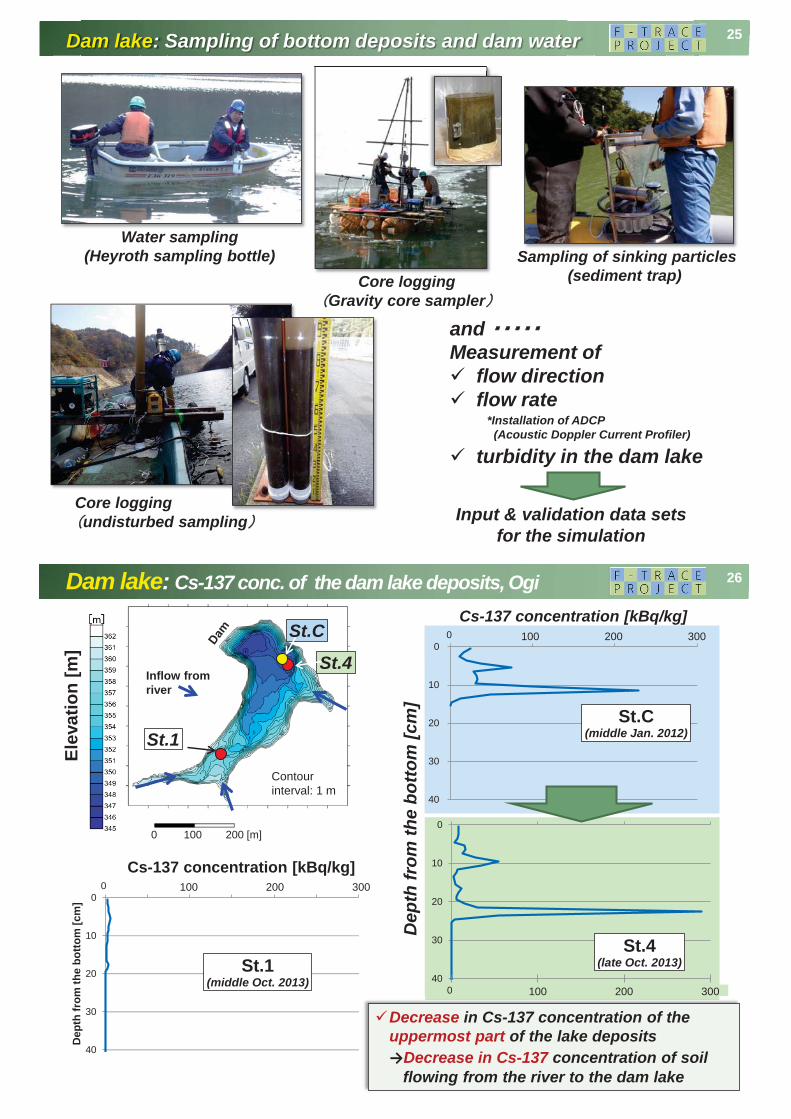
Core loggingundisturbed sampling
Water sampling(Heyroth sampling bottle)
Core loggingGravity core sampler
Dam lake: Sampling of bottom deposits and dam water
Sampling of sinking particles(sediment trap)
and Measurement of
flow directionflow rate
turbidity in the dam lake
*Installation of ADCP (Acoustic Doppler Current Profiler)
Input & validation data sets for the simulation
25
0
10
20
30
40
0 50,000 100,000 150,000 200,000 250,000 300,000
Dep
th fr
om th
e bo
ttom
[cm
]
Cs-137 concentration [kBq/kg]
St.1 (middle Oct. 2013)
0
10
20
30
400 100,000 200,000 300,000
Dep
th [c
m]
St.4 (late Oct. 2013)
0
10
20
30
40
0 100,000 200,000 300,000
Dep
th [c
m]
Cs-137 concentration [kBq/kg]
St.C(middle Jan. 2012)
St.C
St.4
St.1
Dep
th fr
om th
e bo
ttom
[cm
]
100 200 300
100 200 300
100 200 300
0 100 200 [m]
Elev
atio
n [m
]
Inflow from river
Contour interval: 1 m
Dam lake: Cs-137 conc. of the dam lake deposits, Ogi
Decrease in Cs-137 concentration of the uppermost part of the lake deposits
Decrease in Cs-137 concentration of soil flowing from the river to the dam lake
26

01020304050607080
0 200,000 400,000 600,000 800,000
Dep
th [c
m]
Cs-137 concentration [kBq/kg], dry
St.2(early Nov. 2013)
0
10
20
30
40
50
60
70
80D
epth
[cm
]
St.7(late Oct. 2013)
0
10
20
30
400 200,000 400,000 600,000 800,000
Dep
th [c
m]
St.10(late Oct. 2013)D
epth
from
the
botto
m [c
m]
St.7
St.2
St.10
<100100-150150-200200-250250-300300-320320-350350-380380-400400-450450-500
Elevation [m]
Red contour Blue contourStatus Filled Partially filled
Water level (depth) 170 m (33.5 m) 140 m (3.5 m)
N
W
N
W 200 400 600 800
200 400 600 800
Dam
Dam lake: Cs-137 conc. of the dam lake deposits, Ogaki
Inflow from river
Contour interval: 5 m
Contours above water level is based on the results of the airborne laser scanning survey by GSI
Total accumulation of Cs-137 in the lake deposits is relatively higher in the upstream and lower in the downstream
Deposition after the accident
27
Behavior of radCs in the mountain forest to dam lake 28
Throughfall2 Bq/L
Soluble Cs in the lake water< 0.01 Bq/LSurface of topsoil
30 kBq/kg
Surface of lake deposits10 kBq/kg
S
Erosion
Sedimentation
Overview of observation results in Ogi region of Kawauchi village. Cs-137 concentrations were also shown.
0
10
20
30
400 100,000 200,000 300,000
Dep
th [c
m]
Concentration [kBq/kg]
100 200 300
0 100 200 300
Cs-137
Maximum peak at several tens cm depth in the lake deposits
Deepest(St.4)
D t
Annual discharge of Cs by surface runoffapprox. 0.2 % of the total amount of Cs in the topsoil
Dep
th [c
m]
Concentration [kBq/kg]
Sample No. : SUP-6• Footslope• Slope dip: 16• Litter layer: 9 cm
Dep
th [c
m]
Cs-137
Most of Cs existed within 5 cm depth.
Stem flow30 Bq/L

29
0
20
40
60
80
0 200 400 600 800
Dept
h cm
Concentration kBq/kg Inflow (St.2)
flowfl
Surface of lake deposits100 200 kBq/kg
Estuary sediment (silt)1 5 kBq/kg
0
20
40
60
80
0 200 400 600 800
Dept
h cm
Concentration kBq/kg Outlet (St.7)
80
Maximum peak at several tens cm depth in the lake deposits.
large size fraction
Maximum peak at several cm depth in the lake deposits.
small size fractionDepth profile of Cs concentration in the
bottom sediment of Ogaki dam lake.
Behavior of radCs in the dam lake, river system and estuaryOverview of observation results in Ukedo river system of Namie Town. Cs-137 concentrations were also shown.
Soluble Cs in the lake water0.12 Bq/L
Evolution of dose rate distribution in the flood plain
Cs-137
Cs-137
Flood plain100 kBq/kg
no slightly increaseg yg y
River bed:10 kBq/kg
decrease
Quality control of data
Quality management
Database management
Assessment periodPresent year decade 30
years
Spat
ial s
cale
Min
or b
asin
5,
000
– 10
,000
m2
Mid
dle
to M
ajor
bas
in
10,0
00 m
2 to
who
le o
f Ab
ukum
a M
ts.)
Field investigation/monitoring -Data acquisition for model construction and numerical simulation (Field investigation, monitoring of surface runoff/soil loss/dose
ratio)
Forest/River(long-term) - Soil loss in forest USLE model - Transport & deposition in
river 1D model (TODAM code)
Evaluation of radiation exposure (i) Simplified evaluation system (ii) Detailed evaluation system
Evaluatio(i) i
Forest/River (short-term, detailed
modelling) - Soil loss in forest;
Watershed model - Transport &
depositional behavior in river: 2~3D model (iRIC codes)
Quality c
Qualimanage
Databamanagem
river 1D model (TODAM code)
rt-( h
- Reservoir sedimentation -2~3D model (FLESCOT, iRIC)
- River mouth & coastal area -2~3D model (FLESCOT, SWAN,
and ROMS codes)
- setting up and optimization of parameters (input from
investigation results)
Field data
- Confirmation of adequacy of analytical results (input from analytical results)
Remote sensing Vegetation:
-Mapping of forest type: tree species & height, etc.
-Extraction of vegetation anomaly Geomorphological characteristics:
-Data acquisition for digital elevation model
-Topographical analysis: orientation & gradient of slope, relief energy, valley density, shape of water shed
Land use: Classification of surface cover
Extraction of representativeness and uniqueness of the investigation area
Clarify the range and limit of applicability of analytical results
Meteorological data analysis Regional differences of rain fall, wind direction/velocity, air temperature, humidity, etc.
Identification of need for additional investigation/analysis Determination of additional investigation/simulation items and areas
GIS* USLE: Universal Soil
Loss Equation
30Application of analysis method appropriate to the spatial and assessment scales, combination with GIS analysis
30
SummaryTransport behaviors of radioCs in the forests, river systems, dam lake,
ponds and estuary were investigated mainly in Abukuma mountains and the coastal area of Fukushima Prefecture, FY2013Consequently,
Annual discharge of radioCs from the topsoil of the mountainous forest by runoff was estimated to be 0.2 % of the total amount of radioactive Cs in the topsoil.
Accumulating behavior of radioCs in the river system was clarified.
River: fine sediments with high Cs concentration in the flood plain
Dam lake: thick coarse sediments with low Cs concentration near the inflow point
thin fine sediments with high Cs concentration near the outlet
Concentration of radioCs in the river bed tended to decrease with the elapse of time.
Compared to the concentration of radioCs in the dam lake sediments, that of lake water was of extremely low.
e.g. Ogaki dam lake lake water 0.12 Bq/L bottom sediment surface 200 kBq/kg
Peak concentration was observed from several to several tens cm depth in the lake deposits.
Concentration of radioCs in the estuary sediment was lower than that of flood plain and river bed sediment.
31