progress report no - pmu.bu.edu.egpmu.bu.edu.eg/pmu/images/stdf/stdf2069_fsc_report2.pdfbrief...
TRANSCRIPT
Progress Report No. 2
1
Project ID: 2069
Project Type: Young research grant
Project Title: Magnesium battery based on solid acid membrane
Principal Investigator: Eslam Mohamed Sheha
Affiliation: Benha University
Project Start Date: 20/10/2010
Project End Date: 20/10/2012
Project Duration: 2 years
Reporting period: From: 20/1/2011
To: 20/10/2011
Date of submission: 15/10/2011
Signature of Principal Investigator:

Progress Report No. 2
2
Table of Contents
1. Overview……………………………………….………..….…3
2. Objective(s) of the reporting period…………………………3
3. Former achievements through this contract………………..4
4. Activities conducted since the project start date…………....5
4.1 Abstract………………………………………...….5
4.2 Introduction……………………………………..…6
4.3 Experimental Section…………………………..….8
4.4 Results and Discussion…………………………....11
5. Conclusion……………………………………………………..22
6. References……………………………………………………..23
7. Outcomes ………………………………..…………………....25
8. Planning for the next reporting period …………………….26
9. International Cooperation……………………………….….27
10. Conferences………………………………………………….28
11. Problems Encountered and Resolutions…………………...30
12. Implementing team(s)………………………………………..31
13. Brief monetary report……….……………………….…..…32
14. Appendices……………………………………………………34
15. Grant Chart………..…………………………………………52
16. Logical frame work (LFM)………………………………….53
Progress Report No. 2
3
1. Overview
This document is the progress report number 2 prepared for the project
number 2069. This report covers months 4-12 (January 2011- October 2011) of
the project. The purpose of this document is to provide a report of the activities
undertaken in this reporting period. A descriptive form and a spreadsheet with
experimental reporting data are provided. This report outlines future plans for the
rest of the project.
2. Objective(s) of the reporting period, as given in the submitted grant
application.
The key objectives of this reporting area were:-
Synthesize and characterize second phase of solid acid membrane,
PVA(1-x)(MgBr2)x/2(PWA)x/2.
Conduct impedance and dielectric analysis of PVA(1-
x)(MgBr2)x/2(PWA)x/2 membrane to determine the optimum
membrane.
Conduct surface characterization and diffraction analysis of PVA(1-
x)(MgBr2)x/2(PWA)x/2 membrane.
Demonstrate magnesium cells utilizing optimized membranes.
Demonstrate an article to be published in an international peer
reviewed journal.
Finalize the second progress report.

Progress Report No. 2
4
3. Former achievements through this contract:
Data reviewing and sample preparation.
Preparation phase 1 of PVA /solid acid films with uniform well-mixed
matrix.
Surface characterization and diffraction analysis.
Performance tests to show that the novel PVA /solid acid membrane has
comparable or higher ionic conductivity than others.
Finalize the first progress report.
Progress Report No. 2
5
4. Technical/scientific accomplishment/activities
4.1 Abstract
In the present work, Mg acid salt membrane using poly (vinyl alcohol)
(PVA), magnesium bromide (MgBr2) and phosphotungstic acid (PWA) in
different compositions has been prepared by the solution-casting technique.
Surface feature of films was characterized by scanning electron microscopy
(SEM) measurement. X-ray diffraction (XRD) was used to determine the
complexation of the polymer with Mg acid salt. The electro-physical
characteristics were measured and analyzed as dependent on the concentration
and nature of the Mg acid salt component and ambient temperature. The optimum
ionic conductivity value 8.63×10⁻⁶
S/cm at 303 K is obtained for PVA(0.5)
(MgBr2)0.25(PWA)0.25 membrane. The ionic transference number of mobile ions
has been estimated by a dc polarization method and the results reveal that the
conducting species are predominately ions. The dc polarization of Mg/electrolyte/
Mg cell using the polymeric electrolyte proved that Mg2+
is mobile in the present
polymeric system. The applicability of the present film to a rechargeable battery
system was examined by a prototype cell consisting of Mg and TiO2 as the
negative and the positive electrodes, respectively.

Progress Report No. 2
6
4.2 Introduction
Recently, the magnesium-based rechargeable battery system has attracted
attention due to its performance capabilities, which are expected to be close to
those of lithium-based rechargeable batteries [1,2]. Magnesium is one of the ideal
materials for the negative electrode for practical batteries because it has low
electrochemical equivalence (12.15geq−1
), considerably negative electrode
potential (−2.3V vs. SHE), low cost due to natural abundance, and greater safer
than lithium. Aurbach et al.[3] have developed a prototype high-capacity
rechargeable magnesium battery using electrolyte solutions based on Mg
organohaloaluminate salts. The same group reported that Chevrel phases Mo6T8
(T = S, Se) can insert Mg ions reversibly and can be used as practical cathode
materials for rechargeable Mg-batteries [4]. Despite these studies, however,
development of rechargeable Mg-batteries has not be accelerated mainly due to
the lower reversibility of the Mg electrode/electrolyte charge transfer and the lack
of suitable Mg2+
ion conducting non-aqueous electrolytes [5,6]. Recently, the
development of solid-state Mg2+
ion-conducting electrolytes has become one of
the important issues to realize rechargeable, solid-state Mg-batteries.
Polymer electrolytes, an excellent substitute for liquid electrolytes,
continue to attract research interest due to properties which make them suitable
for application in solid-state electrochemical devices, e.g., rechargeable batteries,
super capacitors, etc.. Such electrolytes are examined mostly for use in lithium
systems. Mg2+
ion-conducting polymer electrolytes are not widely reported except
a few systems [7,8]. Few solid-state rechargeable magnesium batteries using
polymer electrolytes have been reported in literature[9]. Polymer electrolytes have

Progress Report No. 2
7
some important advantages over liquid electrolytes in that the risk of leakage is
reduced, and electrode interfacial contact can be maintained during volumetric
changes associated with charge and discharge cycling of the battery. The ability
of polymer electrolytes to act as both the separator and the electrolyte leads to
easy fabrication and allows the possibility of miniaturized devices.
PVA has high glass transition temperature (Tg) (358 K) and good
mechanical properties. And despite being a tactic, PVA can crystallize, especially
if highly hydrolyzed, since the hydroxyl group can be accommodated in place of a
hydrogen atom in the crystal lattice of heteropolyacids shows remarkable [9]
chemical and electrochemical stability. So with these two components, we can
prepare Mg-conducting SPEs containing ion conduction mechanism decoupled
from the polymer segmental motion.
Heteropolyacids (HPAs) are one of the most attractive inorganic modifiers
because these inorganic materials in crystalline form have been demonstrated to
be highly conductive and structural stable. Phosphotungstic acid is one of the
strongest Keggin-type heteropolyacids and is considered to have strong Bronsted
acidity to be used as proton donor [10], meanwhile, bromine salts compresses the
diffusive electric double layers and hence reduces the repulsion between ions.
Owing to these merits, the strategy in the development of Mg ion
conducting polymer electrolytes for rechargeable magnesium batteries was
determined by the intention to study an intermediate phase between PWA and
MgBr2 (Mg acid salt). In this work, the effect of Mg acid salt in structural,
morphological, and electrical properties in PVA have been evaluated. To achieve
the stated objectives, various common analyzes such as x-ray diffraction (XRD),

Progress Report No. 2
8
scanning electron microscopy, dc polarization and AC impedance spectroscopy
are used. In order to determine the capability of the highest conducting sample as
an electrolyte, it was used in the fabrication of Mg/electrolyte/TiO2 cells. TiO2
cathode material for reversible accommodation of Mg ions were investigated.
using optical microscope and x-ray diffraction.
4.3 Experimental Section
Preparation of electrolyte materials
Poly (vinyl alcohol), PVA (degree of hydrolization ≥98%, Mw=72,000),
magnesium bromide MgBr2 and phosphotungstic acid (PWA) were received from
Sigma. The complex electrolytes were prepared by mixing of 0.4%(w/v)
hydroquinone[11], 1%(w/v) ethylene carbonate, PVA, MgBr2 and PWA at several
stoichiometric ratios in distilled water to get PVA(1-x)(MgBr2)x/2(PWA)x/2 complex
electrolytes, where x is 0.0, 0.1, 0.2, 0.3, 0.4 and 0.5 gm. Solution with variable
ratio was stirred vigorously and casted in Petri dish following solution cast
technique at room temperature. Six different polymer electrolytes were produced.
Compositional and structural characterization
The crystalline structures of all the PVA(1-x)(MgBr2)x/2(PWA)x/2
membranes were examined using a Philips X’Pert X-ray diffractometer (XRD)
with a Cu Kα radiation of wavelength λ = 1.54056 Å for 2 angles between 4 and
60o. The cross-sectional view and top surface morphologies and microstructures
of all the complex electrolytes were examined with a S-2600H scanning electron
microscope (Hitachi Co. Ltd.).

Progress Report No. 2
9
Conductivity measurement
Conductivity measurements were made for PVA(1-x)(MgBr2)x/2(PWA)x/2
composite polymer membrane by an ac impedance method. Samples of diameter
0.5 cm were sandwiched between the two similar brass electrodes of a spring-
loaded sample holder. The whole assembly was placed in a furnace monitored by
a temperature controller. The rate of heating was adjusted to be 2 K/min.
Impedance measurements were performed on PM 6304 programmable automatic
RCL (Philips) meter in the frequency ranging from 100 Hz to 100 kHz at different
temperatures.
Total ionic transport number tion was evaluated by the polarization
technique. In this technique, the cell Cu/electrolyte/Cu was polarized by applying
a step potential of 1.5 V and the resulting potentiostatic current was monitored as
a function of time. The copper electrode act as a blocking electrodes for the above
cell. The tion was evaluated using the formula[12]:
i
fi
ionI
IIt
1
Where Ii is the initial current and If is the final residual current.
Magnesium transference number (tMg+2) was measured by the steady-state
technique which involved a combination of ac and dc measurements. The ac
complex impedance response of the Mg/electrolyte/Mg cell was first measured to
determine the cell resistances. It was followed by the dc polarization run, in which
a small voltage pulse (ΔV=0.33V) was applied to the cell until the polarization
current reached the steady-state Is. Finally, the ac impedance response of the cell

Progress Report No. 2
10
was measured a gain to determine the cell resistance after dc polarization. Then
tMg+2 could be calculated with the following equation[12]:
)(
)(2
sso
oos
mgIRVI
IRVIt
2
Where Io and Is are the initial and final steady-state currents and R0 and Rs are the
cell resistances before and after the polarization, respectively.
Fabrication and characterization of batteries
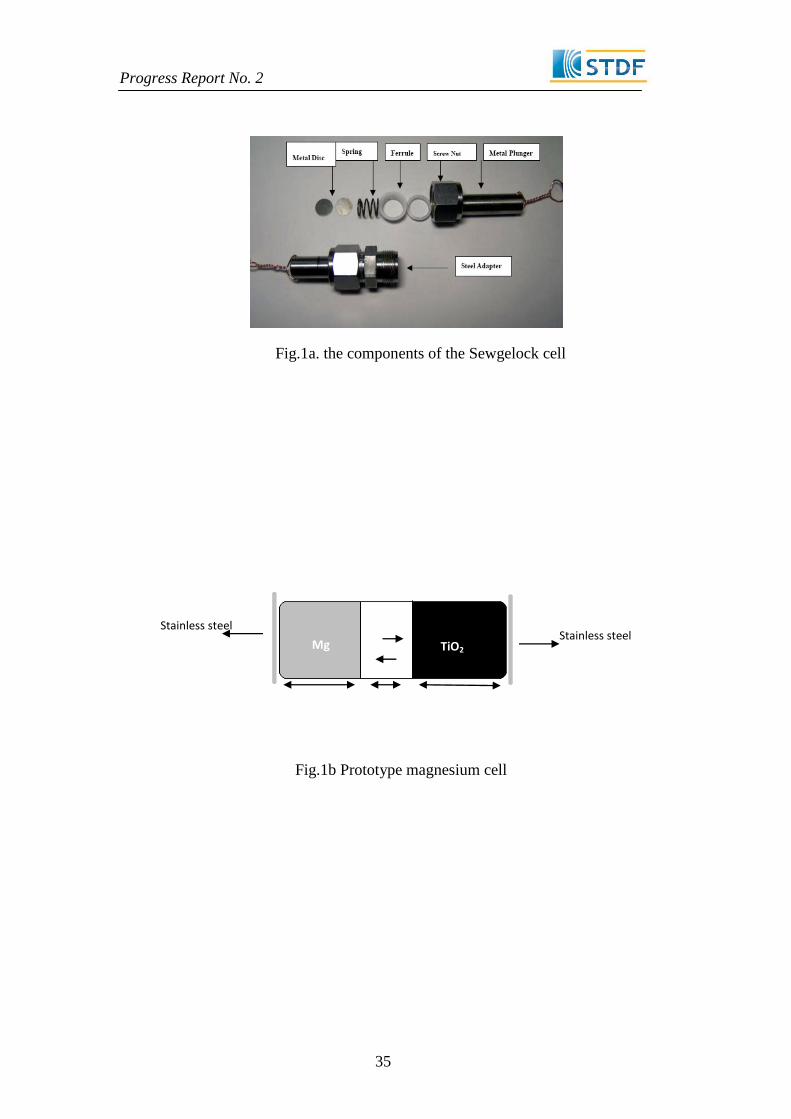
Batteries test were performed by using two-electrode Swagelok type cells,
Fig. 1.a. The test cell assembly of Mg/Electrolyte/TiO2.xwt.%electrolyte is
schematically shown in Fig. 1b. The highest conducting sample in the PVA(1-
x)(MgBr2)x/2(PWA)x/2 system was used as an electrolyte for battery fabrication. To
make an anode pellet for the battery, 0.2 gm magnesium ribbon were pressed at 3
tons.cm-2
for 15 minutes. To make the cathode pellet composed of 70 wt.% TiO2,
30 wt.% graphite powder (QualiKems) and electrolyte (0, 10, 20, 30, 40 wt.%)
were grounded and pressed at 3 tons.cm-2
for 5 minutes. The diameter of the
pellets equals 13mm.
The discharge/charge cycling was performed within a voltage range of
0.01-4.0 V at ambient temperature. Several cells were assembled for the purpose
of different experiments to ensure reproducibility. Current drains ranging from 0
to 0.2 mA were used to plot the current–voltage (I–V) and current density–power
density (J–P) curves. The average of each battery’s voltage was monitored for

Progress Report No. 2
11
each current drain after 10 sec of operation. The internal resistance of the cell was
then calculated by using equation:
IrEV
where V is the voltage, E is the electromotive force, I is the current and r is the
internal resistance.
The room temperature X-ray diffraction patterns for battery cathodes after
discharge were recorded on Bruker X-ray diffraction system with Cu tube anode
of wave length K1= 1.5460 Å and K2= 1.54439 Å. The start angle (2 ) was 4o
and the end angle was 60o. The patterns subsequently analyzed using the JCPDS
file data. The surface morphology of the samples were characterized by optical
microscope.
3.3 Results and discussion
Scanning electron microscopy
Depending on the type and amount of Mg acid salt present in the polymer
matrix, the morphology of the polymer electrolyte will vary and greatly influence
its properties. Morphological examination of this study is carried out to study the
phase morphology changes of the pure polymer and the resulting Mg acid salt
polymer-electrolyte films, after the addition of Mg acid salt. Scanning electron
micrographs of pure PVA and 0.2 acid salt have been presented in Fig.2. Very
distinguishable changes can be observed from pure PVA and high concentrations
of Mg acid salt. Pure PVA shows smooth surface. The morphology changes, as
soon as 20 wt % of Mg acid salt is incorporated into the polymer. The
morphology changes drastically to become significantly more layered and even
Progress Report No. 2
12
greater pore size. An open pore structure of the polymer electrolyte matrix is
essential for ionic conductivity across the thin film. This type of open porous
structure provides enough channels for the migration of ions, accounting for better
ionic conductivity[13].
X-ray diffraction
The X-ray diffraction patterns of pure PVA and complexed with Mg acid
salt are shown in Fig. 3. From the figure, it is clear that the pure PVA shows a
remarkable peak for an orthorhombic lattice centered at 200 indicating its semi-
crystalline nature. In addition, this peak becomes less intense as the Mg acid salt
content is increased and increase of full-width half maximum of this peak has also
been observed. This increase in broadness of the peak reveals the amorphous
nature of the complex system. These results can be interpreted in terms of the
Hodge et al. [14] criterion, which has established a correlation between the height
of the peak and the degree of crystallinity. This could be due to the disruption of
the PVA crystalline structure by Mg acid salt. No peaks pertaining Mg acid salt
appeared in the complexes, which indicate the complete dissolution of Mg acid
salt in the polymer matrices. No sharp peaks were observed for higher contents of
Mg acid salt in the polymer, suggesting the dominant presence of amorphous
phase. This amorphous nature results in greater ionic diffusivity with high-ionic
conductivity, which can be obtained in amorphous polymers that have flexible
backbone. Similar type of Mg acid salt complexed polymer electrolytes films
were observed in the literature [15,16].

Progress Report No. 2
13
Ionic conductivity
Impedance spectroscopy is used to establish the conduction mechanism,
observing the participation of the polymeric chain, the mobility and carrier-
generation processes[14]. Fig.4 shows Cole Cole plots for PVA(1-x)(MgBr2)x/2(
PWA)x/2 films. The typical Nyquist plot of the samples shows a semicircular arc
which is related to conduction in the bulk of the complex. The diameter of the
semicircle varies with the concentration of Mg acid salt ( MgBr2)(x/2)(PWA)(x/2),
where Mg acid salt at x=0.5 yield the smallest diameter. The intercept of this
semicircle with the real axis (z') gives estimate of the bulk resistance to be used
subsequently for evaluation of bulk conductivity. The bulk conductivity is
calculated using the relation
A
L
Rb
b 1
3
Where A is the known area of the electrolyte film and L is the thickness. In order
to explain the observed features, the measured impedance can be modeled by the
equivalent circuit as shown in the inset of Fig. 4. The data are fitted well with a
single semicircle that gives a simple equivalent circuit consisting of the parallel
resistance (bulk resistance, Rb) and the capacitance (bulk capacitance, Cb)
network in series. Fig.5 shows the dependence of bulk conductivity on
concentration for the polymer electrolyte at room temperature. The conductivity
of based (x=0) PVA is low, about 8.8510-10
S.cm-1
. It is observed that the
conductivity increases with the increase in concentration of Mg acid salt and
reaches 61063.8 S.cm−1
for x=0.5 gm. This may be attributed to the increase in
the number of mobile charge carriers and also to the increase in the amorphous

Progress Report No. 2
14
nature of the polymer electrolyte, which reduces the energy barrier thereby
facilitating the fast ion transport, as the relation:
e n 4
Where n is the total ion concentration, e is the elementary charge and µ is the
mobility.
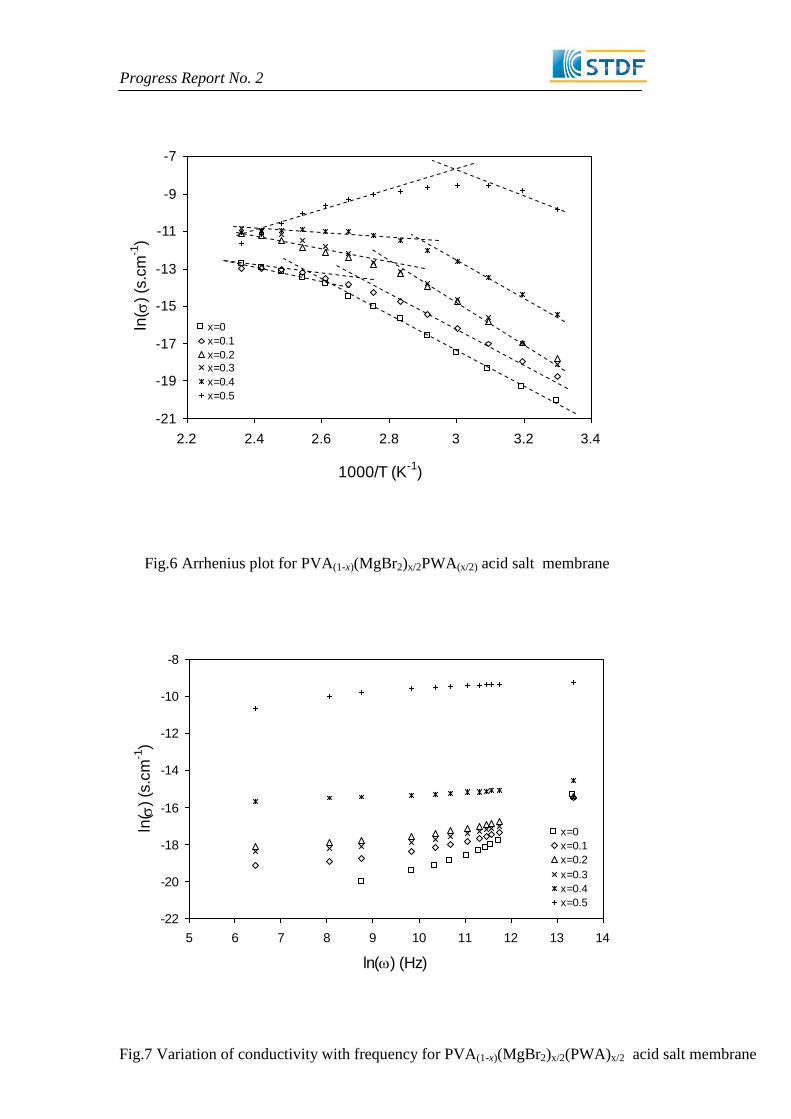
Fig.6 presents the temperature dependence of ionic conductivities for
PVA(1-x) (MgBr2)x/2(PWA)x/2 films at a frequency of 1 kHz. The plot shows that as
temperature increases, the conductivity increases. This indicates that the plots
obey Arrhenius rule;
)/exp( KTEao 5
Where σo is the pre-exponential factor, Ea is activation energy, K is Boltzmann
constant and T is absolute temperature. There is no sudden change in the value of
conductivity with temperature it may be inferred that these complexes do not
undergo any phase transitions within the temperature rang investigated. Druger et
al [16], have attributed the change in conductivity with temperature in solid
polymer electrolyte to segmental (i.e., polymer chain) motion, which results in an
increase in the free volume of the system. Thus, the segmental motion either
permits the ions to hop from one site to another or provides a pathway for ions to
move. In other words, the segmental movement of the polymer facilitated the
translational ionic motion. From this, it is clear that the ionic motion is due to
translational motion/ hopping facilitated by the dynamic segmental motion of the
polymer. As the amorphous region increases, however, the polymer chain
acquires faster internal modes in which bond rotation produce segmental motion
to favor inter-and intra-chain ion hopping, and thus the degree of conductivity

Progress Report No. 2
15
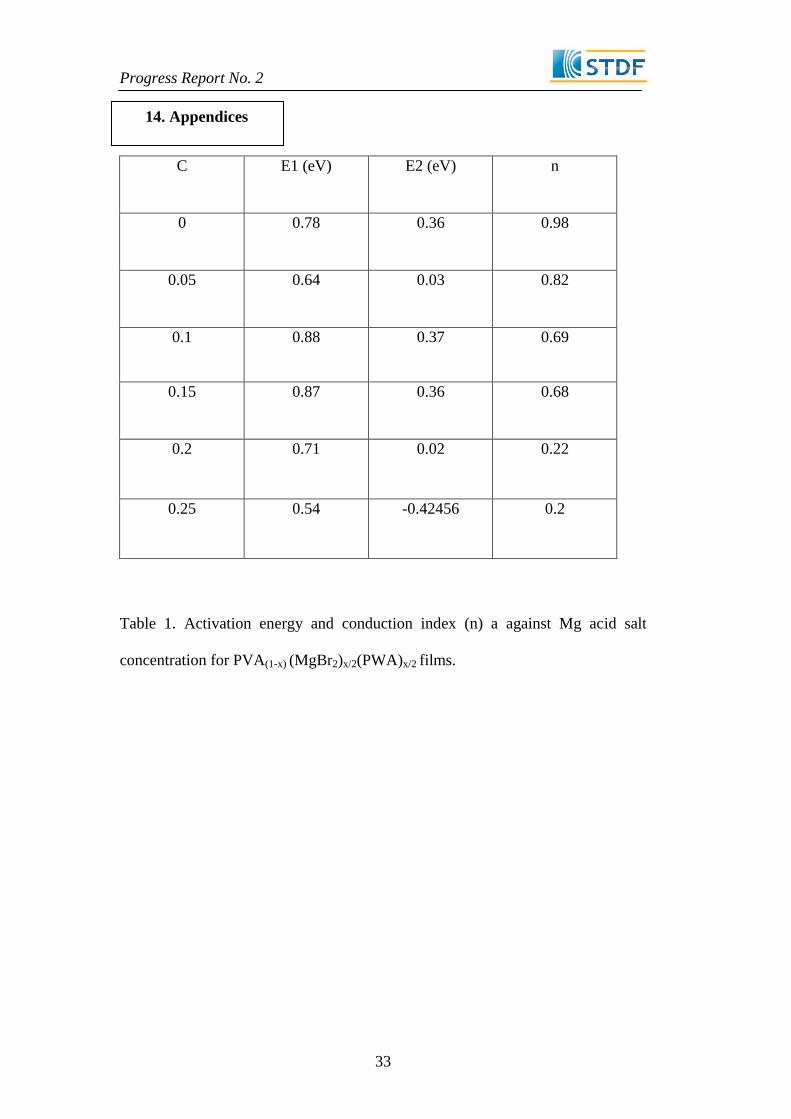
becomes high. The activation energy, Ea (combination of the energy of defect
formation and the energy of migration) is calculated for all prepared polymer
electrolytes by linear fit of the Arrhenius plot. The calculated activation energy
values have been listed in table 1. Table 1 listed the activation energy values in
region 1 range from (0.884 to 0.5453), and Ea in region 2 range from (0.374255 to
-0.42456). The negative value of Ea can be attributed to, the excess amount of mg
acid salt beyond x=0.2 is found to result in mere loss of ion mobility at relatively
high temperature, which would inhibit the fast ionic transport, as is evident from
the present conductivity data
AC conductivity studies were carried out on all samples, synthesized with
different concentrations of Mg acid salt over a frequency range of 100 Hz to 100
kHz. It is observed that ac conductivity spectra, Fig. 7, show two distinct regions,
within the measured frequency, (i) plateau and (ii) dispersion region. The plateau
region corresponds to frequency independent conductivity dc and is obtained by
extrapolating the conductivity value to the zero frequency. AC conductivity
dispersion with frequency were fitted using Jonscher’s [17] power law (JPL) by
non-linear least square fit analysis of:
n
dcac A 6
where dc is the zero frequency limit of ac, A is a constant and n is the
power law exponent 0 < n<1. The value of n for different Mg acid salt
concentration is listed in table 1. The n value obtained from JPL fit for polymer
electrolytes synthesized with various concentrations of Mg acid salt is from 0.2 to
1.

Progress Report No. 2
16
Generally the low values of power law exponents (n) at high Mg acid salt
concentration , x= 0.4 and 0.5, can be attributed to the ideal long range pathway
and diffusion limited hopping (tortuous pathway) respectively. The frequency
response of the conductivity is interpreted in terms of jump relaxation model [18],
where the conduction is due to translation and localized hopping. In jump
relaxation, the charge carrier (ion) hops in atomic scales in both space and time.
When an ion at time t=0 hops from site A to a vacant neighboring site B, there are
competing relaxation process to consider. First the ion may go back to site A,
which constitutes the forward– backward hop. It is possible that before the ion
decides to hop back, the surroundings of the new site relax in such a way that the
ion finds the site as its new quasi-permanent address. The overall behavior of ac
conductivity follows a universal dynamic process, which has been widely
observed in disordered materials like ion conducting polymers and glasses.
Dielectric properties
The study of dielectric relaxation in solid polymer electrolytes is a
powerful approach for obtaining information about the characteristics of ionic and
molecular interactions. The dielectric parameters associated with relaxation
processes are of particular significance in ion-conducting polymers where the
dielectric constant plays a fundamental role which shows the ability of a polymer
material to dissolve salts. The frequency-dependent conductivity and dielectric
relaxation are both sensitive to the motion of charged species and dipoles of
polymer electrolytes. The complex dielectric constant of a system is defined by;
'''* i 7
Progress Report No. 2
17
Where ' is the real part of the dielectric constant of the material and '' is
the imaginary part. Also, these real and imaginary parts of the dielectric constants
are expressed as;
A
Cl
o ' 8
and tan''' 9
Where ' is the permittivity in free space, C is parallel capacitance and L and A
are the thickness and known area of the sample [20].
The frequency dependent dielectric constant and loss (' and '') at room
temperature for pure and Mg acid salt added PVA are shown in Figs. 8a and b. It
is evident from the figure that the values of ' and '' are significantly high in the
low frequency region. This indicates that the electrode polarization and space
charge effects are prevalent confirming the non-Debye type behavior. At higher
frequencies, periodic reversal of the field takes place so rapidly that the charge
carriers will hardly be able to orient themselves in the field direction resulting in
the observed decrease of dielectric constant and dielectric loss.
The temperature dependent dielectric constant and loss for pure and Mg
acid salt added PVA are shown in Figs.9a and b. There is no significant variation
in dielectric constant with frequency for pure PVA. Where as it increase with
increase in temperature for Mg acid salt added samples. The increase in dielectric
constant and loss at higher temperatures is ascribed to higher charge carrier
density. As the temperature increases, the degree of Mg acid salt dissociation and
re-dissociation of ion aggregates increases which result in increase in number of
free ions or charge carrier density[20].
Progress Report No. 2
18
Transference number measurement
The ionic transference number of the mobile species in the polymer
electrolyte has been calculated by Wagner's dc polarization method [21], as
described in the "Experimental. This dc polarization measurement has been used
to analyze the mobile species in the electrolyte as either ions or electron. The
polarization current has been monitored as a function of time on the application of
fixed dc potential (1.5 V) across the cell, Cu/electrolyte/Cu. The total ionic
transference number tion, is evaluated using Eq. 1, has been found to be 0.972594
for PVA(0.5)(MgBr2)0.25(PWA)0.25 polymer electrolyte. This shows that the charge
transport in this polymer electrolyte is mainly due to ions.
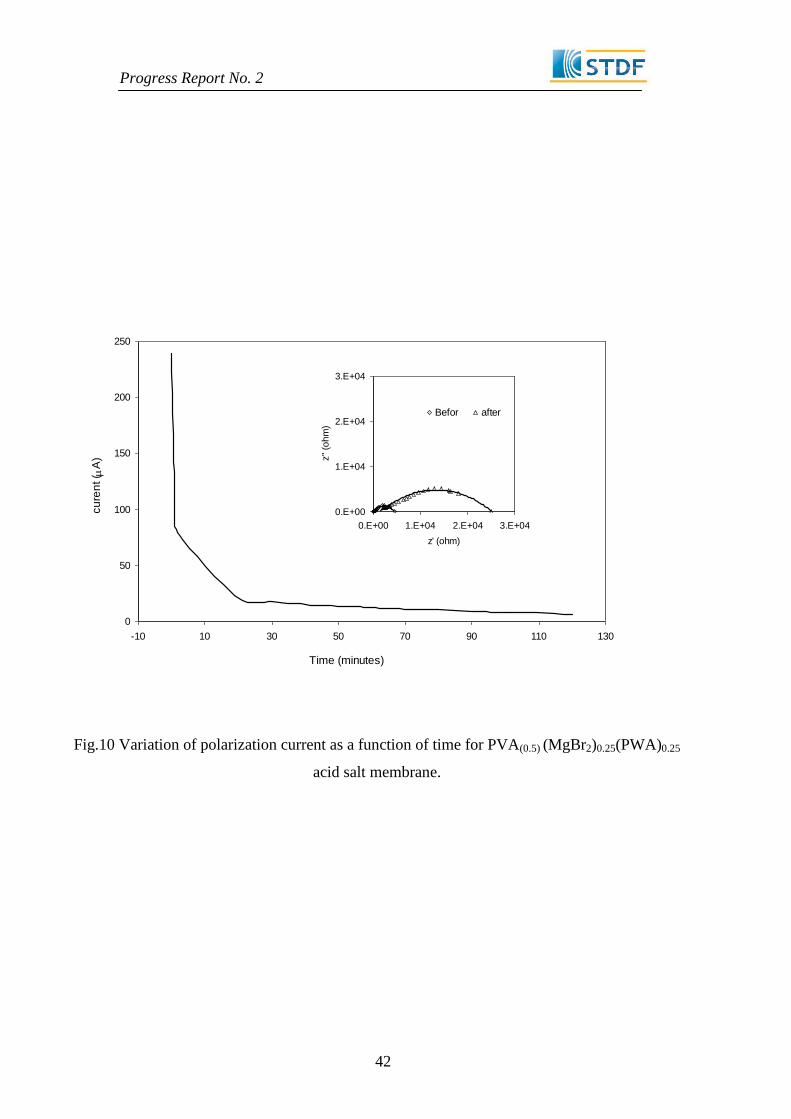
A typical result of dc and ac measurement for determining tMg+2 for
PVA(0.5) (MgBr2)0.25(PWA)0.25 polymer electrolyte is shown in Fig. 10. The dc
polarization current needs about 3 h to reach the steady state. After dc
polarization, R0 increases from 5 x 10³ to 2.5 x 10
4 Ω. The value of tmg2+, is
evaluated using Eq. 2, has been found to be 0.18 at room temperature.
Battery characteristics
Optical micrographs of different compositions of TiO2.x wt. % electrolyte
are shown in Fig. 11(a-e). Irregular shapes of different size are observed in
samples with zero concentration of the electrolyte in the TiO2. Homogenous
dispersion can be observed in samples with high concentration of electrolyte in
the TiO2. No tendency to form agglomerates in the present electrolyte at high
loading level.
b b

Progress Report No. 2
19
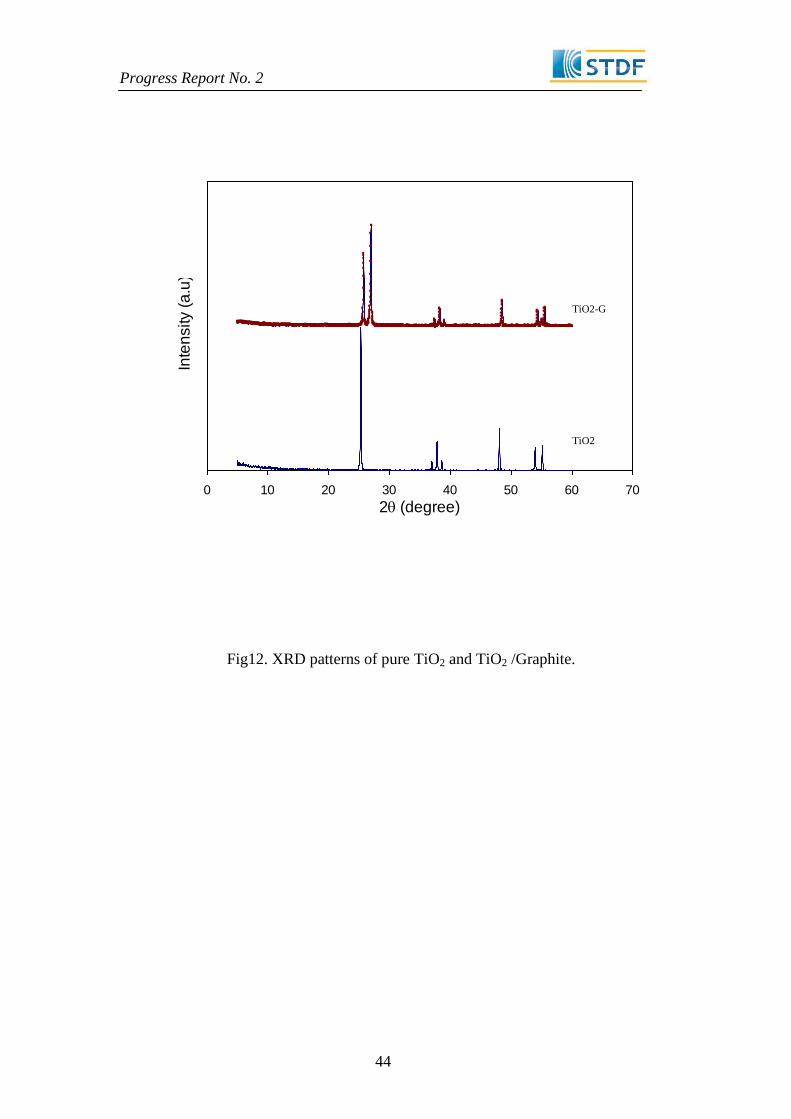
Fig.12. presents XRD patterns of pure TiO2 cathodes and TiO2/graphite,
respectively. As clearly seen, all the diffraction peaks can be indexed to a pure
TiO2 structure phase in accordance with reference[22], except for the strong
peaks at 2Ө=270, corresponding to the diffraction peak of graphite[15].
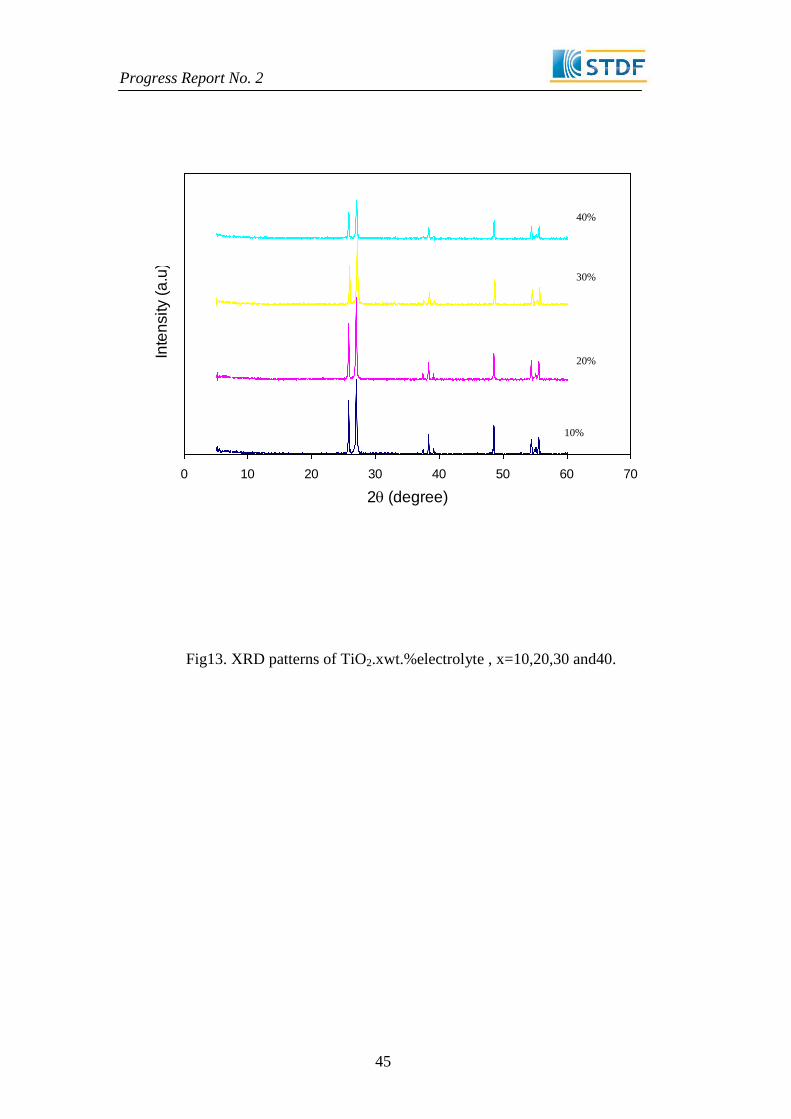
Fig.13. presents XRD patterns of TiO2.x wt. % electrolyte cathodes. As
clearly seen, the sharp peaks present in the pattern indicate the polycrystalline
nature of the cathodes. The curves show the presence of a crystalline phase with
the characteristic diffraction peaks located at 2θ=25°, 37° and 48°. Such
crystalline nature originates from TiO2 which agrees with reference[22]. Fig. 13
clearly indicates that the addition of electrolyte reduces the intensity of main
peaks followed by broadening the peak area, which is an indication of reduction
in the degree of crystallinity. This reduction in the crystallinity is responsible for
the enhancement in cathode ionic conductivity.
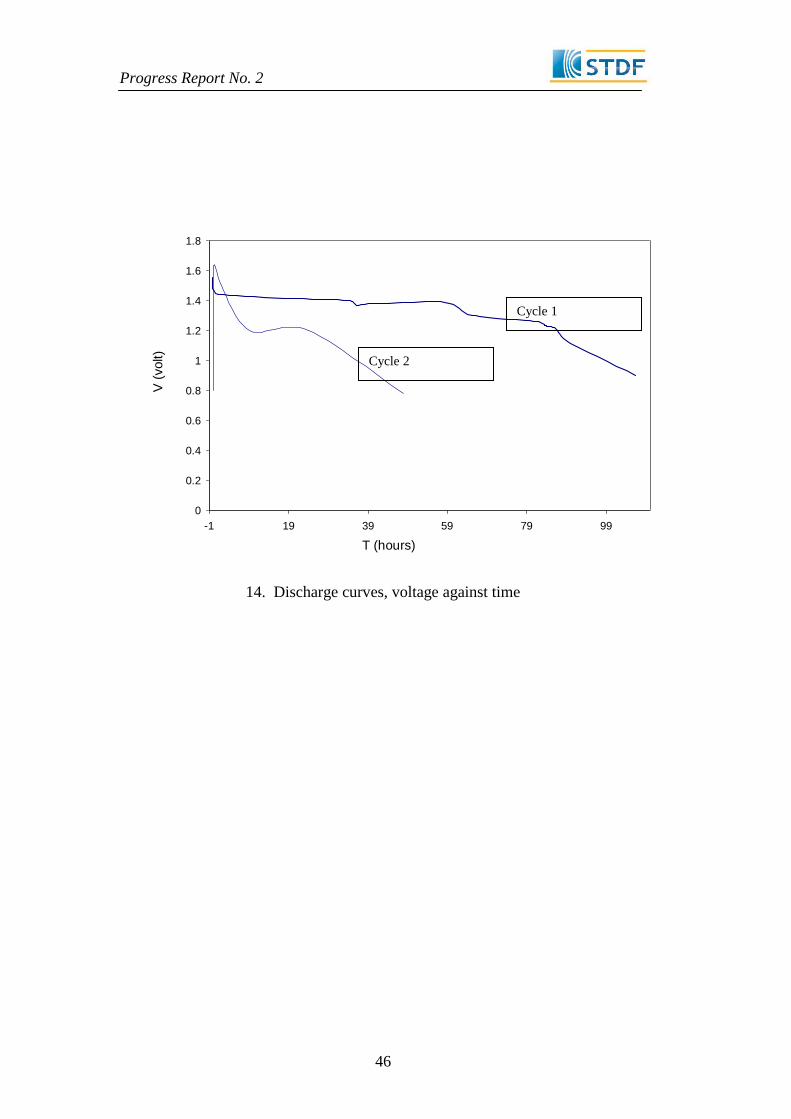
Solid state electrochemical cells were fabricated in the configuration
Mg(anode)/electrolyte/(TiO2)(cathode), and their discharge characteristics at
ambient temperature for a constant load of 100KΩ are shown in Fig. 14. The
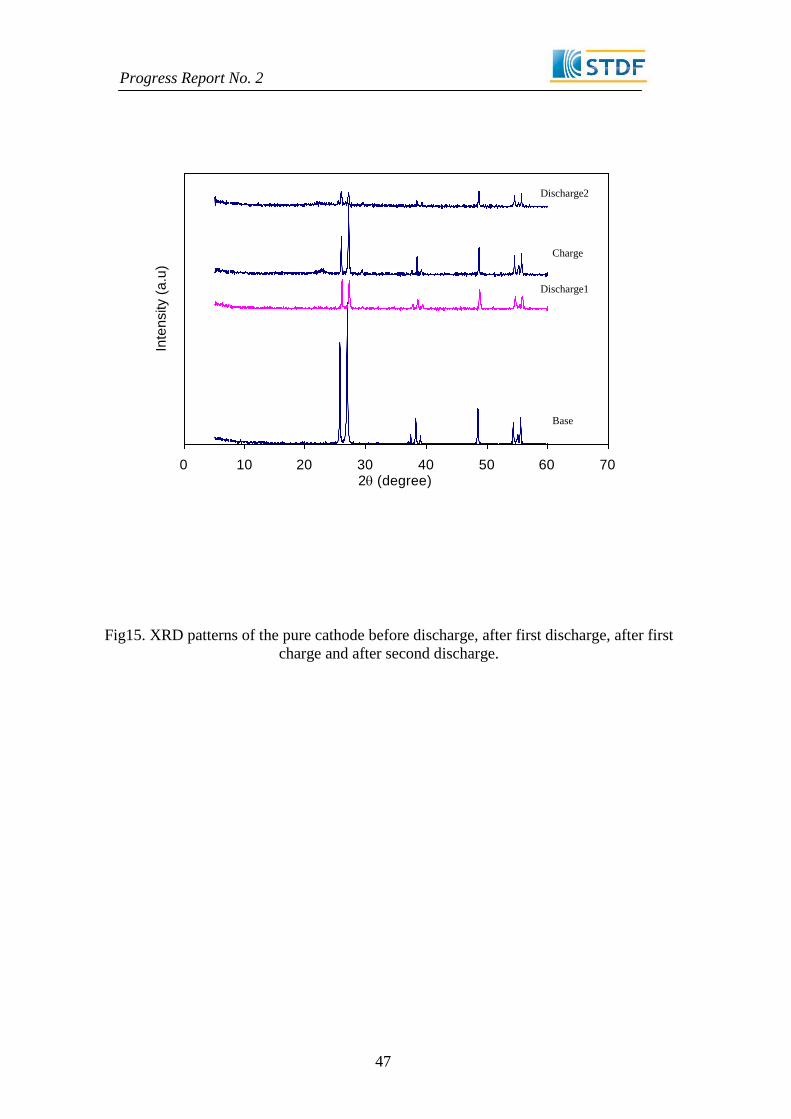
typical XRD patterns of pure TiO2 before discharge, after discharge, after charge
and after discharge to the second cycle are shown in Fig. 15. On comparison of
XRD patterns of TiO2 cathodes revealed that, the TiO2 before and after discharge
are in the same phase, except that the peaks are gradually broadened and intensity
decreases after discharge and it return to increase after charge. This can be
attributed to charge in lattice strain due to intercalation and de-intercalation of
magnesium. For magnesium intercalation/deintercalation reaction take place in
the cell, the overall reaction can be written as follow:

Progress Report No. 2
20
22 TiOMgxexMgTiO x
The average open circuit voltage during 24 h storage time of the five cells
with configuration Mg/electrolyte/TiO2.xwt % electrolyte is shown in Fig.16.
Low self discharge can be observed. Fig. 17 shows the discharge characteristic of
the Mg/electrolyte/ TiO2.x wt. % electrolyte battery under R=100 kΩ load
resistance, the value of the discharge capacity С was evaluated from the equation:
t
dttVR
C0
)(1
Where C is the discharge capacity, V (t) is the discharge voltage, R is the
applied resistance (100KΩ), and t is discharge time. We integrated the area under
curves of Fig. 17 to estimate the discharge capacities. These values are listed in
table 2. As we see, the cell capacity of the cathode contain 30 wt.% electrolyte ≈
2 mAh is the highest value. This can be attributed to the reduction in the
crystallinity of this medium that have been reported by optical micrographs and x-
ray results, which play an important role in enhancing magnesium
intercalation/deintercalation reaction. Fig. 18 shows the I–V and J–P
characteristics for the Mg/electrolyte/ TiO2.x wt. % electrolyte battery at room
temperature. The I–V curve had a simple linear form which indicates that the
polarization on the electrode was primarily dominated by ohmic contributions.
The internal resistance of the battery was obtained from the gradient of the I–V
curve. The internal resistance, short current and other cell parameters are listed in
table 2. From this table, the internal resistance decreases due to increases the
concentration of the electrolyte in the cathode. This can be explained in terms of

Progress Report No. 2
21
change in the ionic conductivity of the cathode due to adding electrolyte as
reported by x-ray results.
5. Conclusion
We have successfully optimized the structure of PVA as the electrolyte for
rechargeable Mg batteries as follow:
1. Ionic conductivity of ≈10-6
S cm-1
was obtained for optimum electrolyte at
room temperature.
2. The polarization experiments of Mg/optimum electrolyte/Mg cells proved
that Mg2+
is mobile in the present polymeric system.
3. A solid-state Mg/electrolyte/TiO2 cell has been assembled and its physical
behavior has studied. The internal resistance of the fabricated cell was
deduced to be ≈600 Ω.
In view of the above advantages, PVA/Mg acid salt polymer electrolyte is a
potential electrolyte material for magnesium batteries.
Progress Report No. 2
22
6. References
1. G.P. Pandey, R.C. Agrawal , S.A. Hashmia, J. Power Sources, 190 (2009)
563.
2. D. Aurbach, G.S. Suresh, E. Levi, A. Mitelman, O. Mizrahi, O. Chusid,
M. Brunelli, Adv. Mater. 19 (2007) 4260.
3. D. Aurbach, Z. Lu, A. Schechter, Y. Gofer, H. Gizbar, R. Turgeman, Y.
Cohen, M. Moshkovich, E. Levi, Nature 407 (2000) 724
4. E. Lancry, E. Levi, Y. Gofer, M. Levi, G. Salitra, D. Aurbach, Chem.
Mater. 16 (2004)2832.
5. E. Levi, M.D. Levi, O. Chusid, D. Aurbach, J. Electroceram., in press.
6. Z. Lu, A. Schechter, M. Moshlovich, D. Aurbach, J. Electroanal. Chem.
466 (1999) 203.
7. N. Yoshimoto, Y. Tomonaga, M. Ishikawa,M.Morita, Electrochim. Acta
46 (2001)1195.
8. G. G. Kumar, N. Munichandraiah, J. Electroanal. Chem. 495 (2000) 42.
9. Soo-Kyeong Jeong, Yun-Kyung Jo, Nam-Ju JoElectrochimica Acta 52
(2006) 1549.
10. D. R. Vernon, F. Meng, S.F. Dec, D.L. Williamson, J. A. Turner, A. M.
Herring, J. Power Sources 139 (2005) 141.
11. S. Badr, E. Sheha, Polymer International, 60(2011)3058.
12. Yogesh Kumar, S.A. Hashmi, G.P. Pandey, Electrochimica Acta, 56
(2011) 3864.
13. S.Ramesh, Soon-Chien Lu, J.Applied Polymer Science 117(2010)2050.

Progress Report No. 2
23
14. Hodge RM, Edward GH, Simon GP, Polymer, 37(1996)1371.
15. E. Sheha, Solid State Ionics 180 (2009) 1575.
16. E. Sheha, M.K. El-Mansy, J. Power Sources 185 (2008) 1509.
17. S.D. Druger, A. Nitzam, M.A. Ratner, J. Chem. Phys. 79 (1983) 3133.
18. A.K. Jonscher, Nature 267 (1977) 673.
19. E. Sheha, Journal of Non-Crystalline Solids, 356 (2010)2282.
20. C. Justin Raj, K.B.R. Varma, Electrochimica Acta 56 (2010)649.
21. Xiao-Liang Wang, Li-Zhen Fan, Zhi-Han Xu, Yuan-Hua Lin, Ce-Wen
Nan, Solid State Ionics 179 (2008) 1310.
22. JipengWang, Ying Bai, MuyingWu, Jiang Yin,W.F. Zhang, Journal of
Power Sources 191 (2009) 614–618

Progress Report No. 2
24
7. Outcomes
Overall, we have one peer reviewed journal article currently published and
another in preparation.
The researchers developed an innovative and effective protocol to prepare
Mg ion conductor polymer electrolyte with high yield. Further
optimization is in current.
The researchers carried out a comprehensive list of characterizations on
the Mg ion conductor polymer electrolyte as seen in the above sections of
this report.
The researchers fabricated prototype magnesium battery. Further
optimization is in current.
The researchers recommend future work that will focus on doped with
multifunctional materials (non-ionic plastic polymer) and therefore higher
conductivity.

Progress Report No. 2
25
8. Planning for the next reporting period:
Study the impact of multifunctional materials like succinonitrile on
thermal stability, structure, groups, phase transitions, free volumes and
morphology of PVA(1-x) (MgBr2)x/2(PWA)x/2 membrane.
Coating the magnesium metal with optimum electrolyte using spin coating
technique.
Conduct synthesis of cathodes of non-magnesium compounds (e.g. MnO2,
CoO2, MoS2, FeS2 ).
Fabricate magnesium cells utilizing optimized membranes (manipulated
with succinonitrile) and optimized electrode formulations.
Conduct charge/discharge spectroscopic analysis of nominated magnesium
cells.
Conduct EDAX and X-ray spectroscopic analysis of electrodes before and
after discharge. Establish overall reaction.

Progress Report No. 2
26
9. The PI evaluation of the progress of the project:
Project started at 20/10/2010 for two years. One year until now. Through
this we made a comprehensive survey of work in digital libraries in order to
determine the starting point. This is followed by preparation of a series of
electrolyte in order to allow magnesium ion to pass through. Topography of the
samples were studied and the crystal structure and analysis of electrical
impedance and dielectric parameters. This is followed by fabrication magnesium/
electrolyte /titanium cells. The preliminary results showed that the way in which
walking is the way of a promising, with some improvement in the electrical
conductivity of the electrolytes. On this basis, the team members will study
influence of succinonitril material to improve the electrical properties of
electrolytes in order to reduce the internal resistance of the battery and we will
study the batteries with different cathodes, such as CoO2, CuSO4, MoS2,……….
In the end, the principal investigator see that the results obtained, as well as the
expected results in the near future are very promising and will come back by
benefit to our community.
Progress Report No. 2
27
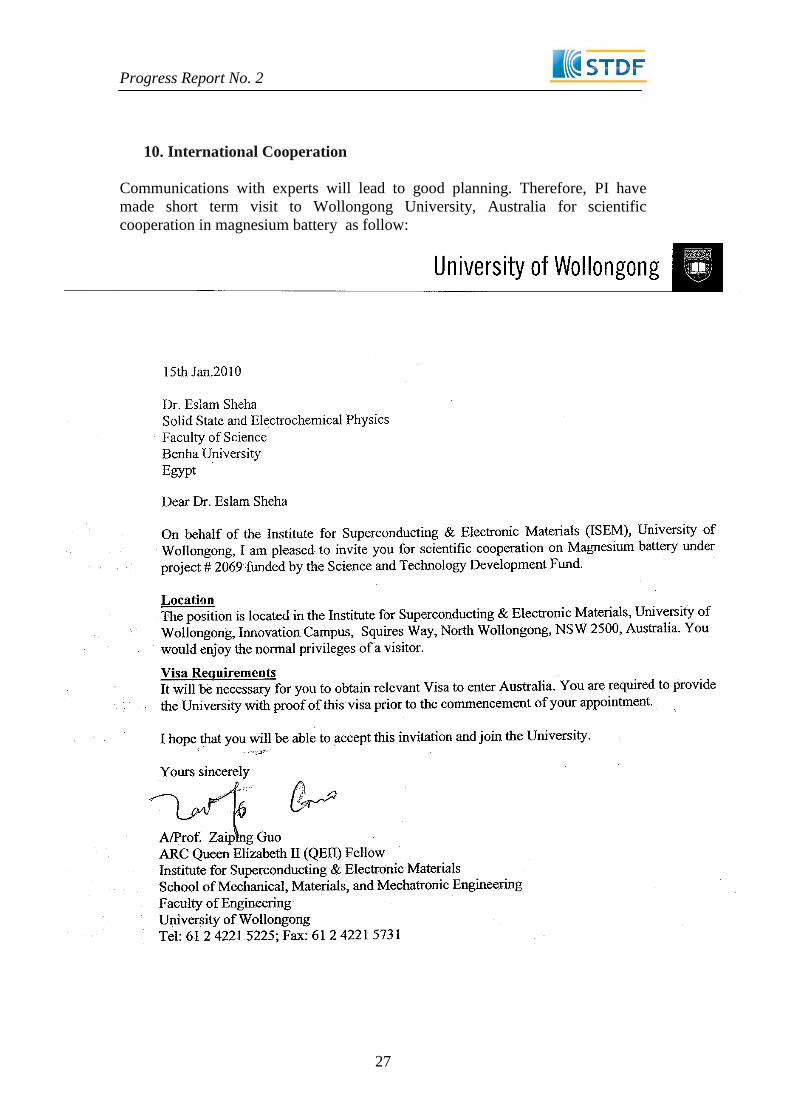
10. International Cooperation
Communications with experts will lead to good planning. Therefore, PI have
made short term visit to Wollongong University, Australia for scientific
cooperation in magnesium battery as follow:

Progress Report No. 2
28
11. Conferences The PI plans to share in an international conference as follow:

Progress Report No. 2
29
The PI shared in the following conference by an article as follow:
THE EGYPTIAN
MATERIALS RESEARCH SOCIETY
33 Abd El–Khalek Tharwat, Cairo, Egypt
Tel. & Fax: 23925997
E-mail: contact@ egmrs.org
Web site: http://www.egmrs.org
____________________________________________
Eg-MRS 2010
THE XXIX INTERNATIONAL CONFERENCE
ON
SSoolliidd SSttaattee SScciieennccee aanndd
MMaatteerriiaallss PPhhyyssiiccss
&
WORKSHOP
ON
PPhhoottoonniicc CCrryyssttaallss aanndd GGrraapphheennee
Sharm El-Shiekh, Egypt03 - 06 October 2011
______________________
Dear Dr. Eslam Sheha
It is a pleasure to inform you that your paper entitled:
"Ionic conductivity and dielectric properties of (PVA)0.5(MgBr2)0.25(PWA)0.25
solid polymer electrolyte’’
By: Eslam Sheha
Has been accepted for oral presentation in the 29th
conference (Eg-MRS 2011).
Please, confirm your attendance by payment the registration fees (1200 L.E)
Kind regards.
Conference Chairman
Mohamed El Oker Prof. Dr. Mohamed El Oker.
EEEggg---MMMRRRSSS

Progress Report No. 2
30
12. Actual or Expected Problems Encountered and Resolutions
Description of problems encountered:
1. The internal resistance of the fabricated Mg/Solid acid battery is
still high.
2. Delay of importing Battery Tester
Description of actions taken to resolve the problems:
3. Investigate the effect of non-ionic plastic polymer on the ionic
transport of PVA(1-x) (MgBr2)x/2(PWA)x/2 membrane.
4. We postponed studying capacity against cycle number for the next
report.

Progress Report No. 2
31
13. Implementing team(s):
Name Title Contact Post
Eslam Mohamed Sheha Ph.D +20107414705
PI: The PI has the overall
responsibility of the project and the
documents. The responsibility
specifically includes planning,
supervising, keeping everyone going
and call the group together.
Shimaa Ibrahim Abo
Elazm
M.Sc (S) +20194392928
Researcher "B": Membrane
development and ion transference
analyst
Rania Gamal Abd -
Elghar M.Sc (s) +20170268845
Researcher "B": Impedance
analyst
Blal Ahmed M.Sc (s) +20109560056 Researcher "B": SEM analyst
Tarek Salh M.Sc (s) +20194434174 Researcher "B": X-ray analyst
Mona Mohamed Abd-
Elmgid M.Sc (s) +20111081718 Researcher "B": Battery analyst
Mabrouk Kamel El-
Mansy Professor +20121097778 Fulltime counselor
Zaiping Guo Professor +(626)3952958 Battery counselor

Progress Report No. 2
32
14. Brief monetary report:
Item Allocated
budget
Actual
Expenditures Comments
Salaries 96000 96000
Equipment - 10000 (Indirect cost)
Chemicals &
Consumables 10000 9000
Local Travel
International Travel 35000 30000
Other costs (including
indirect costs) 28000 28000
Total Expenditure 169000 163000
Progress Report No. 2
33
Table 1. Activation energy and conduction index (n) a against Mg acid salt
concentration for PVA(1-x) (MgBr2)x/2(PWA)x/2 films.
n E2 (eV) E1 (eV) C
0.98 0.36
0.78
0
0.82
0.03
0.64
0.05
0.69
0.37
0.88
0.1
0.68
0.36
0.87
0.15
0.22
0.02
0.71
0.2
0.2
-0.42456
0.54
0.25
14. Appendices

Progress Report No. 2
34
Concentration Internal
Resistance
(K.Ohm)
Cell Capacity
(mAh)
maximum
power
density(Pmax)
( mW/cm2)
short
current
density
(mA/cm2)
0 2.2509
1.25
0.137
0.0859
10% 2.0535
1.65
0.189
0.1018
20% 0.6643
1.54
0.161
0.0946
30% 0.603
2.04
0.0889
0.0699
40% 0.9185
1.92
0.172
0.0972
Table2. Cell parameters against different concentration of electrolyte in the cathode (TiO2).
Progress Report No. 2
35
Fig.1a. the components of the Sewgelock cell
Stainless steel
Collector
Stainless steel
collector
Electrolyte
+
-
Mg TiO2
1.51 mm mm
0.6 mm 1.38 mm
Fig.1b Prototype magnesium cell

Progress Report No. 2
36
X 2200 10um WD 16 X 2200 10um WD 16
Fig.2. The SEM micrograph for the surface of PVA(1-x)(MgBr2)x/2(PWA)x/2 acid salt membrane with
a. x=0, b. x=0.2
a b

Progress Report No. 2
37
0 10 20 30 40 50 60 70
2 dergree
Inte
ns
ity
(a
.u)
PVA
x=0.2
x=0.4
Fig.3. X-ray diffraction pattern for PVA(1-x)(MgBr2)x/2(PWA)x/2 films with, x=0,0.2,0.4 .

Progress Report No. 2
38
1.00E-10
1.00E-08
1.00E-06
1.00E-04
0 0.05 0.1 0.15 0.2 0.25 0.3
c (wt.%)
b (
s.c
m-1
)
Fig.4. Cole Cole plots for PVA(1-x)(MgBr2)x/2 PWA(x/2) films
Fig.5. The ionic conductivity of PVA with various concentrations of Mg acid salt.
0.0E+00
5.0E+06
1.0E+07
1.5E+07
0.0E+00 5.0E+06 1.0E+07 1.5E+07
z' (ohm)
z''
(oh
m)
x=0.2
x=0.3
Rb
Cb
Progress Report No. 2
39
Fig 5
-22
-20
-18
-16
-14
-12
-10
-8
5 6 7 8 9 10 11 12 13 14
ln() (Hz)
ln(
) (s
.cm
-1)
x=0
x=0.1
x=0.2
x=0.3
x=0.4
x=0.5
Fig.6 Arrhenius plot for PVA(1-x)(MgBr2)x/2PWA(x/2) acid salt membrane
Fig.7 Variation of conductivity with frequency for PVA(1-x)(MgBr2)x/2(PWA)x/2 acid salt membrane
-21
-19
-17
-15
-13
-11
-9
-7
2.2 2.4 2.6 2.8 3 3.2 3.4
1000/T (K-1
)
ln(
) (s
.cm
-1)
x=0
x=0.1
x=0.2
x=0.3
x=0.4
x=0.5

Progress Report No. 2
40
1.E+00
1.E+01
1.E+02
1.E+03
1.E+04
1.E+05
1.E+06
1.0E+02 1.0E+03 1.0E+04 1.0E+05 1.0E+06
(Hz)
'
x=0
x=0.1
x=0.1
x=0.3
x=0.4
x=0.5
1.E+00
1.E+01
1.E+02
1.E+03
1.E+04
1.E+05
1.E+06
1.E+02 1.E+03 1.E+04 1.E+05 1.E+06
(Hz)
''
x=0
x=0.1
x=0.2x=0.3
x=0.4
x=0.5
Fig.8 Variation of a. ' and b.'' with frequency at 303 K for (PVA)(1- x) (MgBr2)x/2(PWA)x/2 acid salt
membrane

Progress Report No. 2
41
1.E+00
1.E+01
1.E+02
1.E+03
1.E+04
1.E+05
1.E+06
290 310 330 350 370 390 410 430
T (K)
'
x=0
x=0.1
x=0.2
x=0.3
x=0.4
x=0.5
1.E+00
1.E+01
1.E+02
1.E+03
1.E+04
1.E+05
1.E+06
290 310 330 350 370 390 410 430
T(K)
''
x=0
x=0.1
x=0.2
x=0.3
x=0.4
x=0.5
Fig.9 Variation of a. ' and b.'' with temperature at frequency 1 kHz for ( PVA)(1-x)
(MgBr2)x/2(PWA)x/2 acid salt membrane
Progress Report No. 2
42
Fig.10 Variation of polarization current as a function of time for PVA(0.5) (MgBr2)0.25(PWA)0.25
acid salt membrane.
0
50
100
150
200
250
-10 10 30 50 70 90 110 130
Time (minutes)
cu
ren
t (
A)
0.E+00
1.E+04
2.E+04
3.E+04
0.E+00 1.E+04 2.E+04 3.E+04
z' (ohm)
z''
(oh
m)
Befor after

Progress Report No. 2
43
a b
c
e
Fig.11. The Optical micrographs (X50)of:
(a) zero electrolyte; (b) 10% electrolyte; (c)
20% electrolyte; (d) 30% electrolyte; (e)
40% electrolyte in the cathode.
d
50 X
Progress Report No. 2
44
0 10 20 30 40 50 60 70
2 (degree)
Inte
nsity (
a.u
)
TiO2-G
TiO2
Fig12. XRD patterns of pure TiO2 and TiO2 /Graphite.
Progress Report No. 2
45
0 10 20 30 40 50 60 70
2(degree)
Inte
nsity (
a.u
)
10%
20%
30%
40%
Fig13. XRD patterns of TiO2.xwt.%electrolyte , x=10,20,30 and40.
Progress Report No. 2
46
Fig.
14. Discharge curves, voltage against time
0
0.2
0.4
0.6
0.8
1
1.2
1.4
1.6
1.8
-1 19 39 59 79 99
T (hours)
V (
volt)
Cycle 1
Cycle 2
Progress Report No. 2
47
0 10 20 30 40 50 60 702 (degree)
Inte
nsity (
a.u
)
Base
Discharge1
Charge
Discharge2
Fig15. XRD patterns of the pure cathode before discharge, after first discharge, after first
charge and after second discharge.

Progress Report No. 2
48
0
0.4
0.8
1.2
1.6
2
0 5 10 15 20 25 30
Time (h)
Voltage (
V)
Base
Fig16. Open-circuit voltage during 24 h of storage.

Progress Report No. 2
49
0
0.2
0.4
0.6
0.8
1
1.2
1.4
1.6
1.8
0 50 100 150 200 250 300
T (h)
V (
vo
lt)
x=Zero
x=10%
x=20%
x=30%
x=40%
Fig.17. Discharge curves of Mg/electrolyte/TiO2 for different concentration (x) of the
electrolyte in the cathode where x=0, 10%, 20%, 30%, 40% at constant load resistance.

Progress Report No. 2
50
Fig18. The plot of I-V and J-P curves for the battery
with different concentration of the electrolyte in the
cathode where a (zero), b (10%), c (20%),
d (30%), e (40%).
0
0.05
0.1
0.15
0.2
0.25
0 0.03 0.06 0.09Current density (mA cm-2)
Pow
er
density
(m
W c
m-2
)0
0.2
0.4
0.6
0.8
1
1.2
1.4
0 0.03 0.06 0.09 0.12
Current (mA)
Volta
ge (
V)
a
0
0.05
0.1
0.15
0.2
0.25
0 0.02 0.04 0.06 0.08 0.1Current density (mA cm-2)
Pow
er
density
(m
W c
m-2
)
0
0.2
0.4
0.6
0.8
1
1.2
1.4
1.6
1.8
0 0.02 0.04 0.06 0.08 0.1 0.12 0.14
Current (mA)V
olta
ge (
V)
b
0
0.05
0.1
0.15
0.2
0.25
0 0.02 0.04 0.06 0.08 0.1Current density (mA cm-2)
Pow
er
density
(m
W c
m-2
)
0
0.2
0.4
0.6
0.8
1
1.2
1.4
0 0.03 0.06 0.09 0.12
Current (mA)
Volta
ge (
V)
c 0
0.05
0.1
0.15
0.2
0.25
0 0.02 0.04 0.06 0.08Current density (mA cm-2)
Pow
er
density
(m
W c
m-2
)
0
0.2
0.4
0.6
0.8
1
1.2
0 0.02 0.04 0.06 0.08 0.1
Current (mA)
Volta
ge (
V)
d
0
0.05
0.1
0.15
0.2
0.25
0 0.02 0.04 0.06 0.08 0.1Current density (mA cm-2)
Pow
er
density
(m
W c
m-2
)
0
0.2
0.4
0.6
0.8
1
1.2
1.4
1.6
0 0.03 0.06 0.09 0.12
Current (mA)
Volta
ge (
V)
e

Progress Report No. 2
51

Progress Report No. 2
52
a