progress on the prevention and
TRANSCRIPT


PROGRESS ON THE PREVENTION AND CONTROL OF NONCOMMUNICABLE DISEASES
IN THE WESTERN PACIFIC REGION
COUNTRY CAPACITY SURVEY 2019
© World Health Organization 2021
ISBN 978 92 9061 926 0
Some rights reserved. This work is available under the Creative Commons Attribution-NonCommercial-ShareAlike 3.0 IGO licence (CC BY-NC-SA 3.0 IGO; https://creativecommons.org/licenses/by-nc-sa/3.0/igo).
Under the terms of this licence, you may copy, redistribute and adapt the work for non-commercial purposes, provided the work is appropriately cited, as indicated below. In any use of this work, there should be no suggestion that WHO endorses any specific organization, products or services. The use of the WHO logo is not permitted. If you adapt the work, then you must license your work under the same or equivalent Creative Commons licence. If you create a translation of this work, you should add the following disclaimer along with the suggested citation: “This translation was not created by the World Health Organization (WHO). WHO is not responsible for the content or accuracy of this translation. The original English edition shall be the binding and authentic edition”.
Any mediation relating to disputes arising under the licence shall be conducted in accordance with the mediation rules of the World Intellectual Property Organization. (http://www.wipo.int/amc/en/mediation/rules/)
Suggested citation. Progress on the prevention and control of noncommunicable diseases in the Western Pacific Region: country capacity survey 2019. Manila: World Health Organization Regional Office for the Western Pacific; 2021. Licence: CC BY-NC-SA 3.0 IGO.
Cataloguing-in-Publication (CIP) data. 1. Chronic disease – prevention and control. 2. Noncommunicable diseases. 3. Western Pacific. I. World Health Organization Regional Office for the Western Pacific (NLM Classification: WT500).
Sales, rights and licensing. To purchase WHO publications, see http://apps.who.int/bookorders. To submit requests for commercial use and queries on rights and licensing, see http://www.who.int/about/licensing.
For WHO Western Pacific Regional Publications, request for permission to reproduce should be addressed to Publications Office, World Health Organization, Regional Office for the Western Pacific, P.O. Box 2932, 1000, Manila, Philippines, Fax. No. (632) 521-1036, email: [email protected]
Third-party materials. If you wish to reuse material from this work that is attributed to a third party, such as tables, figures or images, it is your responsibility to determine whether permission is needed for that reuse and to obtain permission from the copyright holder. The risk of claims resulting from infringement of any third-party-owned component in the work rests solely with the user.
General disclaimers. The designations employed and the presentation of the material in this publication do not imply the expression of any opinion whatsoever on the part of WHO concerning the legal status of any country, territory, city or area or of its authorities, or concerning the delimitation of its frontiers or boundaries. Dotted and dashed lines on maps represent approximate border lines for which there may not yet be full agreement. The mention of specific companies or of certain manufacturers’ products does not imply that they are endorsed or recommended by WHO in preference to others of a similar nature that are not mentioned. Errors and omissions excepted, the names of proprietary products are distinguished by initial capital letters.
All reasonable precautions have been taken by WHO to verify the information contained in this publication. However, the published material is being distributed without warranty of any kind, either expressed or implied. The responsibility for the interpretation and use of the material lies with the reader. In no event shall WHO be liable for
CONTENTS
Acknowledgements vi
Foreword vii
Abbreviations viii
Executive summary x
I. Introduction 1
II. Status of response to prevent and control NCDs in the Western Pacific Region in 2019
3
A. Public health infrastructure, partnerships and multisectoral collaboration for NCDs and their risk factors
5
B. Status of NCD-relevant policies, strategies and action plans 12
C. Health information system, surveillance and surveys for NCDs and their risk factors
15
D. Capacity for NCD early detection, treatment and care within the health system
22
III. Key findings and progress in country capacity for the prevention and control of NCDs
32
A. Key findings 32
B. Progress in country capacity for the prevention and control of NCDs 33
C. Ten progress monitoring indicators 34
IV. Regional response and way forward 40
A. Regional response 40
B. Way forward 43
V. References 46
Annexes
Annex 1. Country-specific information 47
Annex 2. NCD Country Capacity Survey 2019 Questionnaire 60
Annex 3. Indicator definitions and specifications, the status of countries and areas 94

TABLES
Table 1 Countries and areas in the Western Pacific Region that participated in the NCD CCS 2019 by World Bank income level and subregion
4
Table 2 Number of countries and areas with cancer and diabetes registries, data type and coverage rate
16
Table 3 Number of countries and areas that survey harmful use of alcohol, national coverage and interval, by age-specific population
17
Table 4 Number of countries and areas that survey tobacco use, national coverage and interval, by age-specific population
17
Table 5 Number of countries and areas that survey healthy diet, national coverage and interval, by age-specific population
18
Table 6 Number of countries and areas that survey salt intake, national coverage and interval, by age-specific population
19
Table 7 Number of countries and areas that survey physical inactivity, national coverage and interval, by age-specific population
19
Table 8 Number of countries and areas that survey overweight and obesity, national coverage and interval, by age-specific population
20
Table 9 Number of countries and areas that survey raised blood glucose/diabetes, cholesterol, and raised blood pressure/hypertension, measurement type, national coverage and interval
21
Table 10 Number of countries and areas with CVD, diabetes, cancer and CRD guidelines, drug-specific protocols, utilization and referral criteria status
22
Table 11 Number of countries and areas with alcohol dependence, tobacco dependence, overweight and physical activity guidelines, utilization and referral criteria status
23
Table 12 Number of countries and areas where basic technology is available for early detection, diagnosis, monitoring of NCDs in primary care facilities in both public and private settings
24
Table 13 Number of countries and areas with medicine generally available in the primary care facilities of the public health sector
28
Table 14 Number of countries and areas with available palliative care for patients with NCDs in the public sector
31
Table 15 Number of countries and areas with available patient registries for rheumatic fever and rheumatic heart disease
31
Table 16 Comparison of country capacity indicators in 2004, 2010, 2013, 2015, 2017 and 2019
35
Table 17 Achievement status of the NCD progress monitoring indicators in the Western Pacific
38

FIGURES
Figure 1 Percentage of countries and areas with number of dedicated staff in NCD unit
5
Figure 2 Percentage of countries and areas with technical staff dedicated per NCD risk factor and diseases
6
Figure 3 Major sources of funding for NCDs and their risk factors 7
Figure 4 Percentage of countries and areas with fiscal interventions to NCD risk factors
9
Figure 5 Number of countries and areas with multisectoral NCD commissions and their operational stages
10
Figure 6 Percentage of countries and areas with members in their national multisectoral commission, agency or mechanism
11
Figure 7 Percentage of countries and areas that included NCD in national health plans or national development plans
12
Figure 8 Number of countries and areas that have the time-bound national target for NCDs and its indicators
13
Figure 9 Percentage of countries and areas with national screening programme by cancer sites
25
Figure 10 Percentage of countries and areas with HPV vaccination and its population coverage rate
26
Figure 11 Number of countries and areas with available cancer centres/departments at the tertiary-level hospital and related cancer treatment services in the public sector
27
Figure 12 Percentage of countries and areas with procedures available for treating NCDs
29
Figure 13 Percentage of countries and areas with primary health care facilities for cardiovascular risk stratification and its availability at country level
31
Figure 14 WHO 10 progress monitoring indicators on NCDs 37

PROGRESS ON THE PREVENTION AND CONTROL OF NONCOMMUNICABLE DISEASES IN THE WESTERN PACIFIC REGION
vi
ACKNOWLEDGEMENTS
This report was developed by the World Health Organization (WHO) Regional Office for the Western Pacific. WHO wishes to acknowledge the support and cooperation of the following national noncommunicable disease (NCD) focal points who provided the completed survey tool.
World Health Organization:Marie Clem Carlos, Melanie Cowan, Leanne Riley, Nargiza Khodjaeva, Fabio Scano, Bolormaa Sukhbaatar, Maalsen Anna Alexandra, John Juliard Go, Lai Duc Truong, Hojoon Lee, Donghee Seo, Saki Narita, Hai-Rim Shin, Paulinus Sikosana, Wendy Snowdon, Nola Vanualailai, Nguyen Tuan Lam, Chun Paul Soo, Koorio Tetabea and Douangkeo Thochongliachi.
The report was reviewed by Hai-Rim Shin, Warrick Junsuk Kim, Annette M. David and Josaia Tiko.
Leila Jordan (Australia)Ong Sok King (Brunei Darussalam)Kol Hero (Cambodia)Liangyou Wu (China)Ka-wai Rita Ho (China, Hong Kong SAR)Chan Tan Mui (China, Macao SAR)Josephine Hermann/Mirella Mairi
(Cook Islands)Isimeli Tukana/Alvis Zibran (Fiji)Merehau Mervin (French Polynesia)Patrick Solidum Luces (Guam)Masakazu Aihara (Japan)Kaaro Neeti/Teanibuaka Tabunga (Kiribati)Lavanh Vongsavanthong (Lao People’s
Democratic Republic)Feisul Idzwan Mustapha (Malaysia)Philmar Mendoza/Neiar Kabua
(Marshall Islands)X-ner Luther (Federated States of Micronesia)
Khandarmaa Tseren-Ochir (Mongolia)Jean-Paul Grangeon (New Caledonia)Kalais Hemi (New Zealand)Don Kadir/Stacey Cain (Nauru)Grizelda Mokoia (Niue)Subroto Banerji (Commonwealth of the
Northern Mariana Islands)Edolem Ikerdeu (Palau)Vicky Wari (Papua New Guinea)Ferchito L. Avelino (Philippines)Eun-hye Shim (Republic of Korea)Mareta Sefo-Faalafi/Take Naseri (Samoa)Benjamin Lee (Singapore)Geoffrey Kenilorea (Solomon Islands)Petelo Tavite (Tokelau)Siale ‘Akau’ola/‘Ofa Sanft Tukia (Tonga)Felise Manoa Afasene (Tuvalu)Douglas Ngwele (Vanuatu)Tran Dac Phu (Viet Nam)

vii
FOREWORD
Noncommunicable diseases (NCDs) are the leading cause of mortality in the world, accounting for 71% of all deaths. In the Western Pacific Region, the burden is higher, with NCDs responsible for 86% of mortality. NCDs also contribute a significant portion of the regional disease burden, and its adverse socioeconomic consequences. Irrespective of the availability of the best buy interventions and ongoing NCD activities; data shows the rate of decline in premature deaths from NCDs globally and the region is insufficient to achieve the Sustainable Development Goal (SDG) target 3.4.
The Seventy-second World Health Assembly extended the WHO Global Action Plan for the Prevention and Control of NCDs 2013–2020 (NCD-GAP) – endorsed during the Sixty-sixth World Health Assembly – to 2030 to ensure its alignment with the 2030 Agenda for Sustainable Development. Following this, the Western Pacific Regional Action Plan for the Prevention and Control of Noncommunicable Diseases (2014–2020) was also extended to 2030.
Progress on Prevention and Control of Noncommunicable Disease in the Western Pacific Region: Country Capacity Survey 2019 provides an update of Member States’ current capacities with regards to NCDs infrastructure and governance, policy action, surveillance and health-systems response. These findings must be used to identify areas that require prioritization and strengthening to counter the NCD epidemic.
While the report highlights some of the achievements made in the prevention and control of NCDs in member states; the overall progress has been uneven and inadequate to achieve SDG 3.4. The time to act is now and bolder measures are urgent! We must identify new innovative approaches on the prevention, screening, early diagnosis and treatment of NCDs. However, this requires whole-of-society and beyond-health commitment at the highest levels to strengthen multi-sectoral action and address persistent gaps in the prevention and control of NCDs in the region.
Countries can still meet the 2030 targets. But the window of opportunity for identifying and implementing policies and actions with the highest return on investment is now and closing fast.
Reaffirming the vision articulated in For the Future: Towards the Healthiest and Safest Region, WHO remains committed to working closely with member states and partners to support, expand, strengthen and sustain NCD interventions.
PROGRESS ON THE PREVENTION AND CONTROL OF NONCOMMUNICABLE DISEASES IN THE WESTERN PACIFIC REGION
viii
ABBREVIATIONS
ACE angiotensin-converting enzyme
BMI body mass index
CanLEAD Workshop on Leadership and Capacity-building for Cancer Control
CCS Country Capacity Survey
COPD chronic obstructive pulmonary disease
CRD chronic respiratory disease
CVD cardiovascular disease
FAO Food and Agriculture Organization of the United Nations
FCTC WHO Framework Convention on Tobacco Control
GATS Global Adult Tobacco Survey
GINA Global Database on the Implementation of Nutrition Action
GISAH Global Information System on Alcohol and Health
GSHS Global School-based Student Health Survey
GTCR Global Tobacco Control Report
GYTS Global Youth Tobacco Survey
HbA1c haemoglobin A1c
HICs high-income countries (and areas)
HPV human papillomavirus
IARC International Agency for Research on Cancer
ISH International Society of Hypertension
LeAd-NCD Regional Workshop on Strengthening Leadership and Advocacy for the Prevention and Control of Noncommunicable Diseases
LMICs low- and middle-income countries (and areas)
mHealth mobile health
MSMT measurement (survey measured)
NCD noncommunicable disease
NGO nongovernmental organization

ix
OGTT oral glucose tolerance test
PA physical activity
PEN WHO Package of Essential NCD Interventions
PICs Pacific island countries and areas
SARA Service Availability and Readiness Assessment
SDG Sustainable Development Goal
SSB sugar-sweetened beverage
STEPS WHO STEPwise approach to surveillance
UN United Nations
UNIATF United Nations Interagency Task Force
WHO World Health Organization

PROGRESS ON THE PREVENTION AND CONTROL OF NONCOMMUNICABLE DISEASES IN THE WESTERN PACIFIC REGION
x
EXECUTIVE SUMMARY
Noncommunicable diseases (NCDs) – especially cardiovascular diseases (CVDs), cancer, diabetes and chronic respiratory diseases (CRDs) – are the leading cause of death globally and are responsible for 71% of deaths worldwide. In the World Health Organization (WHO) Western Pacific Region, NCDs account for 86% of deaths, based on 2016 estimation. These NCDs share modifiable behavioural risk factors such as tobacco use, unhealthy diet, lack of physical activity and harmful use of alcohol, which lead to four metabolic/physiologic changes – raised blood pressure, overweight and obesity, raised blood glucose and raised cholesterol, and ultimately disease. They continue to be an important public health challenge in all countries, including low- and middle-income countries where more than three quarters of NCD deaths occur.
Global and regional commitments were made to respond to the growing NCD epidemic, including the Political Declaration of the United Nations (UN) High-level Meeting on the Prevention and Control of Noncommunicable Diseases in September 2011 and development of the WHO Global Action Plan for the Prevention and Control of NCDs 2013–2020, Western Pacific Regional Action Plan for the Prevention and Control of NCDs 2014–2020 and WHO Global Monitoring Framework for NCDs. The latter contains the nine voluntary global NCD targets and 25 indicators to be achieved by 2025.
Effectively tackling NCDs and their key risk factors requires a detailed understanding of the current status and progress being made at the country level. Feasible and cost-effective interventions exist to reduce the burden and impact of NCDs now and in the future. Tracking national capacity of a key set of tracer actions linked to these interventions allows for global benchmarking and monitoring of progress being made against NCDs. It also serves to highlight challenges and areas requiring further attention.
To monitor the progress and achievements of countries in expanding national capacities to respond to the NCD epidemic, WHO periodically conducts the NCD Country Capacity Survey (CCS). The latest round of the NCD CCS took place in 2019. The first time countries and areas of the Western Pacific Region participated in the survey was in the second round in 2005; the Region has participated in all the succeeding rounds in 2010, 2013, 2015, 2017 and 2019.
Progress on the Prevention and Control of NCDs in the Western Pacific Region: Country Capacity Survey 2019 presents a snapshot of the progress on NCD prevention and control in the Region in terms of infrastructure, policies, health information systems and health systems capacity as collected in the NCD CCS 2019. Countries were grouped in the analysis based on the World Bank classification of income status – high-income countries (HICs) and low- and middle-income countries (LMICs) – while Pacific island countries and areas (PICs), including Papua New Guinea, were grouped as one subregion.
In 2019, 34 countries and areas participated in the survey compared to 35 in 2017. All HICs and LMICs in the Region and 19 of the 21 PICs responded to the survey. All the responses from countries and areas were verified with a focal point from WHO headquarters and the Western
xi
Pacific Regional Office. The validation process for the responses was initiated in 2015, partially implemented in 2017 and fully implemented in 2019.
Results from the latest NCD CCS in 2019 showed some progress has been made since 2017 in the capacity of countries in overall NCD prevention and control. For NCD infrastructure, the number of dedicated staff for NCDs with at least six people in the unit has increased from 66% to 78% of countries and areas in the Region from 2017. Primary prevention for NCDs and their risk factors is now being fully funded across all countries and areas in the Region. While taxation on tobacco and alcohol remained as the most prevalent fiscal interventions, taxation on sugar-sweetened beverages and foods high in fat, sugar or salt also increased in the Region from 2017 to 2019.
Although the number of countries and areas having national multisectoral NCD policies, strategies and action plans remained the same compared to the previous round (30 out of 34; 88%), the operational status increased from 25 to 29 out of 30 countries and areas (97%).
The majority of the countries and areas in the Region (31 out of 34; 91%) reported having a system for reporting mortality data by cause of death. All countries and areas collecting mortality data also have a civil/vital registration system (31 out of 31; 100%). Disease registration systems have improved since 2017. Although the number of cancer registries in the Region remains the same as in 2017 (29 out of 34), the countries and areas that use population-based registries increased from 15 to 18 out of 29 countries and areas, and 16 out of 29 countries and areas targeted the entire population for their registry. All of the countries and areas perform NCD risk factor surveys, although cholesterol and salt measurements are not always included due to financial and logistical reasons. Securing a budget to conduct the NCD risk factor survey regularly with national coverage remains a challenge.
Similar to the 2017 survey results, evidence-based national guidelines, protocols, or standards for the management of diabetes (31 out of 34; 91%) and CVDs (25 out of 34; 74%) are the most commonly available guidelines in the Region in 2019. However, the utilization rate (utilized in 50% of health care facilities) has improved to over 80% in both guidelines from less than 60% in 2017. Ninety per cent of guidelines now include referral criteria for diabetes, CVD and CRD. For cancer guidelines, 78% currently include referral criteria.
Weight and height measurements were available in at least 50% of health facilities in the Region. Other basic technologies for measuring blood glucose, blood pressure and blood cholesterol were also available in more than 50% of countries and areas in the Region.
Cervical cancer screening is the most common screening programme in the Region (29 out of 34; 85%) followed by breast cancer screening (22 out of 34; 65%) and colon cancer (14 out of 34; 41%). Human papillomavirus (HPV) vaccination is included in the national vaccination programme in 22 out of 34 (65%) countries and areas; moreover, 11 out of 22 countries and areas cover more than 50% of the eligible population. Aspirin (31 out of 34; 91%) and metformin

PROGRESS ON THE PREVENTION AND CONTROL OF NONCOMMUNICABLE DISEASES IN THE WESTERN PACIFIC REGION
xii
(31 out of 34; 91%) are the most commonly available essential medicines in the Region, while oral morphine (18 out of 34; 53%) and nicotine replacement therapy (17 out of 34; 50%) are the least common.
WHO’s new Noncommunicable Disease Progress Monitor tracks the extent to which countries are implementing their commitments to develop national responses to the global burden of NCDs. The Monitor provides a snapshot of some of the achievements and challenges faced by both developed and developing countries as they strive to reach the progress monitoring indicators of 10 globally agreed targets to combat cancer, diabetes, and heart and lung disease.
More than 10 out of 34 countries and areas in the Region have fully achieved the indicators on having reliable cause-specific mortality data, periodic NCD risk factor surveys, integrated NCD policy, multisectoral national strategy/action plans, plain/standardized packaging of tobacco products, restrictions on food marketing to children, promotion of physical activities, evidence-based national guidelines, and provision of drug therapy, with a noteworthy number of countries and areas partially achieving these indicators as well.
However, accelerated efforts are needed for bans on alcohol advertising and reducing unhealthy diets (reducing salt/sodium intake, limiting saturated fatty acids/elimination of trans-fat, marketing of foods and non-alcoholic beverages to children, and legislation of breast-milk substitutes) since more than half of respondents have not achieved these indicators.
Considering For the Future: Towards the Healthiest and Safest Region, WHO’s vision for its work with Member States and partners in the Western Pacific in the coming years, which was presented at the 70th session of the Regional Committee in October 2019, the WHO Regional Office for the Western Pacific conceptualized and operationalized a new approach to NCDs in the Region that is systematic, strategic and systems-oriented.
Championing health beyond the health sector will be a critical way to operationalize multisectoral action to prevent and respond to the burden of disease and promote health equity by addressing the causes of NCDs, including through legislative, policy and community interventions to aid in NCD prevention.
1
INTRODUCTION
Noncommunicable diseases (NCDs) – mainly cardiovascular diseases (CVD), cancer, diabetes and chronic respiratory diseases (CRD) – are the leading cause of death, responsible for 71% of deaths worldwide and 86% in the WHO Western Pacific Region (1).
These NCDs share behavioural risk factors that are modifiable, such as tobacco use, unhealthy diet, lack of physical activity and the harmful use of alcohol, which in turn lead to abnormal metabolic and physiologic changes – raised blood pressure, overweight and obesity, raised blood glucose, raised cholesterol and ultimately disease. They continue to be important public health challenges in all countries, including low- and middle-income countries (LMICs), where more than three quarters of NCD-related deaths occur.
The need for action to prevent NCDs has evoked a series of global and regional commitments, including the Political Declaration of the United Nations (UN) High-level Meeting on the Prevention and Control of Noncommunicable Diseases in September 2011 (2), the WHO Global Action Plan for the Prevention and Control of NCDs 2013–2020 (3) and the Western Pacific Regional Action Plan for the Prevention and Control of NCDs 2014–2020 (4). Member States adopted the WHO Global Monitoring Framework for NCDs to monitor progress in the implementation of the Global Action Plan. The Framework includes nine voluntary global NCD targets and 25 indicators to be achieved by 2025. The 2014 High-level Meeting on the comprehensive review and assessment of the progress achieved in the prevention and control of NCDs evaluated the progress made, resulting in the Outcome Document (5) and establishment of four time-bound commitments. Moreover, the WHO independent High-level Commission on NCDs published a report, Time to Deliver, in 2018 to advise how countries can accelerate progress on NCDs.
Effectively tackling NCDs and their key risk factors requires a detailed understanding of the current status and progress being made at the country level. Tracking national implementation of key interventions allows for global benchmarking and monitoring of progress against NCDs. It also serves to highlight challenges and areas requiring further attention.
CHAPTER 1

PROGRESS ON THE PREVENTION AND CONTROL OF NONCOMMUNICABLE DISEASES IN THE WESTERN PACIFIC REGION
2
WHO has conducted the NCD Country Capacity Survey (CCS) since 2001 to monitor the progress and achievements of countries in expanding national capacities to respond to the NCD epidemic. Countries and areas in the Western Pacific Region have participated in the NCD CCS since its second round in 2005, with succeeding rounds in 2010, 2013, 2015, 2017 and 2019. The survey collects information related to NCD governance and infrastructure, policy response, surveillance and health systems response at the national level, with some modifications to the questions to make them consistent with the global NCD indicators.
Progress on the Prevention and Control of Noncommunicable Diseases in the Western Pacific Region: Country Capacity Survey 2019 presents the data gathered from the NCD CCS 2019 and compares them to findings from past surveys. This document will also be used to provide baseline information and evidence to technical advisers and countries and areas in the Region as they strive to enhance and strengthen their response to the NCD epidemic.

3
The 2019 NCD CCS is a global survey conducted by WHO to assess the strengths and weaknesses of Member States in terms of their NCD governance and infrastructure, policy response, surveillance and health systems response. Data collection and validation in the Western Pacific Region occurred from March 2019 to December 2019.
The 2019 NCD CCS questionnaire (see Annex 2) was developed jointly by relevant technical departments at WHO headquarters and regional offices. A web-based questionnaire enabled the electronic collection of data. The questionnaire was composed of four different modules:
1. Public health infrastructure, partnerships and multisectoral collaboration for NCDs and their risk factors
2. Status of NCD-relevant policies, strategies and action plans3. Health information systems, surveillance and surveys for NCDs and their risk factors4. Capacity for NCD early detection, treatment and care within the health system.
WHO headquarters sent an official communication in March 2019 to all countries and areas in the Western Pacific Region (with the exception of the Pitcairn Islands) requesting the nomination of an NCD focal point from the respective ministries of health. Focal points received a unique access code to log into the survey. Focal points were encouraged to work collaboratively with colleagues and relevant offices to obtain the most updated and accurate information on NCDs, and were required to upload and submit documents to validate their responses to the questionnaire for verification. Responses were evaluated as “No” or “Not Achieved” if the required supporting documentation was not submitted.
Designated WHO staff from the regional offices and headquarters reviewed submitted questionnaires for completeness, and cross-checked questionnaire responses with external data sources and supporting documents. Existing data sources included GLOBOCAN and International Agency for Research on Cancer (IARC), the WHO mortality database, WHO-supported NCD risk factor surveys and WHO vaccine-preventable diseases monitoring system. The latest Global Tobacco Control Report (GTCR) was used for tobacco tax and policy data,
STATUS OF RESPONSE TO PREVENT AND CONTROL NCDs IN THE WESTERN PACIFIC REGION IN 2019
CHAPTER 2

PROGRESS ON THE PREVENTION AND CONTROL OF NONCOMMUNICABLE DISEASES IN THE WESTERN PACIFIC REGION
4
the Global Information System on Alcohol and Health (GISAH) was similarly used for alcohol-related responses, and the Food and Agriculture Organization of the United Nations (FAO) database on nutrition guidelines was referred to for the related CCS questions. The reviewers also referenced the 2015 and 2017 NCD CCS responses to determine whether the differences in response indicated progress or corrections of previous responses. When necessary, WHO sent a clarification request with a list of queries and comments to the NCD focal points. Despite these measures, a few countries and areas were not able to address the queries and/or submit the required supporting documentation.
Thirty-four out of the 36 countries and areas in the Western Pacific Region completed the 2019 NCD CCS, for a response rate of 94%. This is lower than the 2017 NCD CCS response rate of 97%, but higher than the 2015 NCD CCS response rate of 89%. All 34 countries and areas that submitted questionnaires had their responses validated successfully.
The responses submitted by countries and areas were extracted from the web-based platform to a spreadsheet format. Data cleaning was performed to ensure consistency between answers in the questions and subquestions. Data analysis was conducted per question and per module using Stata 15/Microsoft Excel.
Countries and areas that participated in the 2019 NCD CCS – with the exception of the Pacific island countries and areas (PICs) – were grouped in the analysis based on income status: high-income countries (HICs) and low- and middle-income countries (LMICs) (6). The PICs, including Papua New Guinea, were grouped as one subregion (Table 1).
Table 1. Countries and areas in the Western Pacific Region that participated in the NCD CCS 2019 by World Bank income level and subregion
High-income countries and areas (N=8)
Low- and middle-income countries (N=7)
Pacific island countriesand areas (N=19)
Australia Cambodia Cook Islands Northern Mariana Islands (Commonwealth of the)
Brunei Darussalam China Fiji Palau
Hong Kong SAR (China) Lao People’s Democratic Republic
French Polynesia Papua New Guinea
Japan Malaysia Guam Samoa
Macao SAR (China) Mongolia Kiribati Solomon Islands
New Zealand Philippines Marshall Islands Tokelau
Republic of Korea Viet Nam Micronesia (Federated States of)
Tonga
Singapore Nauru Tuvalu
New Caledonia Vanuatu
Niue

2. STATUS OF RESPONSE TO PREVENT AND CONTROL NCDS IN THE WESTERN PACIFIC REGION IN 2019
5
Unit, branch or department responsible for NCDs and technical staff distribution
In the Western Pacific Region, 32 out of 34 countries and areas (94%) reported that there is a unit, branch or department in the ministry of health or equivalent responsible for NCDs and associated risk factors. All HICs and LMICs in the Region have a unit for NCDs, while 89% (n=17) of PICs stated that they have an NCD unit. The number of full-time staff in the NCD units varied by subgroup. Nearly half (47%) of countries and areas in the Region have 11 or more full-time NCD staff, although this differed across the categories, with 75% of HICs and 41% of PICs having 11 or more full-time staff, compared to only 29% of LMICs (Fig. 1).
When disaggregated by NCD risk factor, all 32 countries and areas with NCD units reported having dedicated technical staff for promoting nutrition/healthy diet (100%), followed by enhancing physical activity (97%), decreasing tobacco use (97%) and decreasing harmful use of alcohol (75%). By disease categories, most of the countries reported dedicated technical staff for diabetes (97%), followed by CVD (94%), cancer (91%), oral disease (66%) and CRD (63%) (Fig. 2).
A. Public health infrastructure, partnerships and multisectoral collaboration for NCDs and their risk factors
Figure 1. Percentage of countries and areas with number of dedicated staff in NCD unit
HICs: high-income countries; LMICs: low- and middle-income countries; NCD: noncommunicable disease; PICs: Pacific islandcountries and areas
0%
20%
40%
60%
80%
HICs (N=8)LMICs (N=7)PICs (N=19)
Number of full-time staff in NCD unit
11 or more 6 to 10 2 to 5 1

PROGRESS ON THE PREVENTION AND CONTROL OF NONCOMMUNICABLE DISEASES IN THE WESTERN PACIFIC REGION
6
Figure 2. Percentage of countries and areas with technical staff dedicated per NCD risk factor and diseases
HICs: high-income countries; LMICs: low- and middle-income countries; NCD: noncommunicable disease; PICs: Pacific islandcountries and areas
NC
Ds
and
risk
fact
ors
Harmful use of alcohol
Unhealthy diet
Physical inactivity
Tobacco use
Cancer
Cardiovascular diseases
Chronic respiratory diseases
Diabetes
Oral health
Percentage of countries and areas reporting
0% 25% 50% 75% 100%
HICs LMICsPICs

2. STATUS OF RESPONSE TO PREVENT AND CONTROL NCDS IN THE WESTERN PACIFIC REGION IN 2019
7
HICs: high-income countries; LMICs: low- and middle-income countries; PICs: Pacific island countries and areas
General government revenues
Health insurance
International donors
National donors
Earmarked taxes
Others
0% 23% 45% 68% 90%
HICs (N=8)LMICs (N=7)PICs (N=19)
Figure 3. Major sources of funding for NCDs and their risk factors

PROGRESS ON THE PREVENTION AND CONTROL OF NONCOMMUNICABLE DISEASES IN THE WESTERN PACIFIC REGION
8
Funding allocation and mechanism
All countries and areas stated primary prevention as the most funded NCD and risk factor function, followed by health promotion (97%); early detection and screening (97%); health care and treatment (97%); surveillance, monitoring and evaluation (88%); and capacity-building (79%). The least supported NCD activities in the Region were palliative care (65%) and research (64%); less than 50% of PICs countries and areas reported dedicated funding for these two activities (see Annex 1 Table 4).
In 62% of countries and areas across the Region, the major source of funding for NCDs and their risk factors comes from general government revenues, followed by health insurance, which was the major source of funding for 9% of countries and areas. International and national donors are significant funding sources for PICs. Earmarked taxes remain the least reported funding source across all country categories and were reported by only one high-income country. On the other hand, countries have health promotion foundations but small overall funding (Fig. 3).
Fiscal interventions
Taxation on tobacco is the most frequently reported fiscal intervention in the Region (94% of countries and areas), followed by taxation on alcoholic beverages (82%). In contrast, less frequently reported are taxation on sugar-sweetened beverages (SSB) (29%) and foods high in sugar or salt (18%), price subsidies for healthy foods (9%) and tax incentives to promote physical activity (6%) (Fig. 4).
Only 12 out of 34 countries and areas (38%) reported having earmarked funds for health promotion or health service provision.
Multisectoral commissions, agencies or mechanisms
Out of 34 countries and areas, 21 (62%) reported that they have a multisectoral commission, agency or mechanism to oversee NCD management, policy coherence and accountability of sectors beyond health. Of these 21 countries and areas, 17 (81%) have operational structures to ensure multisectoral coordination of NCD prevention and control. The remaining four countries and areas, all of which are PICs, are still developing or do not have an operational multisectoral mechanism in effect (Fig. 5).

2. STATUS OF RESPONSE TO PREVENT AND CONTROL NCDS IN THE WESTERN PACIFIC REGION IN 2019
9
Figure 4. Percentage of countries and areas with fiscal interventions to NCD risk factors

PROGRESS ON THE PREVENTION AND CONTROL OF NONCOMMUNICABLE DISEASES IN THE WESTERN PACIFIC REGION
10
Figure 5. Number of countries and areas with multisectoral NCD commissions and their operational stages
N=34Total countries and areas
that responded to CCS 2019
HICs–8, LMICs–7, PICs–19
N=21Number of countries and
areas with a multisectoral NCD commission
HICs–5, LMICs–4, PICs–12
N=3 (PICs)
Number of countries and areas with
multisectoral NCD commision under
development
N=17
Number of countries and areas
with operational multisectoral NCD
commission
HICs–5, LMICs–4, PICs–8
N=1 (PIC)
Country with multisectoral NCD commision that is
not in effect
HICs: high-income countries; LMICs: low- and middle-income countries; NCD: noncommunicable disease; PICs: Pacific island countries and areas

2. STATUS OF RESPONSE TO PREVENT AND CONTROL NCDS IN THE WESTERN PACIFIC REGION IN 2019
11
Other government ministries (59%) are the most commonly reported members of the national multisectoral NCD commissions in the Region, followed by nongovernmental organizations (NGOs) and the private sector. In the PICs, participation by NGOs (58%) is as high as other government ministries (Fig. 6).
govt: government; HICs: high-income countries; inst: institutions; LMICs: low- and middle-income countries;NCD: noncommunicable disease; NGOs: nongovernmental organizations; PICs: Pacific island countries andareas; UN: United Nations
Other govt ministries
UN agencies
Other international inst
Academia
NGOs/community-basedorgs/civil society
Private sector
Other
Percetage of countries and areas reporting
0% 18% 35% 53% 70%
HICs (N=8)LMICs (N=7)PICs (N=19)
Figure 6. Percentage of countries and areas with members in their national multisectoral commission, agency or mechanism

PROGRESS ON THE PREVENTION AND CONTROL OF NONCOMMUNICABLE DISEASES IN THE WESTERN PACIFIC REGION
12
National policies, strategies and action plans
In the Western Pacific Region, 31 out of 34 countries and areas (91%) reported that NCDs are included in their national health plan. However, only 23 (68%) reported that NCDs are included in their national development plans (Fig. 7).
Out of 34 countries and areas, 24 reported that they have a time-bound national target for NCDs and of these, 23 (96%) have a set of national indicators for their time-bound targets based on the WHO Global Monitoring Framework (Fig. 8).
B. Status of NCD-relevant policies, strategies and action plans
HICs: high-income countries; LMICs: low- and middle-income countries; PICs: Pacific island countries and areas
0%
25%
50%
75%
100%
NCDs in national health plan NCDs in national development agenda
HICs (N=8)LMICs (N=7)PICs (N=19)
Figure 7. Percentage of countries and areas that included NCDs in national health plans or national development plans

2. STATUS OF RESPONSE TO PREVENT AND CONTROL NCDS IN THE WESTERN PACIFIC REGION IN 2019
13
Figure 8. Number of countries and areas that have the time-bound national target for NCDs and its indicators
N=34Total countries and areas
that responded to CCS 2019HICs–8, LMICs–7, PICs–19
N=10C
Countries without time-bound national targets
for NCDs
HICs–3, PICs–7
N=24
Countries with time-bound national targets for NCDs
HICs–5, LMICs–7, PICs–12
N=23
Countries with time-bound national targets for NCDs
with indicators
HICs–4, LMICs–7, PICs–12
HICs: high-income countries; LMICs: low- and middle-income countries; PICs: Pacific island countries and areas
Integrated policies, strategies and action plans for NCDs
Out of 34 countries and areas, 30 (88%) have an integrated national NCD policy, strategy or action plan, and of these, all 30 (100%) have multi-stakeholder policies and 29 (97%) have multisectoral policies (see Annex 1 Table 5).
A total of 29 out of 30 countries and areas (97%) with integrated national NCD policies, strategies or action plans are at an operational stage. For early detection, treatment and care for specific NCDs, almost all addressed diabetes (97%), followed by CVD (93%) and cancer (87%). CRD (67%) was the least frequent NCD addressed in integrated national policies, strategies or action plans. For specific NCD risk factors, all 30 countries and areas included physical inactivity and unhealthy diet, followed by tobacco use (93%) and harmful use of alcohol (90%). Palliative care (43%) was the least likely NCD-related action area covered by the integrated national NCD policies, strategies or action plans (see Annex 1 Table 6).
Policies, strategies or action plans for specific key NCDs and their risk factors
Twenty out of 34 countries and areas (59%) in the Region have cancer-specific policies, strategies or action plans, and 100% of these are currently operational. Oral health was the second most cited, with 17 countries and areas (50%) reporting having oral health–specific

PROGRESS ON THE PREVENTION AND CONTROL OF NONCOMMUNICABLE DISEASES IN THE WESTERN PACIFIC REGION
14
policies, strategies or plans; all 17 are operational. In contrast, less than half of countries and areas have specific plans for diabetes (24%), CVD (18%) and CRD (6%) (see Annex 1 Table 7). Less than half of countries and areas reported having separate plans for specific NCD risk factors. Policies or plans that address healthy diet and decreasing tobacco use were reported by half of respondents, followed by increasing physical activity and/or promoting physical activity (41%), reducing overweight/obesity (38%) and reducing the harmful use of alcohol (38%). Most of the NCD risk factor–specific plans are operational (see Annex 1 Table 8).
Seventeen out of 34 countries and areas (50%) stipulated a recommended level of physical activity for the general population. Of these, 100% provide specific guidelines for adults, 76% provide guidance for older adults and 71% specify physical activity levels for children and adolescents aged 5 to 19 years. Physical activity recommendations for children under 5 years of age were the least-encountered guideline among the 17 respondents (29%). Twenty-two out of 34 countries and areas (65%) reported having national food-based dietary guidelines for the population; however, food guidelines are most often encountered in HICs (100%) while LMICs (71%) and PICs (47%) are less likely to have prescribed food guidelines (see Annex 1 Table 9).
Research policy or plan
Less than half of the countries and areas (38%) in the Region have a policy and/or plan on NCD-related research, including community-based research and impact evaluation. Among 13 respondent countries and areas, 11 (85%) have an operational research policy and/or plan. Moreover, only six (18%) have a national network for NCD-related research. All these six countries are from HICs; no LMICs or PICs have a national network for NCD-related research (see Annex 1 Table 10).
Policies and strategies to promote healthy diet
Eleven out of 34 countries and areas (32%) have a policy to reduce the impact on children of marketing of foods and non-alcoholic beverages. However, enforcement of these policies is mandatory in only five out of 11 countries and areas (50%). Policies on front-of-pack labelling to identify foods high in saturated fatty acids, trans-fatty acids, free sugars or salt are present in eight countries and areas (24%); however, enforcement is mandatory in only two (25%). Six out of 34 countries and areas (18%) have policies to reduce population saturated fatty acid intake, but enforcement is mandatory in only two of these. Fifteen countries and areas (44%) have a policy to reduce population salt/sodium consumption, with enforcement mandatory in only one country (see Annex 1 Table 11). A policy to eliminate industrially produced trans-fatty acids (i.e. partially hydrogenated oils) in the food supply is the least frequently encountered diet-related policy, reported by three out of 34 countries and areas (9%).
Recent activities for NCD awareness and mHealth
Twenty-three out of 34 countries and areas (68%) implemented national public education and awareness campaigns on diet and physical activity within the past two years, respectively. Of these, 20 out of 23 (87%) integrated their campaigns with community-based programmes, 16 (70%) had campaigns supported by environmental changes to enable physical activity, and
2. STATUS OF RESPONSE TO PREVENT AND CONTROL NCDS IN THE WESTERN PACIFIC REGION IN 2019
15
15 (65%) addressed the social, environmental and economic benefits of physical activity, in addition to the health benefits (see Annex 1 Table 12).
Within the past two years, 22 out of 34 countries and areas (65%) had implemented national or subnational mass participation events to encourage fee-free public participation for physical activity. Fourteen countries and areas (41%) implemented national, NCD-related mobile health (mHealth) initiatives, such as tobacco cessation, hypertension management, cervical cancer screening awareness, and promotion of physical activity. The use of mHealth initiatives varied across the country groupings, with 75% of HICs reporting these initiatives compared to 43% of LMICs and 26% of PICs.
Surveillance responsibility
Two out of 34 countries and areas (6%) in the Region have an office within their ministry of health dedicated exclusively to NCD surveillance, and both countries are HICs. Fourteen countries and areas (41%) have a surveillance office within the ministry of health but not exclusively dedicated to NCDs. More than half of countries and areas (53%) have NCD surveillance as a shared responsibility across several offices/departments/administrative divisions within the ministry of health (see Annex 1 Table 13).
Civil and vital registration systems reporting mortality and cause of death
Thirty-one out of 34 countries and areas (91%) have a system for collecting mortality data by cause of death on a routine basis. All of the countries and areas that have a system for mortality data also have a civil/vital registration system. However, only 22 out of these 31 countries and areas (71%) have a population registration system, while 9 (29%) have a sample registration system. Nineteen countries and areas (61%) that collect mortality data have officially registered more than 75% of total deaths in the entire country through the system (see Annex 1 Table 14). Specific country information is available in Annex 1.
Cancer and diabetes registries
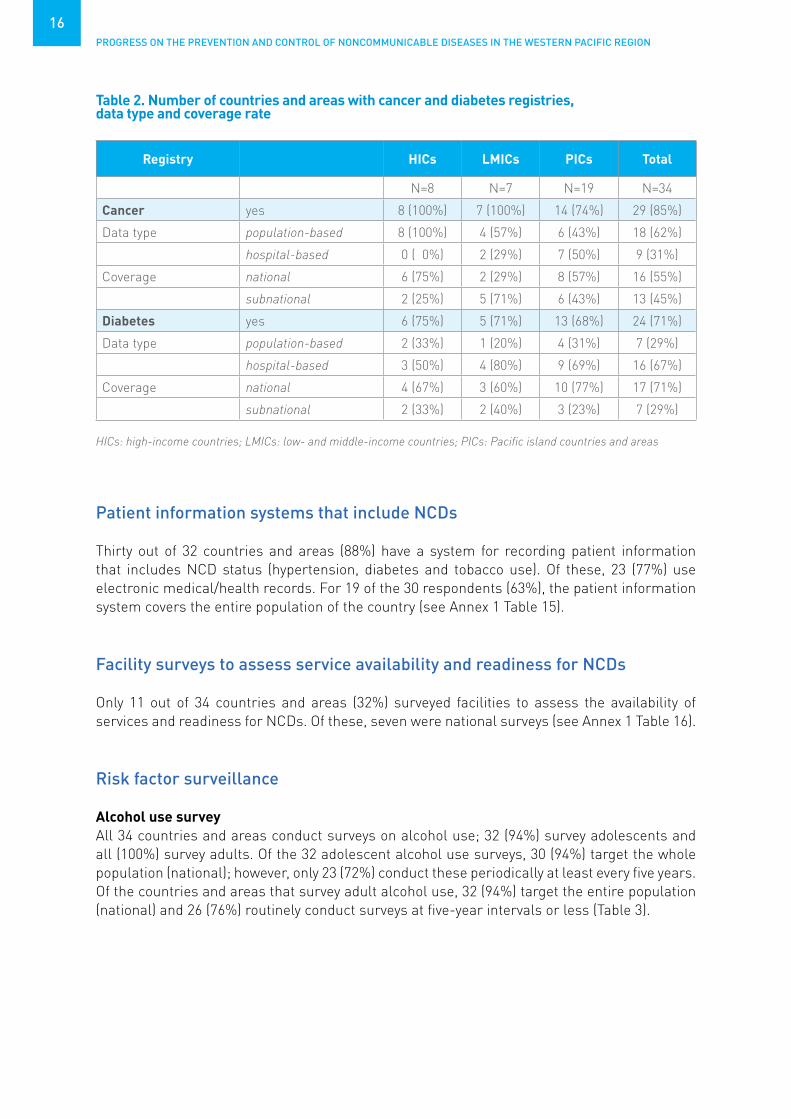
Twenty-nine out of 34 countries and areas (85%) reported having a cancer registry. All HICs and LMICs have cancer registries, compared to only 74% of PICs. Of these registries, 62% are population-based while 31% are hospital-based registries. Cancer registry coverage was national for 55% of reporting countries and areas. Twenty-four out of 34 countries and areas in the Region (71%) have a diabetes registry, of which seven are population-based and the remaining 16 are hospital-based (Table 2). Seventeen out of 24 countries and areas (71%) stated that their diabetes registry covered the whole population. Specific country information is available in Annex 1.
C. Health information system, surveillance and surveys for NCDs and their risk factors
PROGRESS ON THE PREVENTION AND CONTROL OF NONCOMMUNICABLE DISEASES IN THE WESTERN PACIFIC REGION
16
Table 2. Number of countries and areas with cancer and diabetes registries, data type and coverage rate
Registry HICs LMICs PICs Total
N=8 N=7 N=19 N=34
Cancer yes 8 (100%) 7 (100%) 14 (74%) 29 (85%)
Data type population-based 8 (100%) 4 (57%) 6 (43%) 18 (62%)
hospital-based 0 ( 0%) 2 (29%) 7 (50%) 9 (31%)
Coverage national 6 (75%) 2 (29%) 8 (57%) 16 (55%)
subnational 2 (25%) 5 (71%) 6 (43%) 13 (45%)
Diabetes yes 6 (75%) 5 (71%) 13 (68%) 24 (71%)
Data type population-based 2 (33%) 1 (20%) 4 (31%) 7 (29%)
hospital-based 3 (50%) 4 (80%) 9 (69%) 16 (67%)
Coverage national 4 (67%) 3 (60%) 10 (77%) 17 (71%)
subnational 2 (33%) 2 (40%) 3 (23%) 7 (29%)
Patient information systems that include NCDs
Thirty out of 32 countries and areas (88%) have a system for recording patient information that includes NCD status (hypertension, diabetes and tobacco use). Of these, 23 (77%) use electronic medical/health records. For 19 of the 30 respondents (63%), the patient information system covers the entire population of the country (see Annex 1 Table 15).
Facility surveys to assess service availability and readiness for NCDs
Only 11 out of 34 countries and areas (32%) surveyed facilities to assess the availability of services and readiness for NCDs. Of these, seven were national surveys (see Annex 1 Table 16).
Risk factor surveillance
Alcohol use surveyAll 34 countries and areas conduct surveys on alcohol use; 32 (94%) survey adolescents and all (100%) survey adults. Of the 32 adolescent alcohol use surveys, 30 (94%) target the whole population (national); however, only 23 (72%) conduct these periodically at least every five years. Of the countries and areas that survey adult alcohol use, 32 (94%) target the entire population (national) and 26 (76%) routinely conduct surveys at five-year intervals or less (Table 3).
HICs: high-income countries; LMICs: low- and middle-income countries; PICs: Pacific island countries and areas

2. STATUS OF RESPONSE TO PREVENT AND CONTROL NCDS IN THE WESTERN PACIFIC REGION IN 2019
17
Table 4. Number of countries and areas that survey tobacco use, national coverage and interval, by age-specific population
HICs: high-income countries; LMICs: low- and middle-income countries; PICs: Pacific island countries and areas
Tobacco use surveyAll countries and areas collect data on tobacco use for adolescents and adults. Thirty-two of 34 countries and areas (94%) conduct national adolescent tobacco use surveys; 24 (73%) collect their data at least every five years. Thirty-two countries and areas (94%) implementing adult tobacco use surveys target the entire population; 29 (88%) schedule their surveys at five-year intervals or less (Table 4).
HICs LMICs PICs Total
N=8 N=7 N=19 N=34
Tobacco survey conducted yes 8 (100%) 7 (100%) 19 (100%) 34 (100%)
Adolescent tobacco use survey
yes 8 (100%) 7 (100%) 19 (100%) 34 (100%)
• National coverage national 7 (88%) 7 (100%) 18 (95%) 32 (94%)
• At least 5 years interval routine 5 8 (100%) 6 (86%) 10 (56%) 24 (73%)
Adult tobacco use survey yes 8 (100%) 7 (100%) 19 (100%) 34 (100%)
• National coverage national 7 (88%) 7 (100%) 18 (95%) 32 (94%)
• At least 5 years interval routine 5 8 (100%) 7 (100%) 14 (78%) 29 (88%)
Table 3. Number of countries and areas that survey harmful use of alcohol, national coverage and interval, by age-specific population
HICs LMICs PICs Total
N=8 N=7 N=19 N=34
Alcohol survey conducted 8 (100%) 7 (100%) 19 (100%) 34 (100%)
Adolescent alcohol use survey 8 (100%) 7 (100%) 17 (89%) 32 (94%)
• National coverage 7 (88%) 7 (100%) 16 (94%) 30 (94%)
• At least 5 years interval 8 (100%) 5 (71%) 10 (59%) 23 (72%)
Adult alcohol use survey 8 (100%) 7 (100%) 19 (100%) 34 (100%)
• National coverage 7 (88%) 7 (100%) 18 (95%) 32 (94%)
• At least 5 years interval 7 (88%) 7 (100%) 12 (63%) 26 (76%)
BMI: body mass index; HICs: high-income countries; LMICs: low- and middle-income countries; PICs: Pacific island

PROGRESS ON THE PREVENTION AND CONTROL OF NONCOMMUNICABLE DISEASES IN THE WESTERN PACIFIC REGION
18
Dietary/Nutrition surveyAll 34 countries and areas conduct surveys on nutrition. Of these, 30 (88%) survey adolescents and all (100%) survey adults. For adolescent diet surveys, only three countries and areas (10%) used a 24-hour recall method; 28 (93%) targeted the whole population and 20 (67%) conducted their surveys at an interval of five years or less. For adult diet surveys, only three (9%) used a 24-hour recall method; 32 (94%) targeted national coverage and 25 (74%) were conducted routinely at least every five years (Table 5).
Twenty-five of 34 countries and areas (74%) conduct surveys assessing salt and sodium intake. Among these, seven (28%) used the 24-hour urine collection method, eight (32%) used the spot urine method, and six (24%) used a combination of both methods. Four (16%) used self-reported salt intake to assess consumption. Out of these 25 countries and areas that conducted salt surveys, 22 (88%) targeted national coverage and 16 (64%) conducted surveys at least every five years (Table 6).
Physical activity surveyAll 34 countries and areas survey physical activity. Eleven (32%) assessed physical activity levels among children, 30 (88%) targeted adolescents and 33 (97%) surveyed adult physical activity levels by questionnaires, self-reported or other methods. Objective measurement of physical activity was low across all the age groups surveyed. National coverage ranged from 73% to 94% based on age-specified target population, and 70% to 82% of surveys were conducted at least every five years. For adult physical activity surveys, 27 out of the 33 countries and areas assessed physical activity at work/in the household, for transport and during leisure time (Table 7).
Table 5. Number of countries and areas that survey healthy diet, national coverage and interval, by age-specific population
HICs LMICs PICs Total
N=8 N=7 N=19 N=34
Diet survey yes 8 (100%) 7 (100%) 19 (100%) 34 (100%)
Adolescent diet survey yes 8 (100%) 7 (100%) 15 (79%) 30 (88%)
• MSMT 24-hr recall 1 (13%) 1 (14%) 1 (7%) 3 (10%)
• National coverage national 7 (88%) 7 (100%) 14 (93%) 28 (93%)
• At least 5 years interval routine 5 7 (88%) 5 (71%) 8 (53%) 20 (67%)
Adult diet survey yes 8 (100%) 7 (100%) 19 (100%) 34 (100%)
• MSMT 24-hr recall 1 (13%) 1 (14%) 1 (6%) 3 (9%)
• National coverage national 7 (88%) 7 (100%) 18 (95%) 32 (94%)
• At least 5 years interval routine 5 7 (88%) 7 (100%) 11 (58%) 25 (74%)
HICs: high-income countries; LMICs: low- and middle-income countries; MSMT: measurement type; PICs: Pacific island countries and areas

2. STATUS OF RESPONSE TO PREVENT AND CONTROL NCDS IN THE WESTERN PACIFIC REGION IN 2019
19
Table 6. Number of countries and areas that survey salt intake, national coverage and interval, by age-specific population
HICs: high-income countries; LMICs: low- and middle-income countries; MSMT: measurement type; PICs: Pacific island countries and areas
HICs LMICs PICs Total
N=8 N=7 N=19 N=34
Salt survey yes 8 (100%) 6 (86%) 11 (58%) 25 (74%)
• MSMT 24-hr urine 2 (25%) 3 (50%) 2 (18%) 7 (28%)
spot urine 4 (50%) 2 (33%) 2 (18%) 8 (32%)
combination 1 (13%) 1 (17%) 4 (36%) 6 (24%)
self-reported 1 (13%) 0 (0%) 3 (27%) 4 (16%)
• National coverage national 7 (88%) 5 (83%) 10 (91%) 22 (88%)
• At least 5 years interval routine 5 3 (38%) 6 (100%) 7 (64%) 16 (64%)
• National coverage national 7 (88%) 7 (100%) 18 (95%) 32 (94%)
• At least 5 years interval routine 5 7 (88%) 7 (100%) 11 (58%) 25 (74%)
HICs: high-income countries; LMICs: low- and middle-income countries; MSMT: measurement type; PICs: Pacific island countries and areas
Table 7. Number of countries and areas that survey physical inactivity, national coverage and interval, by age-specific population
HICs LMICs PICs Total
N=8 N=7 N=19 N=34
Physical activity survey yes 8 (100%) 7 (100%) 19 (100%) 34 (100%)
Physical activity survey amongst children yes 5 (63%) 1 (14%) 5 (26%) 11 (32%)
• MSMT measured 0 (0%) 0 (0%) 2 (40%) 2 (18%)
• National coverage national 3 (60%) 1 (100%) 4 (80%) 8 (73%)
• At least 5 years interval routine 5 4 (80%) 1 (100%) 4 (80%) 9 (82%)
Physical activity survey amongst adolescent yes 7 (88%) 7 (100%) 16 (84%) 30 (88%)
• MSMT measured 0 (0%) 0 (0%) 1 (6%) 1 (3%)
• National coverage national 6 (86%) 7 (100%) 15 (94%) 28 (93%)
• At least 5 years interval routine 5 6 (86%) 5 (71%) 10 (63%) 21 (70%)
Physical activity survey amongst adults yes 8 (100%) 7 (100%) 18 (95%) 33 (97%)
• MSMT measured 0 (0%) 0 (0%) 2 (11%) 2 (6%)
• Includes domains yes 5 (63%) 7 (100%) 15 (83%) 27 (82%)
• National coverage national 7 (88%) 7 (100%) 17 (94%) 31 (94%)
• At least 5 years interval routine 5 7 (88%) 7 (100%) 12 (71%) 26 (81%)

PROGRESS ON THE PREVENTION AND CONTROL OF NONCOMMUNICABLE DISEASES IN THE WESTERN PACIFIC REGION
20
Overweight and obesity surveyAll 34 countries and areas reported that they have a survey for overweight and obesity. Of these, 22 (65%) survey children, 31 (91%) cover adolescents and all (100%) survey adults. National coverage was reported by 77% of countries and areas conducting surveys on children, 94% for those on adolescents and 94% on adults. About three fourths of surveys were conducted at intervals of five years or less (Table 8).
Other NCD risk factor surveys
All countries and areas conduct surveys to assess the prevalence of raised blood glucose or diabetes and of these, 29 (85%) used objective measurement instead of self-reporting. Thirty-two (94%) countries and areas surveyed the whole population and 25 (74%) conducted their surveys routinely every five years or less. Thirty-one countries and areas (91%) reported doing surveys to assess the prevalence of raised total cholesterol and 30 (97%) used measured cholesterol. Twenty-eight countries and areas (90%) conduct population-based surveys and 21 (68%) routinely collect data at least every five years. All countries and areas survey for raised blood pressure/hypertension; 32 (94%) use objective measures, 31 (91%) aim for population coverage and 24 (73%) conduct their surveys at least every five years (Table 9).
HICs: high-income countries; LMICs: low- and middle-income countries; MSMT: measurement type; PICs: Pacific island countries and areas
Table 8. Number of countries and areas that survey overweight and obesity, national coverage and interval, by age-specific population
HICs LMICs PICs Total
N=8 N=7 N=19 N=34
BMI survey yes 8 (100%) 7 (100%) 19 (100%) 34 (100%)
Children BMI survey yes 8 (100%) 5 (71%) 9 (47%) 22 (65%)
• MSMT measured 8 (100%) 5 (100%) 9 (100%) 22 (100%)
• National coverage national 7 (88%) 5 (100%) 5 (56%) 17 (77%)
• At least 5 years interval routine 5 7 (88%) 4 (80%) 5 (56%) 16 (73%)
Adolescent BMI survey yes 8 (100%) 7 (100%) 16 (84%) 31 (91%)
• MSMT measured 6 (75%) 6 (86%) 13 (81%) 25 (81%)
• National coverage national 7 (88%) 7 (100%) 15 (94%) 29 (94%)
• At least 5 years interval routine 5 7 (88%) 5 (71%) 11 (73%) 23 (77%)
Adult BMI survey yes 8 (100%) 7 (100%) 19 (100%) 34 (100%)
• MSMT measured 7 (88%) 7 (100%) 18 (95%) 32 (94%)
• National coverage national 7 (88%) 7 (100%) 18 (95%) 32 (94%)
• At least 5 years interval routine 5 6 (75%) 7 (100%) 13 (68%) 26 (76%)

2. STATUS OF RESPONSE TO PREVENT AND CONTROL NCDS IN THE WESTERN PACIFIC REGION IN 2019
21
HICs: high-income countries; LMICs: low- and middle-income countries; MSMT: measurement type; PICs: Pacific island countries and areas
Table 9. Number of countries and areas that survey raised blood glucose/diabetes, cholesterol, and raised blood pressure/hypertension, measurement type, national coverage and interval
HICs LMICs PICs Total
N=8 N=7 N=19 N=34
Glucose/diabetes survey yes 8 (100%) 7 (100%) 19 (100%) 34 (100%)
• MSMT measured 6 (75%) 7 (100%) 16 (84%) 29 (85%)
• National coverage national 7 (88%) 7 (100%) 18 (95%) 32 (94%)
• At least 5 years interval routine 5 6 (75%) 7 (100%) 12 (63%) 25 (74%)
Cholesterol survey yes 8 (100%) 7 (100%) 16 (84%) 31 (91%)
• MSMT measured 8 (100%) 7 (100%) 15 (94%) 30 (97%)
• National coverage national 7 (88%) 7 (100%) 14 (88%) 28 (90%)
• At least 5 years interval routine 5 4 (50%) 7 (100%) 10 (63%) 21 (68%)
Blood pressure/ hypertension survey yes 8 (100%) 7 (100%) 19 (100%) 34 (100%)
• MSMT measured 8 (100%) 7 (100%) 17 (89%) 32 (94%)
• National coverage national 7 (88%) 7 (100%) 17 (89%) 31 (91%)
• At least 5 years interval routine 5 6 (75%) 7 (100%) 11 (61%) 24 (73%)
PROGRESS ON THE PREVENTION AND CONTROL OF NONCOMMUNICABLE DISEASES IN THE WESTERN PACIFIC REGION
22
Evidence-based national guidelines, protocols and standards for NCD management
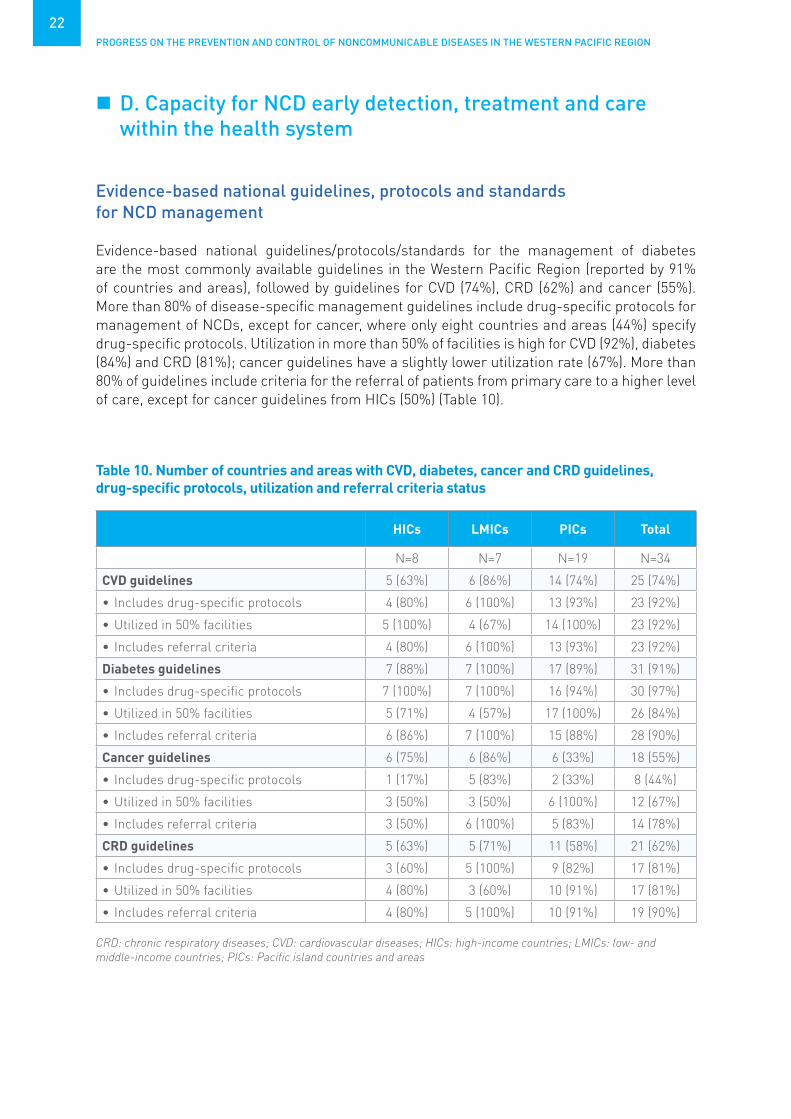
Evidence-based national guidelines/protocols/standards for the management of diabetes are the most commonly available guidelines in the Western Pacific Region (reported by 91% of countries and areas), followed by guidelines for CVD (74%), CRD (62%) and cancer (55%). More than 80% of disease-specific management guidelines include drug-specific protocols for management of NCDs, except for cancer, where only eight countries and areas (44%) specify drug-specific protocols. Utilization in more than 50% of facilities is high for CVD (92%), diabetes (84%) and CRD (81%); cancer guidelines have a slightly lower utilization rate (67%). More than 80% of guidelines include criteria for the referral of patients from primary care to a higher level of care, except for cancer guidelines from HICs (50%) (Table 10).
D. Capacity for NCD early detection, treatment and care within the health system
Table 10. Number of countries and areas with CVD, diabetes, cancer and CRD guidelines, drug-specific protocols, utilization and referral criteria status
HICs LMICs PICs Total
N=8 N=7 N=19 N=34
CVD guidelines 5 (63%) 6 (86%) 14 (74%) 25 (74%)
• Includes drug-specific protocols 4 (80%) 6 (100%) 13 (93%) 23 (92%)
• Utilized in 50% facilities 5 (100%) 4 (67%) 14 (100%) 23 (92%)
• Includes referral criteria 4 (80%) 6 (100%) 13 (93%) 23 (92%)
Diabetes guidelines 7 (88%) 7 (100%) 17 (89%) 31 (91%)
• Includes drug-specific protocols 7 (100%) 7 (100%) 16 (94%) 30 (97%)
• Utilized in 50% facilities 5 (71%) 4 (57%) 17 (100%) 26 (84%)
• Includes referral criteria 6 (86%) 7 (100%) 15 (88%) 28 (90%)
Cancer guidelines 6 (75%) 6 (86%) 6 (33%) 18 (55%)
• Includes drug-specific protocols 1 (17%) 5 (83%) 2 (33%) 8 (44%)
• Utilized in 50% facilities 3 (50%) 3 (50%) 6 (100%) 12 (67%)
• Includes referral criteria 3 (50%) 6 (100%) 5 (83%) 14 (78%)
CRD guidelines 5 (63%) 5 (71%) 11 (58%) 21 (62%)
• Includes drug-specific protocols 3 (60%) 5 (100%) 9 (82%) 17 (81%)
• Utilized in 50% facilities 4 (80%) 3 (60%) 10 (91%) 17 (81%)
• Includes referral criteria 4 (80%) 5 (100%) 10 (91%) 19 (90%)
CRD: chronic respiratory diseases; CVD: cardiovascular diseases; HICs: high-income countries; LMICs: low- and middle-income countries; PICs: Pacific island countries and areas
2. STATUS OF RESPONSE TO PREVENT AND CONTROL NCDS IN THE WESTERN PACIFIC REGION IN 2019
23
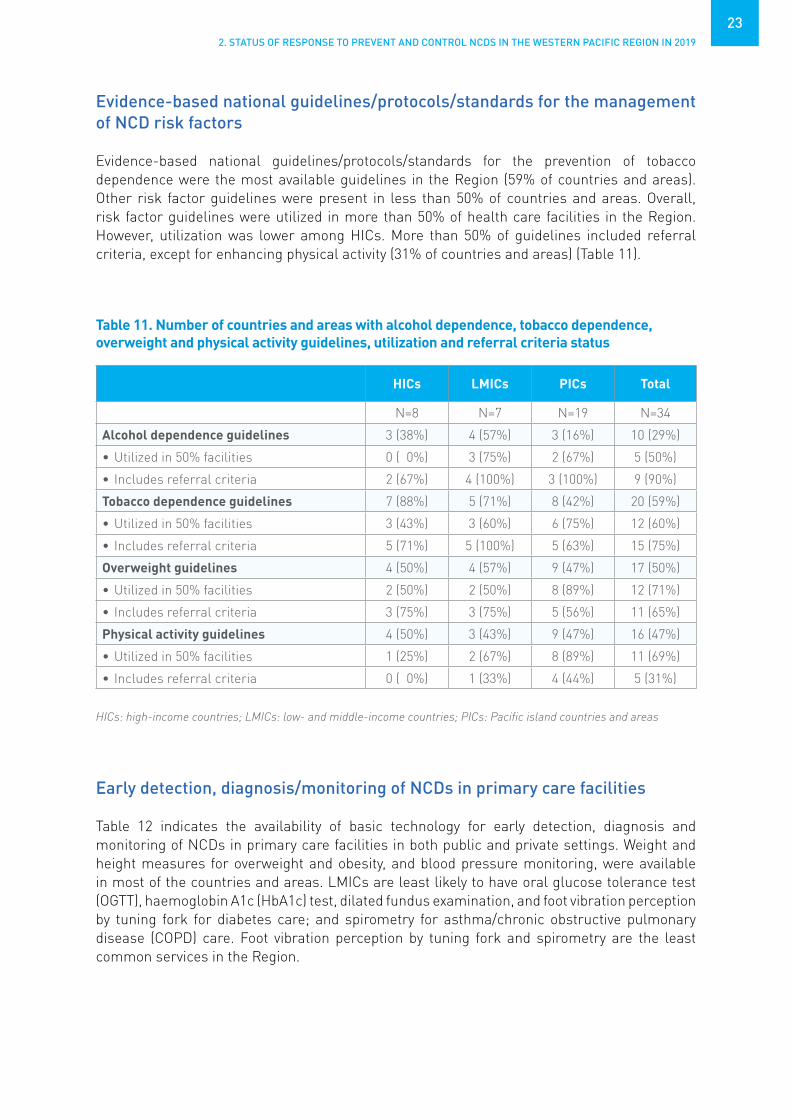
Evidence-based national guidelines/protocols/standards for the management of NCD risk factors
Evidence-based national guidelines/protocols/standards for the prevention of tobacco dependence were the most available guidelines in the Region (59% of countries and areas). Other risk factor guidelines were present in less than 50% of countries and areas. Overall, risk factor guidelines were utilized in more than 50% of health care facilities in the Region. However, utilization was lower among HICs. More than 50% of guidelines included referral criteria, except for enhancing physical activity (31% of countries and areas) (Table 11).
Early detection, diagnosis/monitoring of NCDs in primary care facilities
Table 12 indicates the availability of basic technology for early detection, diagnosis and monitoring of NCDs in primary care facilities in both public and private settings. Weight and height measures for overweight and obesity, and blood pressure monitoring, were available in most of the countries and areas. LMICs are least likely to have oral glucose tolerance test (OGTT), haemoglobin A1c (HbA1c) test, dilated fundus examination, and foot vibration perception by tuning fork for diabetes care; and spirometry for asthma/chronic obstructive pulmonary disease (COPD) care. Foot vibration perception by tuning fork and spirometry are the least common services in the Region.
Table 11. Number of countries and areas with alcohol dependence, tobacco dependence, overweight and physical activity guidelines, utilization and referral criteria status
HICs LMICs PICs Total
N=8 N=7 N=19 N=34
Alcohol dependence guidelines 3 (38%) 4 (57%) 3 (16%) 10 (29%)
• Utilized in 50% facilities 0 ( 0%) 3 (75%) 2 (67%) 5 (50%)
• Includes referral criteria 2 (67%) 4 (100%) 3 (100%) 9 (90%)
Tobacco dependence guidelines 7 (88%) 5 (71%) 8 (42%) 20 (59%)
• Utilized in 50% facilities 3 (43%) 3 (60%) 6 (75%) 12 (60%)
• Includes referral criteria 5 (71%) 5 (100%) 5 (63%) 15 (75%)
Overweight guidelines 4 (50%) 4 (57%) 9 (47%) 17 (50%)
• Utilized in 50% facilities 2 (50%) 2 (50%) 8 (89%) 12 (71%)
• Includes referral criteria 3 (75%) 3 (75%) 5 (56%) 11 (65%)
Physical activity guidelines 4 (50%) 3 (43%) 9 (47%) 16 (47%)
• Utilized in 50% facilities 1 (25%) 2 (67%) 8 (89%) 11 (69%)
• Includes referral criteria 0 ( 0%) 1 (33%) 4 (44%) 5 (31%)
HICs: high-income countries; LMICs: low- and middle-income countries; PICs: Pacific island countries and areas

PROGRESS ON THE PREVENTION AND CONTROL OF NONCOMMUNICABLE DISEASES IN THE WESTERN PACIFIC REGION
24
HICs (N=8) LMICs (N=7) PICs (N=19) Total (N=34)
Public Private Public Private Public Private Public Private
Overweight and obesity
Weight measure
8 (100%) 8 (100%) 7 (100%) 6 (86%) 19 (100%)
16 (89%) 34 (100%)
30 (91%)
Height measure
8 (100%) 8 (100%) 7 (100%) 5 (71%) 18 (95%) 15 (83%) 33 (97%) 28 (85%)
Diabetes
Glucose 8 (100%) 8 (100%) 6 (86%) 5 (71%) 18 (100%)
16 (89%) 32 (97%) 29 (88%)
OGTT 8 (100%) 8 (100%) 3 (43%) 3 (43%) 10 (53%) 8 (44%) 21 (62%) 19 (58%)
HbA1c 8 (100%) 8 (100%) 3 (43%) 3 (43%) 12 (63%) 9 (50%) 23 (68%) 20 (61%)
Fundus exam 8 (100%) 7 (88%) 2 (29%) 3 (43%) 10 (56%) 8 (44%) 20 (61%) 18 (55%)
Foot vibration 8 (100%) 7 (88%) 2 (29%) 3 (43%) 7 (37%) 8 (44%) 17 (50%) 18 (55%)
Urine strips for glucose and ketone
8 (100%) 8 (100%) 5 (71%) 3 (43%) 13 (68%) 9 (53%) 26 (76%) 20 (63%)
CVD
Blood pressure measure
8 (100%) 8 (100%) 7 (100%) 6 (86%) 19 (100%)
16 (89%) 34 (100%)
30 (91%)
Cholesterol measure
8 (100%) 8 (100%) 4 (57%) 3 (43%) 14 (74%) 10 (56%) 26 (76%) 21 (64%)
Urine strips albumin
8 (100%) 8 (100%) 4 (57%) 4 (57%) 13 (72%) 10 (56%) 25 (76%) 22 (67%)
Asthma and COPD
Spirometry 7 (88%) 4 (50%) 2 (29%) 3 (43%) 10 (53%) 10 (56%) 19 (56%) 17 (52%)
COPD: chronic obstructive pulmonary disease; CVD: cardiovascular disease; HICs: high-income countries; LMICs: low- and middle-income countries; OGTT: oral glucose tolerance test; PICs: Pacific island countries and areas* Defined as present in 50% or more of health care facilities.
Table 12. Number of countries and areas where basic technology is available* for early detection, diagnosis, monitoring of NCDs in primary care facilities in both public and private settings

2. STATUS OF RESPONSE TO PREVENT AND CONTROL NCDS IN THE WESTERN PACIFIC REGION IN 2019
25
National cancer screening programmes targeting the general population
Of the 34 countries and areas, 22 (65%) have a breast cancer screening programme. All of the programmes applied either clinical breast exam (41%) or mammography (59%) for screening. However, 11 out of these 22 programmes (55%) organized population-based screenings and only four (18%) covered more than 50% of the target population.
Twenty-nine countries and areas (85%) have a cervical cancer screening programme; of these, 22 (76%) use Pap smear and three (10%) also apply a human papillomavirus (HPV) test on screening. Seventeen of 29 programmes (59%) conduct population-based screening, but only 2 (7%) reach more than 50% of their target population.
Colon cancer screening is the least common cancer screening programme, reported by 14 countries and areas (41%). Among 14 programmes, the majority (71%) used a faecal test for screening. A total of 64% of the programmes organized population-based screening; however, none of the programmes achieved coverage of more than 50% of the target population (Fig. 9).Among programmes/guidelines to strengthen early detection of cancer at the primary health care level, cervical cancer programmes are the most common (65%) in the Region followed by breast cancer (50%) and colon cancer (36%). Cervical cancer programmes (75%) are also the most likely to have an established referral system from primary care to secondary and tertiary care, followed by breast cancer (58%) and colon cancer (44%) (see Annex 1 Table 17).
HICs: high-income countries; LMICs: low- and middle-income countries; PICs: Pacific island countries and areas
Per
cent
age
of c
ount
ries
and
are
as r
espo
ndin
g
0%
25%
50%
75%
100%
Type of cancer screening programme
Breast Cervix Colon
HICsLMICsPICs
Figure 9. Percentage of countries and areas with national screening programme by cancer sites

PROGRESS ON THE PREVENTION AND CONTROL OF NONCOMMUNICABLE DISEASES IN THE WESTERN PACIFIC REGION
26
HPV vaccination in the national immunization schedule
Twenty-two of 34 countries and areas (65%) in the Region include HPV vaccination in their national immunization schedule. However, LMICs (43%) and PICs (47%) are less likely than HICs to include HPV vaccination in the national schedule. LMICs are the least likely to achieve vaccine coverage of more than 50% of the target population (Fig. 10).
Figure 10. Percentage of countries and areas with HPV vaccination and its population coverage rate

2. STATUS OF RESPONSE TO PREVENT AND CONTROL NCDS IN THE WESTERN PACIFIC REGION IN 2019
27
Availability of cancer diagnosis and treatment services in the public sector
Among cancer diagnosis and treatment services in the public sector, pathology services (laboratories) are the most common available (76%), followed by cancer surgery (68%), cancer centre or cancer departments at tertiary level (53%) and chemotherapy (53%). In LMICs (57%) and PICs (16%), radiotherapy is the least common cancer treatment available in the public sector (Fig. 11).
HICs: high-income countries; LMICs: low- and middle-income countries; PICs, Pacific island countries and areas* Defined as present in 50% or more of health-care facilities.
Can
cer
serv
ices
ava
ilabl
e
Cancer centres/depts at tertiary level
Pathology services
Cancer surgery
Chemotherapy
Radiotherapy
Percentage of countries and areas responding
0% 25% 50% 75% 100%
HICs (N=8)LMICs (N=7)PICs (N=19)
Figure 11. Number of countries and areas with available* cancer centres/departments at the tertiary-level hospital and related cancer treatment services in the public sector
HICs: high-income countries; LMICs: low- and middle-income countries; PICs, Pacific island countries and areas* Defined as present in 50% or more of health-care facilities.
Can
cer
serv
ices
ava
ilabl
e
Cancer centres/depts at tertiary level
Pathology services
Cancer surgery
Chemotherapy
Radiotherapy
Percentage of countries and areas responding
0% 25% 50% 75% 100%
HICs (N=8)LMICs (N=7)PICs (N=19)

PROGRESS ON THE PREVENTION AND CONTROL OF NONCOMMUNICABLE DISEASES IN THE WESTERN PACIFIC REGION
28
HICs LMICs PICs Total
N=8 N=7 N=19 N=34
Insulin 8 (100%) 5 (71%) 16 (84%) 29 (85%)
Aspirin 8 (100%) 5 (71%) 18 (95%) 31 (91%)
Metformin 8 (100%) 5 (71%) 18 (95%) 31 (91%)
Thiazide diuretics 8 (100%) 4 (57%) 16 (84%) 28 (82%)
ACE inhibitors 8 (100%) 3 (43%) 16 (84%) 27 (79%)
Angiotensin II receptor blockers (ARBs) 8 (100%) 4 (57%) 11 (61%) 23 (70%)
Calcium channel blockers 8 (100%) 5 (71%) 15 (79%) 28 (82%)
Beta blockers 8 (100%) 3 (43%) 16 (84%) 27 (79%)
Statins 8 (100%) 4 (57%) 13 (68%) 25 (74%)
Oral morphine 7 (88%) 2 (29%) 9 (47%) 18 (53%)
Steroid inhaler 8 (100%) 3 (43%) 14 (74%) 25 (74%)
Bronchodilator 8 (100%) 3 (43%) 17 (89%) 28 (82%)
Sulphonylurea(s) 8 (100%) 4 (57%) 15 (79%) 27 (79%)
Benzathine penicillin injection 6 (75%) 4 (57%) 17 (89%) 27 (79%)
Nicotine replacement therapy 8 (100%) 1 (14%) 8 (42%) 17 (50%)
Table 13. Number of countries and areas with medicine generally available* in the primary care facilities of the public health sector
HICs: high-income countries; LMICs: low- and middle-income countries; PICs, Pacific island countries and areas * Defined as present in 50% or more of pharmacies.
Availability of medicine in the public health sector
Overall, NCD-related medicines are available in over 50% of the countries and areas in the Region. However, availability of NCD-related medicines varies significantly between country groups. Specifically, in LMICs, angiotensin-converting enzyme (ACE) inhibitors (43%), beta blockers (43%), oral morphine (29%), steroid inhalers (43%), bronchodilators (43%) and nicotine replacement therapy (14%) are not generally available. In PICs, oral morphine (47%) and nicotine replacement therapy (52%) are the least available medicines in the public sector (Table 13).

2. STATUS OF RESPONSE TO PREVENT AND CONTROL NCDS IN THE WESTERN PACIFIC REGION IN 2019
29
Availability of procedures for treating NCDs
Overall, the most common NCD-related treatment procedures available (defined as present in 50% or more of health care facilities) in the publicly funded health system are thrombolytic therapy (65%), retinal photocoagulation (62%) and renal replacement therapy by dialysis (53%). Bone marrow transplantation (30%), renal replacement by transplantation (32%) and coronary bypass (41%) are the least common procedures. There is marked variation across country subgroups. In HICs, most of the treatment procedures are available (88–100%). In contrast, renal replacement by transplantation and bone marrow transplantation are much less available among LMICs and PICs, and coronary bypass and stenting are less readily available in PICs (Fig. 12).
Retinalphotocoagulation
Renal replacementtherapy by dialysis
Renal replacementby transplantation
Coronary bypass
Coronary stenting
Thrombolytic therapy
Bone marrowtransplantation
HICs: high-income countries; LMICs: low- and middle-income countries; PICs, Pacific island countries and areas* Defined as present in 50% or more of health-care facilities.
Pro
cedu
res
avai
labl
e
Percentage of countries and areas responding
0% 25% 50% 75% 100%
HICsLMICsPICs
Figure 12. Percentage of countries and areas with procedures available* for treating NCDs
HICs: high-income countries; LMICs: low- and middle-income countries; PICs, Pacific island countries and areas* Defined as present in 50% or more of health-care facilities.
Can
cer
serv
ices
ava
ilabl
e Cancer centres/
depts at tertiary level
Pathology services
Cancer surgery
Chemotherapy
Radiotherapy
Percentage of countries and areas responding
0% 25% 50% 75% 100%
HICs (N=8)LMICs (N=7)PICs (N=19)

PROGRESS ON THE PREVENTION AND CONTROL OF NONCOMMUNICABLE DISEASES IN THE WESTERN PACIFIC REGION
30
Availability of palliative care for patients with NCD in the public sector
Sixteen of 34 countries and areas (47%) in the Region make palliative care available in the public sector. Community/home-based palliative care is more common in HICs (88%) and less common in LMICs (14%) (Table 14).
Cardiovascular risk stratification for the management of heart attack and stroke
Eighteen countries and areas (53%) reported that cardiovascular risk stratification for the management of heart attack and stroke is available in more than 50% of primary health care facilities. Nineteen of countries and areas (70%) who conduct risk stratification use the WHO/International Society of Hypertension (ISH) cardiovascular risk prediction charts (Fig. 13).
Availability of services for stroke in public sector
Provision of care for acute stroke is available in 26 of 34 countries and areas (76%) in the Region. Rehabilitation for stroke patients is available in 24 countries and areas (71%); the majority (88%) of HICs offer rehabilitation post stroke, compared to only 57% of LMICs and 68% of PICs.
Rheumatic fever and rheumatic heart disease patient registries
A total of 59% of countries and areas in the Region have a rheumatic fever/rheumatic heart disease registry; 90% of these incorporate a follow-up/recall system to deliver long-term penicillin prophylaxis. Registries are most frequently reported by PICs (89%); only two HICs and one LMIC have rheumatic heart disease registries (Table 15).

2. STATUS OF RESPONSE TO PREVENT AND CONTROL NCDS IN THE WESTERN PACIFIC REGION IN 2019
31
Table 14. Number of countries and areas with available* palliative care for patients with NCDs in the public sector
HICs LMICs PICs Total
Palliative care availability N=8 N=7 N=19 N=34
Primary health care 5 (63%) 2 (29%) 9 (47%) 16 (47%)
Community/home-based care 7 (88%) 1 (14%) 8 (42%) 16 (47%)
HICs: high-income countries; LMICs: low- and middle-income countries; PICs: Pacific island countries and areas * Defined as present in 50% or more of health care facilities.
HICs: high-income countries; LMICs: low- and middle-income countries; PICs: Pacific island countries and areas
Per
cent
age
of c
ount
ries
and
are
as r
espo
ndin
g
0%
18%
35%
53%
70%
Proportion of primary health-care facilities at country level
None or don't know <25% 25%-50% >50%
HICsLMICsPICs
Figure 13. Percentage of countries and areas with primary health care facilities for cardiovascular risk stratification and its availability at country level
Table 15. Number of countries and areas with available* patient registries for rheumatic fever and rheumatic heart disease
HICs LMICs PICs Total
N=8 N=7 N=19 N=34
Rheumatic fever and heart disease register 2 (25%) 1 (14%) 17 (89%) 20 (59%)
Follow-up/recalls to deliver meds 2 (100%) 1 (100%) 15 (88%) 18 (90%)
HICs: high-income countries; LMICs: low- and middle-income countries; PICs: Pacific island countries and areas * Defined as present in 50% or more of health care facilities.

32
KEY FINDINGS AND PROGRESS IN COUNTRY CAPACITY FOR THE PREVENTION AND CONTROL OF NCDS
Public health infrastructure, partnership and multisectoral collaboration for NCDs and their risk factors
Most (94%) countries and areas in the Region have an NCD unit/branch or department for NCDs and their risk factors. Two thirds of those units (78%) have more than five full-time technical staff for NCDs. Funding for primary health care services for NCD activities is available in all of the respondent countries and areas. Funding for health promotion, early detection/screening, health care and treatment are also commonly available in the Region (97%). General government revenues (62%) are the most common major sources of funding. Tobacco taxation (94%) is the most frequently reported fiscal intervention, followed by alcohol taxation (82%). Two thirds of the countries and areas (62%) have multisectoral NCD commissions, with 80% of these already operational.
Status of NCD policies, strategies and action plans
A total of 91% of countries and areas in the Region include NCDs in their national health plans, and 68% include NCDs in their national development plans. Most of the countries and areas (88%) have integrated national policies and plans, and 97% consider their plans to be operational. About half of countries and areas have stand-alone disease-specific policies or plans for cancer (59%) and oral health (50%). Half have stand-alone risk factor–specific plans for quitting use of tobacco products and promoting healthy diet.
A. Key findings
CHAPTER 3

3. KEY FINDINGS AND PROGRESS IN COUNTRY CAPACITY FOR THE PREVENTION AND CONTROL OF NCDS
33
Health information systems, surveillance and surveys for NCDs and their risk factors
Mortality data are collected by most of the countries in the Region (91%), and all countries collecting mortality data have a civil/vital registration system. However, only about two thirds of countries generate reliable population-based mortality data on a routine basis. The majority (85%) of countries and areas have cancer registries, but only 62% are population-based registries, and only 55% have national coverage.
Periodic national adult risk factor surveys for the main prevention of NCD risk factors (harmful alcohol use, unhealthy diet, physical inactivity, tobacco use, raised blood glucose/diabetes, raised total cholesterol, raised blood pressure/hypertension, overweight and obesity, and salt/sodium intake) are conducted in most of the countries and areas in the Region. The least collected information is on salt/sodium intake.
Capacity for early detection, treatment and care within the health system
Evidence-based national guidelines, protocols and standards for the management of diabetes and CVD are the most commonly available disease-specific guidelines in the Region. For risk factor management (prevention), tobacco dependence guidelines are the most common, while alcohol dependence guidelines are available in only 10 out of 34 countries and areas (29%). Weight and height measurements and blood pressure monitoring are readily available. Other basic technologies for early NCD detection are least likely to be reported by LMICs.
Cervix cancer screening programme is the most common cancer screening programme in the Region, followed by breast cancer screening. HPV vaccination is included in the national vaccination programme for 22 out of 34 countries and areas (65%); however, only half of these vaccination programmes cover more than 50% of the eligible population. Aspirin and metformin are the most commonly available essential medicines in the Region, while oral morphine and nicotine replacement therapy are the least common.
The number of countries with an integrated NCD policy, strategy or plan has increased from previous years. Likewise, the numbers of countries reporting NCD risk factor–specific policies or plans increased from 2017. Policies and plans that address overweight and obesity are least likely to be reported overall. Surveillance systems on NCD risk factors have maintained their 2017 levels, with all the countries and areas collecting information on most of the NCD risk factors, except for the measurement of total cholesterol. No significant changes in clinical guidelines and interventions are observed in 2019.
B. Progress in country capacity for the prevention and control of NCDs

PROGRESS ON THE PREVENTION AND CONTROL OF NONCOMMUNICABLE DISEASES IN THE WESTERN PACIFIC REGION
34
More countries and areas are sourcing their NCD funding from general government revenues compared to previous years, and fewer are relying on international donors. However, the number of countries and areas utilizing earmarked taxes and health insurance to support NCD programmes and services remains low. Fiscal interventions on tobacco and alcohol are unchanged from previous years, but more countries are reporting taxes on SSBs and unhealthy foods. There is considerable room to expand fiscal interventions as both a source for additional financial support for NCD prevention and control, as well as a population behaviour change lever to reduce unhealthy consumption and NCD risk. Table 16 presents information from the six rounds of the NCD CCS on selected indicators that may be compared from 2004 to 2019.
WHO published an NCD Progress Monitor in 2015, 2017 and 2019. These outline the progress of countries in implementation of the four time-bound commitments included in the 2014 UN General Assembly Outcome Document on NCDs, specifically on the 10 progress monitoring indicators (Fig. 14).
In addition to the 27 Member States with country profiles included in the NCD Progress Monitor 2019, the seven areas in the Region that participated in the survey were also reviewed and assessed and included in the summary in Table 17. For each indicator, the following symbols denote achievement:
○ = Not achieved, ◐ = Partially achieved, ● = Fully achieved* = No data, DK = Don’t know, NR = No response
Assessment of indicators was taken from Member State responses to the 2019 NCD CCS and additional sources from the WHO Global database on the Implementation of Nutrition Action (GINA), Global Nutrition Policy Review 2016–2017, the WHO mortality database, WHO Report on the Global Tobacco Epidemic 2019, global survey on progress on Sustainable Development Goal (SDG) health target 3.5 in 2016/2019, and Marketing of Breast-milk Substitutes: National Implementation of the International Code Status Report 2018. A detailed description of the indicators and country statuses are presented in Annex 3.
Countries and areas in the Region have made considerable progress in having a set of time-bound NCD targets based on the NCD Global Monitoring Framework for NCDs, with 17 countries and areas that have fully achieved this indicator, and seven having partially achieved it.
Almost all (7/8) HICs in the Region have reliable cause-specific mortality data generated from a functioning system on a routine basis, but only one LMIC and two PICs have achieved this indicator.
Less than half (13/34) of Western Pacific countries and areas have conducted a periodic adult NCD risk factor survey with at least five years interval between surveys.
C. Ten progress monitoring indicator

3. KEY FINDINGS AND PROGRESS IN COUNTRY CAPACITY FOR THE PREVENTION AND CONTROL OF NCDS
35
Table 16. Comparison of country capacity indicators in 2004, 2010, 2013, 2015, 2017 and 2019
Year of survey 2004 2010 2013 2015 2017 2019
Number of tools sent 37 37 37 36 36 36
Number of responses 28 35 36 32* 35* 34*
Response rate 76% 94% 97% 89% 97% 94%
NCD policy and programme infrastructure
Number of countries with a national NCD entity
14 (50%) 32 (91%) 36 (100%) 29 (91%) 33 (94%) 32 (94%)
Number of countries with an integrated NCD policy/strategy or action plan
15 (54%) 28 (80%) 33 (92%) 28 (88%) 27 (77%) 30 (88%)
Number of countries with policies, strategies, action plans specific to:
Tobacco control 22 (79%) 29 (83%) 31 (86%) 24 (75%) 24 (69%) 17 (91%)
Harmful use of alcohol 12 (43%) 19 (54%) 22 (61%) 15 (47%) 19 (54%) 31 (91%)
Nutrition/unhealthy diet 17 (61%) 23 (66%) 25 (69%) 20 (63%) 19 (54%) 30 (88%)
Physical activity 9 (32%) 21 (60%) 23 (64%) 13 (41%) 15 (43%) 32 (94%)
Overweight and obesity – 18 (51%) 21 (58%) 9 (28%) 13 (37%) 14 (41%)
Cancer 12 (43%) 23 (66%) 26 (72%) 21 (66%) 26 (74%) 20 (59%)
Surveillance and monitoring
Number of countries with surveillance system for:
Tobacco use 17 (61%) 31 (89%) 36 (100%) 32 (100%) 35 (100%) 34 (100%)
Harmful use of alcohol 13 (46%) 29 (83%) 34 (94%) 32 (100%) 35 (100%) 34 (100%)
Unhealthy diet 12 (43%) 30 (86%) 35 (97%) 32 (100%) 35 (100%) 34 (100%)
Physical activity 12 (43%) 27 (77%) 36 (100%) 32 (100%) 35 (100%) 34 (100%)
Diabetes 18 (64%) 28 (80%) 34 (94%) 31 (97%) 35 (100%) 34 (100%)
Hypertension 17 (61%) 29 (83%) 34 (94%) 30 (94%) 35 (100%) 34 (100%)
Overweight and obesity 15 (54%) 30 (86%) 35 (97%) 32 (100%) 35 (100%) 34 (100%)
Dyslipidaemia 10 (29%) 25 (71%) 31 (86%) 28 (88%) 33 (94%) 31 (91%)
Clinical interventions
Number of countries with clinical protocols or guidelines for
Diabetes 18 (64%) 33 (94%) 33 (92%) 28 (88%) 31 (89%) 31 (91%)
Cancer 12 (43%) 23 (66%) 26 (72%) 22 (69%) 20 (57%) 18 (55%)
Availability of statins – 24 (69%) 31 (86%) 25 (78%) 27 (77%) 25 (74%)
* From 2019, the validation process was employed during data collection; hence, 34 out of 34 countries and areas completely validated their submission. This is a higher validation rate compared to previous years, with 27 of 35 countries and areas in 2017, and only 15 of 32 responding countries and areas in 2015.

PROGRESS ON THE PREVENTION AND CONTROL OF NONCOMMUNICABLE DISEASES IN THE WESTERN PACIFIC REGION
36
Sixteen of 34 countries and areas have developed an operational multisectoral national strategy or action plan that integrates all the major NCDs and their risk factors. Ten countries and areas have partially achieved this indicator, integrating at least two of the four major NCDs and two of the four main NCD risk factors in their NCD strategies or action plans.
Implementation of plain or standardized packaging and/or large graphic warnings on all tobacco packages remains the most widespread demand-reduction measure of the WHO Framework Convention on Tobacco Control (WHO FCTC) in the Region, with 14 countries and areas fully achieving and 10 partially achieving this indicator. Tobacco taxation needs strengthening in the Region since only three countries and areas marked this as fully achieved and 11 have not achieved this indicator.
For alcohol harm reduction, only a few countries (4/34) reported full achievement on commercial and public availability, enforcing bans or comprehensive restrictions on advertising (2/34) and taxation (6/34). Bans or comprehensive restrictions on exposure to alcohol advertising are the least adopted alcohol reduction measure, with 15 countries and areas reporting no achievement under this indicator.
For addressing unhealthy diets, the WHO set of recommendations on the marketing of foods and non-alcoholic beverages to children is the most common approach adopted in the Region, with 11 countries and areas reporting they have achieved this. However, countries and areas in the Region have to implement more legislation or policies that limit saturated fatty acids and eliminate industrially produced trans-fatty acids in the food supply; 27 out of 34 countries reported no achievement in this indicator.
Having a national public awareness programme on physical activity is the second most widely implemented intervention in the Region, with half of the countries and areas (16/34) implementing at least one recent national public awareness and motivational communication for physical activity, including mass media campaigns for physical activity behaviour change.
Under health systems strengthening to address NCDs through people-centred primary health care and universal health coverage, evidence-based guidelines for the management of the major NCDs are prevalent in the Region, with a third of the countries and areas in the Region (12/34) having guidelines on all the major NCDs, while almost half (16/34) have guidelines on at least two of the four major NCDs.
Provision of drug therapy and counselling for eligible persons at high risk to prevent heart attack and stroke has also advanced in the Region, with 15 countries and areas having fully achieved this indicator and three countries and areas meeting the criteria for partial achievement.
Overall, the time-bound commitment on setting NCD targets for 2025 remains the most widely implemented and fully achieved indicator (17/34) amongst the 10 progress monitoring indicators in the Western Pacific Region. The Region needs to accelerate progress for the other indicators, however, as achievement rates remain low and the deadline for achieving the targets is nearing.
More than 10 out of 34 countries and areas in the Region have fully achieved the indicators on having reliable cause-specific mortality data, periodic NCD risk factor surveys, integrated NCD policy, multisectoral national strategy/action plan, plain/standardized packaging of tobacco products, restrictions on marketing to children, promoting physical activities, evidence-based national guidelines, and provision of drug therapy, with a noteworthy number of countries and areas partially achieving these indicators as well.

3. KEY FINDINGS AND PROGRESS IN COUNTRY CAPACITY FOR THE PREVENTION AND CONTROL OF NCDS
37
However, progress is needed in adoption of bans on alcohol advertising and reducing unhealthy diets (reducing salt/sodium intake, limiting saturated fatty acids/trans-fats, limiting marketing to children, and legislation of breast-milk substitutes) since more than half of respondents reported no achievement in these indicators.
Figure 14. WHO 10 progress monitoring indicators on NCDs
GETTING TO 2018: PROGRESS MONITOR ON NCDSPREPARING FOR THE THIRD UN HIGH-LEVEL MEETING ON NCDS
The WHO Director-General will use the following 10 progress indicators to report, by the end of 2017, to the United Nations General Assembly on the progress achieved in the implementation of the four time-bound commitments included in the 2014 UN Outcome Document on NCDs:
4 Member State has an operational multisectoral national strategy/action plan that integrates the major NCDs and their shared risk factorsBY
2015Consider developing national multisectoral policies and plans to achieve the national targets by 2025
9 Member State has evidence-based national guidelines/protocols/standards for the management of major NCDs through a primary care approach, recognized/approved by government or competent authorities
10 Member State has provision of drug therapy, including glycaemic control, and counselling for eligible persons at high risk to prevent heart attacks and strokes, with emphasis on the primary care level
BY2016
Strengthen health systems to address NCDs through people-centred primary health care and universal health coverage, building on guidance set out in WHO Global NCD Action Plan
Time-bound commitments Indicators
BY2015
Consider setting national NCD targets for 2025 1 Member State has set time-bound national targets and indicators based on
WHO guidance
2 Member State has a functioning system for generating reliable cause-specific mortality data on a routine basis
3 Member State has a STEPS survey or a comprehensive health examination survey every 5 years
BY2016
8 Member State has implemented at least one recent national public awareness programme on diet and/or physical activity
Reduce risk factors for NCDs, building on guidance set out in the WHO Global NCD Action Plan
5 Member State has implemented the following four demand-reduction measures of the WHO FCTC at the highest level of achievement:
a. Reduce affordability of tobacco products by increasing tobacco excise taxesb. Create by law completely smoke-free environments in all indoor workplaces,
public places and public transportc. Warn people of the dangers of tobacco and tobacco smoke through effective
health warnings and mass media campaignsd. Ban all forms of tobacco advertising, promotion and sponsorshipe
6 Member State has implemented, as appropriate according to national circumstances, the following three measures toreduce the harmful use of alcohol as per the WHO Global Strategy to Reduce the Harmful Use of Alcohol:
a. Regulations over commercial and public availability of alcoholb. Comprehensive restrictions or bans on alcohol advertising and promotionsc. Pricing policies such as excise tax increases on alcoholic beverages
7 Member State has implemented the following four measures to reduce unhealthy diets:
a. Adopted national policies to reduce population salt/sodium consumptionb. Adopted national policies that limit saturated fatty acids and virtually eliminate
industrially produced trans-fatty acids in the food supplyc. WHO set of recommendations on marketing of foods and non-alcoholic
beverages to childrend. Legislation /regulations fully implementing the International Code of Marketing
of Breast-milk Substitutes

PROGRESS ON THE PREVENTION AND CONTROL OF NONCOMMUNICABLE DISEASES IN THE WESTERN PACIFIC REGION
38
Table 17. Achievement status of the NCD progress monitoring indicators in the Western Pacific Region
No. Country/area Progress monitoring indicator
1 2 3 4 5a 5b 5c 5d 5e 6a 6b 6c 7a 7b 7c 7d 8 9 10
High-income countries and areas
1 Australia ○ ● ◐ ○ ● ● ● ◐ ● ◐ ○ ○ ◐ ◐ ● ○ ● ● DK
2 Brunei Darussalam
● ● ● ● NA ● ● ◐ ● ● ● ● ○ ○ ○ ○ ● ◐ ●
3 Hong Kong SAR (China)
● ◼ ◐ ◐ ◼ ◼ ◼ ◼ ◼ ◼ ◼ ◼ ● ● ● ◼ ● ◐ ●
4 Japan ● ● ● ● ◐ ◐ ◐ ○ ◐ ◐ ○ ◐ ○ ○ ○ ○ DK DK DK
5 Macao SAR (China)
○ ◼ ◐ ◐ ◼ ◼ ◼ ◼ ◼ ◼ ◼ ◼ ◐ ○ ○ ◼ ● ◐ ●
6 New Zealand ○ ● ◐ ○ ● ● ● ◐ ● ◐ ○ ● DK ○ ● ○ ○ ● ●
7 Republic of Korea
● ● ● ◐ ◐ ○ ◐ ○ ● ◐ ● ◐ ● ◐ ● ◐ ● ◐ ●
8 Singapore ◐ ● ◐ ◐ ◐ ◐ ● ◐ ◐ ◐ ○ ◐ ● ● ● ○ ● ● DK
Low- and middle-income countries and areas
1 Cambodia ● ○ ● ○ ○ ● ● ◐ ◐ NR ○ NR ○ ○ ○ ◐ ○ ◐ ○
2 China ● ◐ ● ● ◐ ○ ◐ ◐ ◐ ◐ ○ ○ ◐ ○ ○ ◐ ● ● ●
3 Lao People’s Democratic Republic
◐ ○ ◐ ● ○ ● ● ◐ NR ○ ○ ○ ○ ○ ○ ◐ ○ ● ○
4 Malaysia ● ◐ ● ◐ ◐ ○ ● ◐ NR ◐ ◐ ◐ ● ○ ● ○ ● ● ●
5 Mongolia ● ◐ ● ● ○ ◐ ● ● NR ◐ ○ ◐ ● ◐ ● ◐ ○ ● ◐
6 Philippines ● ● ◐ ● ◐ ◐ ● ◐ ◐ ◐ ○ ● ○ ○ ● ● ◐ ○ ○
7 Viet Nam ● ○ ● ● ○ ◐ ● ◐ ● ◐ ◐ ◐ ● ○ ○ ● ● ● ○
Pacific island countries and areas
1 American Samoa
NR ◼ NR NR ◼ ◼ ◼ ◼ ◼ ◼ ◼ ◼ NR NR NR ◼ NR NR NR
2 Cook Islands ● ● ◐ ● ◐ ◐ ◐ ◐ ○ NR NR NR ○ ○ ● ○ ● ◐ ●
3 Fiji ● ◐ ◐ ◐ ○ ◐ ● ◐ ● NR NR NR ◐ ○ ○ ◐ ● ◐ ○
4 French Polynesia
○ ◼ ◐ ● ◼ ◼ ◼ ◼ ◼ ◼ ◼ ◼ ● DK ● ◼ ○ ● ○
5 Guam ● ◼ ◐ ● ◼ ◼ ◼ ◼ ◼ ◼ ◼ ◼ ◐ ○ ○ ◼ ● ● ◐
6 Kiribati ◐ ● ◐ ● ○ ◐ ◐ ● ○ ◐ ○ ◐ ○ ○ ● ○ ◐ ◐ ●
7 Marshall Islands
○ ○ ◐ ○ ◐ ● ○ ○ NR ◐ ○ ● ○ ○ ○ ○ ◐ ○ ○
8 Federated States of Micronesia
○ ○ ◐ ◐ ○ ◐ ○ ◐ ○ ◐ ◐ ◐ ○ ○ ○ ○ ◐ ◐ ●
9 Nauru ● ○ ● ● ○ ● ◐ ◐ NR NR NR NR ○ ○ ○ ○ ○ ◐ ◐
10 New Caledonia ○ ◼ ◐ ○ ◼ ◼ ◼ ◼ ◼ ◼ ◼ ◼ ○ ○ ○ ◼ ● ○ DK

3. KEY FINDINGS AND PROGRESS IN COUNTRY CAPACITY FOR THE PREVENTION AND CONTROL OF NCDS
39
No. Country/area Progress monitoring indicator
1 2 3 4 5a 5b 5c 5d 5e 6a 6b 6c 7a 7b 7c 7d 8 9 10
11 Niue ○ ○ ◐ ○ ● ● ◐ ● ○ NR NR NR ○ ○ ○ ○ ○ ◐ ○
12 Commonwealth of the Northern Mariana Islands
○ ◼ ● ○ ◼ ◼ ◼ ◼ ◼ ◼ ◼ ◼ ○ ○ ○ ◼ ● ◐ ●
13 Palau ◐ ○ ◐ ◐ ◐ ◐ ○ ◐ ◐ NR NR NR ◐ ◐ ○ ● ◐ ● ●
14 Papua New Guinea
◐ ○ ○ ◐ ◐ ● ◐ ◐ ○ ◐ ○ ◐ ○ ○ ○ ◐ ◐ ◐ ○
15 Samoa ○ ○ ◐ ● ○ ◐ ● ◐ ◐ ● ○ ● ◐ ○ ○ ○ ● NR ○
16 Solomon Islands
● ○ ● ● ○ ◐ ● ◐ ○ NR NR NR ○ ○ ○ ◐ ○ ◐ ○
17 Tokelau ◐ ◼ ● ◐ ◼ ◼ ◼ ◼ ◼ ◼ ◼ ◼ ○ ○ ○ ◼ ○ ○ ●
18 Tonga ● ○ ● ● ◐ ◐ ◐ ◐ ● ● ○ ◐ ○ ○ ○ ○ ● ● ●
19 Tuvalu ◐ ○ ◐ ○ ○ ◐ ◐ ● ○ NR NR NR ○ ○ ○ ○ ◐ ◐ ●
20 Vanuatu ● ○ ◐ ● ◐ ○ ● ● ○ ● ○ ● ○ ○ ○ ○ ○ ◐ ○
21 Wallis and Futuna
NR ◼ ◼ ◼ ◼ ◼ ◼ ◼ ◼ ◼ ◼ NR NR NR NR ◼ NR NR NR
Fully achieved 17 9 13 16 3 9 14 5 7 4 2 6 7 2 11 3 16 12 15
Partially achieved 7 4 20 10 12 14 10 19 7 14 3 10 7 4 0 8 7 16 3
Not achieved 10 14 1 8 11 4 3 3 8 1 15 3 19 27 23 16 10 4 12
○ = Not achieved
◼ = No data
NA = Not Applicable
◐ = Partially achieved
DK = Don’t know
● = Fully achieved
NR = No response

40
REGIONAL RESPONSE AND WAY FORWARD
WHO supported Member States of the Region in developing multisectoral action plans or strategies for NCD prevention and control. National plans were endorsed in eight countries: Cook Islands, Fiji, Nauru, Palau, Papua New Guinea, Tonga, Vanuatu and Viet Nam. A joint mission of the UN Interagency Task Force (UNIATF) on NCD prevention and control was dispatched to Tonga in 2015, to Mongolia in 2015 and 2016, and to Viet Nam in 2016. In June 2017, the UN Global Joint Programme on Cervical Cancer Prevention and Control conducted a mission in Mongolia to develop and sustain high-quality comprehensive cervical cancer control programmes.
Four countries were selected for accelerated implementation of multisectoral action plans to reduce risk factors and manage NCD cases at the primary care level with integrated support and expertise from the three organizational levels of WHO. This is supported by the “One WHO” NCD mechanism. Mongolia, the Philippines, Tonga and Viet Nam have committed to making fast-track progress in 2017 and 2018 towards achieving the nine voluntary global targets for NCDs by 2025 and the NCD-related targets of the SDGs by 2030.
The Regional Workshop on Strengthening Leadership and Advocacy for the Prevention and Control of Noncommunicable Diseases (LeAd-NCD), launched in 2013, is the first and only regional leadership programme on NCD prevention and control. Recent topics covered by the Sixth LeAd-NCD include legal/legislative framework strengthening.
Capacity-building for cancer control is a priority in the Western Pacific Region and the yearly Workshop on Leadership and Capacity-building for Cancer Control (CanLEAD) that also started in 2013 has focused on cervical cancer and early cancer diagnosis. Since the second workshop, this initiative has expanded to include global participants. The latest workshop, the Fifth CanLEAD, was hosted by the Republic of Korea and included 13 countries and four WHO regions.
A. Regional response
CHAPTER 4

4. REGIONAL RESPONSE AND WAY FORWARD
41
The Regional Framework for Urban Health in the Western Pacific (2016–2020): Healthy and resilient cities was endorsed by the WHO Regional Committee for the Western Pacific in 2015. More recently, the Regional Action Plan on Health Promotion in the Sustainable Development Goals: 2018–2030, was endorsed at the 68th session of the Regional Committee in 2017; this plan presents a menu of practical health promotion actions to achieve the SDGs. The 8th Alliance for Healthy Cities Global Conference and General Assembly was co-hosted by the Alliance and the city of Kuching South, Malaysia, in October 2018. Four priority cities in the Region, beneficiaries of the WHO–Macao Healthy Cities Leadership Programme – Cambodia, the Lao People’s Democratic Republic, Mongolia and the Philippines – received funding to participate in the Conference.
Action on risk factors is a priority for all countries.
While much progress has been made in tobacco control, countries and areas are increasingly facing aggressive tobacco industry interference and marketing of emerging products, including heated tobacco products and electronic nicotine delivery systems. The Regional Action Plan for Tobacco Control in the Western Pacific (Tobacco Control 2020–2030) was developed through close consultation with regional experts and Member States to address emerging challenges while aligning the focus with existing global strategies and goals. The new Regional Action Plan will serve as an updated and robust road map for the Region’s tobacco control strategy. It was fully endorsed by the Regional Committee in October 2019.
To encourage the private sector to protect its workers and create healthy productive workplaces, the smoke-free workplace campaign (Revolution Smoke-Free) was initiated in July 2019. To date, the campaign has been launched in six countries (Cambodia, China, Japan, Malaysia, Mongolia and the Philippines) and generated more than 400 pledges from companies across the Region.
The Western Pacific Regional Office continued its support for annual workshops on tobacco cessation through the WHO collaborating centres in Beijing and Hong Kong SAR (China), to train tobacco control programme managers and health care professionals to provide comprehensive cessation support.
Support for tobacco surveillance continued through the Global Tobacco Surveillance System. The Global Adult Tobacco Survey (GATS) was implemented in 2018 in China; the report was launched in 2019. Preparation for a repeat GATS was initiated in Malaysia and the Philippines. Technical assistance for the Global Youth Tobacco Survey (GYTS) (preparation, data collection and analysis) was provided to Brunei Darussalam, Cambodia, Guam, Kiribati, the Lao People’s Democratic Republic, Macao SAR (China), the Marshall Islands, the Federated States of Micronesia, Mongolia, Niue, Palau, Papua New Guinea, the Philippines, Samoa, Tuvalu and Vanuatu.
The Regional Action Framework on Protecting Children from the Harmful Impact of Food Marketing in the Western Pacific (7) was endorsed during the 70th session of the Regional Committee in October 2019 to accelerate the support to Member States. Technical support on the implementation of the WHO set of recommendations on the marketing of foods and non-alcoholic beverages to children was provided for the development of policy in the Philippines. A background document was also developed that led to the endorsement of the resolution on Protecting Children from the Harmful Impact of Food Marketing. PICs (Kiribati, Nauru, Solomon Islands and Tuvalu) were also supported in the inclusion of nutrition-related questions, which include questions

PROGRESS ON THE PREVENTION AND CONTROL OF NONCOMMUNICABLE DISEASES IN THE WESTERN PACIFIC REGION
42
on the consumption of SSBs. Salt-reduction activities are also gaining popularity as a means to meet the commitment to the associated global targets on salt/sodium and raised blood pressure. Countries particularly supported by the Regional Office in salt-reduction activities include China, the Federated States of Micronesia, Mongolia and Viet Nam. Brunei Darussalam and Malaysia have piloted a technical package developed by WHO headquarters to increase population physical activity.
The Regional Action Plan on Health Promotion in the Sustainable Development Goals (2018–2030) was endorsed during the Regional Committee session in October 2017 to increase the attention on health promotion. Healthy settings initiatives were intensified in the Region, including health-promoting schools (Cambodia, Fiji and Tonga), healthy cities (Cambodia, Mongolia, the Philippines and Viet Nam) and healthy islands and villages (Cook Islands, Fiji, Kiribati, the Federated States of Micronesia, Solomon Islands and Vanuatu). Health literacy has been strengthened (Brunei Darussalam and Vanuatu), capacity-building on communication for behaviour change was provided to Mongolia, Viet Nam and the PICs, and physical activity communication toolkits for cities were prepared.
WHO continues to support Member States in implementation of the Package of Essential Noncommunicable (PEN) Disease Interventions. Actions on streamlining services to strengthen primary health care continue to be rolled out. The WHO PEN Disease Interventions for Primary Health Care in Low-resource Settings is being implemented throughout the Region. Mongolia was supported in launching a national version of WHO PEN. In addition, Member States have been supported to strengthen national capacity for cancer prevention and control. A regional meeting on the elimination of cervical cancer – a priority under the WHO Thirteenth General Programme of Work 2019–2023 – was organized in June 2019 in Manila, Philippines. Participants reviewed and provided feedback on a draft global strategy to accelerate cervical cancer elimination, which was submitted to the WHO Executive Board in January 2020 for consideration by the World Health Assembly in May 2020.
WHO PEN will be further developed to provide guidance and tools to assess needs and capacity, implement essential NCD interventions, evaluate impact, and strengthen health systems and human resource capacity in primary health care, with a special focus on primary care (first contact) level. The components being developed and validated include protocols for clinical diagnosis and treatment, tools for risk prediction of heart attack and stroke, guidance on minimum requirements for essential medicines and affordable technologies, standards and indicators to measure progress of implementation and impact of WHO PEN.
Surveillance systems to monitor NCD risk factors and disease trends have been strengthened for planning, implementation, reporting and dissemination of NCD risk factor surveys such as the WHO STEPwise approach to surveillance (STEPS) survey and the Global School-based Student Health Survey (GSHS). The STEPS survey was implemented in Cambodia (2016), Nauru (2016), Palau (2016), American Samoa (2017), the Marshall Islands (2017), Tonga (2017), French Polynesia (2019), Mongolia (2019) and Wallis and Futuna (2019). The GSHS was also implemented in Vanuatu (2016), Samoa (2017) and Tonga (2017).
To ensure high-quality, reliable NCD data, a regional workshop has been held on NCD surveillance and monitoring every two years since 2014 to update progress on the four time-bound national commitments and the nine voluntary global targets for NCD. Moreover, the WHO Regional Office for the Western Pacific has implemented a more rigorous data validation process in the recent CCS, and the validation rate for the survey was 100% in the 2019 report.

4. REGIONAL RESPONSE AND WAY FORWARD
43
Cancer registration was strengthened in the Region, with workshops organized from 2014 onwards in Cambodia, Fiji, French Polynesia, the Lao People’s Democratic Republic, Nauru, Papua New Guinea, the Philippines, Samoa, Solomon Islands, Tonga and Viet Nam. In-country training support for cancer registration was also provided from 2014 to 2016 to Brunei Darussalam, Fiji, Papua New Guinea and Viet Nam.
The WHO NCD-GAP, endorsed during the Sixty-sixth World Health Assembly, has been extended by the Seventy-second World Health Assembly to 2030 in order to ensure its alignment with the 2030 Agenda for Sustainable Development. Following this, the Western Pacific Regional Action Plan for the Prevention and Control of Noncommunicable Diseases (2014–2020), endorsed during the 64th session of the Regional Committee.
Both global and regional NCD action plans will be updated based on results from a mid-point evaluation of the NCD-GAP which was presented at the Seventy-third World Health Assembly in May 2020. The mid-point evaluation will assess accomplishments of the NCD-GAP, as well as the lessons learned throughout its implementation in the Member States, by international partners, and the three levels of WHO. Findings from the mid-point evaluation will serve as inputs in the development of appropriate strategies in the Region.
Considering the new regional vision paper For the Future: Towards the Healthiest and Safest Region presented at the 70th session of the Regional Committee in October 2019, the WHO Regional Office for the Western Pacific conceptualized and operationalized a new approach to NCDs in the Region that is systematic, strategic and systems-oriented.
Three priority areas of work are:
1. strengthening the monitoring and surveillance systems for NCD with a focus on translating data collected to interventions that have an impact on health outcomes inequalities;
2. development of evidence-based health policies on the prevention of NCDs through “upstream” interventions that tackle NCD risk factors, using legislation and other policy initiatives, to address the regulatory, commercial and social determinants of health and apply health beyond health sector approaches; and
3. NCD management and prevention that is integrated and strengthened at the primary health care level as an integral part of universal health coverage moving from a reactive service to a holistic and predictive service approach.
Championing health beyond the health sector will be a critical way to operationalize
B. Way forward
PROGRESS ON THE PREVENTION AND CONTROL OF NONCOMMUNICABLE DISEASES IN THE WESTERN PACIFIC REGION
44
multisectoral action to prevent and respond to the burden of NCDs and promote health equity through legislative, policy and community interventions.
WHO’s support to countries will focus on the following common areas:
• Measuring and visualizing the changes and trends in healthy lifestyles and disease patterns occurring in each country and specific population groups (including through data disaggregated by gender and income group), to highlight the social and economic impact of the NCD epidemic.
• Curbing the surge of NCDs by leveraging cross-sectoral opportunities for reducing avoidable risks, with a focus on regulation and tax increases for tobacco products, alcohol and unhealthy food, as well as improving taxation for physical activity and creation of health promotion foundations, and stimulating healthy physical, food and social environments.
• Orienting health systems towards providing services focused on people, and that “accompany” them through the life course, protecting their mental, physical and reproductive health – including support for management of chronic illnesses such as diabetes and hypertension, as well as promoting health, prevention, rehabilitation and palliative care when needed.
45
REFERENCES
1. Causes of death, by WHO region [online database]. In: Global Health Observatory (GHO) data [website]. Geneva: World Health Organization; 2015 (http://www.who.int/gho/mortality_burden_disease/causes_death/region/en/, accessed 26 May 2020).
2. Resolution A/RES/66/2. Political Declaration of the High-level Meeting of the General Assembly on the Prevention and Control of Noncommunicable Diseases. In: Sixty-sixth United Nations General Assembly, New York; 19–20 September 2011 (https://undocs.org/en/%20A/RES/66/2, accessed 26 May 2020).
3. WHO global action plan for the prevention and control of NCDs 2013–2020. Geneva: WHO; 2013 (http://apps.who.int/iris/bitstream/10665/94384/1/9789241506236_eng.pdf, accessed 26 May 2020).
4. Western Pacific regional action plan for the prevention and control of noncommunicable diseases (2014–2020). Manila: WHO Regional Office for the Western Pacific; 2014 (http://www.wpro.who.int/noncommunicable_diseases/about/NCDRAP_2014-2020_full.pdf, accessed 26 May 2020).
5. Resolution A/Res/68/300. Outcome document of the high-level meeting of the General Assembly on the comprehensive review and assessment of the progress achieved in the prevention and control of noncommunicable diseases. In: Sixty-eighth United Nations General Assembly, New York; 10–11 July 2014 (https://undocs.org/A/RES/68/300, accessed 26 May 2020).
6. World Bank list of economies. Washington DC: World Bank; June 2017 (http://databank.worldbank.org/data/download/site-content/CLASS.xls, accessed 26 May 2020).
7. Regional action framework on protecting children from the harmful impact of food marketing in the Western Pacific. Manila: WHO Regional Office for the Western Pacific; 2020 (https://iris.wpro.who.int/handle/10665.1/14501).
CHAPTER 5
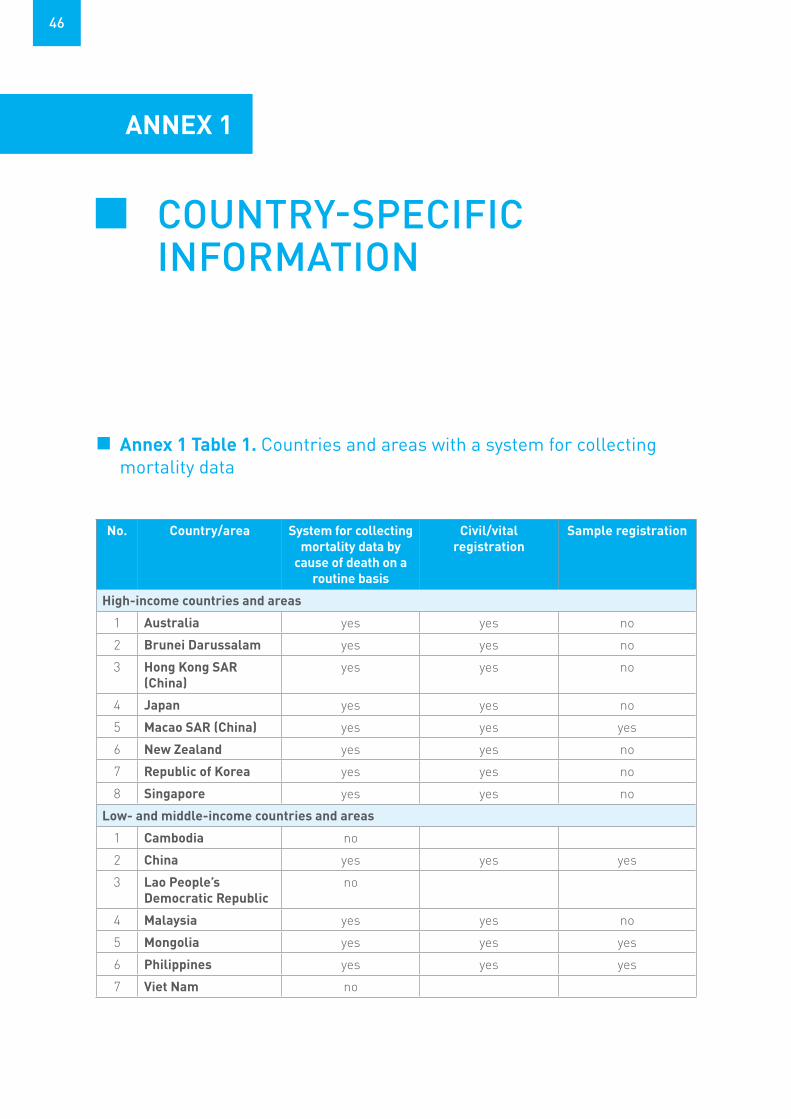
46
ANNEX 1
COUNTRY-SPECIFIC INFORMATION
No. Country/area System for collecting mortality data by
cause of death on a routine basis
Civil/vital registration
Sample registration
High-income countries and areas
1 Australia yes yes no
2 Brunei Darussalam yes yes no
3 Hong Kong SAR (China)
yes yes no
4 Japan yes yes no
5 Macao SAR (China) yes yes yes
6 New Zealand yes yes no
7 Republic of Korea yes yes no
8 Singapore yes yes no
Low- and middle-income countries and areas
1 Cambodia no
2 China yes yes yes
3 Lao People’s Democratic Republic
no
4 Malaysia yes yes no
5 Mongolia yes yes yes
6 Philippines yes yes yes
7 Viet Nam no
Annex 1 Table 1. Countries and areas with a system for collecting mortality data

ANNEX 1. COUNTRY-SPECIFIC INFORMATION
47
No. Country/area System for collecting mortality data by
cause of death on a routine basis
Civil/vital registration
Sample registration
Pacific island countries and areas
1 Cook Islands yes yes no
2 Fiji yes yes no
3 French Polynesia yes yes no
4 Guam yes yes yes
5 Kiribati yes yes no
6 Marshall Islands yes yes yes
7 Federated States of Micronesia
yes yes yes
8 Nauru yes yes no
9 New Caledonia yes yes no
10 Niue yes yes no
11 Commonwealth of the Northern Mariana Islands
yes yes no
12 Palau yes yes no
13 Papua New Guinea yes yes no
14 Samoa yes yes no
15 Solomon Islands yes yes no
16 Tokelau yes yes no
17 Tonga yes yes no
18 Tuvalu yes yes yes
19 Vanuatu yes yes yes

PROGRESS ON THE PREVENTION AND CONTROL OF NONCOMMUNICABLE DISEASES IN THE WESTERN PACIFIC REGION
48
No. Country/area Systems for recording patient
information
Electronic medical records/health
records systems
Coverage
High-income countries and areas
1 Australia yes yes national
2 Brunei Darussalam yes yes national
3 Hong Kong SAR (China)
yes yes subnational
4 Japan no
5 Macao SAR (China) yes yes national
6 New Zealand yes yes national
7 Republic of Korea yes yes subnational
8 Singapore yes yes national
Low- and middle-income countries and areas
1 Cambodia yes yes national
2 China yes yes national
3 Lao People’s Democratic Republic
no
4 Malaysia yes yes subnational
5 Mongolia yes yes national
6 Philippines yes yes subnational
7 Viet Nam yes yes subnational
Pacific island countries and area
1 Cook Islands yes yes national
2 Fiji yes no national
3 French Polynesia yes yes national
4 Guam yes no subnational
5 Kiribati yes yes subnational
6 Marshall Islands yes yes national
7 Federated States of Micronesia
yes no subnational
8 Nauru yes no national
9 New Caledonia no
10 Niue yes yes national
Annex 1 Table 2. Countries and areas with a system for recording patient information that includes NCD

ANNEX 1. COUNTRY-SPECIFIC INFORMATION
49
No. Country/area Systems for recording patient
information
Electronic medical records/health
records systems
Coverage
11 Commonwealth of the Northern Mariana Islands
yes yes national
12 Palau yes yes national
13 Papua New Guinea no
14 Samoa yes yes subnational
15 Solomon Islands yes no national
16 Tokelau yes no national
17 Tonga yes yes subnational
18 Tuvalu yes yes subnational
19 Vanuatu yes no national
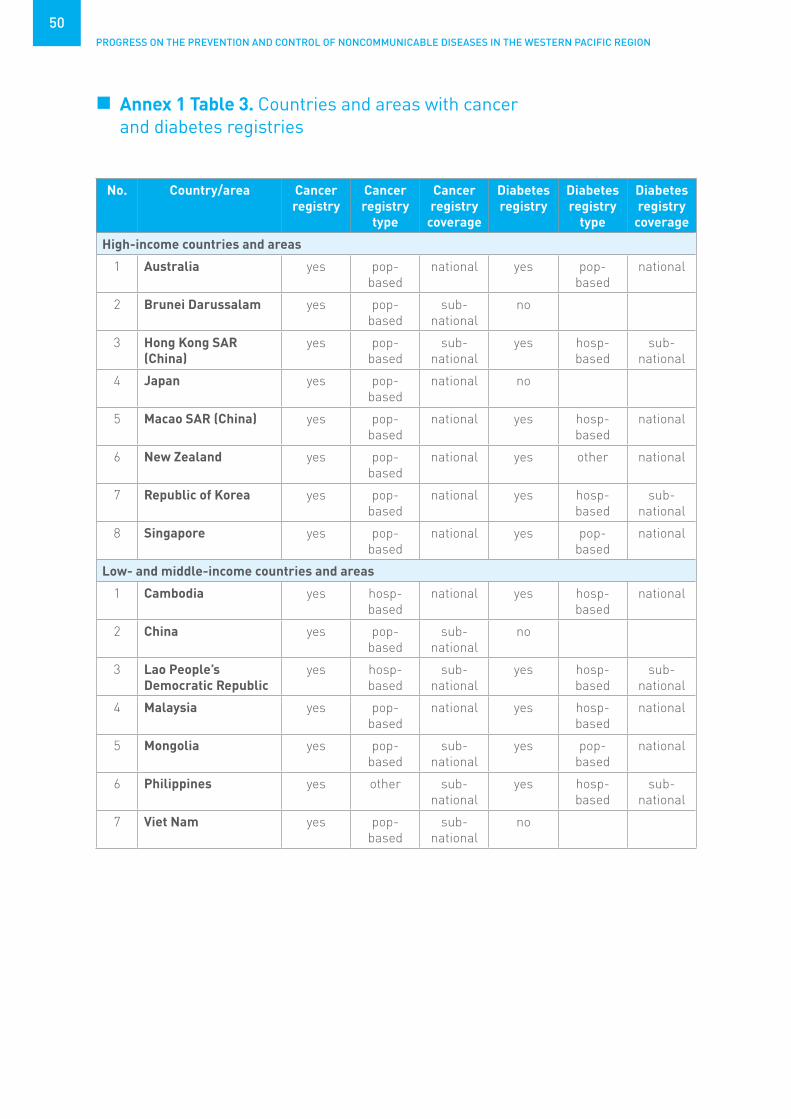
PROGRESS ON THE PREVENTION AND CONTROL OF NONCOMMUNICABLE DISEASES IN THE WESTERN PACIFIC REGION
50
No. Country/area Cancer registry
Cancer registry
type
Cancer registry
coverage
Diabetes registry
Diabetes registry
type
Diabetes registry
coverage
High-income countries and areas
1 Australia yes pop-based
national yes pop-based
national
2 Brunei Darussalam yes pop-based
sub-national
no
3 Hong Kong SAR (China)
yes pop-based
sub-national
yes hosp-based
sub-national
4 Japan yes pop-based
national no
5 Macao SAR (China) yes pop-based
national yes hosp-based
national
6 New Zealand yes pop-based
national yes other national
7 Republic of Korea yes pop-based
national yes hosp-based
sub-national
8 Singapore yes pop-based
national yes pop-based
national
Low- and middle-income countries and areas
1 Cambodia yes hosp-based
national yes hosp-based
national
2 China yes pop-based
sub-national
no
3 Lao People’s Democratic Republic
yes hosp-based
sub-national
yes hosp-based
sub-national
4 Malaysia yes pop-based
national yes hosp-based
national
5 Mongolia yes pop-based
sub-national
yes pop-based
national
6 Philippines yes other sub-national
yes hosp-based
sub-national
7 Viet Nam yes pop-based
sub-national
no
Annex 1 Table 3. Countries and areas with cancer and diabetes registries

ANNEX 1. COUNTRY-SPECIFIC INFORMATION
51
No. Country/area Cancer registry
Cancer registry
type
Cancer registry
coverage
Diabetes registry
Diabetes registry
type
Diabetes registry
coverage
Pacific island countries and area
1 Cook Islands no no
2 Fiji yes pop-based
sub-national
yes pop-based
national
3 French Polynesia yes pop-based
national no
4 Guam yes pop-based
national yes hosp-based
sub-national
5 Kiribati no yes pop-based
national
6 Marshall Islands yes pop-based
sub-national
yes hosp-based
sub-national
7 Federated States of Micronesia
yes pop-based
sub-national
yes hosp-based
national
8 Nauru yes hosp-based
national yes pop-based
national
9 New Caledonia yes pop-based
national no
10 Niue yes hosp-based
national yes pop-based
national
11 Commonwealth of the Northern Mariana Islands
yes other national no
12 Palau yes hosp-based
national yes hosp-based
national
13 Papua New Guinea yes hosp-based
sub-national
no
14 Samoa no no
15 Solomon Islands yes hosp-based
sub-national
yes hosp-based
sub-national
16 Tokelau no yes hosp-based
national
17 Tonga yes hosp-based
sub-national
yes hosp-based
national
18 Tuvalu no yes hosp-based
national
19 Vanuatu yes hosp-based
national yes hosp-based
national
hosp: hospital; pop: population

PROGRESS ON THE PREVENTION AND CONTROL OF NONCOMMUNICABLE DISEASES IN THE WESTERN PACIFIC REGION
52
Annex 1 Table 4. The most funded NCDs and their risk factor–related activities/functions
Dedicated funding for HICs (N=8) LMICs (N=7) PICs (N=19) Total
Primary prevention 8 (100%) 7 (100%) 19 (100%) 34 (100%)
Health promotion 8 (100%) 7 (100%) 18 (95%) 33 (97%)
Early detection/screening 8 (100%) 7 (100%) 18 (95%) 33 (97%)
Health care and treatment
8 (100%) 7 (100%) 18 (95%) 33 (97%)
Surveillance, monitoring and evaluation
8 (100%) 6 (86%) 16 (84%) 30 (88%)
Capacity-building 7 (88%) 6 (86%) 13 (72%) 26 (79%)
Palliative care 8 (100%) 6 (86%) 8 (42%) 22 (65%)
Research 8 (100%) 5 (71%) 8 (44%) 21 (64%)
HICs: high-income countries; LMICs: low- and middle-income countries; PICs: Pacific island countries and areas
Annex 1 Table 5. Number of countries and areas with multi-stakeholder/multisectoral integrated national NCD policy, strategy or action plans
HICs: high-income countries; LMICs: low- and middle-income countries; NCD: noncommunicable disease; PICs: Pacific island countries and areas
HICs LMICs PICs Total
N=8 N=7 N=19 N=34
NCD integrated plan 7 (88%) 7 (100%) 16 (84%) 30 (88%)
multi-stakeholder* 7 (100%) 7 (100%) 16 (100%) 30 (100%)
multisectoral* 6 (86%) 7 (100%) 16 (100%) 29 (97%)
* Denominator – number of countries and areas with NCD integrated plan.
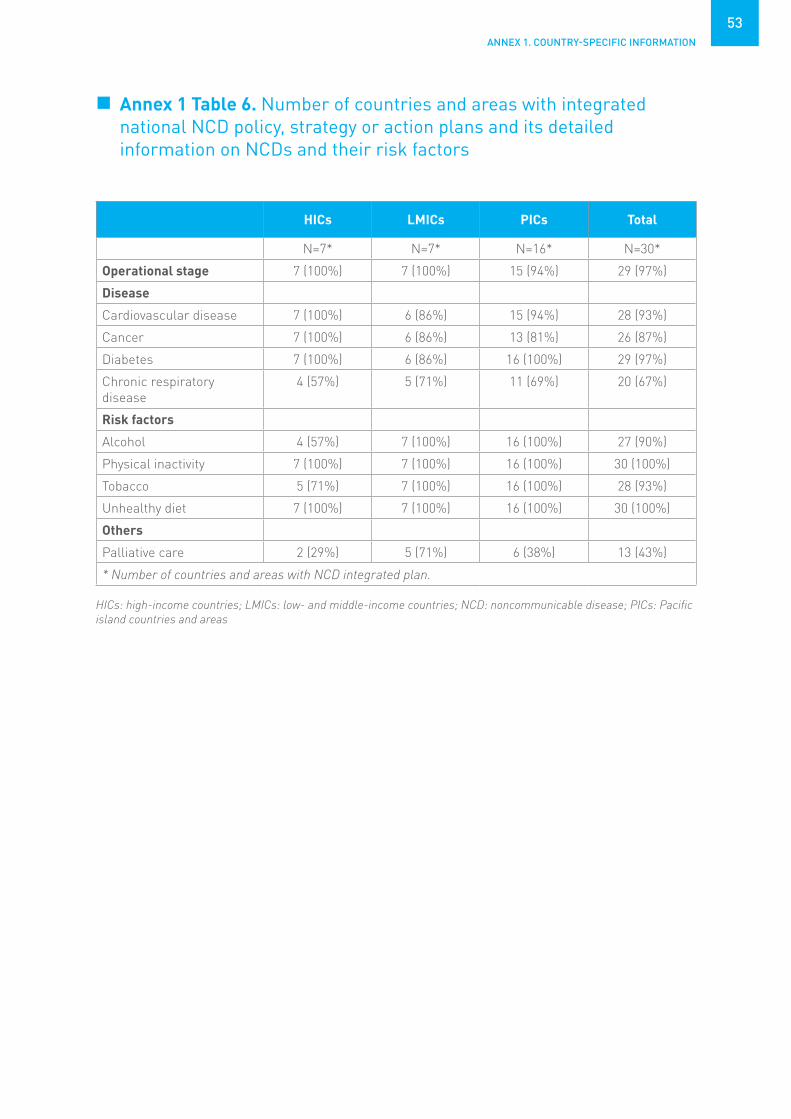
ANNEX 1. COUNTRY-SPECIFIC INFORMATION
53
Annex 1 Table 6. Number of countries and areas with integrated national NCD policy, strategy or action plans and its detailed information on NCDs and their risk factors
HICs LMICs PICs Total
N=7* N=7* N=16* N=30*
Operational stage 7 (100%) 7 (100%) 15 (94%) 29 (97%)
Disease
Cardiovascular disease 7 (100%) 6 (86%) 15 (94%) 28 (93%)
Cancer 7 (100%) 6 (86%) 13 (81%) 26 (87%)
Diabetes 7 (100%) 6 (86%) 16 (100%) 29 (97%)
Chronic respiratory disease
4 (57%) 5 (71%) 11 (69%) 20 (67%)
Risk factors
Alcohol 4 (57%) 7 (100%) 16 (100%) 27 (90%)
Physical inactivity 7 (100%) 7 (100%) 16 (100%) 30 (100%)
Tobacco 5 (71%) 7 (100%) 16 (100%) 28 (93%)
Unhealthy diet 7 (100%) 7 (100%) 16 (100%) 30 (100%)
Others
Palliative care 2 (29%) 5 (71%) 6 (38%) 13 (43%)
* Number of countries and areas with NCD integrated plan.
HICs: high-income countries; LMICs: low- and middle-income countries; NCD: noncommunicable disease; PICs: Pacific island countries and areas

PROGRESS ON THE PREVENTION AND CONTROL OF NONCOMMUNICABLE DISEASES IN THE WESTERN PACIFIC REGION
54
Annex 1 Table 7. Countries and areas with policies, strategies or action plans for specific NCDs and its operational status
Policies, strategies or action plans
Operational status HICs (N=8) LMICs (N=7) PICs (N=19)
CVD plan yes 5 (63%) 0 ( 0%) 1 ( 5%)
Operational* 3 (60%) 0 ( 0%)
Cancer plan yes 6 (75%) 4 (57%) 10 (53%)
Operational* 6 (100%) 4 (100%) 10 (100%)
Diabetes plan yes 5 (63%) 0 ( 0%) 3 (16%)
Operational* 5 (100%) 3 (100%)
CRD plan yes 2 (25%) 0 ( 0%) 0 ( 0%)
Operational* 1 (50%)
Oral health plan yes 7 (88%) 4 (57%) 6 (32%)
Operational* 7 (100%) 4 (100%) 6 (100%)
Other NCD plan yes 5 (63%) 4 (57%) 3 (16%)
Operational* 5 (100%) 4 (100%) 1 (33%)
*Denominator – number of countries and areas with policies, strategies or action plans.
CRD: chronic respiratory disease; CVD: cardiovascular disease; HICs: high-income countries; LMICs: low- and middle-income countries NCD: noncommunicable disease; PICs: Pacific island countries and areas
Annex 1 Table 8. Countries and areas with policies, strategies or action plans for specific NCD risk factors and its operational status
HICs: high-income countries; LMICs: low- and middle-income countries; NCD: noncommunicable disease; PICs: Pacific island countries and areas
Policies, strategies or action plans
Availability/status HICs (N=8) LMICs (N=7) PICs (N=19)
Harmful use of alcohol yes 6 (75%) 2 (29%) 5 (26%)
Operational* 5 (83%) 2 (100%) 5 (100%)
Overweight/obesity yes 5 (63%) 2 (29%) 6 (32%)
Operational* 4 (80%) 2 (100%) 6 (100%)
Physical activity yes 6 (75%) 3 (43%) 5 (26%)
Operational* 5 (83%) 3 (100%) 5 (100%)
Healthy diet yes 4 (50%) 5 (71%) 8 (42%)
Operational* 4 (100%) 5 (100%) 7 (88%)
Non-tobacco use yes 5 (63%) 4 (57%) 8 (42%)
Operational* 4 (80%) 4 (100%) 7 (88%)
* Denominator – number of countries and areas with policies, strategies or action plans specific to the respective risk factors.

ANNEX 1. COUNTRY-SPECIFIC INFORMATION
55
Annex 1 Table 9. Countries and areas with guidelines for specific NCD risk factors and their target age group
Annex 1 Table 10. Countries and areas with policy or plan on NCD-related research, its operational status and its network status
HICs LMICs PICs Total
N=8 N=7 N=19 N=34
NCD risk factor guidelines
Physical activity guidelines 7 (88%) 3 (43%) 7 (37%) 17 (50%)
PA guidelines: under 5 4 (57%) 0 (0%) 1 (14%) 5 (29%)
PA guidelines: 5–19 7 (100%) 2 (67%) 3 (43%) 12 (71%)
PA guidelines: adults 7 (100%) 3 (100%) 7 (100%) 17 (100%)
PA guidelines: older adults 7 (100%) 3 (100%) 3 (43%) 13 (76%)
Diet guidelines 8 (100%) 5 (71%) 9 (47%) 22 (65%)
HICs LMICs PICs Total
N=8 N=7 N=19 N=34
NCD research plan 7 (88%) 4 (57%) 2 (11%) 13 (38%)
Operational 7 (100%) 3 (75%) 1 (50%) 11 (85%)
NCD research network 6 (75%) 0 ( 0%) 0 ( 0%) 6 (18%)
HICs: high-income countries; LMICs: low- and middle-income countries; NCD: noncommunicable disease; PA: physical activity; PICs: Pacific island countries and areas
HICs: high-income countries; LMICs: low- and middle-income countries; NCD: noncommunicable disease; PICs: Pacific island countries and areas

PROGRESS ON THE PREVENTION AND CONTROL OF NONCOMMUNICABLE DISEASES IN THE WESTERN PACIFIC REGION
56
Annex 1 Table 11. Countries and areas with policy to reduce unhealthy diet and its enforcement type
HICs LMICs PICs Total
N=8 N=7 N=19 N=34
Marketing policy 5 (63%) 3 (43%) 3 (16%) 11 (32%)
Mandatory enforcement 1 (20%) 2 (67%) 2 (100%) 5 (50%)
FOPL policy 5 (63%) 2 (29%) 1 ( 5%) 8 (24%)
Mandatory enforcement 1 (20%) 1 (50%) 2 (29%)
SAT fatty acid policy 3 (38%) 1 (14%) 2 (11%) 6 (18%)
Mandatory enforcement 0 ( 0%) 1 (100%) 1 (100%) 2 (40%)
Trans-fatty acids policy 3 (38%) 0 ( 0%) 0 ( 0%) 3 ( 9%)
Mandatory enforcement 2 (67%) 2 (67%)
Salt policy 6 (75%) 4 (57%) 5 (26%) 15 (44%)
Mandatory enforcement 0 ( 0%) 1 (25%) 0 ( 0%) 1 (10%)
FOPL: front-of-pack labelling; HICs: high-income countries; LMICs: low- and middle-income countries; PICs: Pacific island countries and areas; SAT: saturated
Annex 1 Table 12. Number of countries and areas that have implemented national public awareness programme for diet, physical activity, massive participation events, and national NCD-related mHealth initiatives
HICs LMICs PICs Total
N=8 N=7 N=19 N=34
Diet public awareness 7 (88%) 5 (71%) 11 (58%) 23 (68%)
Physical activity public awareness
6 (75%) 4 (57%) 13 (68%) 23 (68%)
Integrated community-based* 5 (83%) 3 (75%) 12 (92%) 20 (87%)
Supported by environmental changes*
3 (50%) 3 (75%) 10 (77%) 16 (70%)
Addresses social, environmental, economic benefits*
5 (83%) 1 (25%) 9 (69%) 15 (65%)
Mass participation events 7 (88%) 5 (71%) 10 (53%) 22 (65%)
mHealth Initiatives 6 (75%) 3 (43%) 5 (26%) 14 (41%)
* Denominator – number of countries and areas with physical activity public awareness.
HICs: high-income countries; LMICs: low- and middle-income countries; mHealth: mobile health; NCD: noncommunicable disease; PICs: Pacific island countries and areas

ANNEX 1. COUNTRY-SPECIFIC INFORMATION
57
Annex 1 Table 13. Number of countries and areas by NCD surveillance responsibility
HICs: high-income countries; LMICs: low- and middle-income countries; NCD: noncommunicable disease; PICs: Pacific island countries and areas
HICs LMICs PICs Total
N=8 N=7 N=19 N=34
NCD surveillance responsibility
In Ministry of Health exclusively dedicated
2 (25%) 0 (0%) 0 (0%) 2 (6%)
In Ministry of Health, but NOT exclusively dedicated
1 (13%) 3 (43%) 10 (53%) 14 (41%)
Shared responsibility across several departments in Ministry of Health
5 (63%) 4 (57%) 9 (47%) 18 (53%)
Annex 1 Table 14. Number of countries and areas collecting mortality data, with civil/vital registration, and population registration system with the proportion of registered deaths
HICs: high-income countries; LMICs: low- and middle-income countries; PICs: Pacific island countries and areas
HICs LMICs PICs Total
N=8 N=7 N=19 N=34
Mortality data collected 8 (100%) 4 (57%) 19 (100%) 31 (91%)
• Civil/vital registration 8 (100%) 4 (100%) 19 (100%) 31 (100%)
• Population registration 7 (88%) 1 (25%) 14 (74%) 22 (71%)
• More than 75% deaths registered
7 (88%) 3 (75%) 9 (47%) 19 (61%)

PROGRESS ON THE PREVENTION AND CONTROL OF NONCOMMUNICABLE DISEASES IN THE WESTERN PACIFIC REGION
58
Annex 1 Table 15. Number of countries and areas with patient information system, including NCD status, with the electronic system/national coverage rate
Annex 1 Table 16. Number of countries and areas that surveyed facilities to assess service availability and readiness for NCDs with national coverage rate
HICs: high-income countries; incl: including; info: information; LMICs: low- and middle-income countries; NCD: noncommunicable disease; PICs: Pacific island countries and areas
HICs: high-income countries; LMICs: low- and middle-income countries; NCD: noncommunicable disease; PICs: Pacific island countries and areas; SARA: Service Availability and Readiness Assessment
HICs LMICs PICs Total
N=8 N=7 N=19 N=34
Patient info system incl NCD status
7 (88%) 6 (86%) 17 (89%) 30 (88%)
• Electronic system 7 (100%) 6 (100%) 10 (59%) 23 (77%)
• National coverage 5 (71%) 3 (50%) 11 (65%) 19 (63%)
HICs LMICs PICs Total
N=8 N=7 N=19 N=34
SARA survey for NCDs 2 (25%) 2 (29%) 7 (37%) 11 (32%)
National coverage 2 (100%) 0 (0%) 5 (71%) 7 (64%)

ANNEX 1. COUNTRY-SPECIFIC INFORMATION
59
Annex 1 Table 17. Number of countries and areas with breast, cervix and colon cancer early detection programme/guidelines and referral system available*
HICs: high-income countries; LMICs: low- and middle-income countries; PGM: programme; PICs: Pacific island countries and areas * Defined as present in 50% or more of health care facilities.
HICs LMICs PICs Total
N=8 N=7 N=19 N=34
Breast cancer
• Early detection PGM/guidelines
5 (63%) 4 (57%) 8 (42%) 17 (50%)
• Defined referral systems 5 (63%) 4 (57%) 10 (56%) 19 (58%)
Cervix cancer
• Early detection PGM/guidelines
6 (75%) 6 (86%) 10 (53%) 22 (65%)
• Defined referral systems 6 (75%) 6 (86%) 12 (71%) 24 (75%)
Colon cancer
• Early detection PGM/guidelines
6 (75%) 4 (57%) 2 (11%) 12 (36%)
• Defined referral systems 6 (75%) 4 (57%) 4 (24%) 14 (44%)

60
ANNEX 2
NCD COUNTRY CAPACITY SURVEY 2019 QUESTIONNAIRE
2019Country Profile of Capacity and Response to
Noncommunicable Diseases (NCDs)
MODULES:
I PUBLIC HEALTH INFRASTRUCTURE, PARTNERSHIPS AND MULTISECTORAL COLLABORATION FOR NCDs AND THEIR RISK FACTORS
II STATUS OF NCD-RELEVANT POLICIES, STRATEGIES AND ACTION PLANS
III HEALTH INFORMATION SYSTEMS, MONITORING, SURVEILLANCE AND SURVEYS FOR NCDs AND THEIR RISK FACTORS
IV CAPACITY FOR NCD EARLY DETECTION, TREATMENT AND CARE WITHIN THE HEALTH SYSTEM

ANNEX 2. NCD COUNTRY CAPACITY SURVEY 2019 QUESTIONNAIRE
61
Purpose• The purpose of this survey is to gauge your country’s capacity for responding to
noncommunicable diseases (NCDs). It will guide Member States, WHO Regional Offices and WHO HQ in planning future actions and technical assistance required to address NCDs and their risk factors. This is also the basis for ongoing assessment of changes in country capacity and response. Responses to the survey enable reporting against NCD Global Action Plan process indicators and UN High-Level Meeting national commitment progress indicators.
• The information collected through this survey will also be used to produce some of the indicators that Member States have agreed to monitor and will be held accountable to the United Nations General Assembly and World Health Assembly;
• Use of standardized questions allows comparisons of country capacities and responses. We have divided this survey into four modules, assessing key aspects of NCD prevention and control.
• The four main types of noncommunicable diseases are cardiovascular diseases (like heart attacks and stroke), cancers, chronic respiratory diseases (such as chronic obstructed pulmonary disease and asthma) and diabetes. The survey also captures information on policies related to other NCDs of importance to countries such as oral health.
• The main risk factors for NCDs are harmful use of alcohol, tobacco use, unhealthy diet, and physical inactivity. Capacity assessment related to some specific risk factors is also captured in other topic-specific assessments such as tobacco, alcohol and nutrition, which may be used to cross-validate some survey items.
Process• The survey is intended to assess national level capacity and response to NCDs. If
responsibility for health is decentralized to subnational levels, it can also be applied at subnational levels.
• A focal point or survey coordinator will need to be identified to coordinate and ensure survey completion. However, in order to provide a complete response, a group of respondents with expertise in the topics covered in the modules will be needed. Please use the table provided to indicate the names and titles of all of those who have completed the survey and which sections they have completed. Please also add any additional information on other sources you may have consulted in developing your response.
• Please note that while there is space to indicate “Don’t know” for most questions, there should be very few of these. If someone is filling in numerous “Don’t knows”, another person who is more aware of this information should be found to complete this section.
• In order to validate responses, documentation will be requested for affirmative responses throughout the questionnaire. Please make every effort to provide electronic copies of the requested documentation. If documentation has been provided previously and is available in the NCD Document Repository (https://extranet.who.int/ncdccs/documents), please indicate this. If you are unable to provide electronic copies through the provided links, please ask your regional focal point for an alternative means to submit documentation.

PROGRESS ON THE PREVENTION AND CONTROL OF NONCOMMUNICABLE DISEASES IN THE WESTERN PACIFIC REGION
62
Information on those who completed the survey
Who is the focal point for completion of this survey?Name: _________________________________________________________________________Position: _______________________________________________________________________Contact Information: _____________________________________________________________Sections completed: ______________________________________________________________
Name and contact information of others completing survey
Sections completed
Additional information sources consulted:

ANNEX 2. NCD COUNTRY CAPACITY SURVEY 2019 QUESTIONNAIRE
63
I: PUBLIC HEALTH INFRASTRUCTURE, PARTNERSHIPS AND MULTISECTORAL COLLABORATION FOR NCDs AND THEIR RISK FACTORS
This module includes questions related to the presence of a unit or division in the ministry of health dedicated to NCDs and risk factors, staff and funding. It also includes an assessment of the existence of fiscal interventions as incentives to influence health behaviour and/or to raise funds for health-related activities. Finally, it assesses the existence of a formal multisectoral mechanism to coordinate NCD-related activities in sectors outside of health.
1) Is there a unit/branch/department in the ministry of health or equivalent with responsibility for NCDs and their risk factors?
Yes No Don’t knowIf "No": Go to Question 2
1a) Please indicate the number of full-time-equivalent technical/professional staff in the unit/branch/department.
0 1 2-5 6 - 10 11 or more Don’t know
1b) Are there technical/professional staff in the unit/branch/ department dedicating a significant proportion of their time to:
i) Harmful use of alcohol Yes No Don’t knowii) Unhealthy diet Yes No Don’t knowiii) Physical inactivity Yes No Don’t knowiv) Tobacco use Yes No Don’t knowv) Cancer Yes No Don’t knowvi) Cardiovascular diseases Yes No Don’t knowvii) Chronic respiratory diseases Yes No Don’t knowviii) Diabetes Yes No Don’t knowix) Oral diseases Yes No Don’t know
2) Is there dedicated funding allocated in the government budget for the following NCD and risk factor activities/functions?
i) Primary prevention Yes No Don’t knowii) Health promotion Yes No Don’t knowiii) Early detection/screening Yes No Don’t knowiv) Health care and treatment Yes No Don’t knowv) Surveillance, monitoring and evaluation Yes No Don’t knowvi) Capacity building Yes No Don’t knowvii) Palliative care Yes No Don’t knowviii) Research Yes No Don’t know

PROGRESS ON THE PREVENTION AND CONTROL OF NONCOMMUNICABLE DISEASES IN THE WESTERN PACIFIC REGION
64
If at least one "Yes" to above questions:2a) What are the major sources of regular funding for NCDs and their risk factors?
More than one can apply, rank order them where: 1=Largest source; 2=Next largest; 3=Others
General government revenues Health insurance International donors National donors Earmarked taxes on alcohol, tobacco, etc. Other (specify) __________________________ Don’t know
3) Is your country implementing any of the following fiscal interventions? (for taxes, please respond “Yes” only if excise taxes and/or special VAT/sales tax rates are applied)
Taxation on alcoholic beverages Yes No Don’t knowTaxation on tobacco (excise and non-excise taxes) Yes No Don’t knowTaxation on sugar sweetened beverages Yes No Don’t knowTaxation on foods high in fat, sugars or salt Yes No Don’t knowprice subsidies for healthy foods Yes No Don’t knowTaxation incentives to promote physical activity Yes No Don’t knowOthers (specify)__________________________ Yes No Don’t know
If "Yes" to at least one of the above, other than price subsidies:3a) Are any of these funds earmarked for health promotion or health service provision?
Yes No Don’t know
4) Is there a national multisectoral commission, agency or mechanism to oversee NCD engagement, policy coherence and accountability of sectors beyond health?
Yes No Don’t know If "No": Go to MODULE II
4a) Indicate its stage:
Operational Under development Not in effect Don’t know
If "Operational" or "Under Development":
4b) Please provide name: _____________________________________
4c) Please provide year of establishment: _____________________________________
4d) Who leads or chairs the commission/agency/mechanisms (provide name): _____________________________________

ANNEX 2. NCD COUNTRY CAPACITY SURVEY 2019 QUESTIONNAIRE
65
4e) Which of the following are members? (Check all that apply)
Other government ministries (non-health, e.g. ministries of sport, education, transport, urban planning) United Nations agencies Other international institutions Academia (including research centres) Nongovernmental organizations/community-based organizations/civil society Private sector Other (specify) __________________________ Don’t know
If “Private sector” is one of the members:4f) Is the tobacco industry’s participation to the consultations and decision making process
excluded from the national multisectoral commission?
Yes No Don’t know
II: STATUS OF NCD-RELEVANT POLICIES, STRATEGIES, AND ACTION PLANS
This module includes questions relating to the presence of policies, strategies, or action plans - the questions differentiate between integrated policies/strategies/action plans that address several risk factors or diseases, and policies/strategies/action plans that address a specific disease or risk factor. Additional questions address the existence of specific policies related to the cost-effective interventions for NCDs.
1a) Are NCDs included in the outcomes or outputs of your current national health plan?
Yes No Don’t know
1b) Are NCDs included in the outcomes or outputs of your current national development agenda?
Yes No Don’t know
2) Is there a set of time-bound national targets for NCDs based on the 9 voluntary global targets from the WHO Global Monitoring Framework for NCDs?
Yes No Don’t know
If "Yes":2a) Is there a set of national indicators for these targets based on the indicators from the
WHO Global Monitoring Framework for NCDs?
Yes No Don’t know

PROGRESS ON THE PREVENTION AND CONTROL OF NONCOMMUNICABLE DISEASES IN THE WESTERN PACIFIC REGION
66
II A: INTEGRATED POLICIES, STRATEGIES, AND ACTION PLANS
3) Does your country have a national NCD policy, strategy or action plan which integrates several NCDs and their risk factors? Please note that this may be a stand-alone NCD policy, strategy or action plan, or a national health policy, strategy or action plan where NCDs comprise a significant proportion of the document.Also note that disease- and risk factor-specific policies, strategies, and action plans will be reported in other questions later in this module.
Yes No Don’t knowIf "No": Go to Question 4
If "Yes":Is it multisectoral? Yes No Don’t knowIs it multi-stakeholder? Yes No Don’t know
Please provide the following information about the policy, strategy or action plan:
3a) Title: _____________________________________________________________
3b) Does it address one or more of the following major risk factors?
Harmful use of alcohol Yes No Don’t knowUnhealthy diet Yes No Don’t know Physical inactivity Yes No Don’t knowTobacco Yes No Don’t know
3c) Does it include early detection, treatment and care for:
Cancer Yes No Don’t knowCardiovascular diseases Yes No Don’t knowChronic respiratory diseases Yes No Don’t knowDiabetes Yes No Don’t know
3d) Does it include palliative care for patients with NCDs?
Yes No Don’t know
3e) Indicate its stage:
Operational Under development Not in effect Don’t know
If "operational":3e-i) What was the first year of implementation? ___________3e-ii) What year will it expire? ___________

ANNEX 2. NCD COUNTRY CAPACITY SURVEY 2019 QUESTIONNAIRE
67
II B: POLICIES, STRATEGIES AND ACTION PLANS FOR SPECIFIC KEY NCDs
The questions in this sub-section only refer to policies, strategies and action plans that are specific to key NCDs. If your integrated policy, strategy or action plan addresses the NCD, you do not need to re-enter that information. 4) Is there a policy, strategy or action plan for cardiovascular diseases in your country?
Yes No Don’t know
If "No": Go to Question 5
IF "Yes":4a) Write the title ________________________________________________________________
4b) Indicate its stage:
Operational Under development Not in effect Don’t know
If "Operational":4b-i) What was the first year of implementation? __________________________4b-ii) What year will it expire? __________________________
5) Is there a policy, strategy or action plan for cancer or some particular cancer types in your country?
Yes for all cancers or cancer in general Yes but only for specific cancers (specify: ___________________________) No Don’t knowIf "No": Go to Question 6
If "Yes", provide the following for the general cancer policy/strategy/action plan or, if there isn’t one, for the most important specific cancer policy/strategy/action plan:
5a) Write the title _______________________________________________
5b) Indicate its stage:
Operational Under development Not in effect Don’t know
If "operational":5b-i) What was the first year of implementation? ___________5b-ii) What year will it expire? ___________

PROGRESS ON THE PREVENTION AND CONTROL OF NONCOMMUNICABLE DISEASES IN THE WESTERN PACIFIC REGION
68
6) Is there a policy, strategy or action plan for diabetes in your country?
Yes No Don’t knowIf "No": Go to Question 7
If "Yes":6a) Write the title _______________________________________________________
6b) Indicate its stage:
Operational Under development Not in effect Don’t know
If "operational":6b-i) What was the first year of implementation? ___________6b-ii) What year will it expire? ___________
7) Is there a policy, strategy or action plan for chronic respiratory diseases in your country?
Yes No Don’t knowIf "No": Go to Question 8
If "Yes":7a) Write the title _______________________________________________________
7b) Indicate its stage:
Operational Under development Not in effect Don’t know
If "operational":7b-i) What was the first year of implementation? ___________7b-ii) What year will it expire? ___________
8) Is there a policy, strategy or action plan for oral health in your country? Yes No Don’t know
If "No": Go to Question 9
If "Yes":8a) Write the title _______________________________________________________
8b) Indicate its stage:
Operational Under development Not in effect Don’t know
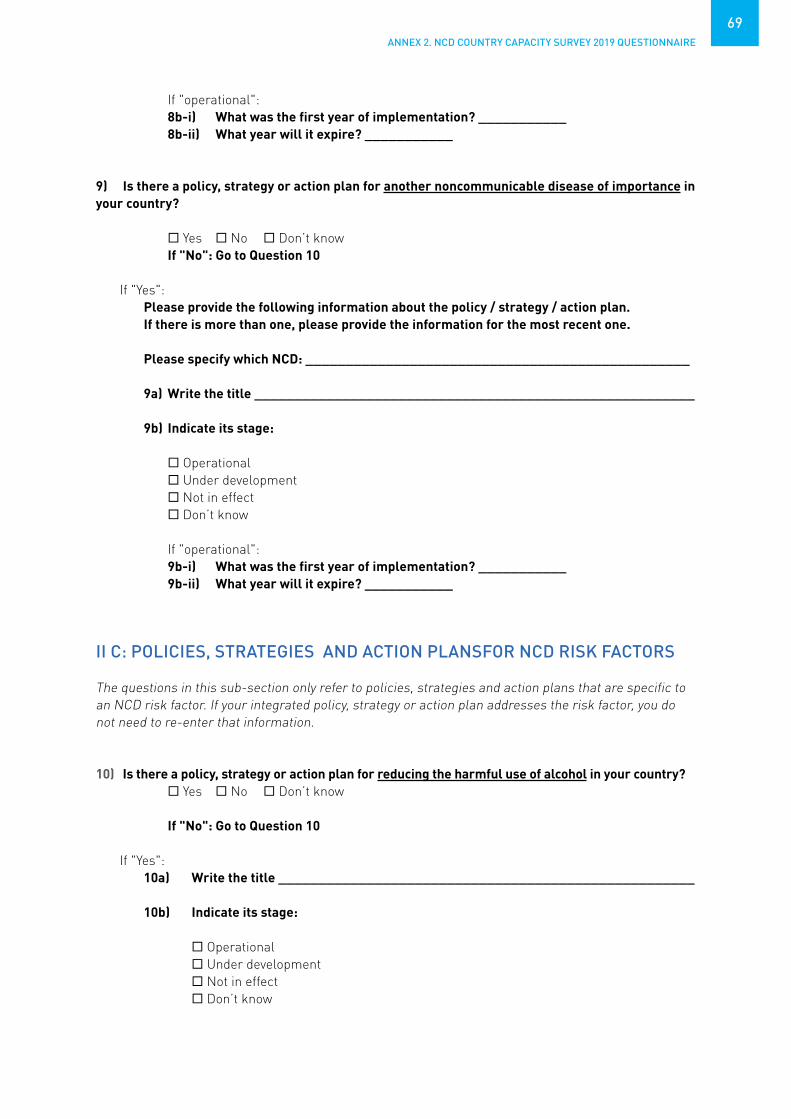
ANNEX 2. NCD COUNTRY CAPACITY SURVEY 2019 QUESTIONNAIRE
69
If "operational":8b-i) What was the first year of implementation? ___________8b-ii) What year will it expire? ___________
9) Is there a policy, strategy or action plan for another noncommunicable disease of importance in your country?
Yes No Don’t knowIf "No": Go to Question 10
If "Yes":Please provide the following information about the policy / strategy / action plan.If there is more than one, please provide the information for the most recent one.
Please specify which NCD: ________________________________________________
9a) Write the title _______________________________________________________
9b) Indicate its stage:
Operational Under development Not in effect Don’t know
If "operational":9b-i) What was the first year of implementation? ___________9b-ii) What year will it expire? ___________
II C: POLICIES, STRATEGIES AND ACTION PLANSFOR NCD RISK FACTORS
The questions in this sub-section only refer to policies, strategies and action plans that are specific to an NCD risk factor. If your integrated policy, strategy or action plan addresses the risk factor, you do not need to re-enter that information.
10) Is there a policy, strategy or action plan for reducing the harmful use of alcohol in your country? Yes No Don’t know
If "No": Go to Question 10
If "Yes":10a) Write the title ____________________________________________________
10b) Indicate its stage:
Operational Under development Not in effect Don’t know

PROGRESS ON THE PREVENTION AND CONTROL OF NONCOMMUNICABLE DISEASES IN THE WESTERN PACIFIC REGION
70
If "operational":9b-i) What was the first year of implementation? ___________9b-ii) What year will it expire? ___________
11) Is there a policy, strategy or action plan for reducing overweight / obesity in your country?
Yes No Don’t knowIf "No": Go to Question 12
If "Yes":11a) Write the title ____________________________________________________
11b) Indicate its stage:
Operational Under development Not in effect Don’t know
If "operational":11b-i) What was the first year of implementation? ___________11b-ii) What year will it expire? ___________
12) Is there a policy, strategy or action plan for reducing physical inactivity and/or promoting physical activity in your country?
Yes No Don’t knowIf "No": Go to Question 13
If "Yes":12a) Write the title ____________________________________________________
12b) Indicate its stage:
Operational Under development Not in effect Don’t know
If "operational":12b-i) What was the first year of implementation? ___________12b-ii) What year will it expire? ___________
13) Are there national guidelines which provide recommended levels of physical activity for the population or a specific segment of the population?
Yes No Don’t knowIf "No": Go to Question 14
ANNEX 2. NCD COUNTRY CAPACITY SURVEY 2019 QUESTIONNAIRE
71
If "Yes":13a) Are there guidelines specifically addressing any of the following age groups:
Children under 5 Yes No Don’t know Children and adolescents (ages 5 – 19) Yes No Don’t know Adults Yes No Don’t know Older adults Yes No Don’t know
14) Is there a policy, strategy or action plan for reducing unhealthy diet related to NCD and/or promoting a healthy diet in your country?
Yes No Don’t knowIf "No": Go to Question 15
If "Yes":14a) Write the title ____________________________________________________
14b) Indicate its stage:
Operational Under development Not in effect Don’t know
If "operational":14b-i) What was the first year of implementation? ___________14b-ii) What year will it expire? ___________
15) Are there national food-based dietary guidelines for the population or a specific segment of the population?
Yes No Don’t know
16) Is there a policy, strategy or action plan to decrease tobacco use in your country?
Yes No Don’t knowIf "No": Go to Question 17
If "Yes":16a) Write the title ____________________________________________________
16b) Indicate its stage:
Operational Under development Not in effect Don’t know
If "operational":16b-i) What was the first year of implementation? ___________16b-ii) What year will it expire? ___________
PROGRESS ON THE PREVENTION AND CONTROL OF NONCOMMUNICABLE DISEASES IN THE WESTERN PACIFIC REGION
72
II D: SELECTED COST-EFFECTIVE POLICIES FOR NCDs AND RELATED RISK FACTORS
NB: Only selected policies are captured here as information on some policy measures, e.g. for tobacco and alcohol, are included in other assessment tools.
17) Is there a policy and/or plan on NCD-related research including community-based research and evaluation of the impact of interventions and policies?
Yes No Don’t knowIf "No": Go to Question 18
If "Yes":17a) Write the title ____________________________________________________
17b) Indicate its stage:
Operational Under development Not in effect Don’t know
18) Is there a national network for NCD-related research including community-based research and evaluation of the impact of interventions and policies?
Yes No Don’t know
19) Is your country implementing any policies to reduce the impact on children of marketing of foods and non-alcoholic beverages high in saturated fatty acids, trans-fatty acids, free sugars, or salt?
Yes No Don’t knowIf "No": Go to Question 20
If "Yes":19a) Are the policies:
Voluntary Mandatory Don’t know
19b) Who is responsible for overseeing enforcement and complaints?
Government Food Industry Independent regulator Other, please specify: _______________
19c) Do they include steps taken to address the effects of cross-border marketing of food and non-alcoholic beverages on children?

ANNEX 2. NCD COUNTRY CAPACITY SURVEY 2019 QUESTIONNAIRE
73
Yes No Don’t know19c-i) If "Yes", please provide details:_______________________________________________________________
20) Is your country implementing any policies on front-of-pack labelling to identify foods high in saturated fatty acids, trans-fatty acids, free sugars, or salt?
Yes No Don’t knowIf "No": Go to Question 21
If "Yes":20a) Are the policies:
Voluntary Mandatory Don’t know
20b) Who is responsible for overseeing enforcement and complaints?
Government Food Industry Independent regulator Other, please specify: _______________
21) Is your country implementing any national policies to reduce population saturated fatty acid intake ?
Yes No Don’t know
If "No": Go to Question 22
21a) If "Yes", are the policies:
Voluntary Mandatory Don’t know
22) Is your country implementing any national policies to eliminate industrially produced trans-fatty acids (i.e. partially hydrogenated oils) in the food supply?
Yes No Don’t knowIf "No": Go to Question 23
22a) If "Yes", are the policies:
Voluntary Mandatory Don’t know

PROGRESS ON THE PREVENTION AND CONTROL OF NONCOMMUNICABLE DISEASES IN THE WESTERN PACIFIC REGION
74
23) Is your country implementing any policies to reduce population salt/sodium consumption?
Yes No Don’t knowIf "No": Go to Question 24
If "Yes":23a) Are these targeted at:
Product reformulation by industry across the food supply Yes No Don’t know
Regulation of salt content of food served in specific settings such as hospitals, schools, workplaces Yes No Don’t know
Public awareness programme Yes No Don’t know Front-of-pack nutrition labeling Yes No Don’t know
23b) If "Yes" to product reformulation or regulation of salt/sodium content, is the policy: Voluntary
Mandatory Don’t know
24) Has your country implemented any national public education and awareness campaign on diet within the past 2 years?
Yes No Don’t knowIf "No": Go to Question 25
24a) If "Yes", please provide details of the public education and awareness campaign(s): _______________________________________________________________
25) Has your country implemented any national public education and awareness campaign on physical activity within the past 2 years?
Yes No Don’t knowIf "No": Go to Question 26
If "Yes":25a) Does the campaign integrate with community-based programmes?
Yes No Don’t know
25b) Is the campaign supported by any environmental changes to enable physical activity?
Yes No Don’t know
25c) Does the campaign address any of the social, environmental and economic benefits of physical activity, in addition to the health benefits?
Yes No Don’t know
25d) Please provide details of the public education and awareness campaign(s): _______________________________________________________________

ANNEX 2. NCD COUNTRY CAPACITY SURVEY 2019 QUESTIONNAIRE
75
III: HEALTH INFORMATION SYSTEMS, MONITORING, SURVEILLANCE AND SURVEYS FOR NCDs AND THEIR RISK FACTORS
The questions in this module assess surveillance relating to the mortality, morbidity and risk factor reporting systems of each country and whether NCD mortality, morbidity and risk factor data were included in their national health reporting systems.
1) In your country, who has responsibility for surveillance of NCDs and their risk factors?
An office/department/administrative division within the MOH exclusively dedicated to NCD surveillance
An office/department/ administrative division within the MOH not exclusively dedicated to NCD surveillance
Responsibility is shared across several offices/departments/administrative divisions within the MOH
Coordination is by an external agency, such as an NGO or statistical organization No one has this responsibility Don’t know
26) Has your country implemented any national or subnational mass participation events to encourage participation by the general public in free opportunities for physical activity within the past 2 years? Examples of mass participation events include national walk to school days/weeks; other free events; cycling, yoga, tai chi, dance. Note this does NOT include hosting of major competitive sporting events like marathons, which require paid participation.
Yes No Don’t know If "No": Go to Question 27
26a) Please provide details of the event(s): _______________________________________________________________
27) Has your country implemented any national, NCD-related mHealth initiatives, such as tobacco cessation, hypertension management, cervical cancer screening awareness, promotion of physical activity, within the past 2 years?
Yes No Don’t know If "No": Go to MODULE III
27a) Please provide details of the mHealth initiative(s): _______________________________________________________________

PROGRESS ON THE PREVENTION AND CONTROL OF NONCOMMUNICABLE DISEASES IN THE WESTERN PACIFIC REGION
76
III A: DATA INCLUDED IN THE NATIONAL HEALTH INFORMATION SYSTEM
(National health information system refers to the annual or regular reporting system of the National Statistical Office or Ministry of Health)
2) Does your country have a system for collecting mortality data by cause of death on a routine basis?
Yes No Don’t knowIf "No": Go to Question 3
If "Yes":2a) Is there a civil/vital registration system? Yes No Don’t know
2b) Is there a sample registration system? Yes No Don’t know
2c) What is the latest year for which data are available? _________
2d) What percentage of total deaths in the entire country are officially registered in the system? (national estimated completeness)
< 20% 20-49% 50-74% 75% or more Don’t know
If estimated completeness is known:2di) Specify source of estimated completeness: ___________________2dii) If applicable, specify any population/area not covered by your registration system:
________________________ Not applicable Don’t know
3) Does your country have a cancer registry?
Yes No Don’t knowIf "No": Go to Question 4
If "Yes":3a) Are the data collected population-based, hospital-based, or other?
population-based hospital-based Other (specify: _____________) Don’t know
3b) Is the coverage of the registry national or subnational?
National (covers the whole population of the country) Subnational (covers only the population of a defined region, not the whole country) Don’t know
3c) What is the latest year for which data are available? ______________

ANNEX 2. NCD COUNTRY CAPACITY SURVEY 2019 QUESTIONNAIRE
77
4) Does your country have a diabetes registry?
Yes No Don’t know If "No": Go to Question 5
If "Yes":4a) Are the data collected population-based, hospital-based, or other?
population-based hospital-based Other (specify: _____________) Don’t know
4b) Is the coverage of the registry national or subnational?
National (covers the whole population of the country) Subnational (covers only the population of a defined region, not the whole country) Don’t know
4c) Does the registry include data on any chronic complications which are updated as the patient’s complications status changes? Yes No Don’t know 4d) What is the latest year for which data are available? ______________
5) Does your country have a system for recording patient information that includes NCD status (e.g. hypertension, diabetes, tobacco use status)?
Yes No Don’t knowIf "No": Go to Question 6
If "Yes":5a) Is it an electronic medical records/health records system?
Yes No Don’t know
5b) What is the coverage of the system?
National (covers the whole population of the country) Subnational (covers only the population of a defined region or regions or only certain
segments of the population) Don’t know
6) Has your country conducted a survey of facilities to assess service availability and readiness for NCDs?
Yes No Don’t knowIf "No": Go to Question 6
6a) Year of last survey ____________
6b) Coverage of last survey: National Subnational Don’t know

PROGRESS ON THE PREVENTION AND CONTROL OF NONCOMMUNICABLE DISEASES IN THE WESTERN PACIFIC REGION
78
III B: RISK FACTOR SURVEILLANCE
7) Have population-based surveys of risk factors (may be a single RF or multiple) been conducted in your country for any of the following:
(Please fill in all columns, start in the first row, going left to right, and then continue left to right across the second row.)
For the questions on surveys on adolescents or children, please include here only surveys specifically targeting adolescents or children (i.e. do not repeat adult surveys that may have covered part of the adolescent or child age range).
7a)Harmful alcohol use
Yes No Don’t know
If "No": Go to next row.
If "Yes":i) Was there a survey on adolescents? Yes No Don’t know
If "Yes":i-1) Was it: National Subnational Don’t know
i-2) How often is the survey conducted? Ad hoc Every 1 to 2 years Every 3 to 5 years Other Don’t know
i-3) When was the last survey conducted? (give year) ____
ii) Was there a survey on adults? Yes No Don’t know
If "Yes":ii-1) Was it: National Subnational Don’t know
ii-2) How often is the survey conducted? Ad hoc Every 1 to 2 years Every 3 to 5 years Other Don’t know
ii-3) When was the last survey conducted? (give year) _____
7b) Unhealthy diet
Yes No Don’t know
If "No": Go to next row.
If "Yes":i) Was there a survey on adolescents? Yes No Don’t know
If "Yes":i-1) Was it: 24 hour recall Food frequency Other Don’t know
i-2) Was it: National Subnational Don’t know
i-3) How often is the survey conducted? Ad hoc Every 1 to 2 years Every 3 to 5 years Other Don’t know
i-4) When was the last survey conducted? (give year) ____

ANNEX 2. NCD COUNTRY CAPACITY SURVEY 2019 QUESTIONNAIRE
79
7b)Unhealthy diet(cont.)
ii) Was there a survey on adults? Yes No Don’t know
If "Yes":ii-1) Was it: 24 hour recall Food frequency Other Don’t know
ii-2) Was it: National Subnational Don’t know
ii-3) How often is the survey conducted? Ad hoc Every 1 to 2 years Every 3 to 5 years Other Don’t know
ii-4) When was the last survey conducted? (give year) _____
7c)Physical inactivity
Yes No Don’t know
If "No": Go to next row.
If "Yes":i) Was there a survey on children? Yes No Don’t know
If "Yes":i-1) Was it: Measured Self-reported Don’t know
i-2) Was it: National Subnational Don’t know
i-3) How often is the survey conducted? Ad hoc Every 1 to 2 years Every 3 to 5 years Other Don’t know
i-4) When was the last survey conducted? (give year) ____
ii) Was there a survey on adolescents? Yes No Don’t know
If "Yes":ii-1) Was it: Measured Self-reported Don’t know
ii-2) Was it: National Subnational Don’t know
ii-3) How often is the survey conducted? Ad hoc Every 1 to 2 years Every 3 to 5 years Other Don’t know
ii-4) When was the last survey conducted? (give year) ____
iiI) Was there a survey on adults? Yes No Don’t know
If "Yes":ii-1) Was it: Measured Self-reported Don’t know
iii-2) Did it assess physical activity for work/in the household, for transport and during leisure time? Yes No Don’t know
iii-3) Was it: National Subnational Don’t know

PROGRESS ON THE PREVENTION AND CONTROL OF NONCOMMUNICABLE DISEASES IN THE WESTERN PACIFIC REGION
80
7c) Physical inactivity (cont.)
iii-4) How often is the survey conducted? Ad hoc Every 1 to 2 years Every 3 to 5 years Other Don’t know
iii-5) When was the last survey conducted? (give year) ____
7d)Tobacco use
Yes No Don’t know
If "No": Go to next row.
If "Yes":i) Was there a survey on adolescents? Yes No Don’t know
If "Yes":i-1) Was it: 24 hour recall Food frequency Other Don’t know
i-2) How often is the survey conducted? Ad hoc Every 1 to 2 years Every 3 to 5 years Other Don’t know
i-3) When was the last survey conducted? (give year) ____
ii) Was there a survey on adults? Yes No Don’t know
If "Yes":ii-1) Was it: National Subnational Don’t know
ii-2) How often is the survey conducted? Ad hoc Every 1 to 2 years Every 3 to 5 years Other Don’t know
ii-3) When was the last survey conducted? (give year) _____
7e)Raised blood glucose/diabetes
Yes No Don’t know
If "No": Go to next row.
If "Yes":i) Was it: Measured Self-reported Don’t know
ii) Was it: National Subnational Don’t know
iii) How often is the survey conducted? Ad hoc Every 1 to 2 years Every 3 to 5 years Other Don’t know
iv) When was the last survey conducted? (give year) ____
7f)Raised total cholesterol
Yes No Don’t know
If "No": Go to next row.
If "Yes":i) Was it: Measured Self-reported Don’t know
ii) Was it: National Subnational Don’t know
iii) How often is the survey conducted? Ad hoc Every 1 to 2 years Every 3 to 5 years Other Don’t know
iv) When was the last survey conducted? (give year) ____

ANNEX 2. NCD COUNTRY CAPACITY SURVEY 2019 QUESTIONNAIRE
81
7g) Raised blood pressure/Hypertension
Yes No Don’t know
If "No": Go to next row.
If "Yes":i) Was it: Measured Self-reported Don’t know
ii) Was it: National Subnational Don’t know
iii) How often is the survey conducted? Ad hoc Every 1 to 2 years Every 3 to 5 years Other Don’t know
iv) When was the last survey conducted? (give year) ____
7h) Overweight and obesity
Yes No Don’t know
If "No": Go to next row.
If "Yes":i) Was there a survey on children? Yes No Don’t know
If "Yes":i-1) Was it: Measured Self-reported Don’t know
i-2) Was it: National Subnational Don’t know
i-3) How often is the survey conducted? Ad hoc Every 1 to 2 years Every 3 to 5 years Other Don’t know
i-4) When was the last survey conducted? (give year) ____
ii) Was there a survey on adolescents? Yes No Don’t know
If "Yes":ii-1) Was it: Measured Self-reported Don’t know
ii-2) Was it: National Subnational Don’t know
ii-3) How often is the survey conducted? Ad hoc Every 1 to 2 years Every 3 to 5 years Other Don’t know
ii-4) When was the last survey conducted? (give year) ____
iii) Was there a survey on adults? Yes No Don’t know
If "Yes":ii-1) Was it: Measured Self-reported Don’t know
iii-2) Was it: National Subnational Don’t know
iii-4) How often is the survey conducted? Ad hoc Every 1 to 2 years Every 3 to 5 years Other Don’t know
iii-4) When was the last survey conducted? (give year) ____
PROGRESS ON THE PREVENTION AND CONTROL OF NONCOMMUNICABLE DISEASES IN THE WESTERN PACIFIC REGION
82
7i) Salt/Sodium intake
Yes No Don’t know
If "No": Go to MODULE IV.
If "Yes":
i) Was it: Measured by 24-hr urine collection Measured by 12-hr urine collection Measured by spot urine collection Measured by combination of urine collection methods Self-reported salt intake Don’t know
ii) Was it: National Subnational Don’t know
iii) How often is the survey conducted? Ad hoc Every 1 to 2 years Every 3 to 5 years Other Don’t know
iv) When was the last survey conducted? (give year) ____

ANNEX 2. NCD COUNTRY CAPACITY SURVEY 2019 QUESTIONNAIRE
83
IV: CAPACITY FOR NCD EARLY DETECTION, TREATMENT AND CARE WITHIN THE HEALTH SYSTEM
The questions in this module assess the health care systems capacity related to NCD early detection, treatment and care within the health care sector. Specific questions focus on availability of guidelines or protocols to treat major NCDs, and the tests, procedures and equipment related to NCDs within the health care system. It also assesses the availability of palliative care services for NCDs.
1a) Please indicate whether evidence-based national guidelines/protocols/standards are available for the management (diagnosis and treatment) of each of the major NCDs through a primary care approach recognized/approved by government or competent authorities. Where guidelines/protocols/standards are available, please indicate their implementation status, when they were last updated and whether they contain standard criteria for the referral of patients from primary care to a higher level of care (secondary/tertiary).
Cardiovascular disease
Diabetes Cancer Chronic respiratory
disease
i) Are they available?
Yes (specify topics covered)
No Don't Know
Yes No Don't Know
Yes (specify cancer types)
No Don't Know
Yes No Don't Know
ii) Do they include drug- and dose-specific protocols?
Yes No Don't Know
If "Yes": If there are multiple guidelines, specify for which conditions:__________
Yes No Don't Know
Yes No Don't Know
If "Yes": If there are multiple guidelines, specify for which cancers:__________
Yes No Don't Know
If "Yes": If there are multiple guidelines, specify for which conditions:__________
iii) Are they being utilized in at least 50% of health care facilities
Yes No Don’t know
Yes No Don’t know
Yes No Don’t know
Yes No Don’t know
iv) When were they last updated?
v) Do they include referral criteria?
Yes No Don’t know
Yes No Don’t know
Yes No Don’t know
Yes No Don’t know
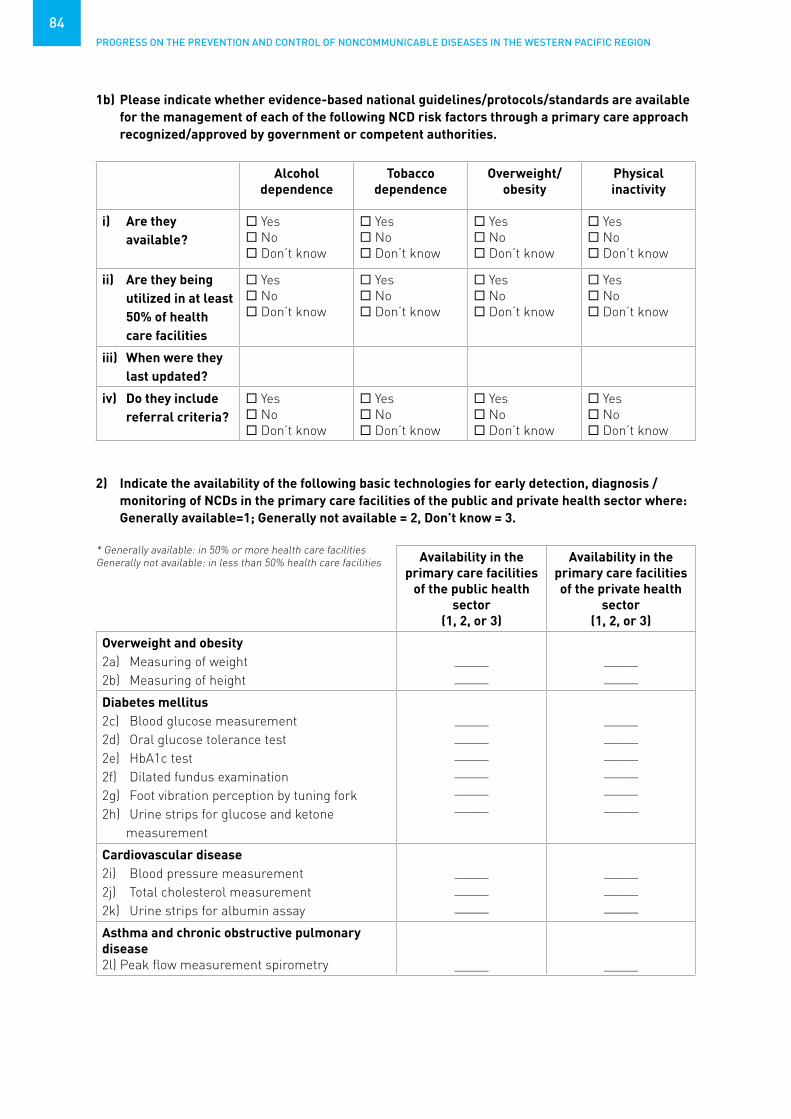
PROGRESS ON THE PREVENTION AND CONTROL OF NONCOMMUNICABLE DISEASES IN THE WESTERN PACIFIC REGION
84
1b) Please indicate whether evidence-based national guidelines/protocols/standards are available for the management of each of the following NCD risk factors through a primary care approach recognized/approved by government or competent authorities.
Alcohol dependence
Tobacco dependence
Overweight/obesity
Physical inactivity
i) Are they available?
Yes No Don’t know
Yes No Don’t know
Yes No Don’t know
Yes No Don’t know
ii) Are they being utilized in at least 50% of health care facilities
Yes No Don’t know
Yes No Don’t know
Yes No Don’t know
Yes No Don’t know
iii) When were they last updated?
iv) Do they include referral criteria?
Yes No Don’t know
Yes No Don’t know
Yes No Don’t know
Yes No Don’t know
2) Indicate the availability of the following basic technologies for early detection, diagnosis / monitoring of NCDs in the primary care facilities of the public and private health sector where: Generally available=1; Generally not available = 2, Don’t know = 3.
* Generally available: in 50% or more health care facilitiesGenerally not available: in less than 50% health care facilities Availability in the
primary care facilities of the public health
sector(1, 2, or 3)
Availability in the primary care facilities of the private health
sector (1, 2, or 3)
Overweight and obesity2a) Measuring of weight2b) Measuring of height
__________
__________
Diabetes mellitus2c) Blood glucose measurement2d) Oral glucose tolerance test2e) HbA1c test2f) Dilated fundus examination2g) Foot vibration perception by tuning fork 2h) Urine strips for glucose and ketone
measurement
______________________________
______________________________
Cardiovascular disease2i) Blood pressure measurement2j) Total cholesterol measurement2k) Urine strips for albumin assay
_______________
_______________
Asthma and chronic obstructive pulmonary disease2l) Peak flow measurement spirometry _____ _____

ANNEX 2. NCD COUNTRY CAPACITY SURVEY 2019 QUESTIONNAIRE
85
3) Please indicate if there is a national screening program targeting the general population for the following cancers and, If "Yes", provide details.
Cancers Initial screening method (indicate
only one, the most widely used)
Population targeted by the
program
Type of program Screening coverage
Breast Yes No Don’t know
If "No": Go to next row
Clinical breast exam
Mammography screening
Don’t know
Women aged …….. to …….Other, specify:
Don’t know
Organized population-based screening
Opportunistic screening
Don’t know
Less than 10% 10% to 50% More than 50%
but less than 70%
70% or more Don’t know
Cervix Yes No Don’t know
If "No": Go to next row
Visual inspection
PAP smear HPV test Don’t know
Women aged …….. to …….Other, specify:
Don’t know
Organized population-based screening
Opportunistic screening
Don't Know
Less than 10% 10% to 50% More than 50%
but less than 70%
70% or more Don’t know
Colon Yes No Don’t know If "No": Go to next row
Faecal test Colonoscopy/
sigmoidoscopy Don’t know
People aged …….. to …….Other, specify:
Don’t know
Organized population-based screening
Opportunistic screening
Don’t know
Less than 10% 10% to 50% More than 50%
but less than 70%
70% or more Don’t know
Other cancer type(s)Specify: _______
Yes No Don’t know
4) Please indicate if early detection of the following cancers by means of rapid identification of the first symptoms is integrated into primary health care services and if there is a clearly defined referral system from primary care to secondary / tertiary care for suspect cases (in low- and middle-income countries this set of measures may be designated as an “early diagnosis” programme):
Breast Cervix Colon Cancers in children
Other cancer types
(specify: ______)
Programme/guidelines to strengthen early diagnosis of first symptoms at primary health care level
Yes No Don’t know
Yes No Don’t know
Yes No Don’t know
Yes (please specify types of cancer)
No Don’t know
Yes No Don’t know

PROGRESS ON THE PREVENTION AND CONTROL OF NONCOMMUNICABLE DISEASES IN THE WESTERN PACIFIC REGION
86
Breast Cervix Colon Cancers in children
Other cancer types
(specify: ______)
Clearly defined referral system from primary care to secondary and tertiary care
Yes No Don’t know
Yes No Don’t know
Yes No Don’t know
Yes No Don’t know
Yes No Don’t know
5) Is HPV vaccination included in the national immunization schedule? Yes No Don’t know
If "No": Go to Question 6.
5a) What was the HPV vaccine coverage (last dose) in the last calendar year?
Less than 10%10% to 50%more than 50% but less than 80% 80% or moreDon’t know
6) Describe the availability of the medicines below in the primary care facilities of the public health sector, where: Generally available=1; Generally not available = 2, Don’t know = 3.* Generally available: in 50% or more pharmacies Generally not available: in less than 50% of pharmacies
Generic drug name Availability*
6a) Insulin
6b) Aspirin (75/100 mg)
6c) Metformin
6d) Thiazide diuretics
6e) ACE inhibitors
6f) Angiotensin II receptor blockers (ARBs)
6g) Calcium channel blockers
6h) Beta blockers
6i) Statins
6j) Oral morphine
6k) Steroid inhaler
6l) Bronchodilator
6m) Sulphonylurea(s)
6n) Benzathine penicillin injection
6o) Nicotine replacement therapy

ANNEX 2. NCD COUNTRY CAPACITY SURVEY 2019 QUESTIONNAIRE
87
7) Indicate the availability* of the following procedures for treating NCDs in the publicly funded health system, where: 1=Generally available; 2=Generally not available; 3=Don’t know. * Generally available: reaches 50% or more patients in need Generally not available: reaches less than 50% of patients in need
Procedure name Availability
7a) Retinal photocoagulation
7b) Renal replacement therapy by dialysis
7c) Renal replacement by transplantation
7d) Coronary bypass
7e) Coronary stenting
7f) Thrombolytic therapy (streptokinase) for acute myocardial infarction
7g) Bone marrow transplantation
8) Detail the availability of cancer diagnosis and treatment services in the public sector:* Generally available: reaches 50% or more patients in need Generally not available: reaches less than 50% of patients in need
Service Availability*
Cancer centres or cancer departments at tertiary level
Generally available Generally not available Don’t know
Pathology services (laboratories) Generally available Generally not available Don’t know
Cancer surgery Generally available Generally not available Don’t know
Chemotherapy Generally available Generally not available Don’t know
Radiotherapy Generally available Generally not available Don’t know
9) How many dedicated cancer centres are there in the country? Dedicated cancer centres are defined as providing multidisciplinary care including pathology, surgery, systematic therapy and radiotherapy. If you Don’t know the exact number, please give an estimated range.
Number of public cancer centres: ______________ Don’t knowNumber of private cancer centres: ______________ Don’t know

PROGRESS ON THE PREVENTION AND CONTROL OF NONCOMMUNICABLE DISEASES IN THE WESTERN PACIFIC REGION
88
10) Indicate the availability* of palliative care for patients with NCD in the public health system:* Generally available: reaches 50% or more patients in need Generally not available: reaches less than 50% of patients in need
10a) In primary health care facilities:
Generally available Generally not available Don’t know
10b) In community or home-based care:
Generally available Generally not available Don’t know
11) What proportion of primary health care facilities are offering cardiovascular risk stratification for the management of patients at high risk for heart attack and stroke?
none less than 25% 25% to 50% More than 50% Don’t know
If more than "none": 11a) Which CVD risk scoring chart is used?
WHO/ISH risk prediction charts Others (specify ___________) Don’t know
12) Indicate the availability* of services for stroke in the public health system:* Generally available: reaches 50% or more patients in need Generally not available: reaches less than 50% of patients in need
12a) Provision of care for acute stroke:
Generally available Generally not available Don’t know
12b) Rehabilitation for stroke patients:
Generally available Generally not available Don’t know
13) Is there a register of patients who have had rheumatic fever and rheumatic heart disease? Yes No Don’t know
If "Yes":13a) Are there systems for follow-up/recall to deliver long-term penicillin prophylaxis? Yes No Don’t know

ANNEX 2. NCD COUNTRY CAPACITY SURVEY 2019 QUESTIONNAIRE
89
Academia: Refers to educational institutions, especially those for higher education.
Broadcast media: Media which is broadcast to the public through radio and television.
Cancer: A generic term for a large group of diseases that can affect any part of the body. Other terms used are malignant tumours and neoplasms. One defining feature of cancer is the rapid creation of abnormal cells that grow beyond their usual boundaries, and which can then invade adjoining parts of the body and spread to other organs.
Cancer registry: A systematic collection of data about cancer cases in a certain region or a certain hospital. The first aim is to count cancer cases to get an idea of the magnitude of the problem. WHO advises national coverage by population-based registry in small countries only.
Capacity-building: The development of knowledge, skills, commitment, structures, systems and leadership to enable effective action.
Cardiovascular diseases: A group of disorders of the heart and blood vessels that includes coronary heart disease, cerebrovascular disease, peripheral arterial disease, rheumatic heart disease, congenital heart disease, deep vein thrombosis and pulmonary embolism.
Cardiovascular risk assessment: Use of risk prediction charts to indicate the risk of a fatal or non-fatal major cardiovascular event in the next 5 to 10 years. Based on the assessment people can be stratified into different levels of risk, which will help in management and follow up.
Chronic respiratory diseases: Diseases of the airways and other structures of the lung. Some of the most common are: asthma, chronic obstructive pulmonary disease, occupational lung diseases and pulmonary hypertension.
Civil registration: The system by which a government records the vital events of its citizens and residents, such as births, deaths and marital status, and cause of death.
Collaboration: A recognized relationship between different groups with a defined purpose.
Community: A specific group of people, often living in a defined geographical area, who share a common culture, values and norms, and are arranged in a social structure according to relationships which the community has developed over a period of time. Members of a community exhibit some awareness of their identity as a group, and share common needs and a commitment to meeting them.
Cross-border marketing: Marketing originating in one country that crosses national borders through broadcast media and internet, print media, sponsorship of events and programmes or any other media or communication channel. It includes both in-flowing and out-flowing cross-border marketing.
Diabetes: A disease that occurs either when the pancreas does not produce enough insulin or when the body cannot effectively use the insulin it produces.
Early detection/screening: Measures performed in order to identify individuals who have early stages of a disease (with apparent symptoms in the case of early detection and without in the case of screening).
Earmarked taxes: Taxes which are collected and used for a specific purpose.
Fiscal interventions: Measures taken by the government such as taxes and subsidies.
GLOSSARY

PROGRESS ON THE PREVENTION AND CONTROL OF NONCOMMUNICABLE DISEASES IN THE WESTERN PACIFIC REGION
90
Free sugars: Monosaccharides and disaccharides added to foods by the manufacturer, cook or consumer, plus sugars naturally present in honey, syrups, fruit juices and fruit juice concentrates.
Front-of-pack labelling (FOPL): Nutrition labelling systems that are presented on the front of food packages (in the principle field of vision) and can be applied across the packaged retail food supply. FOPL comprise an underpinning nutrient profile model that considers the overall nutrition quality of the product and/or the nutrients of concern for NCD; and presents simple, often graphic information on the nutrient content and/or nutritional quality of products to complement the more detailed nutrient declarations usually provided on the back of food packages. There are two major categories of FOPL, including interpretive and non-interpretive systems. Non-interpretive nutrient-based systems provide a summary of nutrient information, but no advice on the overall nutritional value of the food to assist with purchasing decisions. Interpretive systems may provide no nutrient information but only at-a-glance guidance on the relative healthiness of a product.
Full immunization coverage: The proportion of people in the population targeted by the programme who actually received the full dose(s) of vaccine.
General government revenue: The money received from taxation, and other sources, such as privatization of government assets, to help finance expenditures.
Health: A state of complete physical, social and mental well-being, and not merely the absence of disease or infirmity. A resource for everyday life which permits people to lead an individually, socially and economically productive life. A positive concept emphasizing social and personal resources as well as physical capabilities.
Health behaviour: Any activity undertaken by an individual, regardless of actual or perceived health status, for the purpose of promoting, protecting or maintaining health, whether or not such behaviour is objectively effective towards that end.
Health care and treatment: The diagnosis and treatment of diseases.
Health care facility: Facilities which provide health services. They may include mobile clinics, pharmacies, laboratories, primary health care clinics, specialty clinics, and private and faith-based establishments.
Health promotion: The process of enabling people to increase control over, and to improve their health.
Healthy diet: A healthy diet throughout the life-course helps prevent malnutrition in all its forms as well as a range of noncommunicable diseases (NCDs) and conditions. The exact make-up of a healthy, balanced diet will vary depending on the individual needs (e.g. age, gender, lifestyle, degree of physical activity). For adults, a healthy diet contains fruits, vegetables, legumes, nuts and whole grains and should be limited in free sugars, salt, total fat, saturated fats and free of industrial trans-fats.
International donors: Organizations which extend across national boundaries and which give funds for projects of a development nature.
Intervention: Any measure whose purpose is to improve health or alter the course of disease.
Legislation: A law or laws which have been enacted by the governing bodies in a country.
Marketing: Any form of commercial communication or message that is designed to, or has the effect of, increasing the recognition, appeal and/or consumption of particular products and services. It comprises anything that acts to advertise or otherwise promote a product or service.
mHealth: The use of mobile and wireless technologies to support the achievement of health objectives.
Multisectoral: Involving different sectors, such as health, agriculture, education, finance, infrastructure, transport, trade, etc.

ANNEX 2. NCD COUNTRY CAPACITY SURVEY 2019 QUESTIONNAIRE
91
Multisectoral collaboration: A recognized relationship between part or parts of different sectors of society (such as ministries (e.g. health, education), agencies, nongovernmental agencies, private for-profit sector and community representation) which has been formed to take action to achieve health outcomes in a way that is more effective, efficient or sustainable than might be achieved by the health sector acting alone.
Multi-stakeholder: Involving stakeholders from across the public sector, civil society, NGOs and the private sector.
National Cancer Screening Programme: A government-endorsed programme where screening is offered. NGO-led programmes or national recommendations to go for screening at one’s own cost, do not qualify as national screening programmes.
National focal point, unit or department:i. National focal point: the person responsible for the prevention and control of chronic diseases
in a ministry of health or national institute.ii. Unit or department: a unit or department with responsibility for NCD disease prevention and
control in a ministry of health or national institute.
National health reporting system, survey and surveillance:i. Health reporting system: The process by which a ministry of health produces annual health
reports that summarize data on, for example, national health human resources, population demographics, health expenditures, and health indicators such as mortality and morbidity. Includes the process of collecting data from various health information sources, e.g. disease registries, hospital admission or discharge data.
ii. Survey: A fixed or unfixed time interval survey on the main chronic diseases, or major risk factors common to chronic diseases.
iii. Surveillance: The systematic collection of data (through survey or registration) on risk factors, chronic diseases and their determinants for continuous analysis, interpretation and feed-back.
National integrated action plan: A concerted approach to addressing a multiplicity of issues within a chronic disease prevention and health promotion framework, targeting the major risk factors common to the main chronic diseases, including the integration of primary, secondary and tertiary prevention, health promotion and diseases prevention programmes across sectors and disciplines.
National policy, strategy and action plan:i. Policy: A specific official decision or set of decisions designed to carry out a course of action endorsed by a political body, including a set of goals, priorities and main directions for attaining these goals. The policy document may include a strategy to give effect to the policy.ii. Strategy: a long-term plan designed to achieve a particular goal. iii. Action plan: A scheme of course of action, which may correspond to a policy or strategy, with defined activities indicating who does what (type of activities and people responsible for implementation), when (time frame), how and with what resources to accomplish an objective.
National protocols/guidelines/standards for chronic diseases and conditions: A recommended evidence-based course of action to prevent a chronic disease or condition or to treat or manage a chronic disease or condition aiming to prevent complications, improve outcomes and quality of life of patients.
NGO: Nongovernmental organization.
Noncommunicable diseases (NCDs): The four main types of noncommunicable diseases are cardiovascular diseases (such as heart attacks and stroke), cancers, chronic respiratory diseases (such as chronic obstructed pulmonary disease and asthma) and diabetes.

PROGRESS ON THE PREVENTION AND CONTROL OF NONCOMMUNICABLE DISEASES IN THE WESTERN PACIFIC REGION
92
NCD prevention and control: All activities related to surveillance, prevention and management of the chronic noncommunicable diseases.
Not in effect: Any policy, strategy or plan of action which has been previously developed and is no longer under development, but for various reasons is not being implemented.
Nutrition labelling: A description intended to inform consumers of the nutritional properties of food. Nutrition labelling consists of two components: (a) nutrient declaration; (b) supplementary nutrition information (e.g. front-of-pack labelling).
Operational: A policy, strategy or plan of action which is being used and implemented in the country, and has resources and funding available to implement it. Also applies to a multisectoral commission/mechanism which is functional and meets on a regular basis.
Palliative care: Palliative care is an approach that improves the quality of life of patients (adults and children) and their families who are facing problems associated with life-threatening illness. It prevents and relieves suffering through the early identification, correct assessment and treatment of pain and other problems, whether physical, psychosocial or spiritual.
Partnership for health: An agreement between two or more partners to work cooperatively towards a set of shared health outcomes.
Price subsidies: Economic benefit provided by the government (such as a tax allowance or duty rebate) to keep the price of healthy foods low.
Primary health care: Refers to core functions of a nation’s health system. Encompassing front-line health service delivery (primary care) as well as health system structure; governance and financing; the intersectoral policy environment; and social determinants of health, primary health care provides essential health interventions according to a community’s needs and expectations.
Primary prevention: Measures directed towards preventing the initial occurrence of a disease or disorder.
Print media: Communicating with the public through printed materials such as magazines, newspapers and billboards.
Product reformulation by industry: Refers to the process of changing the composition of processed foods to be healthier and reduce the salt content.
Public awareness programme: A comprehensive effort that includes multiple components (messaging, grassroots outreach, media relations, government affairs, budget, etc.) to help increase public understanding about the importance of an issue.
Public health sector: Publicly funded health care sector.
Rehabilitation: A set of measures that assist individuals who experience, or are likely to experience, disability to achieve and maintain optimal functioning in interaction with their environments.
Risk factors associated with noncommunicable diseases: The four main risk factors for NCDs are tobacco use, harmful use of alcohol, unhealthy diet and low levels of physical activity.
Sample registration system: A method and procedure for estimating vital statistics in national and regional populations by intensively registering and verifying vital events in population samples. For instance, in India more than 4000 rural and 2000 urban sample units, with a total of more than 6 million persons, i.e., less than 1% of the total national population, are included in a sample registration system that provides a reasonably reliable picture of the national pattern of vital events at a cost that is feasible and reasonable.

ANNEX 2. NCD COUNTRY CAPACITY SURVEY 2019 QUESTIONNAIRE
93
Saturated fats: Fats found in animal products, including meat and whole milk dairy products, as well as certain plant oils like palm, palm kernel and coconut oils.
Screening: Measures preformed across an apparently healthy population in order to identify individuals who are at high risk or in the early stages of disease, but do not yet have symptoms.
Screening coverage: The proportion of people in the population targeted by the programme who actually received screening in the time frame defined by the programme. (For example, if a country recommends mammography screening every 2 years for women aged 50 to 60. The screening coverage is the number of women aged 50 to 60 who benefitted from mammography thanks to the programme in the past 2 years, divided by the total number of women aged 50 to 60 in the country.)
Self-regulation: In this context refers to when a group or private sector entity governs or polices itself without outside assistance or influence.
Sugar-sweetened beverages: All types of beverages containing free sugars and these include carbonated or non-carbonated soft drinks, fruit/vegetable juices and drinks, liquid and powder concentrates, flavoured water, energy and sports drinks, ready-to-drink tea, ready-to-drink coffee, and flavoured milk drinks. Free sugars include monosaccharide and disaccharides added to foods and beverages by the manufacturer, cook or consumer, and sugars naturally present in honey, syrups, fruit juices and fruit juice concentrates.
Target: A specific aim to be achieved, should be time-bound, and define a "desired", "promised", "minimum" or "aspirational" level of achievement.
Taxation incentives to promote physical activity: Involve removing the tax (or a portion of the tax) in order to promote increased use of goods or services to encourage physical activity.
Trans-fatty acids (trans-fats): Unsaturated fatty acids with at least one double carbon–carbon bond in the trans configuration. Trans-fatty acids can be produced industrially by the partial hydrogenation of vegetable and fish oils, but also occur naturally in meat and dairy products from ruminant animals (e.g. cattle, sheep, goats, camels). Industrially-produced trans-fatty acids can be found in baked and fried foods, pre-packaged snacks and food, and partially hydrogenated cooking oils and fats which are often used at home, in restaurants, or in the informal food sector (such as street vendors), and are the predominant source of trans-fatty acid intake in many populations.
Under development: Something which is still being developed or finalized and is not yet being implemented in the country.
VAT/Sales tax: “Value-added tax” (VAT) is a “multi-stage” tax on all consumer goods and services applied proportionally to the price the consumer pays for a product. Although manufacturers and wholesalers also participate in the administration and payment of the tax all along the manufacturing/distribution chain, they are all reimbursed through a tax credit system, so that the only entity who pays in the end is the final consumer. Most countries that impose a VAT do so on a base that includes any excise tax and customs duty. Example: VAT representing 10% of the retail price. Some countries, however, impose sales taxes instead. Unlike VAT, sales taxes are levied at the point of retail on the total value of goods and services purchased.

94
ANNEX 3
INDICATOR DEFINITIONS AND SPECIFICATIONS, THE STATUS OF COUNTRIES AND AREAS
Definition Country has set national NCD targets. The NCD-related targets should be time-bound and based on the 9 voluntary global targets and the WHO Global Monitoring Framework.
Data collection tool and achievement criteria
WHO NCD Country Capacity Survey tool – The NCD CCS is completed by a team at the country level to ensure a comprehensive response is compiled.
This indicator is considered fully achieved if a country responds “Yes” to the question “Are there a set of time-bound national targets for NCDs based on the 9 voluntary global targets from the WHO Global Monitoring Framework for NCDs?”, and provides the needed supporting documentation. Targets must be time-bound, based on the 9 global targets, and need to address NCD mortality, as well as key risk factors in the country and/or health systems.
This indicator is considered partially achieved if the country responds “Yes” to the question “Are there a set of time-bound national targets for NCDs based on the 9 voluntary global targets from the WHO Global Monitoring Framework for NCDs ?”, but the targets do not cover two of the three areas addressed in the 9 global targets (including mortality) or they are not time-bound.
Member State has set time-bound national targets based on WHO guidance

ANNEX 3. INDICATOR DEFINITIONS AND SPECIFICATIONS, THE STATUS OF COUNTRIES AND AREAS
95
Data validation process
Countries are asked to submit a copy of their targets when submitting their response to the NCD CCS. WHO will confirm that document providedis indeed a set of national NCD targets, addressing NCD mortality, as well as key risk factors in the country, and/or health systems, based on the 9 global targets, and that these targets are time-bound (e.g. include such language as “by 2025”). Where discrepancies are noted, these are referred back to the country for clarification and modification.
Expected frequency of data collection
Every 2 years
Links to tool http://www.who.int/ncds/surveillance/ncd-capacity/en/
No. Country/area 2015 2017 2019
1 Australia Partially achieved Partially achieved Not achieved
2 Brunei Darussalam Fully achieved Fully achieved Fully achieved
3 Hong Kong SAR (China) Not achieved Not achieved Fully achieved
4 Japan Fully achieved Fully achieved Fully achieved
5 Macao SAR (China) Not achieved Not achieved Not achieved
6 New Zealand Not achieved Not achieved Not achieved
7 Republic of Korea Fully achieved Fully achieved Fully achieved
8 Singapore Fully achieved Partially achieved Partially achieved
% Fully achieved: HICs (N=8) 4 (50%) 3 (38%) 4 (50%)
1 Cambodia Partially achieved Partially achieved Fully achieved
2 China Fully achieved Fully achieved Fully achieved
3 Lao People's Democratic Republic
Partially achieved Partially achieved Partially achieved
4 Malaysia Fully achieved Fully achieved Fully achieved
5 Mongolia Fully achieved Fully achieved Fully achieved
6 Philippines Not achieved Not achieved Fully achieved
7 Viet Nam Fully achieved Fully achieved Fully achieved
% Fully achieved: LMICs (N=7)
4 (57%) 4 (57%) 6 (86%)
Indicator 1. Country or area has set time-bound national targets and indicators based on WHO guidance

PROGRESS ON THE PREVENTION AND CONTROL OF NONCOMMUNICABLE DISEASES IN THE WESTERN PACIFIC REGION
96
No. Country/area 2015 2017 2019
1 American Samoa No data Partially achieved No response
2 Cook Islands No data Partially achieved Fully achieved
3 Fiji Fully achieved Fully achieved Fully achieved
4 French Polynesia Not achieved Not achieved Not achieved
5 Guam Fully achieved Fully achieved Fully achieved
6 Kiribati Partially achieved Partially achieved Partially achieved
7 Marshall Islands Fully achieved Fully achieved Not achieved
8 Micronesia (Federated States of)
Partially achieved Partially achieved Not achieved
9 Nauru Not achieved Fully achieved Fully achieved
10 New Caledonia – Not achieved Not achieved
11 Niue Partially achieved Not achieved Not achieved
12 Northern Mariana Islands (Commonwealth of the)
Not achieved Not achieved Not achieved
13 Palau Partially achieved Partially achieved Partially achieved
14 Papua New Guinea Partially achieved Partially achieved Partially achieved
15 Samoa No data Not achieved Not achieved
16 Solomon Islands Fully achieved Fully achieved Fully achieved
17 Tokelau No data Partially achieved Partially achieved
18 Tonga Fully achieved Fully achieved Fully achieved
19 Tuvalu Fully achieved Partially achieved Partially achieved
20 Vanuatu Not achieved Fully achieved Fully achieved
21 Wallis and Futuna – No data No response
% Fully achieved: PICs (N=21)
6 (29%) 7 (33%) 7 (33%)
TOTAL (N=36) 14 (39%) 14 (39%) 17 (50%)
– : Documentation not available

ANNEX 3. INDICATOR DEFINITIONS AND SPECIFICATIONS, THE STATUS OF COUNTRIES AND AREAS
97
Definition Country has a vital registration system that captures deaths and the causes of death routinely. The International Form of Medical Certificate of the Cause of Death is completed by certifiers. The International Classification of Diseases (ICD) is used to code the causes of death. The data compiled are made available to policy-makers and researchers.
Data collection tool and achievement criteria
The WHO collects mortality data, including cause of death, from civil registration systems in the WHO mortality database through a routine annual call for data. Data are considered to generate reliable cause- specific mortality data on a routine basis if:
• Data from the five most recent reporting years are, on average, at least 70% usable. Usability is calculated as (Completeness (%))*(1- Proportion Garbage)1.
• At least five years of cause-of-death data have been reported to the WHO in the last 10 years.
• The most recent year of data reported to the WHO is no more than 5 years old.
This indicator is considered fully achieved if the country meets all of the above criteria.
This indicator is considered partially achieved if the country does not meet all of the above criteria but has submitted some vital registration data to WHO.
Data validation process
Data submitted are verified and inconsistencies are referred back to countries to resolve.
Expected frequency of data collection
Yearly
Links to tool http://www.who.int/healthinfo/tool_cod_2010.pdf
1 For further details, see page 5 the WHO Methods and Data Sources for Country‐Level Causes of Death 2000–2015: http://www.who.int/healthinfo/global_burden_disease/GlobalCOD_method_2000_2015.pdf
Country or area has a functioning system for generating reliable cause-specific mortality data on a routine basis

PROGRESS ON THE PREVENTION AND CONTROL OF NONCOMMUNICABLE DISEASES IN THE WESTERN PACIFIC REGION
98
No. Country/area 2015 2017 2019
1 Australia Fully achieved Fully achieved Fully achieved
2 Brunei Darussalam Partially achieved Fully achieved Fully achieved
3 Hong Kong SAR (China) Fully achieved* Fully achieved No data
4 Japan Fully achieved Fully achieved Fully achieved
5 Macao SAR (China) No data No data No data
6 New Zealand Fully achieved Fully achieved Fully achieved
7 Republic of Korea Fully achieved Fully achieved Fully achieved
8 Singapore Fully achieved Fully achieved Fully achieved
% Fully achieved: HICs (N=8) 6 (75%) 7 (88%) 6 (75%)
1 Cambodia Not achieved Not achieved Not achieved
2 China Partially achieved Partially achieved Partially achieved
3 Lao People’s Democratic Republic
Not achieved Not achieved Not achieved
4 Malaysia Partially achieved Partially achieved Partially achieved
5 Mongolia Partially achieved Partially achieved Partially achieved
6 Philippines Fully achieved Partially achieved Fully achieved
7 Viet Nam Not achieved Not achieved Not achieved
% Fully achieved: LMICs (N=7)
1 (14%) 0 (0%) 1 (14%)
1 American Samoa No data No data No data
2 Cook Islands Partially achieved Partially achieved Fully achieved
3 Fiji Partially achieved Fully achieved Partially achieved
4 French Polynesia No data No data No data
5 Guam No data No data No data
6 Kiribati Partially achieved Partially achieved Fully achieved
7 Marshall Islands Not achieved Not achieved Not achieved
8 Micronesia (Federated States of)
Not achieved Not achieved Not achieved
9 Nauru Not achieved Not achieved Not achieved
10 New Caledonia No data No data No data
Indicator 2. Country or area has a functioning system for generating reliable cause-specific mortality data on a routine basis

ANNEX 3. INDICATOR DEFINITIONS AND SPECIFICATIONS, THE STATUS OF COUNTRIES AND AREAS
99
No. Country/area 2015 2017 2019
11 Niue Not achieved Not achieved Not achieved
12 Northern Mariana Islands (Commonwealth of the)
No data No data No data
13 Palau Not achieved Not achieved Not achieved
14 Papua New Guinea Not achieved Not achieved Not achieved
15 Samoa Not achieved Not achieved Not achieved
16 Solomon Islands Not achieved Not achieved Not achieved
17 Tokelau No data No data No data
18 Tonga Not achieved Not achieved Not achieved
19 Tuvalu Not achieved Not achieved Not achieved
20 Vanuatu Not achieved Not achieved Not achieved
21 Wallis and Futuna No data No data No data
% Fully achieved: PICs (N=21)
0 (0%) 1 (5%) 2 (10%)
TOTAL (N=36) 7 (19%) 8 (22%) 9 (26%)
* As reported by the area.

PROGRESS ON THE PREVENTION AND CONTROL OF NONCOMMUNICABLE DISEASES IN THE WESTERN PACIFIC REGION
100
Definition Country has completed a STEPS survey or another risk factor survey which includes physical measurements and biochemical assessments covering the key behavioural and metabolic risk factors for NCDs. Country must indicate that survey frequency is at least every five years.
Data collection tool and achievement criteria
WHO NCD Country Capacity Survey tool – The NCD CCS is completed by a team at the country level to ensure a comprehensive response is compiled.
This indicator is considered fully achieved if the country responds “Yes” to each of the following for adults: “Have surveys of risk factors (may be a single RF or multiple) been conducted in your country for all of the following:” “Harmful alcohol use” (optional for the Member States where there is a ban on alcohol), “Physical inactivity”, “Tobacco use”, “Raised blood glucose/diabetes”, “Raised blood pressure/hypertension”, “Overweight and obesity”, and “Salt / Sodium intake”. For risk factors “Raised blood glucose/diabetes”, “Raised blood pressure/hypertension”, and “Overweight and obesity”, the data must be measured, not self- reported. Additionally, for each risk factor, the country must indicate that the last survey was conducted in the past five years (i.e. 2012 or later for the 2017 CCS survey responses) and must respond “Every 1 to 2 years” or “Every 3 to 5 years” to the subquestion “How often is the survey conducted?”. The country must also provide the needed supporting documentation.
This indicator is considered partially achieved if the country responds that at least three, but not all, of the above risk factors are covered, or the surveys were conducted more than five years ago but less than 10 years ago.
Data validation process
Countries are asked to submit a copy of their survey report(s) when submitting their response to the NCD CCS. Where discrepancies are noted, these are referred back to the country for clarification and modification. Data are also checked against the STEPS tracking system which records details of STEPS surveys undertaken by countries.
Expected frequency of data collection
Every two years
Links to tool http://www.who.int/ncds/surveillance/ncd-capacity/en/
Member State has a STEPS survey or a comprehensive health examination survey every five years

ANNEX 3. INDICATOR DEFINITIONS AND SPECIFICATIONS, THE STATUS OF COUNTRIES AND AREAS
101
No. Country/area 2015 2017 2019
1 Australia Fully achieved Partially achieved Partially achieved
2 Brunei Darussalam Fully achieved Fully achieved Fully achieved
3 Hong Kong SAR (China) Partially achieved Partially achieved Partially achieved
4 Japan Fully achieved Fully achieved Fully achieved
5 Macao SAR (China) Partially achieved Partially achieved Partially achieved
6 New Zealand Fully achieved Partially achieved Partially achieved
7 Republic of Korea Fully achieved Fully achieved Fully achieved
8 Singapore Fully achieved Partially achieved Partially achieved
% Fully achieved: HICs (N=8) 6 (75%) 3 (38%) 3 (38%)
1 Cambodia Fully achieved Fully achieved Fully achieved
2 China Fully achieved Fully achieved Fully achieved
3 Lao People’s Democratic Republic
Fully achieved Partially achieved Partially achieved
4 Malaysia Fully achieved Fully achieved Fully achieved
5 Mongolia Fully achieved Fully achieved Fully achieved
6 Philippines Fully achieved Fully achieved Partially achieved
7 Viet Nam Fully achieved* Fully achieved Fully achieved
% Fully achieved: LMICs (N=7)
7 (100%) 6 (86%) 5 (71%)
1 American Samoa No data Partially achieved No response
2 Cook Islands No data Partially achieved Partially achieved
3 Fiji Fully achieved Partially achieved Partially achieved
4 French Polynesia Partially achieved Partially achieved Partially achieved
5 Guam Partially achieved Partially achieved Partially achieved
6 Kiribati Not achieved Fully achieved Partially achieved
7 Marshall Islands Not achieved Not achieved Partially achieved
8 Micronesia (Federated States of)
Partially achieved Partially achieved Partially achieved
9 Nauru Not achieved Partially achieved Fully achieved
10 New Caledonia Partially achieved Partially achieved Partially achieved
Indicator 3. Country or area has a STEPS survey or a comprehensive health examination survey every five years

PROGRESS ON THE PREVENTION AND CONTROL OF NONCOMMUNICABLE DISEASES IN THE WESTERN PACIFIC REGION
102
No. Country/area 2015 2017 2019
11 Niue Partially achieved Partially achieved Partially achieved
12 Northern Mariana Islands (Commonwealth of the)
Partially achieved Fully achieved Fully achieved
13 Palau Partially achieved Partially achieved Partially achieved
14 Papua New Guinea Partially achieved Partially achieved Not achieved
15 Samoa No data Fully achieved Partially achieved
16 Solomon Islands Partially achieved Fully achieved Fully achieved
17 Tokelau No data Partially achieved Fully achieved
18 Tonga Partially achieved Partially achieved Fully achieved
19 Tuvalu Partially achieved Fully achieved Partially achieved
20 Vanuatu Partially achieved Partially achieved Partially achieved
21 Wallis and Futuna Partially achieved No response No response
% Fully achieved: PICs (N=21)
1 (5%) 5 (24%) 5 (24%)
TOTAL (N=36) 14 (39%) 14 (39%) 13 (38%)
* As reported by the country.
ANNEX 3. INDICATOR DEFINITIONS AND SPECIFICATIONS, THE STATUS OF COUNTRIES AND AREAS
103
Definition Country has a multisectoral, national integrated NCD and risk factor policy/strategy/action plan that addresses the 4 main NCDs (cardiovascular diseases, diabetes, cancer, chronic respiratory diseases) and their main risk factors (tobacco use, unhealthy diet, physical inactivity, harmful use of alcohol).
“Multisectoral” refers to engagement with one or more government sectors outside of health. “Operational” refers to a policy, strategy or action plan which is being used and implemented in the country, and has resources and funding available to implement it.
Data collection tool and achievement criteria
WHO NCD Country Capacity Survey tool – The NCD CCS is completed by a team at the country level to ensure a comprehensive response is compiled.
This indicator is considered fully achieved if the country responds “Yes” to the questions “Does your country have a national NCD policy, strategy or action plan which integrates several NCDs and their risk factors?” and to the subquestion “ Is it multisectoral?”. Countries also have to respond “operational” to the subquestion “Indicate its stage” and “Yes” to all of the subquestions pertaining to the four main risk factors and four main NCDs: “Does it address one or more of the following major risk factors?” “Harmful use of alcohol” (optional for the Member States where there is a ban on alcohol), “Unhealthy diet”, “Physical inactivity”, “tobacco” (all four must have “Yes”) and “Does it combine early detection, treatment and care for:” “Cancer”, “Cardiovascular diseases”, “ Chronic respiratory diseases” and “Diabetes” (all four must have “Yes”). Country must also provide the needed supporting documentation.
This indicator is considered partially achieved if the country responds “Yes” to the questions “Does your country have a national NCD policy, strategy or action plan which integrates several NCDs and their risk factors?” and to the subquestion “ Is it multisectoral?”. Countries also have to respond “operational” to the subquestion “Indicate its stage” and “Yes” to at least two of the four main risk factors and at least two of the four main NCDs.
Data validation process
Countries are asked to submit a copy of their policy/strategy/action plan when submitting their response to the NCD CCS. Where discrepancies are noted, these are referred back to the country for clarification and modification.
Expected frequency of data collection
Every two years
Links to tool http://www.who.int/ncds/surveillance/ncd-capacity/en/
Member State has an operational multisectoral national strategy/action plan that integrates the major NCDs and their shared risk factors

PROGRESS ON THE PREVENTION AND CONTROL OF NONCOMMUNICABLE DISEASES IN THE WESTERN PACIFIC REGION
104
No. Country/area 2015 2017 2019
1 Australia Fully achieved Partially achieved Not achieved
2 Brunei Darussalam Partially achieved Fully achieved Fully achieved
3 Hong Kong SAR (China) Fully achieved Fully achieved Partially achieved
4 Japan Fully achieved Fully achieved Fully achieved
5 Macao SAR (China) Fully achieved Fully achieved Partially achieved
6 New Zealand Not achieved Not achieved Not achieved
7 Republic of Korea Partially achieved Partially achieved Partially achieved
8 Singapore Not achieved Partially achieved Partially achieved
% Fully achieved: HIC (N=8) 4 (50%) 4 (50%) 2 (25%)
1 Cambodia Not achieved Not achieved Not achieved
2 China Fully achieved Fully achieved Fully achieved
3 Lao People’s Democratic Republic
Not achieved Fully achieved Fully achieved
4 Malaysia Not achieved Partially achieved Partially achieved
5 Mongolia Fully achieved Fully achieved Fully achieved
6 Philippines Fully achieved Not achieved Fully achieved
7 Viet Nam Fully achieved Fully achieved Fully achieved
% Fully achieved: LMIC (N=7)
4 (57%) 4 (57%) 5 (71%)
1 American Samoa No data No data No response
2 Cook Islands No data Fully achieved Fully achieved
3 Fiji Partially achieved Partially achieved Partially achieved
4 French Polynesia Not achieved Not achieved Fully achieved
5 Guam Fully achieved Fully achieved Fully achieved
6 Kiribati Fully achieved Not achieved Fully achieved
7 Marshall Islands Not achieved Not achieved Not achieved
8 Micronesia (Federated States of)
Fully achieved Not achieved Partially achieved
9 Nauru Not achieved Fully achieved Fully achieved
10 New Caledonia Not achieved Not achieved Not achieved
Indicator 4. Country or area has an operational multisectoral national strategy/action plan that integrates the major NCDs and their shared risk factors

ANNEX 3. INDICATOR DEFINITIONS AND SPECIFICATIONS, THE STATUS OF COUNTRIES AND AREAS
105
No. Country/area 2015 2017 2019
11 Niue Partially achieved Not achieved Not achieved
12 Northern Mariana Islands (Commonwealth of the)
Not achieved Not achieved Not achieved
13 Palau Partially achieved Partially achieved Partially achieved
14 Papua New Guinea Not achieved Partially achieved Partially achieved
15 Samoa No data Not achieved Fully achieved
16 Solomon Islands Fully achieved Fully achieved Fully achieved
17 Tokelau No data Not achieved Partially achieved
18 Tonga Partially achieved Fully achieved Fully achieved
19 Tuvalu Not achieved Not achieved Not achieved
20 Vanuatu Not achieved Fully achieved Fully achieved
21 Wallis and Futuna Not achieved No data No response
% Fully achieved: PIC (N=21) 4 (19%) 6 (29%) 9 (43%)
TOTAL (N=36) 12 (33%) 14 (39%) 16 (47%)

PROGRESS ON THE PREVENTION AND CONTROL OF NONCOMMUNICABLE DISEASES IN THE WESTERN PACIFIC REGION
106
Definition Member State has implemented measures to reduce affordability by increasing excise taxes and prices on tobacco products
Data collection tool and achievement criteria
Data collected from governments for the production of the WHO Report on the Global Tobacco Epidemic.
Total taxes (including excise tax, value-added/sales tax, import duties (where applicable) and any other taxes levied) are calculated as a proportion of the price of the tobacco product. Currently, this is calculated in relation to the most sold brand of cigarettes.
This indicator is considered fully achieved if the country has total taxes more than 75% of the price of the most sold brand of cigarettes.
This indicator is considered partially achieved if the country has total taxes from 51% up to 75% of the retail price of the most sold brand of cigarettes.
Data validation process
WHO assessment is shared with national authorities for review and approval.
Expected frequency of data collection
Every two years
Links to tool http://www.who.int/tobacco/global_report/http://www.who.int/tobacco/global_report/2017/technical_note_I.pdf?ua=1
Member State has implemented measures to reduce affordability by increasing excise taxes and prices on tobacco products

ANNEX 3. INDICATOR DEFINITIONS AND SPECIFICATIONS, THE STATUS OF COUNTRIES AND AREAS
107
No. Country/area 2015 2017 2019
1 Australia Not achieved Partially achieved Fully achieved
2 Brunei Darussalam Partially achieved Not applicable Not applicable
3 Hong Kong SAR (China) Fully achieved* No data No data
4 Japan Partially achieved Partially achieved Partially achieved
5 Macao SAR (China) No data No data No data
6 New Zealand Partially achieved Partially achieved Fully achieved
7 Republic of Korea Partially achieved Partially achieved Partially achieved
8 Singapore Partially achieved Partially achieved Partially achieved
% Fully achieved: HIC (N=8) 1 (13%) 0 (0%) 2 (25%)
1 Cambodia Not achieved Not achieved Not achieved
2 China Not achieved Partially achieved Partially achieved
3 Lao People’s Democratic Republic
Not achieved Not achieved Not achieved
4 Malaysia Partially achieved Partially achieved Partially achieved
5 Mongolia Not achieved Not achieved Not achieved
6 Philippines Partially achieved Partially achieved Partially achieved
7 Viet Nam Not achieved Not achieved Not achieved
% Fully achieved: LMIC (N=7)
0 (0%) 0 (0%) 0 (0%)
1 American Samoa No data No data No data
2 Cook Islands Partially achieved Partially achieved Partially achieved
3 Fiji Not achieved Not achieved Not achieved
4 French Polynesia No data No data No data
5 Guam No data No data No data
6 Kiribati Fully achieved Not achieved Not achieved
7 Marshall Islands Not achieved Partially achieved Partially achieved
8 Micronesia (Federated States of)
Not achieved Partially achieved Not achieved
9 Nauru No data Partially achieved Not achieved
10 New Caledonia No data No data No data
Indicator 5a. Country or area has implemented measures to reduce affordability by increasing excise taxes and prices on tobacco products
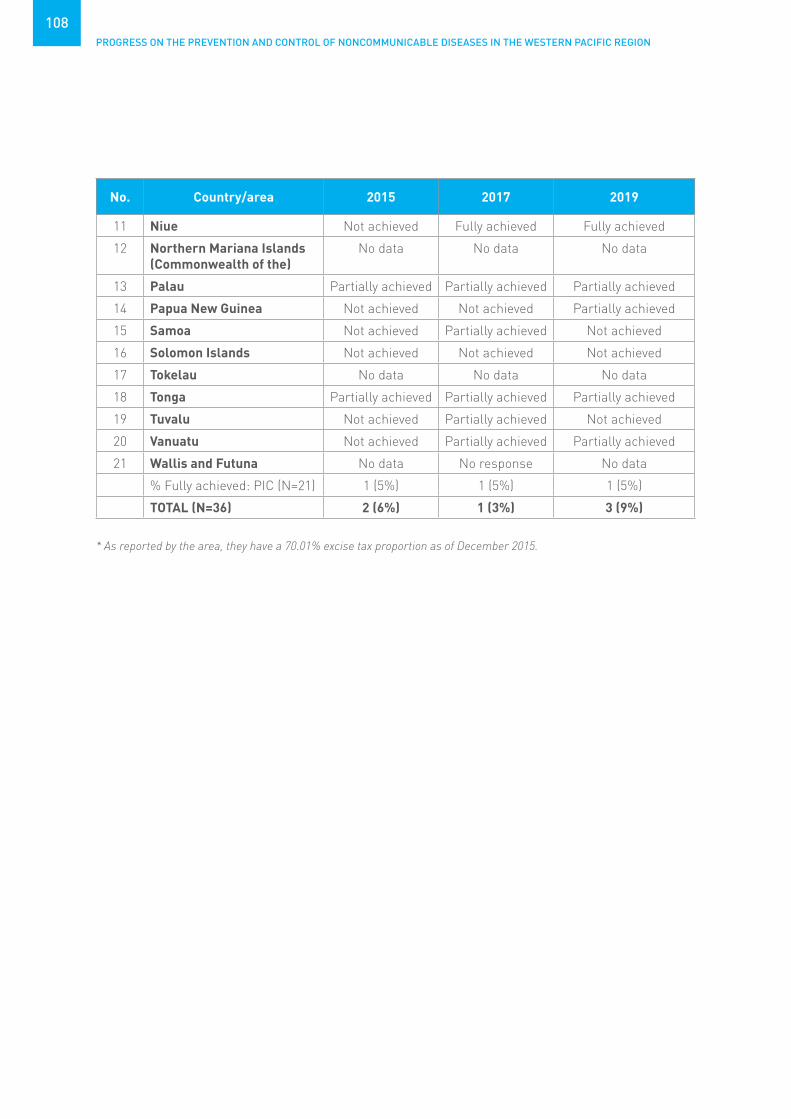
PROGRESS ON THE PREVENTION AND CONTROL OF NONCOMMUNICABLE DISEASES IN THE WESTERN PACIFIC REGION
108
No. Country/area 2015 2017 2019
11 Niue Not achieved Fully achieved Fully achieved
12 Northern Mariana Islands (Commonwealth of the)
No data No data No data
13 Palau Partially achieved Partially achieved Partially achieved
14 Papua New Guinea Not achieved Not achieved Partially achieved
15 Samoa Not achieved Partially achieved Not achieved
16 Solomon Islands Not achieved Not achieved Not achieved
17 Tokelau No data No data No data
18 Tonga Partially achieved Partially achieved Partially achieved
19 Tuvalu Not achieved Partially achieved Not achieved
20 Vanuatu Not achieved Partially achieved Partially achieved
21 Wallis and Futuna No data No response No data
% Fully achieved: PIC (N=21) 1 (5%) 1 (5%) 1 (5%)
TOTAL (N=36) 2 (6%) 1 (3%) 3 (9%)
* As reported by the area, they have a 70.01% excise tax proportion as of December 2015.

ANNEX 3. INDICATOR DEFINITIONS AND SPECIFICATIONS, THE STATUS OF COUNTRIES AND AREAS
109
Definition Country has all public places completely smoke-free (or at least 90% of the population covered by complete subnational smoke-free legislation).“Completely” means that smoking is not permitted, with no exemptions allowed, except in residences and indoor places that serve as equivalents to long-term residential facilities, such as prisons and long-term health and social care facilities such as psychiatric units and nursing homes. Ventilation and any form of designated smoking rooms and/or areas do not protect from the harms of second-hand tobacco smoke, and the only laws that provide protection are those that result in the complete absence of smoking in all public places.
Data collection tool and achievement criteria
Legal instruments are analysed for the production of the WHO Report on the Global Tobacco Epidemic.
Legislation is assessed to determine whether smoke-free laws provided for a complete indoor smoke-free environment at all times, in all the facilities of each of the following eight places: health care facilities; educational facilities other than universities; universities; government facilities; indoor offices and workplaces not considered in any other category; restaurants or facilities that serve mostly food; cafés, pubs and bars or facilities that serve mostly beverages; public transport.
This indicator is considered fully achieved if all public places in the country are completely smoke-free (or at least 90% of the population covered by complete subnational smoke-free legislation).
This indicator is considered partially achieved if three to seven public places are completely smoke-free, or the law allows designated smoking rooms with strict technical requirements in five or more places.
Data validation process
WHO assessment is shared with national authorities for review and approval.
Expected frequency of data collection
Every two years
Links to tool http://www.who.int/tobacco/global_report/http://www.who.int/tobacco/global_report/2017/technical_note_I.pdf?ua=1
Member State has implemented measures to eliminate exposure to second-hand tobacco smoke in all indoor workplaces, public places and public transport

PROGRESS ON THE PREVENTION AND CONTROL OF NONCOMMUNICABLE DISEASES IN THE WESTERN PACIFIC REGION
110
No. Country/area 2015 2017 2019
1 Australia Fully achieved Fully achieved Fully achieved
2 Brunei Darussalam Fully achieved Fully achieved Fully achieved
3 Hong Kong SAR (China) Fully achieved* No data No data
4 Japan Not achieved Not achieved Partially achieved
5 Macao SAR (China) Partially achieved*
No data No data
6 New Zealand Fully achieved Fully achieved Fully achieved
7 Republic of Korea Not achieved Partially achieved Not achieved
8 Singapore Partially achieved Partially achieved Partially achieved
% Fully achieved: HIC (N=8) 4 (50%) 3 (38%) 3 (38%)
1 Cambodia Partially achieved Fully achieved Fully achieved
2 China Not achieved Not achieved Not achieved
3 Lao People’s Democratic Republic
Partially achieved Fully achieved Fully achieved
4 Malaysia Not achieved Not achieved Not achieved
5 Mongolia Fully achieved Fully achieved Partially achieved
6 Philippines Partially achieved Partially achieved Partially achieved
7 Viet Nam Partially achieved Partially achieved Partially achieved
% Fully achieved: LMIC (N=7)
1 (14%) 3 (43%) 2 (29%)
1 American Samoa No data No data No data
2 Cook Islands Partially achieved Partially achieved Partially achieved
3 Fiji Partially achieved Partially achieved Partially achieved
4 French Polynesia No data No data No data
5 Guam No data No data No data
6 Kiribati Partially achieved Partially achieved Partially achieved
7 Marshall Islands Fully achieved Fully achieved Fully achieved
8 Micronesia (Federated States of)
Not achieved Not achieved Partially achieved
9 Nauru Fully achieved Fully achieved Fully achieved
10 New Caledonia No data No data No data
Indicator 5b. Country or area has implemented measures to eliminate exposure to second-hand tobacco smoke in all indoor workplaces, public places and public transport
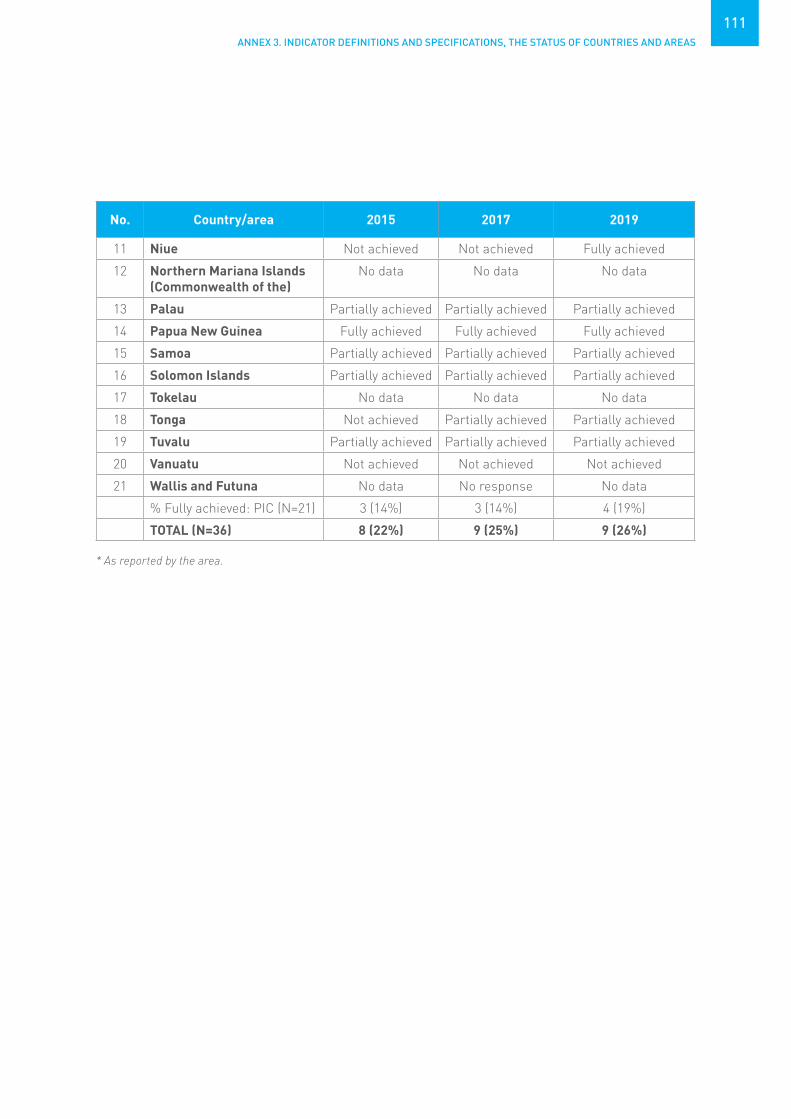
ANNEX 3. INDICATOR DEFINITIONS AND SPECIFICATIONS, THE STATUS OF COUNTRIES AND AREAS
111
No. Country/area 2015 2017 2019
11 Niue Not achieved Not achieved Fully achieved
12 Northern Mariana Islands (Commonwealth of the)
No data No data No data
13 Palau Partially achieved Partially achieved Partially achieved
14 Papua New Guinea Fully achieved Fully achieved Fully achieved
15 Samoa Partially achieved Partially achieved Partially achieved
16 Solomon Islands Partially achieved Partially achieved Partially achieved
17 Tokelau No data No data No data
18 Tonga Not achieved Partially achieved Partially achieved
19 Tuvalu Partially achieved Partially achieved Partially achieved
20 Vanuatu Not achieved Not achieved Not achieved
21 Wallis and Futuna No data No response No data
% Fully achieved: PIC (N=21) 3 (14%) 3 (14%) 4 (19%)
TOTAL (N=36) 8 (22%) 9 (25%) 9 (26%)
* As reported by the area.

PROGRESS ON THE PREVENTION AND CONTROL OF NONCOMMUNICABLE DISEASES IN THE WESTERN PACIFIC REGION
112
Definition Country mandates plain/standardized packaging and/or large graphic warnings with all appropriate characteristics. Appropriate characteristics for large graphic warnings include:• specific health warnings mandated;
• specific health warnings mandated;• appearing on individual packages as well as on any outside packaging
and labelling used in retail sale;• describing specific harmful effects of tobacco use on health;• are large, clear, visible and legible (e.g. specific colours and font style
and sizes are mandated);• rotating health warnings and/or messages;• pictures or pictograms;• written in (all) the principal language(s) of the country.
Appropriate characteristics for plain/standardized packaging include:• restrictions or prohibitions on the use of logos, colours, brand images
or promotional information on packaging other than brand names and product names displayed in a standard colour and font style;
• standardized shape, size and materials of tobacco packaging;• no advertising or promotion inside or attached to the package or
tobacco product.
Data collection tool and achievement criteria
Legislation is assessed to determine the size of the warnings (the front and back of the cigarette pack are averaged to calculate the percentage of the total pack surface area covered by warnings) and warning characteristics.
This indicator is considered fully achieved if the country has plain/ standardized packaging and/or large graphic health warnings which are defined as covering on average at least 50% of the front and back of the package with all appropriate characteristics as detailed above.
This indicator is considered partially achieved if there are medium-size warnings, which are defined as covering on average between 30% and 49% of the front and back of package, with some or all appropriate characteristics, or large warnings that are missing some appropriate characteristics.
Data validation process
WHO assessment is shared with national authorities for review and approval.
Expected frequency of data collection
Every two years
Links to tool http://www.who.int/tobacco/global_report/http://www.who.int/tobacco/global_report/2017/technical_note_I.pdf?ua=1
Member State has implemented plain/standardized packaging and/or large graphic health warnings on all tobacco packages

ANNEX 3. INDICATOR DEFINITIONS AND SPECIFICATIONS, THE STATUS OF COUNTRIES AND AREAS
113
No. Country/area 2015 2017 2019
1 Australia Fully achieved Fully achieved Fully achieved
2 Brunei Darussalam Fully achieved Fully achieved Fully achieved
3 Hong Kong SAR (China) Fully achieved* No data No data
4 Japan Partially achieved Partially achieved Partially achieved
5 Macao SAR (China) Fully achieved* No data No data
6 New Zealand Fully achieved Fully achieved Fully achieved
7 Republic of Korea Partially achieved Partially achieved Partially achieved
8 Singapore Fully achieved Fully achieved Fully achieved
% Fully achieved: HIC (N=8) 6 (75%) 4 (50%) 4 (50%)
1 Cambodia Partially achieved Fully achieved Fully achieved
2 China Partially achieved Partially achieved Partially achieved
3 Lao People’s Democratic Republic
Partially achieved Fully achieved Fully achieved
4 Malaysia Fully achieved Fully achieved Fully achieved
5 Mongolia Fully achieved Fully achieved Fully achieved
6 Philippines Fully achieved Fully achieved Fully achieved
7 Viet Nam Fully achieved Fully achieved Fully achieved
% Fully achieved: LMIC (N=7)
4 (57%) 6 (86%) 6 (86%)
1 American Samoa No data No data No data
2 Cook Islands Partially achieved Partially achieved Partially achieved
3 Fiji Fully achieved Fully achieved Fully achieved
4 French Polynesia No data No data No data
5 Guam No data No data No data
6 Kiribati Partially achieved Partially achieved Partially achieved
7 Marshall Islands Not achieved Not achieved Not achieved
8 Micronesia (Federated States of)
Not achieved Not achieved Not achieved
9 Nauru Partially achieved Partially achieved Partially achieved
10 New Caledonia No data No data No data
Indicator 5c. Country or area has implemented plain/ standardized packaging and/or large graphic health warnings on all tobacco packages

PROGRESS ON THE PREVENTION AND CONTROL OF NONCOMMUNICABLE DISEASES IN THE WESTERN PACIFIC REGION
114
No. Country/area 2015 2017 2019
11 Niue Not achieved Not achieved Partially achieved
12 Northern Mariana Islands (Commonwealth of the)
No data No data No data
13 Palau Not achieved Not achieved Not achieved
14 Papua New Guinea Not achieved Not achieved Partially achieved
15 Samoa Fully achieved Fully achieved Fully achieved
16 Solomon Islands Fully achieved Fully achieved Fully achieved
17 Tokelau No data No data No data
18 Tonga Partially achieved Partially achieved Partially achieved
19 Tuvalu Partially achieved Partially achieved Partially achieved
20 Vanuatu Fully achieved Fully achieved Fully achieved
21 Wallis and Futuna No data No response No data
% Fully achieved: PIC (N=21) 4 (19%) 4 (19%) 4 (19%)
TOTAL (N=36) 14 (39%) 14 (39%) 14 (39%)
* As reported by the area.

ANNEX 3. INDICATOR DEFINITIONS AND SPECIFICATIONS, THE STATUS OF COUNTRIES AND AREAS
115
Definition Country has a ban on all forms of direct and indirect advertising. Direct advertising bans include: national television and radio; local magazines and newspapers; billboards and outdoor advertising; point of sale. Indirect advertising bans include: free distribution of tobacco products in the mail or through other means; promotional discounts; non-tobacco products identified with tobacco brand names (brand stretching); brand names of non-tobacco products used for tobacco products (brand sharing); appearance of tobacco brands (product placement) or tobacco products in television and/or films; and sponsorship (contributions and/ or publicity of contributions).
Data collection tool and achievement criteria
Legislation is assessed to determine whether the law completely bans all forms of direct and indirect tobacco advertising, promotion and sponsorship.
This indicator is considered fully achieved if the country has a ban on all forms of direct and indirect advertising.
This indicator is considered partially achieved if the country has a ban on national TV, radio and print media, but not on all other forms of direct and/ or indirect advertising.
Data validation process
WHO assessment is shared with national authorities for review and approval.
Expected frequency of data collection
Every two years
Links to tool http://www.who.int/tobacco/global_report/http://www.who.int/tobacco/global_report/2017/technical_note_I.pdf?ua=1
Member State has enacted and enforced comprehensive bans on tobacco advertising, promotion and sponsorship

PROGRESS ON THE PREVENTION AND CONTROL OF NONCOMMUNICABLE DISEASES IN THE WESTERN PACIFIC REGION
116
No. Country/area 2015 2017 2019
1 Australia Partially achieved Partially achieved Partially achieved
2 Brunei Darussalam Partially achieved Partially achieved Partially achieved
3 Hong Kong SAR (China) Fully achieved* No data No data
4 Japan Not achieved Not achieved Not achieved
5 Macao SAR (China) Fully achieved* No data No data
6 New Zealand Partially achieved Partially achieved Partially achieved
7 Republic of Korea Not achieved Not achieved Not achieved
8 Singapore Partially achieved Partially achieved Partially achieved
% Fully achieved: HIC (N=8) 2 (25%) 0 (0%) 0 (0%)
1 Cambodia Partially achieved Partially achieved Partially achieved
2 China Partially achieved Partially achieved Partially achieved
3 Lao People’s Democratic Republic
Partially achieved Partially achieved Partially achieved
4 Malaysia Partially achieved Partially achieved Partially achieved
5 Mongolia Partially achieved Fully achieved Fully achieved
6 Philippines Partially achieved Partially achieved Partially achieved
7 Viet Nam Partially achieved Partially achieved Partially achieved
% Fully achieved: LMIC (N=7)
0 (0%) 1 (14%) 1 (14%)
1 American Samoa No data No data No data
2 Cook Islands Partially achieved Partially achieved Partially achieved
3 Fiji Partially achieved Partially achieved Partially achieved
4 French Polynesia No data No data No data
5 Guam No data No data No data
6 Kiribati Fully achieved Fully achieved Fully achieved
7 Marshall Islands Not achieved Not achieved Not achieved
8 Micronesia (Federated States of)
Not achieved Not achieved Partially achieved
9 Nauru Partially achieved Partially achieved Partially achieved
10 New Caledonia No data No data No data
Indicator 5d. Country or area has enacted and enforced comprehensive bans on tobacco advertising, promotion and sponsorship

ANNEX 3. INDICATOR DEFINITIONS AND SPECIFICATIONS, THE STATUS OF COUNTRIES AND AREAS
117
No. Country/area 2015 2017 2019
11 Niue Not achieved Not achieved Fully achieved
12 Northern Mariana Islands (Commonwealth of the)
No data No data No data
13 Palau Partially achieved Partially achieved Partially achieved
14 Papua New Guinea Partially achieved Partially achieved Partially achieved
15 Samoa Partially achieved Partially achieved Partially achieved
16 Solomon Islands Partially achieved Partially achieved Partially achieved
17 Tokelau No data No data No data
18 Tonga Partially achieved Partially achieved Partially achieved
19 Tuvalu Fully achieved Fully achieved Fully achieved
20 Vanuatu Fully achieved Fully achieved Fully achieved
21 Wallis and Futuna No data No response No data
% Fully achieved: PIC (N=21) 3 (14%) 3 (14%) 4 (19%)
TOTAL (N=36) 5 (14%) 4 (11%) 5 (15%)
* As reported by the area.
PROGRESS ON THE PREVENTION AND CONTROL OF NONCOMMUNICABLE DISEASES IN THE WESTERN PACIFIC REGION
118
Definition Country has implemented a national anti-tobacco mass media campaign designed to support tobacco control, of at least three weeks duration with all appropriate characteristics. Appropriate characteristics include:
• campaign was part of a comprehensive tobacco control programme;• before the campaign, research was undertaken or reviewed to gain a
thorough understanding of the target audience;• campaign communications materials were pretested with the target
audience and refined in line with campaign objectives;• air time (radio, television) and/or placement (billboards, print
advertising, etc.) was obtained by purchasing or securing it using either the organization’s own internal resources or an external media planner or agency (this information indicates whether the campaign adopted a thorough media planning and buying process to effectively and efficiently reach its target audience);
• the implementing agency worked with journalists to gain publicity or news coverage for the campaign;
• process evaluation was undertaken to assess how effectively the campaign had been implemented;
• an outcome evaluation process was implemented to assess campaign impact; and
• the campaign was aired on television and/or radio.
Data collection tool and achievement criteria
Eligible campaigns are assessed according to the appropriate characteristics to determine whether it signifies the use of a comprehensive communication approach.
This indicator is considered fully achieved if the country has a campaign conducted with at least seven appropriate characteristics including airing on television and/or radio.
This indicator is considered partially achieved if the country has a campaign conducted with one to six of the appropriate characteristics.
Data validation process
WHO assessment is shared with national authorities for review and approval.
Expected frequency of data collection
Every two years
Links to tool http://www.who.int/tobacco/global_report/http://www.who.int/tobacco/global_report/2017/technical_note_I.pdf?ua=1
Member State has implemented effective mass media campaigns that educate the public about the harms of smoking/tobacco use and second-hand smoke

ANNEX 3. INDICATOR DEFINITIONS AND SPECIFICATIONS, THE STATUS OF COUNTRIES AND AREAS
119
No. Country/area 2017 2019
1 Australia Fully achieved Fully achieved
2 Brunei Darussalam Not achieved Fully achieved
3 Hong Kong SAR (China) No data No data
4 Japan Not achieved Partially achieved
5 Macao SAR (China) No data No data
6 New Zealand Fully achieved Fully achieved
7 Republic of Korea Fully achieved Fully achieved
8 Singapore Fully achieved Partially achieved
% Fully achieved: HIC (N=8) 4 (50%) 4 (50%)
1 Cambodia Fully achieved Partially achieved
2 China Fully achieved Partially achieved
3 Lao People’s Democratic Republic No response No response
4 Malaysia Fully achieved No response
5 Mongolia Not achieved No response
6 Philippines Fully achieved Partially achieved
7 Viet Nam Fully achieved Fully achieved
% Fully achieved: LMIC (N=7) 5 (71%) 1 (14%)
1 American Samoa No data No data
2 Cook Islands Not achieved Not achieved
3 Fiji Fully achieved Fully achieved
4 French Polynesia No data No data
5 Guam No data No data
6 Kiribati Fully achieved Not achieved
7 Marshall Islands Not achieved No response
8 Micronesia (Federated States of) Not achieved Not achieved
9 Nauru Not achieved No response
10 New Caledonia No data No data
Indicator 5e. Country or area has implemented effective mass media campaigns that educate the public about the harms of smoking/tobacco use and second-hand smoke

PROGRESS ON THE PREVENTION AND CONTROL OF NONCOMMUNICABLE DISEASES IN THE WESTERN PACIFIC REGION
120
No. Country/area 2017 2019
11 Niue No response Not achieved
12 Northern Mariana Islands (Commonwealth of the)
No data No data
13 Palau No response Partially achieved
14 Papua New Guinea Not achieved Not achieved
15 Samoa No response Partially achieved
16 Solomon Islands No response Not achieved
17 Tokelau No data No data
18 Tonga Fully achieved Fully achieved
19 Tuvalu Not achieved Not achieved
20 Vanuatu Not achieved Not achieved
21 Wallis and Futuna No response No data
% Fully achieved: PIC (N=21) 3 (14%) 2 (10%)
TOTAL (N=36) 12 (33%) 7 (21%)

ANNEX 3. INDICATOR DEFINITIONS AND SPECIFICATIONS, THE STATUS OF COUNTRIES AND AREAS
121
Definition Country has a licensing system or monopoly on retail sales of beer, wine and spirits.
Country has restrictions for on-/off-premise sales of beer, wine and spiritsregarding hours, days and locations of sales.
Country has legal age limits for being sold and served alcoholicbeverages.
Data collection tool and achievement criteria
Data is collected through the WHO Global Survey on Alcohol and Health.This indicator is considered fully achieved if:
• a licensing system or monopoly exists on retail sales of beer, wine and spirits;
• restrictions exist for on- and off-premise sales of beer, wine and spirits regarding hours and locations of sales and restrictions exist for offpremise sales of beer, wine and spirits regarding days of sales; and
• legal age limits for being sold and served alcoholic beverages are 18 years or above for beer, wine and spirits.
This indicator is considered partially achieved if there are any, but not all,positive responses to the three indicators above.
Data validation process
Focal points, officially nominated by the Ministry of Health, respond to the Global Survey on Alcohol and Health. Responses are reviewed and validated by WHO, and subsequently endorsed by the Member States.
Expected frequency of data collection
Every 3–4 years
Links to tool http://www.who.int/entity/substance_abuse/activities/survey_alcohol_health_2016.pdf?ua=1
Member State has enacted and enforced restrictions on the physical availability of retailed alcohol (via reduced hours of sale)

PROGRESS ON THE PREVENTION AND CONTROL OF NONCOMMUNICABLE DISEASES IN THE WESTERN PACIFIC REGION
122
No. Country/area 2015 2017 2019
1 Australia Partially achieved Partially achieved Partially achieved
2 Brunei Darussalam Fully achieved Fully achieved Fully achieved
3 Hong Kong SAR (China) Partially achieved*
No data No data
4 Japan Partially achieved Partially achieved Partially achieved
5 Macao SAR (China) No data No data No data
6 New Zealand Fully achieved* Partially achieved Partially achieved
7 Republic of Korea Partially achieved Partially achieved Partially achieved
8 Singapore Partially achieved Fully achieved Partially achieved
% Fully achieved: HIC (N=8) 2 (25%) 2 (25%) 1 (13%)
1 Cambodia Not achieved Not achieved No response
2 China Partially achieved Partially achieved Partially achieved
3 Lao People’s Democratic Republic
Partially achieved Partially achieved Not achieved
4 Malaysia Partially achieved Partially achieved Partially achieved
5 Mongolia Partially achieved Partially achieved Partially achieved
6 Philippines Partially achieved Partially achieved Partially achieved
7 Viet Nam Partially achieved Partially achieved Partially achieved
% Fully achieved: LMIC (N=7)
0 (0%) 0 (0%) 0 (0%)
1 American Samoa No data No data No data
2 Cook Islands Fully achieved No response No response
3 Fiji Partially achieved No response No response
4 French Polynesia No data No data No data
5 Guam No data No data No data
6 Kiribati Partially achieved Partially achieved Partially achieved
7 Marshall Islands No data Partially achieved Partially achieved
8 Micronesia (Federated States of)
Partially achieved No response Partially achieved
9 Nauru No data No response No response
10 New Caledonia No data No data No data
Indicator 6a. Country or area has enacted and enforced restrictions on the physical availability of retail alcohol (via reduced hours of sale)
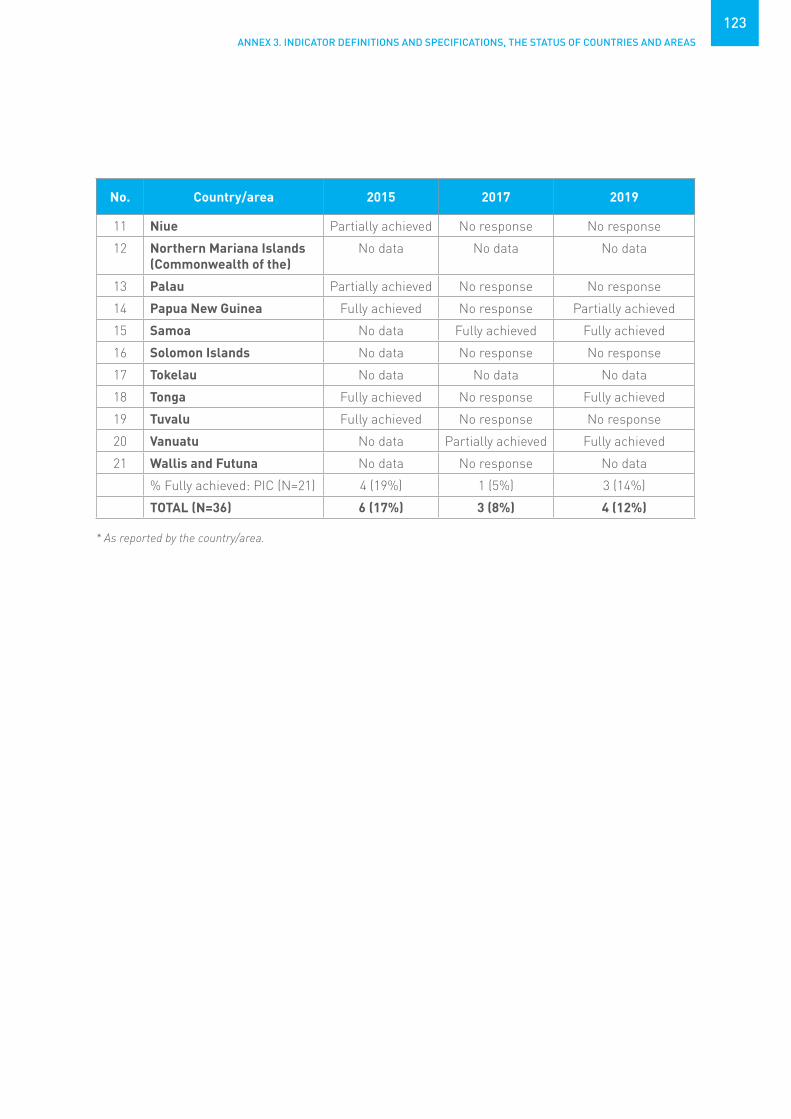
ANNEX 3. INDICATOR DEFINITIONS AND SPECIFICATIONS, THE STATUS OF COUNTRIES AND AREAS
123
No. Country/area 2015 2017 2019
11 Niue Partially achieved No response No response
12 Northern Mariana Islands (Commonwealth of the)
No data No data No data
13 Palau Partially achieved No response No response
14 Papua New Guinea Fully achieved No response Partially achieved
15 Samoa No data Fully achieved Fully achieved
16 Solomon Islands No data No response No response
17 Tokelau No data No data No data
18 Tonga Fully achieved No response Fully achieved
19 Tuvalu Fully achieved No response No response
20 Vanuatu No data Partially achieved Fully achieved
21 Wallis and Futuna No data No response No data
% Fully achieved: PIC (N=21) 4 (19%) 1 (5%) 3 (14%)
TOTAL (N=36) 6 (17%) 3 (8%) 4 (12%)
* As reported by the country/area.

PROGRESS ON THE PREVENTION AND CONTROL OF NONCOMMUNICABLE DISEASES IN THE WESTERN PACIFIC REGION
124
Definition Country has regulatory or co-regulatory frameworks for alcohol advertising through different channels (public service/national TV, commercial/private TV, national radio, local radio, print media, billboards, points of sale, cinema, internet, social media).
Country has a detection system for infringements on marketing restrictions.
Data collection tool and achievement criteria
Data is collected through the WHO Global Survey on Alcohol and Health.
This indicator is considered fully achieved if:• restrictions exist on alcohol advertising for beer, wine and spirits
through all channels ; and• detection system exists for infringements on marketing restrictions.
This indicator is considered partially achieved if there are restrictions on at least public service/national TV, national radio and billboards, but no detection system exists for infringements.
Data validation process
Focal points, officially nominated by the Ministry of Health, respond to the Global Survey on Alcohol and Health. Responses are reviewed and validated by WHO, and subsequently endorsed by the Member States.
Expected frequency of data collection
Every 3–4 years
Links to tool http://www.who.int/entity/substance_abuse/activities/survey_alcohol_health_2016.pdf?ua=1
Member State has enacted and enforced bans or comprehensive restrictions on exposure to alcohol advertising (across multiple types of media)
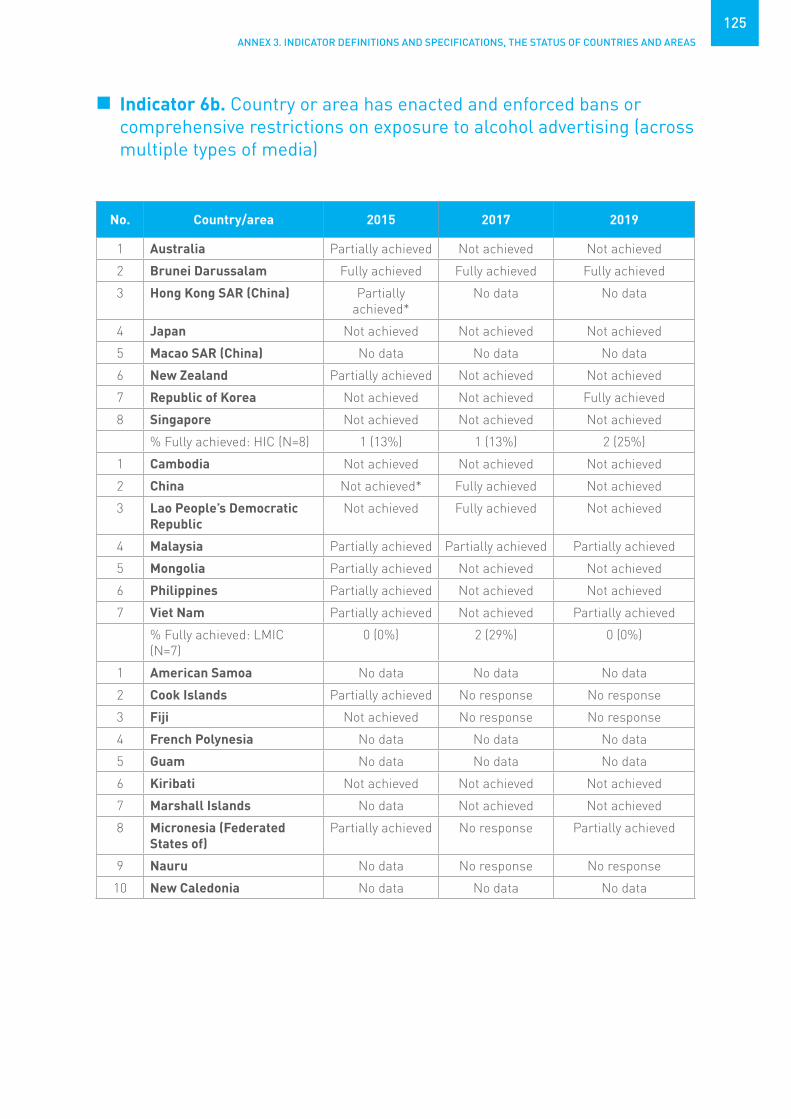
ANNEX 3. INDICATOR DEFINITIONS AND SPECIFICATIONS, THE STATUS OF COUNTRIES AND AREAS
125
No. Country/area 2015 2017 2019
1 Australia Partially achieved Not achieved Not achieved
2 Brunei Darussalam Fully achieved Fully achieved Fully achieved
3 Hong Kong SAR (China) Partially achieved*
No data No data
4 Japan Not achieved Not achieved Not achieved
5 Macao SAR (China) No data No data No data
6 New Zealand Partially achieved Not achieved Not achieved
7 Republic of Korea Not achieved Not achieved Fully achieved
8 Singapore Not achieved Not achieved Not achieved
% Fully achieved: HIC (N=8) 1 (13%) 1 (13%) 2 (25%)
1 Cambodia Not achieved Not achieved Not achieved
2 China Not achieved* Fully achieved Not achieved
3 Lao People’s Democratic Republic
Not achieved Fully achieved Not achieved
4 Malaysia Partially achieved Partially achieved Partially achieved
5 Mongolia Partially achieved Not achieved Not achieved
6 Philippines Partially achieved Not achieved Not achieved
7 Viet Nam Partially achieved Not achieved Partially achieved
% Fully achieved: LMIC (N=7)
0 (0%) 2 (29%) 0 (0%)
1 American Samoa No data No data No data
2 Cook Islands Partially achieved No response No response
3 Fiji Not achieved No response No response
4 French Polynesia No data No data No data
5 Guam No data No data No data
6 Kiribati Not achieved Not achieved Not achieved
7 Marshall Islands No data Not achieved Not achieved
8 Micronesia (Federated States of)
Partially achieved No response Partially achieved
9 Nauru No data No response No response
10 New Caledonia No data No data No data
Indicator 6b. Country or area has enacted and enforced bans or comprehensive restrictions on exposure to alcohol advertising (across multiple types of media)

PROGRESS ON THE PREVENTION AND CONTROL OF NONCOMMUNICABLE DISEASES IN THE WESTERN PACIFIC REGION
126
No. Country/area 2015 2017 2019
11 Niue Not achieved No response No response
12 Northern Mariana Islands (Commonwealth of the)
No data No data No data
13 Palau Not achieved No response No response
14 Papua New Guinea Partially achieved No response Not achieved
15 Samoa No data Not achieved Not achieved
16 Solomon Islands No data No response No response
17 Tokelau No data No data No data
18 Tonga Not achieved No response Not achieved
19 Tuvalu Partially achieved No response No response
20 Vanuatu No data Not achieved Not achieved
21 Wallis and Futuna No data No response No data
% Fully achieved: PIC (N=21) 0 (0%) 0 (0%) 0 (0%)
TOTAL (N=36) 1 (3%) 3 (8%) 2 (6%)
* As reported by the area.

ANNEX 3. INDICATOR DEFINITIONS AND SPECIFICATIONS, THE STATUS OF COUNTRIES AND AREAS
127
Definition Country has excise tax on beer, wine and spirits.
Country adjusts level of taxation for inflation for alcoholic beverages.
Data collection tool and achievement criteria
Data is collected through the WHO Global Survey on Alcohol and Health.
This indicator is considered fully achieved if:• excise tax on all alcoholic beverages (beer, wine and spirits) is
implemented;• there are no tax incentives or rebates for production of other alcoholic
beverages; and• adjustment of level of taxation for inflation for beer, wine and spirits is
implemented.
This indicator is considered partially achieved if there is excise tax on alcoholic beverages as specified above.
Data validation process
Focal points, officially nominated by the Ministry of Health, respond to the Global Survey on Alcohol and Health. Responses are reviewed and validated by WHO, and subsequently endorsed by the Member States.
Expected frequency of data collection
Every 3–4 years
Links to tool http://www.who.int/entity/substance_abuse/activities/survey_alcohol_health_2016.pdf?ua=1
Member State has increased excise taxes on alcoholic beverages

PROGRESS ON THE PREVENTION AND CONTROL OF NONCOMMUNICABLE DISEASES IN THE WESTERN PACIFIC REGION
128
No. Country/area 2015 2017 2019
1 Australia Not achieved Partially achieved Not achieved
2 Brunei Darussalam Fully achieved Fully achieved Fully achieved
3 Hong Kong SAR (China) Not achieved* No data No data
4 Japan Partially achieved Partially achieved Partially achieved
5 Macao SAR (China) No data No data No data
6 New Zealand Fully achieved Partially achieved Fully achieved
7 Republic of Korea Partially achieved Partially achieved Partially achieved
8 Singapore Partially achieved Fully achieved Partially achieved
% Fully achieved: HIC (N=8) 2 (25%) 2 (25%) 2 (25%)
1 Cambodia Partially achieved Partially achieved No response
2 China Partially achieved Partially achieved Not achieved
3 Lao People’s Democratic Republic
Not achieved Partially achieved Not achieved
4 Malaysia Partially achieved Partially achieved Partially achieved
5 Mongolia Partially achieved Partially achieved Partially achieved
6 Philippines Partially achieved Partially achieved Fully achieved
7 Viet Nam Partially achieved Partially achieved Partially achieved
% Fully achieved: LMIC (N=7)
0 (0%) 0 (0%) 1 (14%)
1 American Samoa No data No data No data
2 Cook Islands Partially achieved No response No response
3 Fiji Partially achieved No response No response
4 French Polynesia No data No data No data
5 Guam No data No data No data
6 Kiribati Not achieved Partially achieved Partially achieved
7 Marshall Islands No data Fully achieved Fully achieved
8 Micronesia (Federated States of)
Not achieved No response Partially achieved
9 Nauru No data No response No response
10 New Caledonia No data No data No data
Indicator 6c. Country or area has increased excise taxes on alcoholic beverages

ANNEX 3. INDICATOR DEFINITIONS AND SPECIFICATIONS, THE STATUS OF COUNTRIES AND AREAS
129
No. Country/area 2015 2017 2019
11 Niue Not achieved No response No response
12 Northern Mariana Islands (Commonwealth of the)
No data No data No data
13 Palau Not achieved No response No response
14 Papua New Guinea Partially achieved No response Partially achieved
15 Samoa No data Fully achieved Fully achieved
16 Solomon Islands No data No response No response
17 Tokelau No data No data No data
18 Tonga Partially achieved No response Partially achieved
19 Tuvalu Fully achieved No response No response
20 Vanuatu No data Fully achieved Fully achieved
21 Wallis and Futuna No data No response No data
% Fully achieved: PIC (N=21) 1 (5%) 3 (14%) 3 (14%)
TOTAL (N=36) 3 (8%) 5 (14%) 6 (18%)
* As reported by the area.

PROGRESS ON THE PREVENTION AND CONTROL OF NONCOMMUNICABLE DISEASES IN THE WESTERN PACIFIC REGION
130
Definition Country has implemented national policies to reduce population salt/sodium consumption, including reformulation of food products; establishment of a supportive environment in public institutions to enable lower sodium options to be provided; behaviour change communication and mass media campaigns; and front-of-pack labelling.
Data collection tool and achievement criteria
WHO NCD Country Capacity Survey tool – The NCD CCS is completed by a team at the country level to ensure a comprehensive response is compiled.
This indicator is considered fully achieved if the country responds “Yes” to the question “Is your country implementing any policies to reduce population salt consumption?” and to the subquestions “Are these targeted at: product reformulation by industry across the food supply; regulation of salt content of food; public awareness programme; nutrition labeling? (must have “Yes” to product reformulation by industry across the food supply and/or regulation of salt content of food, and “Yes” to public awareness programme and nutrition labelling”). Country must also provide the needed supporting documentation.
This indicator is considered partially achieved if the country responds “Yes” to the question “Is your country implementing any policies to reduce population salt consumption?”, and “Yes” to at least one of the four subquestions “Are these targeted at: product reformulation by industry across the food supply; regulation of salt content of food; public awareness programme; nutrition labelling?”.
Data validation process
Countries are asked to submit a copy of their policy(ies) when submitting their response to the NCD CCS. Responses are cross-validated with data obtained through the Global Nutrition Policy Review and the WHO Global database on the Implementation of Nutrition Action (GINA). Where discrepancies are noted, these are referred back to the country for clarification and modification.
Expected frequency of data collection
Every two years
Links to tool http://www.who.int/ncds/surveillance/ncd-capacity/en/
Member State has adopted national policies to reduce population salt/sodium consumption

ANNEX 3. INDICATOR DEFINITIONS AND SPECIFICATIONS, THE STATUS OF COUNTRIES AND AREAS
131
No. Country/area 2015 2017 2019
1 Australia Fully achieved Partially achieved Partially achieved
2 Brunei Darussalam Not achieved Don't know Not achieved
3 Hong Kong SAR (China) Fully achieved Partially achieved Fully achieved
4 Japan – Partially achieved Not achieved
5 Macao SAR (China) Not achieved Partially achieved Partially achieved
6 New Zealand Fully achieved Partially achieved Don't know
7 Republic of Korea Fully achieved Fully achieved Fully achieved
8 Singapore Fully achieved Fully achieved Fully achieved
% Fully achieved: HIC (N=8) 5 (63%) 2 (25%) 3 (38%)
1 Cambodia Not achieved Not achieved Not achieved
2 China Fully achieved Fully achieved Partially achieved
3 Lao People’s Democratic Republic
Not achieved Not achieved Not achieved
4 Malaysia – Fully achieved Fully achieved
5 Mongolia Not achieved Fully achieved Fully achieved
6 Philippines Not achieved Not achieved Not achieved
7 Viet Nam Not achieved Not achieved Fully achieved
% Fully achieved: LMIC (N=7)
1 (14%) 3 (43%) 3 (43%)
1 American Samoa No data Don't know No response
2 Cook Islands No data Not achieved Not achieved
3 Fiji Fully achieved Not achieved Partially achieved
4 French Polynesia Not achieved Not achieved Fully achieved
5 Guam Fully achieved Partially achieved Partially achieved
6 Kiribati – Not achieved Not achieved
7 Marshall Islands – Not achieved Not achieved
8 Micronesia (Federated States of)
Fully achieved Not achieved Not achieved
9 Nauru Not achieved Partially achieved Not achieved
10 New Caledonia – No data Not achieved
Indicator 7a. Country or area has adopted national policies to reduce population salt/sodium consumption

PROGRESS ON THE PREVENTION AND CONTROL OF NONCOMMUNICABLE DISEASES IN THE WESTERN PACIFIC REGION
132
No. Country/area 2015 2017 2019
11 Niue Not achieved Not achieved Not achieved
12 Northern Mariana Islands (Commonwealth of the)
Not achieved Not achieved Not achieved
13 Palau Fully achieved No response Partially achieved
14 Papua New Guinea Not achieved Not achieved Not achieved
15 Samoa No data Not achieved Partially achieved
16 Solomon Islands Not achieved Not achieved Not achieved
17 Tokelau No data Not achieved Not achieved
18 Tonga Not achieved Not achieved Not achieved
19 Tuvalu Fully achieved Not achieved Not achieved
20 Vanuatu Not achieved Partially achieved Not achieved
21 Wallis and Futuna Not achieved No response No response
% Fully achieved: PIC (N=21) 5 (24%) 0 (0%) 1 (5%)
TOTAL (N=36) 11 (31%) 5 (14%) 7 (21%)
– : documentation not available
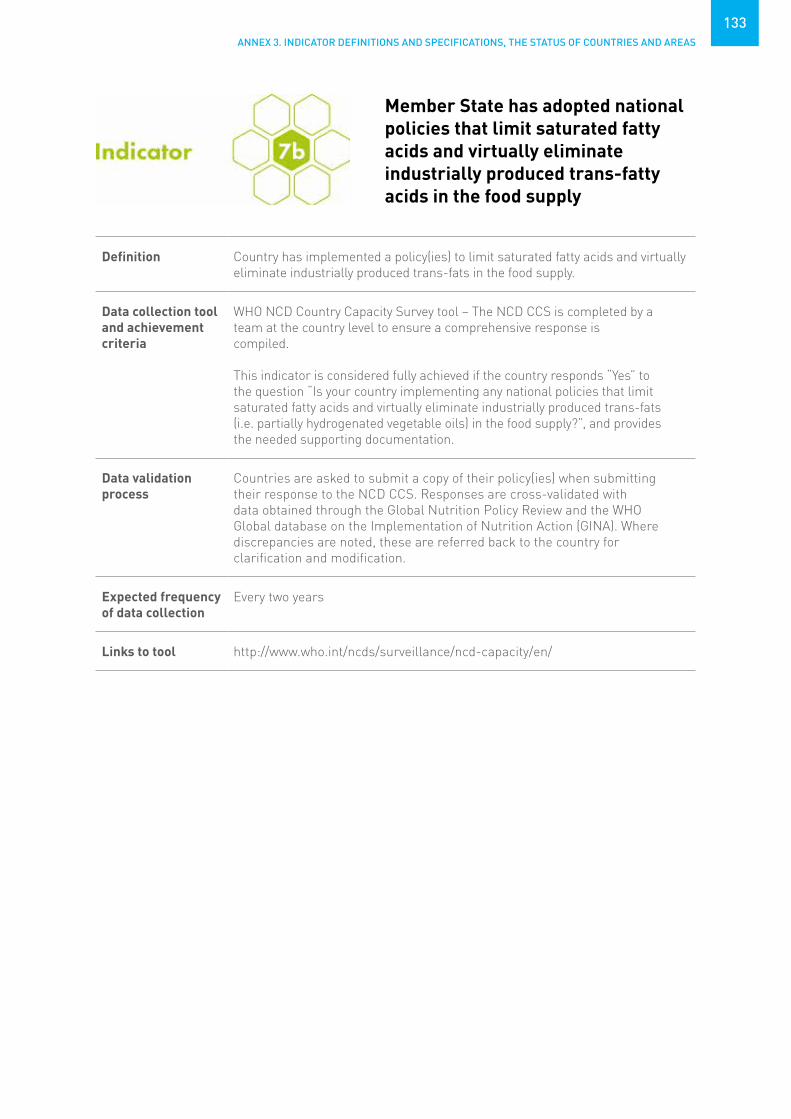
ANNEX 3. INDICATOR DEFINITIONS AND SPECIFICATIONS, THE STATUS OF COUNTRIES AND AREAS
133
Definition Country has implemented a policy(ies) to limit saturated fatty acids and virtually eliminate industrially produced trans-fats in the food supply.
Data collection tool and achievement criteria
WHO NCD Country Capacity Survey tool – The NCD CCS is completed by a team at the country level to ensure a comprehensive response iscompiled.
This indicator is considered fully achieved if the country responds “Yes” to the question “Is your country implementing any national policies that limit saturated fatty acids and virtually eliminate industrially produced trans-fats (i.e. partially hydrogenated vegetable oils) in the food supply?”, and provides the needed supporting documentation.
Data validation process
Countries are asked to submit a copy of their policy(ies) when submitting their response to the NCD CCS. Responses are cross-validated with data obtained through the Global Nutrition Policy Review and the WHO Global database on the Implementation of Nutrition Action (GINA). Where discrepancies are noted, these are referred back to the country for clarification and modification.
Expected frequency of data collection
Every two years
Links to tool http://www.who.int/ncds/surveillance/ncd-capacity/en/
Member State has adopted national policies that limit saturated fatty acids and virtually eliminate industrially produced trans-fatty acids in the food supply
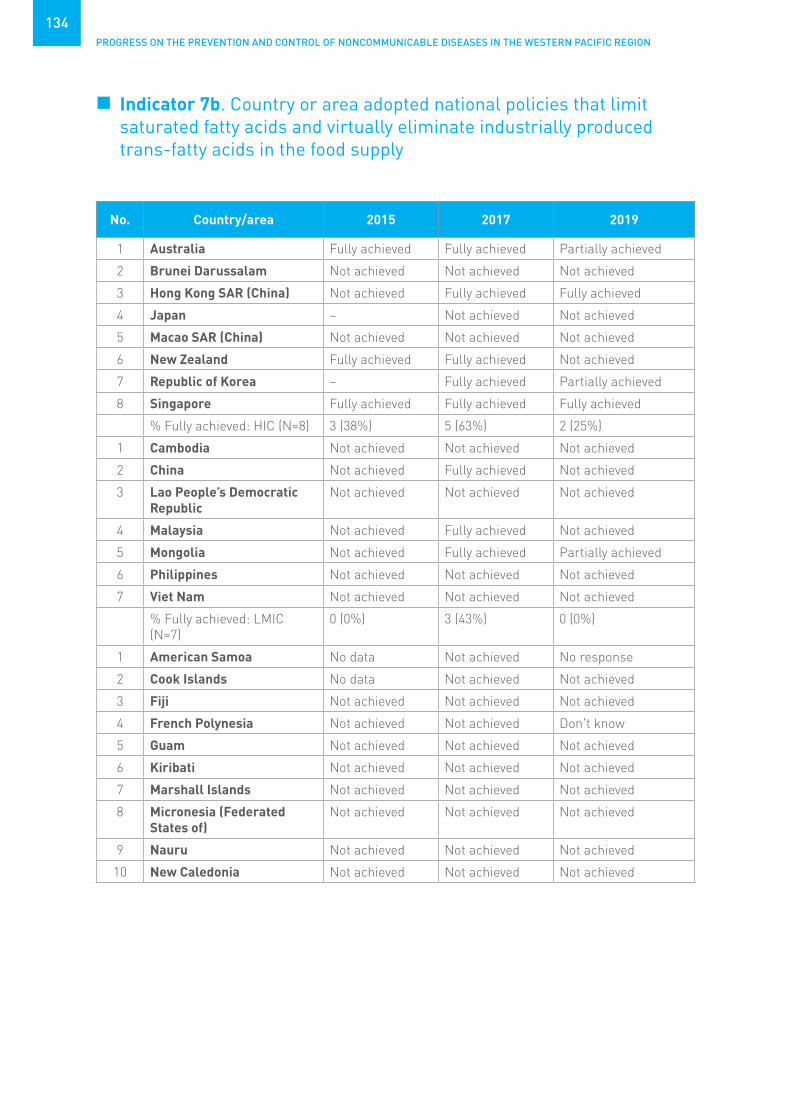
PROGRESS ON THE PREVENTION AND CONTROL OF NONCOMMUNICABLE DISEASES IN THE WESTERN PACIFIC REGION
134
No. Country/area 2015 2017 2019
1 Australia Fully achieved Fully achieved Partially achieved
2 Brunei Darussalam Not achieved Not achieved Not achieved
3 Hong Kong SAR (China) Not achieved Fully achieved Fully achieved
4 Japan – Not achieved Not achieved
5 Macao SAR (China) Not achieved Not achieved Not achieved
6 New Zealand Fully achieved Fully achieved Not achieved
7 Republic of Korea – Fully achieved Partially achieved
8 Singapore Fully achieved Fully achieved Fully achieved
% Fully achieved: HIC (N=8) 3 (38%) 5 (63%) 2 (25%)
1 Cambodia Not achieved Not achieved Not achieved
2 China Not achieved Fully achieved Not achieved
3 Lao People’s Democratic Republic
Not achieved Not achieved Not achieved
4 Malaysia Not achieved Fully achieved Not achieved
5 Mongolia Not achieved Fully achieved Partially achieved
6 Philippines Not achieved Not achieved Not achieved
7 Viet Nam Not achieved Not achieved Not achieved
% Fully achieved: LMIC (N=7)
0 (0%) 3 (43%) 0 (0%)
1 American Samoa No data Not achieved No response
2 Cook Islands No data Not achieved Not achieved
3 Fiji Not achieved Not achieved Not achieved
4 French Polynesia Not achieved Not achieved Don't know
5 Guam Not achieved Not achieved Not achieved
6 Kiribati Not achieved Not achieved Not achieved
7 Marshall Islands Not achieved Not achieved Not achieved
8 Micronesia (Federated States of)
Not achieved Not achieved Not achieved
9 Nauru Not achieved Not achieved Not achieved
10 New Caledonia Not achieved Not achieved Not achieved
Indicator 7b. Country or area adopted national policies that limit saturated fatty acids and virtually eliminate industrially produced trans-fatty acids in the food supply
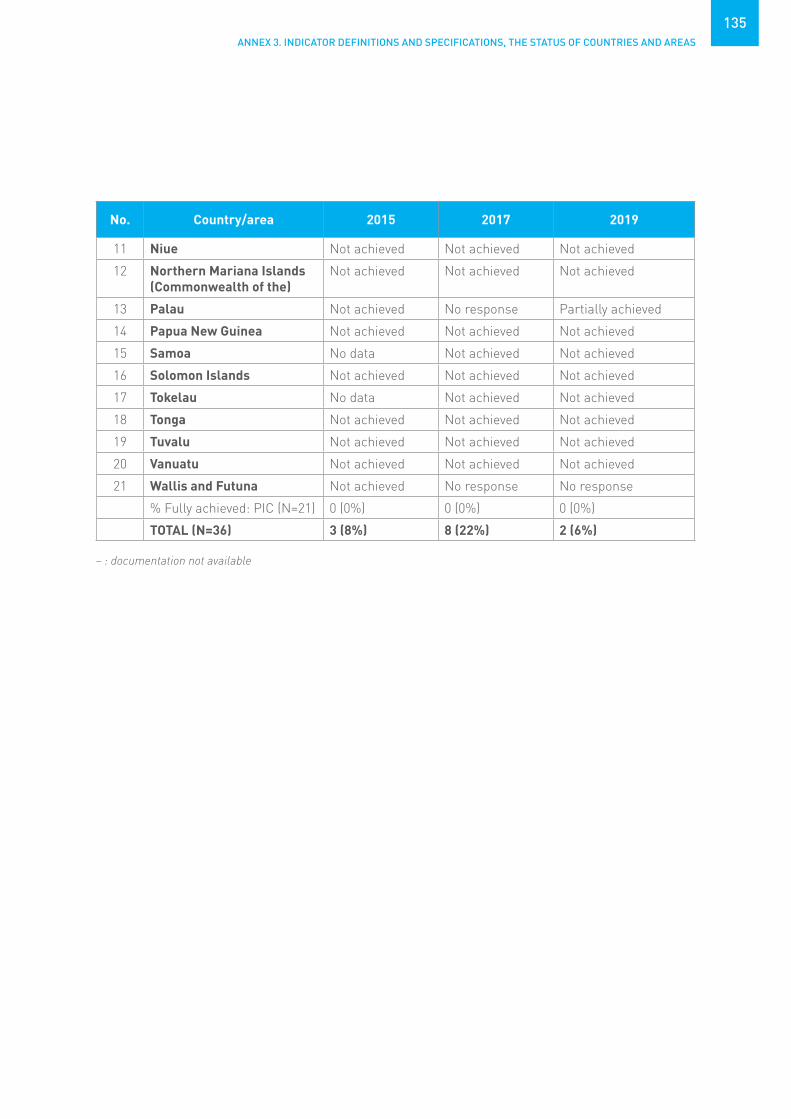
ANNEX 3. INDICATOR DEFINITIONS AND SPECIFICATIONS, THE STATUS OF COUNTRIES AND AREAS
135
No. Country/area 2015 2017 2019
11 Niue Not achieved Not achieved Not achieved
12 Northern Mariana Islands (Commonwealth of the)
Not achieved Not achieved Not achieved
13 Palau Not achieved No response Partially achieved
14 Papua New Guinea Not achieved Not achieved Not achieved
15 Samoa No data Not achieved Not achieved
16 Solomon Islands Not achieved Not achieved Not achieved
17 Tokelau No data Not achieved Not achieved
18 Tonga Not achieved Not achieved Not achieved
19 Tuvalu Not achieved Not achieved Not achieved
20 Vanuatu Not achieved Not achieved Not achieved
21 Wallis and Futuna Not achieved No response No response
% Fully achieved: PIC (N=21) 0 (0%) 0 (0%) 0 (0%)
TOTAL (N=36) 3 (8%) 8 (22%) 2 (6%)
– : documentation not available
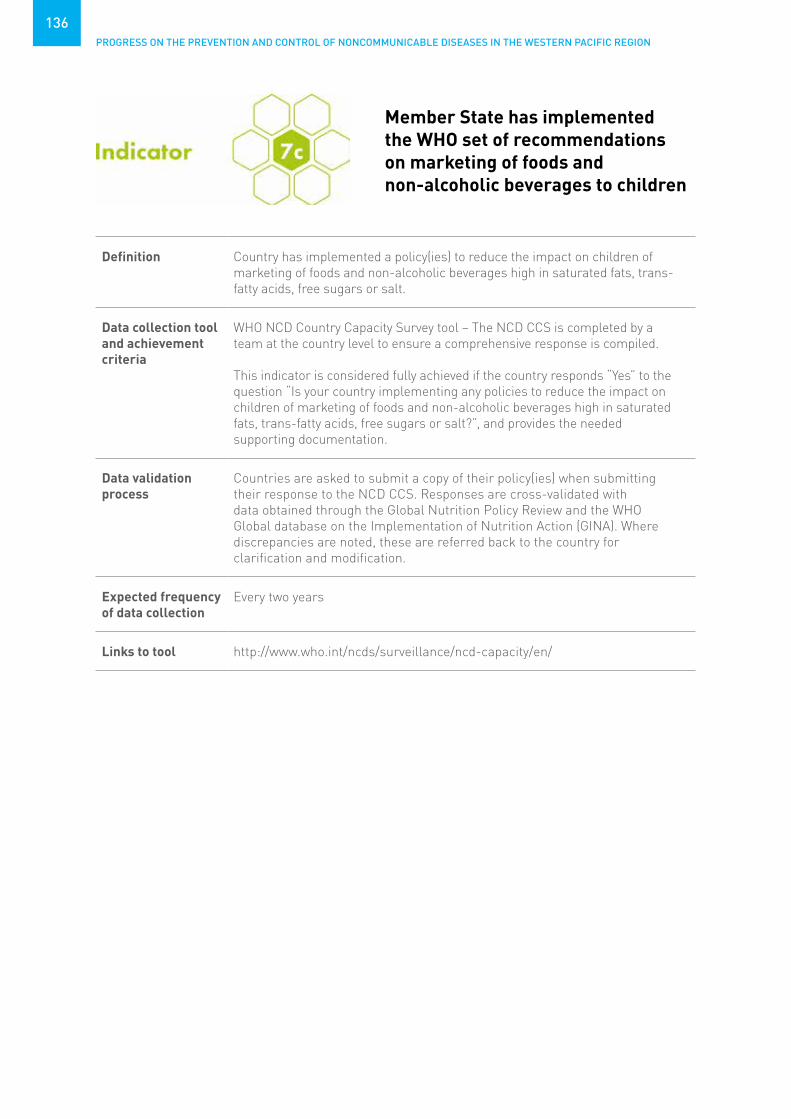
PROGRESS ON THE PREVENTION AND CONTROL OF NONCOMMUNICABLE DISEASES IN THE WESTERN PACIFIC REGION
136
Definition Country has implemented a policy(ies) to reduce the impact on children of marketing of foods and non-alcoholic beverages high in saturated fats, trans-fatty acids, free sugars or salt.
Data collection tool and achievement criteria
WHO NCD Country Capacity Survey tool – The NCD CCS is completed by a team at the country level to ensure a comprehensive response is compiled.
This indicator is considered fully achieved if the country responds “Yes” to the question “Is your country implementing any policies to reduce the impact on children of marketing of foods and non-alcoholic beverages high in saturated fats, trans-fatty acids, free sugars or salt?”, and provides the needed supporting documentation.
Data validation process
Countries are asked to submit a copy of their policy(ies) when submitting their response to the NCD CCS. Responses are cross-validated with data obtained through the Global Nutrition Policy Review and the WHO Global database on the Implementation of Nutrition Action (GINA). Where discrepancies are noted, these are referred back to the country for clarification and modification.
Expected frequency of data collection
Every two years
Links to tool http://www.who.int/ncds/surveillance/ncd-capacity/en/
Member State has implemented the WHO set of recommendations on marketing of foods and non-alcoholic beverages to children

ANNEX 3. INDICATOR DEFINITIONS AND SPECIFICATIONS, THE STATUS OF COUNTRIES AND AREAS
137
No. Country/area 2015 2017 2019
1 Australia Not achieved Fully achieved Fully achieved
2 Brunei Darussalam Not achieved Not achieved Not achieved
3 Hong Kong SAR (China) Not achieved Fully achieved Fully achieved
4 Japan Not achieved Not achieved Not achieved
5 Macao SAR (China) Not achieved Not achieved Not achieved
6 New Zealand Fully achieved Fully achieved Fully achieved
7 Republic of Korea Fully achieved Fully achieved Fully achieved
8 Singapore Fully achieved Fully achieved Fully achieved
% Fully achieved: HIC (N=8) 3 (38%) 5 (63%) 5 (63%)
1 Cambodia Not achieved Not achieved Not achieved
2 China Not achieved Not achieved Not achieved
3 Lao People’s Democratic Republic
Not achieved Not achieved Not achieved
4 Malaysia Fully achieved Fully achieved Fully achieved
5 Mongolia Not achieved Fully achieved Fully achieved
6 Philippines Not achieved Not achieved Fully achieved
7 Viet Nam Not achieved Not achieved Not achieved
% Fully achieved: LMIC (N=7)
1 (14%) 2 (29%) 3 (43%)
1 American Samoa No data Don't know No response
2 Cook Islands No data Not achieved Fully achieved
3 Fiji Fully achieved Not achieved Not achieved
4 French Polynesia Not achieved Fully achieved Fully achieved
5 Guam Not achieved Not achieved Not achieved
6 Kiribati – Not achieved Fully achieved
7 Marshall Islands Not achieved Not achieved Not achieved
8 Micronesia (Federated States of)
Not achieved Not achieved Not achieved
9 Nauru Not achieved Not achieved Not achieved
10 New Caledonia Not achieved – Not achieved
Indicator 7c. Country or area has implemented the WHO set of recommendations on marketing of foods and non-alcoholic beverages to children

PROGRESS ON THE PREVENTION AND CONTROL OF NONCOMMUNICABLE DISEASES IN THE WESTERN PACIFIC REGION
138
No. Country/area 2015 2017 2019
11 Niue Not achieved Not achieved Not achieved
12 Northern Mariana Islands (Commonwealth of the)
Not achieved Don't know Not achieved
13 Palau Not achieved No response Not achieved
14 Papua New Guinea Not achieved Not achieved Not achieved
15 Samoa No data Not achieved Not achieved
16 Solomon Islands Not achieved Not achieved Not achieved
17 Tokelau No data Not achieved Not achieved
18 Tonga Not achieved Not achieved Not achieved
19 Tuvalu Not achieved Not achieved Not achieved
20 Vanuatu – Fully achieved Not achieved
21 Wallis and Futuna Not achieved No response No response
% Fully achieved: PIC (N=21) 1 (5%) 2 (10%) 3 (14%)
TOTAL (N=36) 5 (14%) 9 (25%) 11 (32%)
– : documentation not available

ANNEX 3. INDICATOR DEFINITIONS AND SPECIFICATIONS, THE STATUS OF COUNTRIES AND AREAS
139
Definition Country has implemented legislation/regulations that fully implement the International Code of Marketing of Breast-milk Substitutes.
Data collection tool and achievement criteria
Copies of legislation and regulations on the International Code of Marketing of Breast-milk Substitutes are compiled by WHO every two years. In 2015/16, countries were asked to submit copies. Additionally, copies of legislation were obtained from UNICEF and IBFAN/ICDC and legal databases (Lexis/Nexis and FAO-LEX), EUR-LEX, national gazettes and internet search engines.
This indicator is considered fully achieved if the country is assessed as having national legal measures categorized as “full provisions in law”, whereby countries have enacted legislation or adopted regulations, decrees or other legally binding measures encompassing all or nearly all provisions of the Code and subsequent World Health Assembly resolutions.
This indicator is considered partially achieved if the country is assessed as having national legal measures categorized as “many provisions in law” or “few provisions in law”, whereby countries have enacted legislation or adopted regulations, decrees or other legally binding measures encompassing many or few provisions of the Code and subsequent World Health Assembly resolutions.
Data validation process
WHO, UNICEF, and IBFAN/ICDC analyse all legislation and regulations to determine which provisions of the Code were covered. All three organizations agree upon the categorization based on the provisions included.
Expected frequency of data collection
Every two years
Links to tool http://www.who.int/nutrition/publications/infantfeeding/code_report2016/en/
Member State has legislation/regulations fully implementing the International Code of Marketing of Breast-milk Substitutes

PROGRESS ON THE PREVENTION AND CONTROL OF NONCOMMUNICABLE DISEASES IN THE WESTERN PACIFIC REGION
140
No. Country/area 2015 2017 2019
1 Australia Fully achieved Not achieved Not achieved
2 Brunei Darussalam Not achieved Not achieved Not achieved
3 Hong Kong SAR (China) Not achieved No data No data
4 Japan Not achieved Not achieved Not achieved
5 Macao SAR (China) Not achieved No data No data
6 New Zealand Fully achieved Not achieved Not achieved
7 Republic of Korea Not achieved Partially achieved Partially achieved
8 Singapore Not achieved Not achieved Not achieved
% Fully achieved: HIC (N=8) 2 (25%) 0 (0%) 0 (0%)
1 Cambodia Fully achieved Partially achieved Partially achieved
2 China Not achieved Partially achieved Partially achieved
3 Lao People’s Democratic Republic
Not achieved Partially achieved Partially achieved
4 Malaysia Fully achieved Not achieved Not achieved
5 Mongolia Fully achieved Partially achieved Partially achieved
6 Philippines Fully achieved Fully achieved Fully achieved
7 Viet Nam Fully achieved Fully achieved Fully achieved
% Fully achieved: LMIC (N=7)
5 (71%) 2 (29%) 2 (29%)
1 American Samoa No data No data No data
2 Cook Islands No data Not achieved Not achieved
3 Fiji Fully achieved Fully achieved Partially achieved
4 French Polynesia Fully achieved No data No data
5 Guam Not achieved No data No data
6 Kiribati – Not achieved Not achieved
7 Marshall Islands Not achieved Not achieved Not achieved
8 Micronesia (Federated States of)
– No response Not achieved
9 Nauru Not achieved No response Not achieved
10 New Caledonia – No data No data
Indicator 7d. Country or area has legislation/regulations fully implementing the International Code of Marketing of Breast-milk Substitutes

ANNEX 3. INDICATOR DEFINITIONS AND SPECIFICATIONS, THE STATUS OF COUNTRIES AND AREAS
141
No. Country/area 2015 2017 2019
11 Niue Not achieved No response Not achieved
12 Northern Mariana Islands (Commonwealth of the)
Not achieved No data No data
13 Palau Fully achieved Fully achieved Fully achieved
14 Papua New Guinea Fully achieved Partially achieved Partially achieved
15 Samoa No data Not achieved Not achieved
16 Solomon Islands Fully achieved* Partially achieved Partially achieved
17 Tokelau No data No data No data
18 Tonga Not achieved No response Not achieved
19 Tuvalu Don't know Not achieved Not achieved
20 Vanuatu Not achieved Not achieved Not achieved
21 Wallis and Futuna Not achieved No response No data
% Fully achieved: PIC (N=21) 5 (24%) 2 (10%) 1 (5%)
TOTAL (N=36) 12 (33%) 4 (11%) 3 (9%)
* As reported by the country – : documentation not available

PROGRESS ON THE PREVENTION AND CONTROL OF NONCOMMUNICABLE DISEASES IN THE WESTERN PACIFIC REGION
142
Definition Country has implemented at least one recent (within the past five years) national public awareness programme on physical activity.
Data collection tool and achievement criteria
WHO NCD Country Capacity Survey tool – The NCD CCS is completed by a team at the country level to ensure a comprehensive response is compiled.
This indicator is considered fully achieved if the country responds “Yes” to the following question: “Has your country implemented any national public awareness programme on physical activity within the past five years?”, and provides the needed supporting documentation.
Data validation process
Countries are asked to submit a copy of any documentation of the programme and/or a link to the programme website when submitting their response to the NCD CCS. Where discrepancies are noted, these are referred back to the country for clarification and modification.
Expected frequency of data collection
Every two years
Links to tool http://www.who.int/ncds/surveillance/ncd-capacity/en/
Member State has implemented at least one recent national public awareness programme and motivational communication for physical activity, including mass media campaigns for physical activity behaviour change
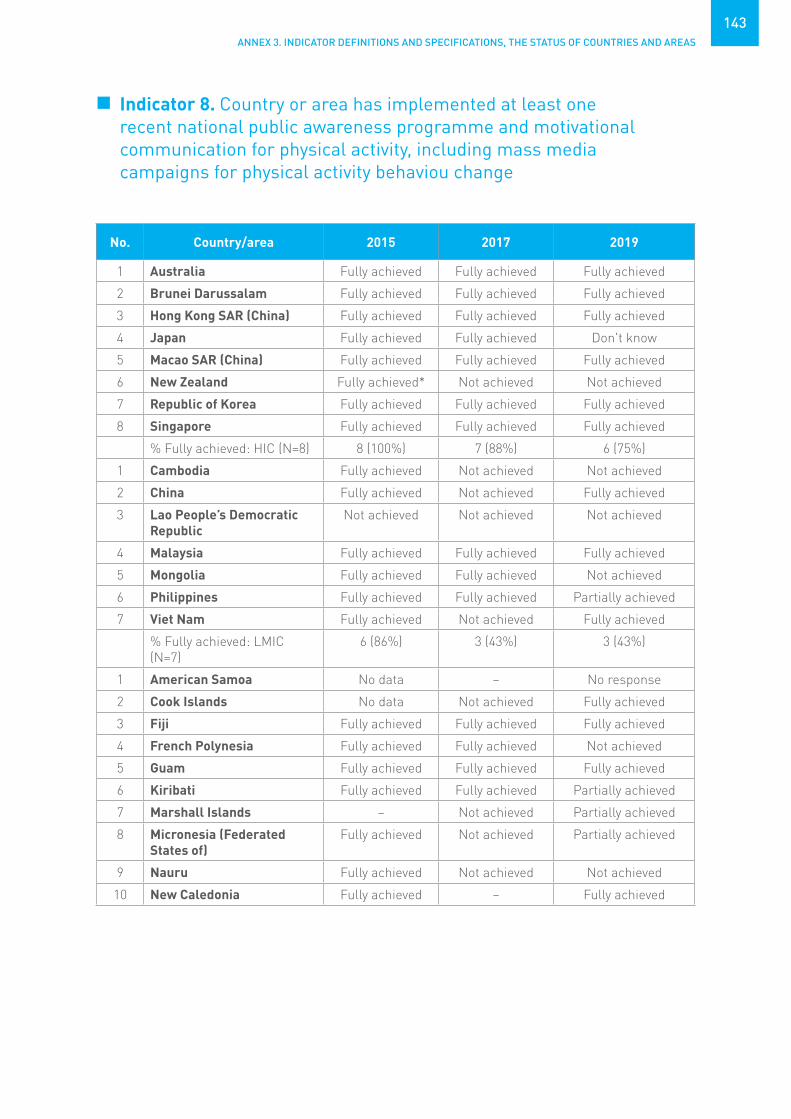
ANNEX 3. INDICATOR DEFINITIONS AND SPECIFICATIONS, THE STATUS OF COUNTRIES AND AREAS
143
No. Country/area 2015 2017 2019
1 Australia Fully achieved Fully achieved Fully achieved
2 Brunei Darussalam Fully achieved Fully achieved Fully achieved
3 Hong Kong SAR (China) Fully achieved Fully achieved Fully achieved
4 Japan Fully achieved Fully achieved Don't know
5 Macao SAR (China) Fully achieved Fully achieved Fully achieved
6 New Zealand Fully achieved* Not achieved Not achieved
7 Republic of Korea Fully achieved Fully achieved Fully achieved
8 Singapore Fully achieved Fully achieved Fully achieved
% Fully achieved: HIC (N=8) 8 (100%) 7 (88%) 6 (75%)
1 Cambodia Fully achieved Not achieved Not achieved
2 China Fully achieved Not achieved Fully achieved
3 Lao People’s Democratic Republic
Not achieved Not achieved Not achieved
4 Malaysia Fully achieved Fully achieved Fully achieved
5 Mongolia Fully achieved Fully achieved Not achieved
6 Philippines Fully achieved Fully achieved Partially achieved
7 Viet Nam Fully achieved Not achieved Fully achieved
% Fully achieved: LMIC (N=7)
6 (86%) 3 (43%) 3 (43%)
1 American Samoa No data – No response
2 Cook Islands No data Not achieved Fully achieved
3 Fiji Fully achieved Fully achieved Fully achieved
4 French Polynesia Fully achieved Fully achieved Not achieved
5 Guam Fully achieved Fully achieved Fully achieved
6 Kiribati Fully achieved Fully achieved Partially achieved
7 Marshall Islands – Not achieved Partially achieved
8 Micronesia (Federated States of)
Fully achieved Not achieved Partially achieved
9 Nauru Fully achieved Not achieved Not achieved
10 New Caledonia Fully achieved – Fully achieved
Indicator 8. Country or area has implemented at least one recent national public awareness programme and motivational communication for physical activity, including mass media campaigns for physical activity behaviou change

PROGRESS ON THE PREVENTION AND CONTROL OF NONCOMMUNICABLE DISEASES IN THE WESTERN PACIFIC REGION
144
No. Country/area 2015 2017 2019
11 Niue Fully achieved Fully achieved Not achieved
12 Northern Mariana Islands (Commonwealth of the)
Fully achieved Fully achieved Fully achieved
13 Palau – No response Partially achieved
14 Papua New Guinea Not achieved Not achieved Partially achieved
15 Samoa No data Not achieved Fully achieved
16 Solomon Islands – Not achieved Not achieved
17 Tokelau No data Fully achieved Not achieved
18 Tonga Fully achieved Fully achieved Fully achieved
19 Tuvalu Fully achieved Not achieved Partially achieved
20 Vanuatu – Not achieved Not achieved
21 Wallis and Futuna Fully achieved No response No response
% Fully achieved: PIC (N=21) 12 (57%) 8 (38%) 7 (33%)
TOTAL (N=36) 26 (72%) 18 (50%) 16 (47%)
* As reported by the country – : documentation not available

ANNEX 3. INDICATOR DEFINITIONS AND SPECIFICATIONS, THE STATUS OF COUNTRIES AND AREAS
145
Definition Government approved evidence-based national guidelines/protocols/ standards for the management (diagnosis and treatment) of the four main NCDs – cardiovascular diseases, diabetes, cancer and chronic respiratory diseases.
Data collection tool and achievement criteria
WHO NCD Country Capacity Survey tool – The NCD CCS is completed by a team at the country level to ensure a comprehensive response is compiled.
This indicator is based on the number of countries who indicate that national guidelines/protocols/standards exist for all four NCDs (cardiovascular diseases, diabetes, cancer and chronic respiratory diseases).
This indicator is considered fully achieved if national guidelines/protocols/standards exist for all four NCDs (cardiovascular diseases, diabetes, cancer and chronic respiratory diseases), and the country provides the needed supporting documentation.
This indicator is considered partially achieved if the country has guidelines/protocols/standards for at least two of the four NCDs (cardiovascular diseases, diabetes, cancer and chronic respiratory diseases), but not for all four.
Data validation process
Countries are asked to submit a copy of the guidelines/protocols/ standards when submitting their response to the NCD CCS. Where discrepancies are noted, these are referred back to the country for clarification and modification.
Expected frequency of data collection
Every two years
Links to tool http://www.who.int/ncds/surveillance/ncd-capacity/en/
Member State has evidence-based national guidelines/protocols/standards for the management of major NCDs through a primary care approach, recognized/ approved by government or competent authorities

PROGRESS ON THE PREVENTION AND CONTROL OF NONCOMMUNICABLE DISEASES IN THE WESTERN PACIFIC REGION
146
No. Country/area 2015 2017 2019
1 Australia Partially achieved Fully achieved Fully achieved
2 Brunei Darussalam Fully achieved Partially achieved Partially achieved
3 Hong Kong SAR (China) Partially achieved Partially achieved Partially achieved
4 Japan – Don't know Don't know
5 Macao SAR (China) Partially achieved Partially achieved Partially achieved
6 New Zealand Fully achieved Fully achieved Fully achieved
7 Republic of Korea Fully achieved Partially achieved Partially achieved
8 Singapore Fully achieved Fully achieved Fully achieved
% Fully achieved: HIC (N=8) 4 (50%) 3 (38%) 3 (38%)
1 Cambodia Not achieved Not achieved Partially achieved
2 China Fully achieved Fully achieved Fully achieved
3 Lao People’s Democratic Republic
Not achieved Fully achieved Fully achieved
4 Malaysia Fully achieved Fully achieved Fully achieved
5 Mongolia Partially achieved Partially achieved Fully achieved
6 Philippines Partially achieved Partially achieved Not achieved
7 Viet Nam Fully achieved* Fully achieved Fully achieved
% Fully achieved: LMIC (N=7)
3 (43%) 4 (57%) 5 (71%)
1 American Samoa No data – No response
2 Cook Islands No data Fully achieved Partially achieved
3 Fiji Partially achieved Partially achieved Partially achieved
4 French Polynesia Not achieved Fully achieved Fully achieved
5 Guam Fully achieved Partially achieved Fully achieved
6 Kiribati – Partially achieved Partially achieved
7 Marshall Islands – Not achieved Not achieved
8 Micronesia (Federated States of)
Partially achieved Partially achieved Partially achieved
9 Nauru Don't know Fully achieved Partially achieved
10 New Caledonia – – Not achieved
Indicator 9. Country or area has evidence-based national guidelines/protocols/standards for the management of major NCDs through a primary care approach, recognized/approved by government or competent authorities

ANNEX 3. INDICATOR DEFINITIONS AND SPECIFICATIONS, THE STATUS OF COUNTRIES AND AREAS
147
No. Country/area 2015 2017 2019
11 Niue Not achieved Fully achieved Partially achieved
12 Northern Mariana Islands (Commonwealth of the)
– Partially achieved Partially achieved
13 Palau Fully achieved Fully achieved Fully achieved
14 Papua New Guinea – Partially achieved Partially achieved
15 Samoa No data Partially achieved No response
16 Solomon Islands Partially achieved*
Partially achieved Partially achieved
17 Tokelau No data Don't know Not achieved
18 Tonga Partially achieved Partially achieved Fully achieved
19 Tuvalu Partially achieved Partially achieved Partially achieved
20 Vanuatu Partially achieved Partially achieved Partially achieved
21 Wallis and Futuna Partially achieved No response No response
% Fully achieved: PIC (N=21) 2 (10%) 5 (24%) 4 (19%)
TOTAL (N=36) 9 (25%) 12 (33%) 12 (35%)
* As reported by the country – : documentation not available

PROGRESS ON THE PREVENTION AND CONTROL OF NONCOMMUNICABLE DISEASES IN THE WESTERN PACIFIC REGION
148
Definition Country has provision of drug therapy (including glycaemic control for diabetes mellitus and control of hypertension using a total risk approach), and counselling to individuals who have had a heart attack or stroke and to persons with high risk (≥ 30%, or ≥20%) of a fatal and non-fatal cardiovascular event in the next 10 years.
Data collection tool and achievement criteria
WHO NCD Country Capacity Survey tool – The NCD CCS is completed by a team at the country level to ensure a comprehensive response is compiled.
This indicator is based on the number of countries who respond “more than 50%” to the question “What proportion of primary health care facilities are offering cardiovascular risk stratification for the management of patients at high risk for heart attack and stroke?”. Additionally, countries must have said all the following drugs were “generally available” in the primary care facilities of the public health sector: insulin, aspirin, metformin, thiazide diuretics, ACE inhibitors, CC blockers, statins and sulphonylurea(s).
This indicator is considered fully achieved if the country reports that more than 50% of primary health care facilities are offering cardiovascular risk stratification for the management of patients at high risk for heart attack and stroke and that all drugs listed above were generally available in the primary care facilities of the public health sector.
This indicator is considered partially achieved if the country reports that between 25% to 50% of primary health care facilities are offering cardiovascular risk stratification for the management of patients at high risk for heart attack and stroke and that all of the drugs listed above were generally available in the primary care facilities of the public health sector.
Data validation process
NCD focal points, officially nominated by the Ministry of Health, provide the official response to WHO through the NCD Country Capacity Survey tool.
Expected frequency of data collection
Every two years
Links to tool http://www.who.int/ncds/surveillance/ncd-capacity/en/
Member State has provision of drug therapy, including glycaemic control, and counselling for eligible persons at high risk to prevent heart attacks and strokes, with emphasis on the primary care level

ANNEX 3. INDICATOR DEFINITIONS AND SPECIFICATIONS, THE STATUS OF COUNTRIES AND AREAS
149
No. Country/area 2015 2017 2019
1 Australia Don't know Don't know Don't know
2 Brunei Darussalam Fully achieved Fully achieved Fully achieved
3 Hong Kong SAR (China) Don't know Fully achieved Fully achieved
4 Japan Don't know Don't know Don't know
5 Macao SAR (China) Not achieved Partially achieved Fully achieved
6 New Zealand Fully achieved Fully achieved Fully achieved
7 Republic of Korea Not achieved Fully achieved Fully achieved
8 Singapore Don't know Don't know Don't know
% Fully achieved: HIC (N=8) 2 (25%) 4 (50%) 5 (63%)
1 Cambodia Not achieved Not achieved Not achieved
2 China Not achieved Not achieved Fully achieved
3 Lao People’s Democratic Republic
Not achieved Not achieved Not achieved
4 Malaysia Fully achieved Fully achieved Fully achieved
5 Mongolia Not achieved Not achieved Partially achieved
6 Philippines Not achieved Not achieved Not achieved
7 Viet Nam Not achieved Not achieved Not achieved
% Fully achieved: LMIC (N=7)
1 (14%) 1 (14%) 2 (29%)
1 American Samoa No data Don't know No response
2 Cook Islands No data Fully achieved Fully achieved
3 Fiji Not achieved Partially achieved Not achieved
4 French Polynesia Partially achieved Partially achieved Not achieved
5 Guam Partially achieved Partially achieved Partially achieved
6 Kiribati No data Don't know Fully achieved
7 Marshall Islands Don't know Not achieved Not achieved
8 Micronesia (Federated States of)
Not achieved Not achieved Fully achieved
9 Nauru Partially achieved Partially achieved Partially achieved
10 New Caledonia Not achieved Partially achieved Don't know
Indicator 10. Country or area has provision of drug therapy, including glycaemic control, and counselling for eligible persons at high risk to prevent heart attack and stroke, with emphasis on the primary care level

PROGRESS ON THE PREVENTION AND CONTROL OF NONCOMMUNICABLE DISEASES IN THE WESTERN PACIFIC REGION
150
No. Country/area 2015 2017 2019
11 Niue Partially achieved Partially achieved Not achieved
12 Northern Mariana Islands (Commonwealth of the)
Don't know Fully achieved Fully achieved
13 Palau Fully achieved Fully achieved Fully achieved
14 Papua New Guinea Not achieved Not achieved Not achieved
15 Samoa No data Not achieved Not achieved
16 Solomon Islands Not achieved Not achieved Not achieved
17 Tokelau No data Fully achieved Fully achieved
18 Tonga Not achieved Not achieved Fully achieved
19 Tuvalu Not achieved Partially achieved Fully achieved
20 Vanuatu Not achieved Not achieved Not achieved
21 Wallis and Futuna Not achieved No response No response
% Fully achieved: PIC (N=21) 1 (5%) 4 (19%) 8 (38%)
TOTAL (N=36) 4 (11%) 9 (25%) 15 (44%)