progress in nuclear energy - ipen · stainless steel cladding. fuel elements designed to permit...
TRANSCRIPT

lable at ScienceDirect
Progress in Nuclear Energy 53 (2011) 344e353
Contents lists avai
Progress in Nuclear Energy
journal homepage: www.elsevier .com/locate/pnucene
Nondestructive burnup measurements by gamma-ray spectroscopy on spent fuelelements of the RP-10 research reactor
Mariano Vela Mora a, Alberto Gallardo Padilla a, José Luis Castro Palomino a,Luís Antônio Albiac Terremoto b,*
a Instituto Peruano de Energía Nuclear (IPEN), Grupo de Cálculo, Análisis y Seguridad de Reactores, Avenida Canadá 1470, Apartado 1687, Lima 41, Perub Instituto de Pesquisas Energéticas e Nucleares (IPEN/CNEN-SP), Centro de Engenharia Nuclear (CEN), Avenida Prof. Lineu Prestes 2242 e Cidade Universitária,CEP 05508-000 São Paulo, SP, Brazil
a r t i c l e i n f o
Article history:Received 1 September 2010Received in revised form14 January 2011Accepted 14 January 2011
Keywords:Gamma spectroscopyFuel elementsResearch reactorsFission products
* Corresponding author. Tel.: þ551131339464; fax:E-mail address: [email protected] (L.A.A. Terremoto
0149-1970/$ e see front matter � 2011 Elsevier Ltd.doi:10.1016/j.pnucene.2011.01.003
a b s t r a c t
Gamma-ray spectroscopy is an important nondestructive method for the qualification of irradiatednuclear fuels. Regarding research reactors, the main parameter required in the scope of such qualificationis the average burnup of spent fuel elements. This work describes the measurement, using nonde-structive gamma-ray spectroscopy, of the average burnup attained by Material Testing Reactor (MTR) fuelelements irradiated in the RP-10 research reactor. Measurements were performed at the reactor storagepool area using 137Cs as the only burnup monitor, even for spent fuel elements with cooling times muchshorter than two years. The experimental apparatus was previously calibrated in efficiency to obtainabsolute average burnup values, which were compared against corresponding ones furnished by reactorphysics calculations. The mean deviation between both values amounts to 6%.
� 2011 Elsevier Ltd. All rights reserved.
1. Introduction
The RP-10 is a 10 MW pool type nuclear research reactor,moderated and cooled by light water, located at the InstitutoPeruano de Energía Nuclear (IPEN/Peru). After its first criticality in25/11/1988, the RP-10 research reactor followed a weekly scheduleof operation between Friday and Saturday during approximately10 h at 7 MW, with the other days reserved to operation during2e3 h at low power (320 kW) for activation analysis experiments.This routine changed in the beginning of the 2000s so that, until theend of 2007, operation took place every week on Sunday during 6 hat 10 MWand on the other days during 2e3 h at 320 kW. Currently,the reactor is operated on Thursday and on Friday during 5 h at10 MW, whereas the other days of the week comprise low poweroperations on the same basis already mentioned.
The core of the RP-10 research reactor employs 29 plate-typeusually designated as Material Testing Reactor (MTR) fuel elements,as well as 5 fork-type control rods of silver-indium-cadmium alloy(AgeIneCd alloy in proportion of 80%e15%e5% respectively) withstainless steel cladding. Fuel elements designed to permit insertionof a control rod are named control fuel elements, whereas all the
þ551131339423.).
All rights reserved.
others are named standard fuel elements. Aluminum-claddedgraphite reflectors and beryllium reflectors are positioned aroundthe reactor core.
Each MTR fuel element is constituted by plane parallel fuelplates, mounted mechanically between 2 lateral aluminum holderswith grooves. A plane fuel plate contains a meat, where the nuclearfuel is located, surrounded by aluminum cladding. Standard fuelelements have 16 plane parallel fuel plates, whereas control fuelelements have 12 plane parallel fuel plates. The total thickness ofa fuel plate is 0.176 cm and the meat thickness is equal to 0.100 cm.The external cladding thickness of the first and the sixteenth fuelplates of a standard fuel element is 0.045 cm. The gap betweensuccessive plates of a standard fuel element is 0.330 cm. Each fuelplate has an active length of 61.500 cm and an active width of6.275 cm. Overall dimensions of a fuel element are (7.620 � 8.124)cm by 95.730 cm high. Fig. 1 presents the diagram of a standardMTR fuel element irradiated in the RP-10 research reactor.
Regarding active length and width, control fuel elementspresent the same design parameters of the standard ones, exceptfor the fact that the first, second, fifteenth and sixteenth fuel platesare replaced by massive aluminum plates with thickness equal to0.127 cm. Each pair of massive aluminum plates is separated bya gap of 0.610 cm, whereas the most internal massive aluminumplates and the most external fuel plates are 0.240 cm apart.

Fig. 1. Standard MTR fuel element irradiated in the RP-10 research reactor: (a) cross-sectional diagram; (b) detailed structure of successive fuel plates; (c) isometric view. Theposition of the reference frame used is indicated. All dimensions are given in cm.
M.V. Mora et al. / Progress in Nuclear Energy 53 (2011) 344e353 345
Currently, the nuclear fuel employed in the RP-10 researchreactor is U3O8 dispersed in an aluminum matrix, containing2.30 gU/cm3, whose uranium has 19.75% enrichment in 235U. ThisLow Enriched Uranium (LEU) nuclear fuel was made in Germany(NUKEM).
There are 7 standard and 2 control fuel elements stored underwater in the racks of the reactor storage pool, all of them containingthe LEU nuclear fuel described above. First irradiation of all thesefuel elements was carried out on 25/11/1988. The oldest fuelelements under wet storage were definitively withdrawn from thereactor core on 12/06/2003, whereas the newest ones are in thestorage pool since 23/08/2007.
The necessity of measuring nondestructively the averageburnup of these spent fuel elements was the main reason for IPEN/Peru to design, fabricate, install and operate a gamma scanningsystem, which is similar to those depicted in previous works(Rasmussen et al., 1966; Robinson et al., 1988; Wang et al., 1990;Kestelman and Guevara, 1988; Terremoto et al., 2000; Henríquezet al., 2001; Pereda et al., 2004) for use in gamma-ray spectros-copy on irradiated MTR fuel elements. Peruvian nuclear regulatoryauthorities require that experimental (gamma-ray spectroscopy) aswell as theoretical (reactor physics calculations) results must beconsidered in order to check conformity of the discharge averageburnup with the technical specifications of the nuclear fuelproducer.
Installed at the reactor storage pool area, the gamma scanningsystem employs the gamma-ray spectroscopy method, which isbased on analysis of spectra that result from collimation anddetection of gamma-rays emitted during the decay of some radio-active fission products contained in the spent fuel elements. Toobtain the necessary information, complete gamma-ray spectra areaccumulated as a function of axial and transversal positions. Thenet number of counts (area) under the full-energy peak of661.6 keV is determined, giving a quantitative measurement of theamount of 137Cs present at a specific location. These amounts can berelated to the total absolute activity of 137Cs, used as burnup
monitor, which enables the measurement of the total number offission events and therefore the fuel element absolute averageburnup.
However, the measurement of absolute average burnup of MTRfuel elements by gamma-ray spectroscopy requires the previousenergy and efficiency calibration of the experimental apparatus,a rigorous control of its geometry, detailed knowledge about theirradiation history of the spent fuel element and accurate evaluationof all attenuation effects involved (Kestelman and Guevara, 1988;Terremoto et al., 2000; Henríquez et al., 2001; Pereda et al., 2004).
2. Theory
2.1. Attenuation effects
Gamma-rays emitted by radioactive fission products are atten-uated as they emerge from the irradiated nuclear fuel and traversesuccessive layers of different materials. Consequently, all attenua-tion effects must be evaluated in order to measure the absolutegamma activity of spent fuel elements. This evaluation is carriedout calculating the associated corrections regarding a spent MTRfuel element positioned horizontally during the measurements,with the surface of the fuel plates upwards.
The first correction to be calculated arises from the attenuationof gamma-rays traversing the plate meat where they are emitted,an effect called self-attenuation. During the measurements, thedetector-to-plate distance remains large and unchanged. In suchfar-field configuration, the self-attenuation correction is given by(Debertin and Helmer, 1988)
k1 ¼ 1� e�ms
ms(1)
where s is the plate meat thickness and m is the linear attenuationcoefficient, for a given gamma-ray energy, of the fuel materialcontained in the plate meat.
M.V. Mora et al. / Progress in Nuclear Energy 53 (2011) 344e353346
A second correction is due to attenuation of gamma-rayspassing through the fuel plates and the water between them,because measurements have to be performed at the reactor storagepool. Taking into account the mentioned far-field configurationduring the measurements and considering that all fuel plates of anelement are identical and were irradiated under the same condi-tions, the correction that corresponds to the attenuation ofa gamma-ray, emitted in the meat of the jth fuel plate and passingthrough successive layers until reaching the upper surface of themeat contained inside the last (16th) fuel plate, results
K16�j ¼�e�2mAla$e�mab$e�ms
�16�j(2)
where mAl is the aluminum linear attenuation coefficient, ma is thewater linear attenuation coefficient, a is the aluminum claddingthickness and b is the distance between two successive fuel platesof the element (this distance is filled with water).
Another correction to be evaluated originates from the attenu-ation of gamma-rays after traversing the upper aluminum claddingof the last fuel plate as well as the water layer between the last fuelplate and the bottom edge of the collimator tube. In this case, thecorrection due to attenuation is given by
k2 ¼ e�mAlc$e�maC (3)
where c is the upper aluminum cladding thickness of the last fuelplate and C is the distance between the last fuel plate and thebottom edge of the collimator tube.
In this work, corrections due to attenuation of gamma-raystraversing the aluminum window that closes the collimator tubeand the air contained inside the collimator tube, contrary toa previous burnup determination experiment (Terremoto et al.,2000), are not evaluated explicitly, because the efficiency calibra-tion of the experimental apparatus already includes them.
The total correction due to attenuation effects can be obtainedfrom the product of all corrections calculated by means of expres-sions (1)e(3).
2.2. Burnup monitor activity
Considering the total correction due to attenuation effects andusing the reference frame shown in Fig. 1, if r (x, y) is the specificactivity of the irradiated fuel plates at the point (x, y), the number ofcounts per unit of time registered by the detector owed to the jthfuel plate, when the collimator tube is positioned over the point(x, y), is equal to
Qjðx; yÞ ¼ rðx; yÞsIgAj3jk1k2K16�j (4)
where Ig is the absolute emission intensity of the gamma-ray, Aj isthe area defined by the detection solid angle on the central plane ofthe jth plate meat and 3j is the detector absolute efficiency forgamma-rays of a given energy and for the geometrical configura-tion embracing jth plate meat, collimator tube and detector duringthe measurements.
As a consequence of the activity of all the 16 irradiated fuelplates forming a spent fuel element, the total number of counts perunit of time, registered by the detector, results
Qðx; yÞ ¼X16
j¼1
Qjðx; yÞ ¼ rðx; yÞs Ig k1 k2X16
j¼1
Aj3j K16�j (5)
The total activity of the same spent fuel element due to a givenburnup monitor is
D ¼ 16 l w s r (6)
where l is the active length of each fuel plate of the element, w isthe active width of each fuel plate of the element and r is theaverage specific activity of each fuel plate.
Regarding the detector, it registers a total number of counts perunit of time whose average value Q is obtained by means ofmeasurements performed along the active length and along theactive width of the spent fuel element, been related to r by theexpression
Q ¼ r s Ig k1 k2X16
j¼1
Aj3j K16�j (7)
A combination of expressions (6) and (7) indicate that the totalactivity of a spent fuel element due to a given burnup monitor canbe written as
D ¼ 16 l w Q
Ig k1 k2X16
j¼1
Aj3j K16�j
(8)
Once the total correction due to attenuation effects has beenconsidered, expression (8) shows that the product Aj3j and theparameter Q must be measured in order to determinate experi-mentally the total activity D of the spent fuel element concerninga given burnup monitor.
2.3. Burnup determination
Whereas the values of the product Aj3j are measured during theefficiency calibration of the experimental apparatus, the parameterQ is obtained by means of gamma-ray spectroscopy measurementson each one of the spent fuel elements.
Gamma-ray spectroscopy measurements on each one of thespent fuel elements are performed with the same duration andfollowing parallel rows along the active length. Every row embracesmany gamma-ray spectra measured on points located at approxi-mately regular intervals. For all spectra, the net number of counts(area), under the full-energy peak that corresponds to a givenburnup monitor, is determined directly afterward.
The average value of the number of counts for each row isdetermined integrating the net number of counts along the activelength and, subsequently, dividing the result by the total activelength l of the spent fuel element. In order to obtain the averagenumber of counts under the full-energy peak of interest for thewhole measurement, an arithmetical mean of the average valuesfor all rows is calculated. Thereafter, the spent fuel element isturned 180� around its axis and the entire measurement isrepeated. As a result, two values of Q are obtained, one for each sideof a spent fuel element.
Another method employed to obtain Q consists of measuringonly the central axis rowalong the active length and along the activewidth of a spent fuel element, calculating the average number ofcounts per unit of time for both rows, adding them together andsubtracting the result from the number of counts per unit of timemeasured at the central point of the spent fuel element (Kestelmanand Guevara, 1988). Although this method has been tested quitesuccessfully (Kestelman and Guevara, 1988; Terremoto et al., 2000;Henríquez et al., 2001), the different procedure adopted in thepresent work to determine the value of Q intends to get a moredetailed picture of the burnup distribution across the spent fuelelements and to reduce the total relative error for average burnupmeasurement by means of gamma-ray spectroscopy.
Replacing the obtained value of Q in expression (8) and usingthe radioactive decay law, the total number of burnup monitor

M.V. Mora et al. / Progress in Nuclear Energy 53 (2011) 344e353 347
nuclei present in the spent fuel element, immediately after the endof the last irradiation period, becomes
N0 ¼ 16 l w Q
l Ig k1 k2X16
j¼1
Aj3j K16�j
eltc (9)
where l is the decay constant of the burnup monitor and tc is thetime interval between the end of the last irradiation period of thefuel element and the start of the gamma-ray spectroscopymeasurements on it.
The fissioned mass of 235U in the spent fuel element is given by
DU ¼ N0 m0
Y N0U
f (10)
whereN0U is the initial number of 235U atoms in the fuel element,m0
is the initial mass of 235U in the fuel element, Y is the average yieldof the burnup monitor in the fission of 235U and f is a correctionfactor that takes into account the decay of burnup monitor nucleioccurred during different irradiation periods and powers, which isgiven by the following expression (Bibichev et al., 1979):
f ¼lXn
i¼1
Piti
Xn
i¼1
Pie�lsi
�1� e�lti
� (11)
where Pi is the average relative power corresponding to the ith
irradiation period ðbeenXn
i¼1
Pi ¼ 1Þ, n is the total number of
irradiation periods during the whole irradiation history of the fuelelement, ti is the duration of the ith irradiation period and si is thetime interval between the end of the ith irradiation period and theend of the last irradiation period.
Finally, the combined use of equations (9)e(11) determines thefissioned mass of 235U in the spent fuel element, whereas the ratioDU/m0 furnishes its average burnup.
This procedure is carried out separately for both sides of a spentfuel element and the overall value of its average burnup resultsfrom an uncertainty-weighted mean (Helene and Vanin, 1981) ofthe two values obtained.
The overall value of the average burnup was measured in 3e5different dates for each spent fuel element, in order to test thereproducibility of the measurements. At the end, for a given spentfuel element the final value of the average burnup results from anuncertainty-weighted mean (Helene and Vanin, 1981) of the 3e5overall values measured.
Fig. 2. Cross-sectional diagram of the collimator tube used in the gamma-ray spec-troscopy measurements. All dimensions are given in cm.
3. Experiment
3.1. Experimental apparatus
The gamma scanning system of IPEN/Peru consists of collimatortube, adjustable stainless steel holders, xeymotion device made upof stainless steel base equipped with two perpendicular crankdriven mechanisms, high-purity germanium (HPGe) detectortogether with fast suitable electronics and an online microcom-puter data acquisition module. The holders are employed in thepositioning of the collimator tube between the spent fuel elementand the HPGe detector. This configuration enables the determina-tion of gamma emission rate of a specific fuel volume and avoidsthe system overflow concerning data acquisition.
During the measurements, the spent fuel element remains overa stainless steel platform located under the water of the reactorstorage pool, while the detector and other electronic componentsare installed permanently outside thewater at the reactor pool hall.The collimator tube extends from 0.35 � 0.05 cm above the surfaceof the last plate of the spent fuel element up to 3.0 cm sidewaysbelow the HPGe detector, perpendicularly to the detector axis and1.8 cm away from the detector aluminum window (position thatcorresponds to the center of the germanium crystal side surface).
The collimator tube consists of central part, upper collimator andbottom collimator. The central part is an aluminum cylindrical pipewith a length of 310.1 cm, an external diameter of 3.2 cm and awallthickness of 0.5 cm. Lead collimators cladded with aluminum areattached to both ends of the central part by means of mortises. Theupper collimator is removable andhas a length of 5.9 cm, an externaldiameter of 3.2 cm and a central collimating aperturewith diameterof 0.6 cm. The bottom collimator has a length of 18.5 cm, an externaldiameter of 5.0 cm and a central collimating aperturewith diameter

M.V. Mora et al. / Progress in Nuclear Energy 53 (2011) 344e353348
of 0.6 cm closed by an aluminumwindow with thickness of 0.1 cm,which can be opened when the collimator tube is outside the waterin order to check the alignment of the gamma scanning system.Therefore, the total length of the collimator tube is 334.5 cm. Fig. 2shows schematically the cross-sectional diagram of the collimatortube used in the gamma-ray spectroscopy measurements.
After been collimated, gamma-rays are detected by the HPGedetector together with fast suitable electronics composed ofamplifier, high voltage supply, multichannel analyzer and BIN. Allthese electronic components of the gamma scanning system aremanufactured by CANBERRA. The HPGe detector has a volume of51.39 cm3, with 1.68 keV resolution and 10.1% relative efficiency forthe 1332.5 keV gamma-ray of 60Co. The gamma-ray energy rangetaken for the analysis is from 50 keV to 2800 keV. Acquisition ofgamma-ray spectra is performed with the multichannel analyzercoupled to a microcomputer through an S100 control interface.
3.2. Efficiency calibration
In order to perform the efficiency calibration, the collimatortube and the electronic components of the gamma scanning systemwere removed from the reactor storage pool and transported toa laboratory, where they were assembled in a configuration thatreproduces exactly their relative positioning during the measure-ments. Shortly thereafter, the aluminum window of the bottomcollimator was opened and the alignment of the system waschecked using a low intensity laser beam. Careful adjustments weremade manually until the correct alignment has been attained.
Following the alignment, the aluminum window of the bottomcollimator was closed and a 5.21 � 108 Bq calibration source of137Cs, sealed in a small stainless steel cylindrical case with activediameter of 0.6 cm, was placed on a short ruled rail along thecollimator tube central axis, in front of the aluminum window ofthe bottom collimator. The absolute efficiency of the system wasmeasured as a function of the distance between the bottom colli-mator window and the upper circular surface of the calibrationsource, embracing the range from 0 to 9 cm. This efficiency cali-bration function was employed to determine the absolute values ofthe product Aj3j at the center of each plate meat of a spent fuelelement during the measurements performed at the reactorstorage pool.
The exclusive utilization of 137Cs in the efficiency calibrationprocedurewas consequence of a decision to use this radionuclide asthe only burnup monitor. Two circumstances led to such decision:the lack of calibration sources of other burnupmonitors (Terremotoet al., 2000) with shape suitable for the efficiency calibrationprocedure and the intent to test the adequacy of using 137Cs asburnup monitor even for spent fuel elements with cooling timesmuch shorter than two years.
After the efficiency calibration has been concluded, the colli-mator tube and the electronic components of the gamma scanningsystem were transported back to the reactor storage pool andassembled there once again. The energy calibration of the systemwas then carried out according to the standard procedure (Knoll,1989), using punctiform calibration sources of 137Cs, 60Co and152Eu, as well as the high energy gamma-rays of 24Na, an activationproduct (Perrotta et al., 1998; Terremoto et al., 2000; Zeituni et al.,2004) present with very low activity in the reactor storage pool.
Fig. 3. Schematic diagram of the main components of the arrangement assembled inorder to test the efficiency calibration reproducibility. All dimensions are given in cm.
3.3. Test of the efficiency calibration reproducibility
A procedure created in IPEN/Peru was employed to test theefficiency calibration reproducibility after the complete assemblingof the gamma scanning system at the reactor storage pool.
According to this procedure, the sealed calibration source of137Cs previously used in the laboratory was encased tightly ina notch machined at the centre of a squared Plexiglas holder con-taining a circular mortise with the same external diameter as thebottom collimator and a long nylon string attached to each one ofits four corners.
Promptly thereafter, the holder was immersed in the reactorstorage pool and coupled to the bottom collimator using the strings,which were then symmetrically tied to the upper structure of thestainless steel holders of the gamma scanning system.
This arrangement, whose main components are shown sche-matically in Fig. 3, assures the precise positioning of the calibrationsource at the center of the aluminum window of the bottomcollimator. Under such configuration, the efficiency of the gammascanning system was determined by 3 complete measurementswith duration of 30 min live time each, and the average result wascompared with the one given by the efficiency calibration functionfor the distance equal to 0 cm.
Such procedure was repeated before every set of gamma-rayspectroscopy measurements on each spent fuel element. All resultsobtained from efficiency measurements performed at the reactorstorage pool showed good agreement with the corresponding oneobtained from the efficiency calibration function within an exper-imental uncertainty of approximately 2%.
Once the test of the efficiency calibration reproducibility hasbeen successfully completed, the calibration source of 137Cs wasremoved from the reactor storage pool and hoarded in a leadshielding located faraway outside the water, while a spent fuel
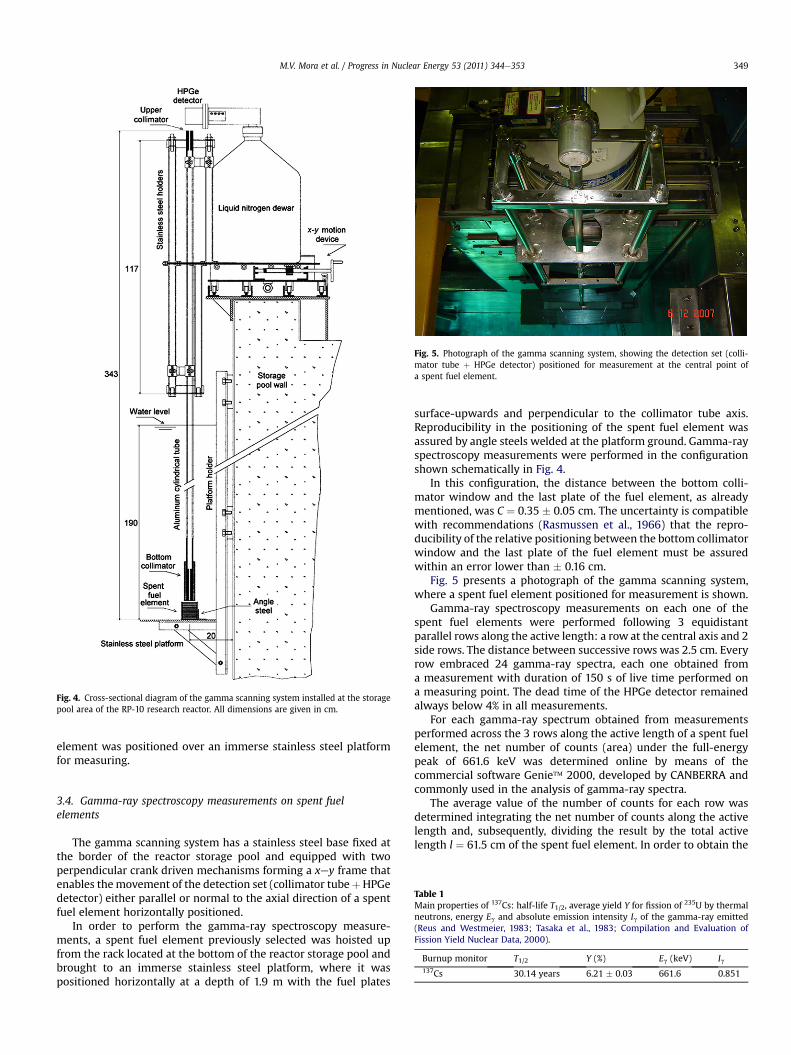
Fig. 5. Photograph of the gamma scanning system, showing the detection set (colli-mator tube þ HPGe detector) positioned for measurement at the central point ofa spent fuel element.
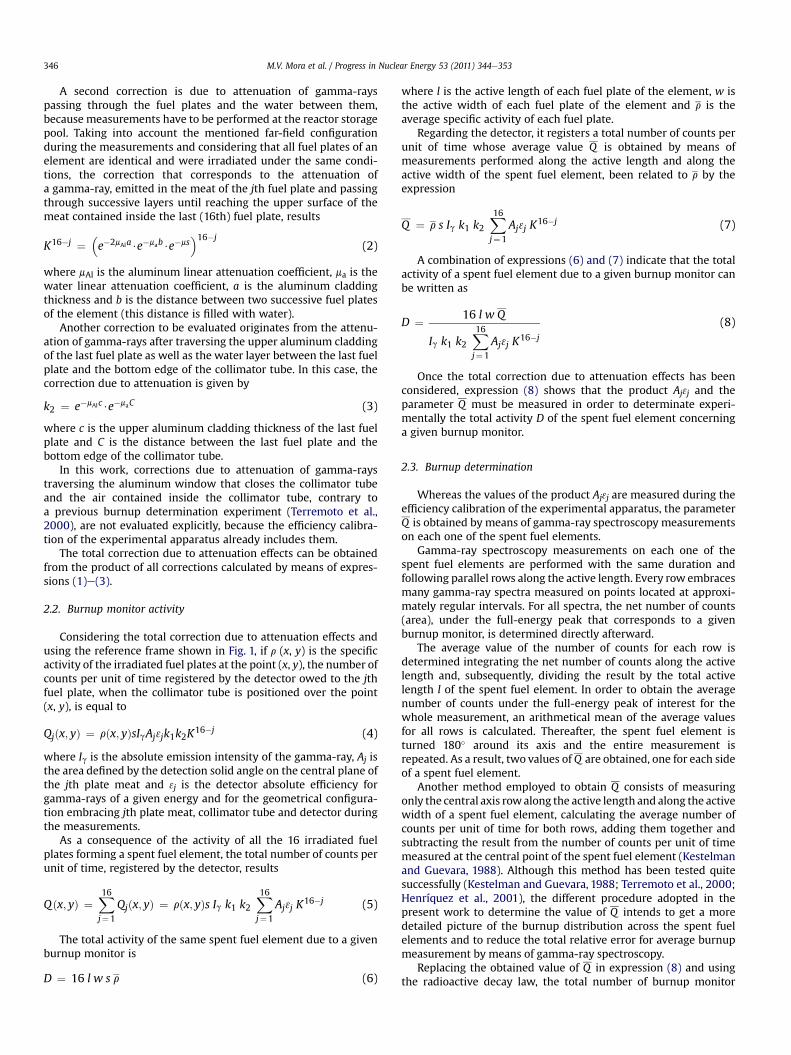
Fig. 4. Cross-sectional diagram of the gamma scanning system installed at the storagepool area of the RP-10 research reactor. All dimensions are given in cm.
M.V. Mora et al. / Progress in Nuclear Energy 53 (2011) 344e353 349
element was positioned over an immerse stainless steel platformfor measuring.
Table 1Main properties of 137Cs: half-life T1/2, average yield Y for fission of 235U by thermalneutrons, energy Eg and absolute emission intensity Ig of the gamma-ray emitted(Reus and Westmeier, 1983; Tasaka et al., 1983; Compilation and Evaluation ofFission Yield Nuclear Data, 2000).
Burnup monitor T1/2 Y (%) Eg (keV) Ig137Cs 30.14 years 6.21 � 0.03 661.6 0.851
3.4. Gamma-ray spectroscopy measurements on spent fuelelements
The gamma scanning system has a stainless steel base fixed atthe border of the reactor storage pool and equipped with twoperpendicular crank driven mechanisms forming a xey frame thatenables themovement of the detection set (collimator tubeþHPGedetector) either parallel or normal to the axial direction of a spentfuel element horizontally positioned.
In order to perform the gamma-ray spectroscopy measure-ments, a spent fuel element previously selected was hoisted upfrom the rack located at the bottom of the reactor storage pool andbrought to an immerse stainless steel platform, where it waspositioned horizontally at a depth of 1.9 m with the fuel plates
surface-upwards and perpendicular to the collimator tube axis.Reproducibility in the positioning of the spent fuel element wasassured by angle steels welded at the platform ground. Gamma-rayspectroscopy measurements were performed in the configurationshown schematically in Fig. 4.
In this configuration, the distance between the bottom colli-mator window and the last plate of the fuel element, as alreadymentioned, was C ¼ 0.35 � 0.05 cm. The uncertainty is compatiblewith recommendations (Rasmussen et al., 1966) that the repro-ducibility of the relative positioning between the bottom collimatorwindow and the last plate of the fuel element must be assuredwithin an error lower than � 0.16 cm.
Fig. 5 presents a photograph of the gamma scanning system,where a spent fuel element positioned for measurement is shown.
Gamma-ray spectroscopy measurements on each one of thespent fuel elements were performed following 3 equidistantparallel rows along the active length: a row at the central axis and 2side rows. The distance between successive rows was 2.5 cm. Everyrow embraced 24 gamma-ray spectra, each one obtained froma measurement with duration of 150 s of live time performed ona measuring point. The dead time of the HPGe detector remainedalways below 4% in all measurements.
For each gamma-ray spectrum obtained from measurementsperformed across the 3 rows along the active length of a spent fuelelement, the net number of counts (area) under the full-energypeak of 661.6 keV was determined online by means of thecommercial software Genie� 2000, developed by CANBERRA andcommonly used in the analysis of gamma-ray spectra.
The average value of the number of counts for each row wasdetermined integrating the net number of counts along the activelength and, subsequently, dividing the result by the total activelength l ¼ 61.5 cm of the spent fuel element. In order to obtain the
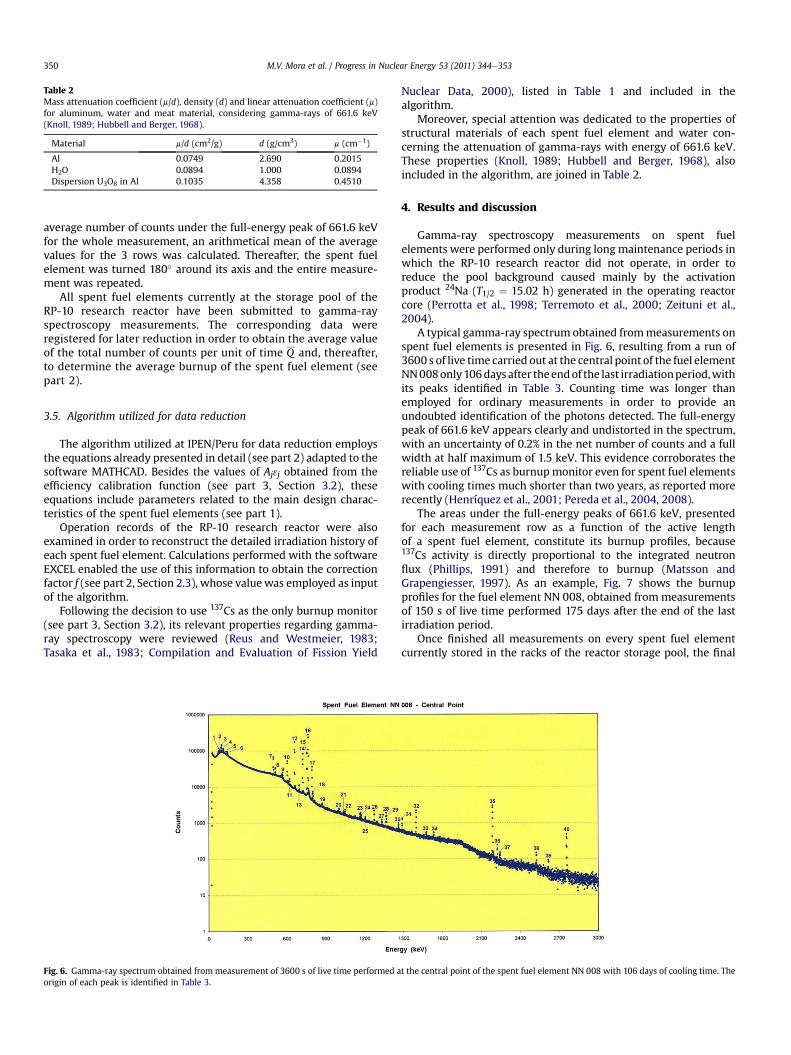
Table 2Mass attenuation coefficient (m/d), density (d) and linear attenuation coefficient (m)for aluminum, water and meat material, considering gamma-rays of 661.6 keV(Knoll, 1989; Hubbell and Berger, 1968).
Material m/d (cm2/g) d (g/cm3) m (cm�1)
Al 0.0749 2.690 0.2015H2O 0.0894 1.000 0.0894Dispersion U3O8 in Al 0.1035 4.358 0.4510
M.V. Mora et al. / Progress in Nuclear Energy 53 (2011) 344e353350
average number of counts under the full-energy peak of 661.6 keVfor the whole measurement, an arithmetical mean of the averagevalues for the 3 rows was calculated. Thereafter, the spent fuelelement was turned 180� around its axis and the entire measure-ment was repeated.
All spent fuel elements currently at the storage pool of theRP-10 research reactor have been submitted to gamma-rayspectroscopy measurements. The corresponding data wereregistered for later reduction in order to obtain the average valueof the total number of counts per unit of time Q and, thereafter,to determine the average burnup of the spent fuel element (seepart 2).
3.5. Algorithm utilized for data reduction
The algorithm utilized at IPEN/Peru for data reduction employsthe equations already presented in detail (see part 2) adapted to thesoftware MATHCAD. Besides the values of Aj3j obtained from theefficiency calibration function (see part 3, Section 3.2), theseequations include parameters related to the main design charac-teristics of the spent fuel elements (see part 1).
Operation records of the RP-10 research reactor were alsoexamined in order to reconstruct the detailed irradiation history ofeach spent fuel element. Calculations performed with the softwareEXCEL enabled the use of this information to obtain the correctionfactor f (see part 2, Section 2.3), whose valuewas employed as inputof the algorithm.
Following the decision to use 137Cs as the only burnup monitor(see part 3, Section 3.2), its relevant properties regarding gamma-ray spectroscopy were reviewed (Reus and Westmeier, 1983;Tasaka et al., 1983; Compilation and Evaluation of Fission Yield
Fig. 6. Gamma-ray spectrum obtained from measurement of 3600 s of live time performed aorigin of each peak is identified in Table 3.
Nuclear Data, 2000), listed in Table 1 and included in thealgorithm.
Moreover, special attention was dedicated to the properties ofstructural materials of each spent fuel element and water con-cerning the attenuation of gamma-rays with energy of 661.6 keV.These properties (Knoll, 1989; Hubbell and Berger, 1968), alsoincluded in the algorithm, are joined in Table 2.
4. Results and discussion
Gamma-ray spectroscopy measurements on spent fuelelements were performed only during long maintenance periods inwhich the RP-10 research reactor did not operate, in order toreduce the pool background caused mainly by the activationproduct 24Na (T1/2 ¼ 15.02 h) generated in the operating reactorcore (Perrotta et al., 1998; Terremoto et al., 2000; Zeituni et al.,2004).
A typical gamma-ray spectrum obtained frommeasurements onspent fuel elements is presented in Fig. 6, resulting from a run of3600 s of live time carried out at the central point of the fuel elementNN008only106days after theendof the last irradiationperiod,withits peaks identified in Table 3. Counting time was longer thanemployed for ordinary measurements in order to provide anundoubted identification of the photons detected. The full-energypeak of 661.6 keV appears clearly and undistorted in the spectrum,with an uncertainty of 0.2% in the net number of counts and a fullwidth at half maximum of 1.5 keV. This evidence corroborates thereliable use of 137Cs as burnupmonitor even for spent fuel elementswith cooling times much shorter than two years, as reported morerecently (Henríquez et al., 2001; Pereda et al., 2004, 2008).
The areas under the full-energy peaks of 661.6 keV, presentedfor each measurement row as a function of the active lengthof a spent fuel element, constitute its burnup profiles, because137Cs activity is directly proportional to the integrated neutronflux (Phillips, 1991) and therefore to burnup (Matsson andGrapengiesser, 1997). As an example, Fig. 7 shows the burnupprofiles for the fuel element NN 008, obtained frommeasurementsof 150 s of live time performed 175 days after the end of the lastirradiation period.
Once finished all measurements on every spent fuel elementcurrently stored in the racks of the reactor storage pool, the final
t the central point of the spent fuel element NN 008 with 106 days of cooling time. The
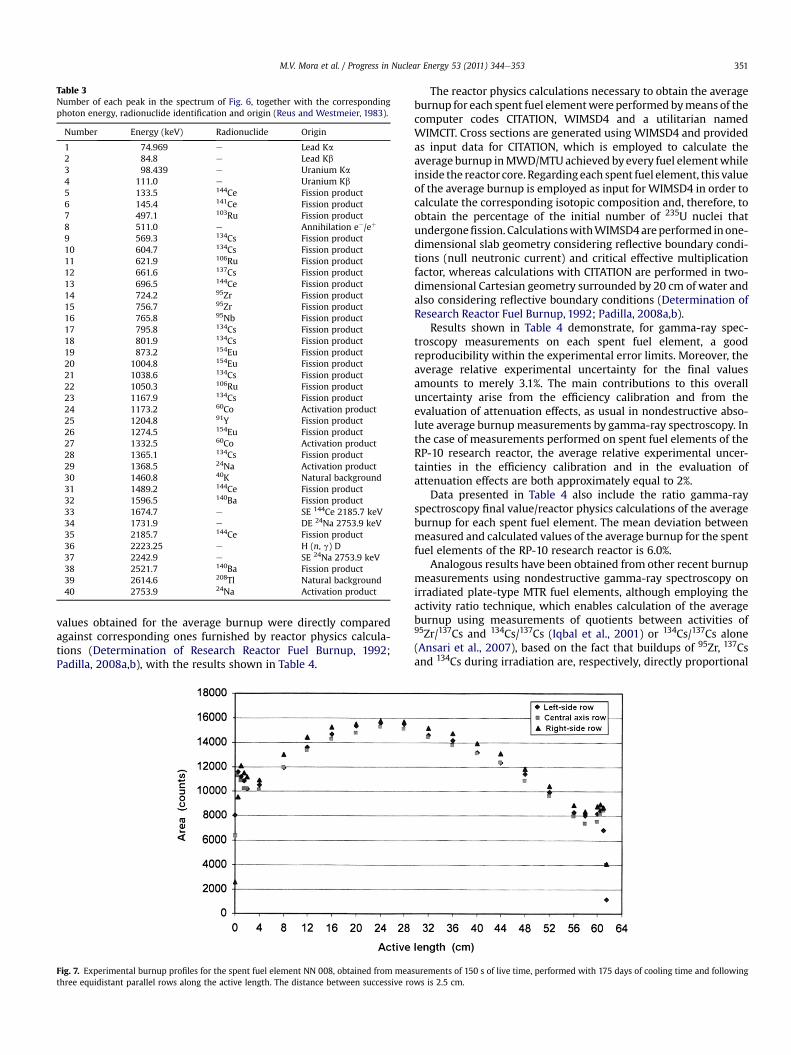
Table 3Number of each peak in the spectrum of Fig. 6, together with the correspondingphoton energy, radionuclide identification and origin (Reus and Westmeier, 1983).
Number Energy (keV) Radionuclide Origin
1 74.969 e Lead Ka2 84.8 e Lead Kb3 98.439 e Uranium Ka4 111.0 e Uranium Kb5 133.5 144Ce Fission product6 145.4 141Ce Fission product7 497.1 103Ru Fission product8 511.0 e Annihilation e�/eþ
9 569.3 134Cs Fission product10 604.7 134Cs Fission product11 621.9 106Ru Fission product12 661.6 137Cs Fission product13 696.5 144Ce Fission product14 724.2 95Zr Fission product15 756.7 95Zr Fission product16 765.8 95Nb Fission product17 795.8 134Cs Fission product18 801.9 134Cs Fission product19 873.2 154Eu Fission product20 1004.8 154Eu Fission product21 1038.6 134Cs Fission product22 1050.3 106Ru Fission product23 1167.9 134Cs Fission product24 1173.2 60Co Activation product25 1204.8 91Y Fission product26 1274.5 154Eu Fission product27 1332.5 60Co Activation product28 1365.1 134Cs Fission product29 1368.5 24Na Activation product30 1460.8 40K Natural background31 1489.2 144Ce Fission product32 1596.5 140Ba Fission product33 1674.7 e SE 144Ce 2185.7 keV34 1731.9 e DE 24Na 2753.9 keV35 2185.7 144Ce Fission product36 2223.25 e H (n, g) D37 2242.9 e SE 24Na 2753.9 keV38 2521.7 140Ba Fission product39 2614.6 208Tl Natural background40 2753.9 24Na Activation product
M.V. Mora et al. / Progress in Nuclear Energy 53 (2011) 344e353 351
values obtained for the average burnup were directly comparedagainst corresponding ones furnished by reactor physics calcula-tions (Determination of Research Reactor Fuel Burnup, 1992;Padilla, 2008a,b), with the results shown in Table 4.
Fig. 7. Experimental burnup profiles for the spent fuel element NN 008, obtained from meathree equidistant parallel rows along the active length. The distance between successive ro
The reactor physics calculations necessary to obtain the averageburnup for each spent fuel elementwere performed bymeans of thecomputer codes CITATION, WIMSD4 and a utilitarian namedWIMCIT. Cross sections are generated using WIMSD4 and providedas input data for CITATION, which is employed to calculate theaverage burnup inMWD/MTUachieved byevery fuel elementwhileinside the reactor core. Regarding each spent fuel element, this valueof the average burnup is employed as input for WIMSD4 in order tocalculate the corresponding isotopic composition and, therefore, toobtain the percentage of the initial number of 235U nuclei thatundergonefission. CalculationswithWIMSD4areperformed inone-dimensional slab geometry considering reflective boundary condi-tions (null neutronic current) and critical effective multiplicationfactor, whereas calculations with CITATION are performed in two-dimensional Cartesian geometry surrounded by 20 cm of water andalso considering reflective boundary conditions (Determination ofResearch Reactor Fuel Burnup, 1992; Padilla, 2008a,b).
Results shown in Table 4 demonstrate, for gamma-ray spec-troscopy measurements on each spent fuel element, a goodreproducibility within the experimental error limits. Moreover, theaverage relative experimental uncertainty for the final valuesamounts to merely 3.1%. The main contributions to this overalluncertainty arise from the efficiency calibration and from theevaluation of attenuation effects, as usual in nondestructive abso-lute average burnup measurements by gamma-ray spectroscopy. Inthe case of measurements performed on spent fuel elements of theRP-10 research reactor, the average relative experimental uncer-tainties in the efficiency calibration and in the evaluation ofattenuation effects are both approximately equal to 2%.
Data presented in Table 4 also include the ratio gamma-rayspectroscopy final value/reactor physics calculations of the averageburnup for each spent fuel element. The mean deviation betweenmeasured and calculated values of the average burnup for the spentfuel elements of the RP-10 research reactor is 6.0%.
Analogous results have been obtained from other recent burnupmeasurements using nondestructive gamma-ray spectroscopy onirradiated plate-type MTR fuel elements, although employing theactivity ratio technique, which enables calculation of the averageburnup using measurements of quotients between activities of95Zr/137Cs and 134Cs/137Cs (Iqbal et al., 2001) or 134Cs/137Cs alone(Ansari et al., 2007), based on the fact that buildups of 95Zr, 137Csand 134Cs during irradiation are, respectively, directly proportional
surements of 150 s of live time, performed with 175 days of cooling time and followingws is 2.5 cm.

Table 4Average burnup values obtained by means of gamma-ray spectroscopy measurements compared against corresponding ones furnished by reactor physics calculations.
Spent fuelelement
Irradiationhistory (days)
Storage date(d/month/yr)
Measuring date(d/month/yr)
Average burnup Ratio of burnup values(measured/calculated)
Gamma-ray spectroscopy (%) Reactor physics calculations (%)
NN 001 316 15/03/2006 16/11/2006 46.83 � 3.69 49.52 0.929 � 0.02409/03/2007
45.95 � 2.5614/03/200721/06/2007 46.85 � 2.5909/08/2007 46.19 � 2.5622/11/2007 44.70 � 2.48Mean value 46.00 � 1.20
NN 002 275 12/06/2003 15/11/2006 42.84 � 3.38 47.32 0.907 � 0.02516/03/2007 42.14 � 3.3221/06/2007 44.01 � 2.4410/08/2007 43.84 � 2.4328/11/2007 41.60 � 2.31Mean value 42.94 � 1.19
NN 003 275 12/06/2003 09/11/2006 44.29 � 3.49 47.63 0.912 � 0.03217/03/2007 42.89 � 3.3805/07/2007 43.71 � 2.4217/08/2007 42.60 � 3.34Mean value 43.42 � 1.52
NN 004 275 12/06/2003 28/10/2006 48.20 � 3.80 49.70 0.959 � 0.03109/03/2007 47.15 � 3.7205/07/2007 48.31 � 2.6823/08/2007 47.05 � 2.61Mean value 47.66 � 1.53
NN 008 317a 23/08/2007 07/12/2007 44.61 � 3.50 45.34 0.993 � 0.03214/02/2008 45.30 � 2.5224/04/2008 44.57 � 2.4816/07/2008 45.69 � 3.58Mean value 45.00 � 1.45
NN 009 320 13/07/2006 13/03/2008 46.35 � 2.57 47.04 0.998 � 0.03230/05/2008 48.42 � 3.8005/02/2009 47.28 � 2.6416/04/2009 46.28 � 3.65Mean value 46.97 � 1.51
NN 015 333 23/08/2007 16/12/2009 40.91 � 2.27 45.95 0.920 � 0.03008/02/2010 43.20 � 2.4016/03/2010 42.80 � 2.38Mean value 42.26 � 1.36
NC 003b 327 16/03/2007 11/04/2008 42.67 � 2.37 45.34 0.926 � 0.03317/07/2008 42.20 � 2.3503/12/2008 40.27 � 3.18Mean value 41.97 � 1.48
NC 005b 316 15/03/2006 05/12/2007 46.36 � 2.58 50.93 0.918 � 0.02606/03/2008 47.21 � 2.6229/05/2008 46.00 � 3.6204/02/2009 46.15 � 3.6717/04/2009 47.50 � 2.64Mean value 46.77 � 1.30
a Remained outside the reactor core between 16/11/2001 and 04/09/2002.b Control fuel elements.
M.V. Mora et al. / Progress in Nuclear Energy 53 (2011) 344e353352
to the neutron flux, to the neutron fluence and to the square of theneutron fluence (Iqbal et al., 2001). According to these experiments,the mean deviation betweenmeasured and calculated values of theaverage burnup for 5 spent fuel elements is 5.9% (Iqbal et al., 2001;Ansari et al., 2007).
5. Conclusion
Nondestructive gamma-ray spectroscopy was employed inorder to measure the absolute average burnup of all spent MTR fuelelements irradiated in the RP-10 research reactor and currentlystored under water in the racks of the reactor storage pool. Theperformed measurements embrace 7 standard and 2 control MTRfuel elements.
Measurements were carried out at the reactor storage pool areausing 137Cs as the only burnupmonitor, even for spent fuel elementswith cooling times as short as 106 days. Extensive tests concerningthe reproducibility of measurements exhibited good results.
As a result of the measurements, values of the average burnupwere obtained with a mean relative experimental uncertainty of3.1%. Compared against corresponding ones furnished by reactorphysics calculations, a mean deviation of 6.0% arose, which iscompatible with results that have been obtained from other recentburnup measurements using nondestructive gamma-ray spec-troscopy on irradiated plate-type MTR fuel elements. Thisevidence indicates that it is not necessary to wait approximately 2years after the definitive withdrawal of a fuel element from thereactor core in order to perform average burnup measurementsbased on 137Cs.

M.V. Mora et al. / Progress in Nuclear Energy 53 (2011) 344e353 353
Successful accomplishment of all requisites necessary forabsolute gamma-ray spectroscopy measurements, as describedalong the present work, demonstrates that the gamma scanningsystem of IPEN/Peru is fully adequate to measure the averageburnup of spent MTR fuel elements and, consequently, can beemployed for this purpose in the RP-10 research reactor.
Acknowledgments
The authors would like to express their gratitude to RolandoWalter Arrieta Bernabe, chief of the RP-10 Operation Group, whoseparticipation was indispensable to achieve improvements in thedesign of the collimator tube. Special acknowledgment is owed tothe RP-10 operators for the help during the measurements. One ofthe authors (L.A.A. Terremoto) gratefully acknowledges supportfrom the International Atomic Energy Agency (IAEA) as TechnicalCooperation Expert.
References
Ansari, S.A., Asif, M., Rashid, T., Qasim, K.G., 2007. Ann. Nucl. Energy 34, 641e651.Bibichev, B.A., Majorov, V.P., Protasenko, Yu M., Fedotov, P.I., Sunchugashev, M.A.,
1979. The problem of determining fuel burnup from the 134Cs/137Cs activityratio. IAEA-SM-231/135. In: Nuclear Safeguards Technology 1978, vol. I. Inter-national Atomic Energy Agency, Vienna, pp. 387e394.
Compilation and Evaluation of Fission Yield Nuclear Data. IAEA-TECDOC-1168,2000. International Atomic Energy Agency, Vienna.
Debertin, K., Helmer, R.G., 1988. Gamma- and X-Ray Spectrometry with Semi-conductor Detectors. Elsevier Science Publishers B.V., Amsterdam.
Determination of Research Reactor Fuel Burnup. IAEA-TECDOC-633, 1992. Interna-tional Atomic Energy Agency, Vienna.
Helene, O.A.M., Vanin, V.R., 1981. Tratamento Estatístico de Dados em FísicaExperimental. Editora Edgard Blücher Ltda., São Paulo.
Henríquez, C., Navarro, G., Pereda, C., Steinman, G., 2001. Nucleotécnica 35, 71e83.Hubbell, J.H., Berger, M.J., 1968. Photon attenuation. In: Jaeger, R.G. (Ed.), Engi-
neering Compendium on Radiation Shielding. Shielding Fundamentals andMethods, vol. I. Springer-Verlag, Berlin, pp. 167e184.
Iqbal, M., Mehmood, T., Ayazuddin, S.K., Salahuddin, A., Pervez, S., 2001. Ann. Nucl.Energy 28, 1733e1744.
Kestelman, A.J., Guevara, S.R., 1988. Determinación del Quemado en Combus-tibles Tipo MTR Mediante Espectrometría Gamma con Cristal de INa(Tl).Informe CNEA 497. Comisión Nacional de Energía Atómica, San Carlosde Bariloche.
Knoll, G.F., 1989. Radiation Detection and Measurement, second ed. John Wiley &Sons, Inc., New York.
Matsson, I., Grapengiesser, B., 1997. Appl. Radiat. Isot. 48, 1289e1298.Padilla, A.G., 2008a. Cálculo con WIMSD4 para el RP-10 del Consumo y Quemado
del 235U y de la Relación Captura/Fisión (a). Informe Técnico Interno IPEN, Lima.Padilla, A.G., 2008b. Cálculo de Consumo y Quemado del 235U de los Elementos
Combustibles del RP-10. Informe Técnico Interno IPEN, Lima.Pereda, C., Henríquez, C., Medel, J., Klein, J., Navarro, G., 2004. Ciencia Abierta 24.
ISSN: 0717-8948, 9pp.Pereda, C., Henríquez, C., Klein, J., Medel, J., 2008. J. Phys. Conf. Ser.134 (012037), 6 pp.Perrotta, J.A., Terremoto, L.A.A., Zeituni, C.A., 1998. Ann. Nucl. Energy 25, 237e258.Phillips, J.R., 1991. Irradiated fuel measurements. NUREG/CR-5550, LA-UR-90-72,
Washington, DC. In: Reilly, D., Ensslin, N., Smith Jr., H., Kreiner, S. (Eds.), PassiveNondestructive Assay of Nuclear Materials, pp. 529e562.
Rasmussen, N.C., Sovka, J.A., Mayman, S.A., 1966. The Non-destructive Measurementof Burn-up by Gamma-ray Spectroscopy. IAEA-SM-67/45. In: Nuclear MaterialsManagement. International Atomic Energy Agency, Vienna, pp. 829e849.
Reus, U., Westmeier, W., 1983. At. Data Nucl. Data Tables 29, 193e406.Robinson, L., Hobbs, R.W., Dyer, F.F., Pugh, L.P., Snelgrove, J.L., Teasley Jr., N.A., 1988.
J. Radioanal. Nucl. Chem. Articles. 125, 317e331.Tasaka, K., Ihara, H., Akiyama, M., Yoshida, T., Matumoto, Z., Nakasima, R., 1983.
JNDC Nuclear Data Library of Fission Products. JAERI 1287. Japan Atomic EnergyResearch Institute, Tokai-mura, Naka-gun, Ibaraki-ken.
Terremoto, L.A.A., Zeituni, C.A., Perrotta, J.A., da Silva, J.E.R., 2000. Nucl. Instr. andMeth. A450, 495e514.
Wang, T.K., Hsu, D.C., Tseng, C.L., 1990. Appl. Radiat. Isot. 41, 41e47.Zeituni, C.A., Terremoto, L.A.A., da Silva, J.E.R., 2004. In: Proceedings of the PHYSOR
2004: The Physics of Fuel Cycles and Advanced Nuclear Systems e GlobalDevelopments. American Nuclear Society (ANS), Chicago, pp. 1169e1176.