progress in colloid and polymer science · volume 132 ·...
TRANSCRIPT


Progress in Colloid and Polymer Science · Volume 132 · 2006

Progress in Colloid and Polymer ScienceRecently Published and Forthcoming Volumes
Smart Colloidal MaterialsVolume Editor: Richtering, W.Vol. 133, 2006
Characterization of Polymer Surfaces and Thin FilmsVolume Editors: Grundke, K., Stamm, M., Adler, H.-J.Vol. 132, 2006
Analytical Ultracentrifugation VIIIVolume Editors: Wandrey, C., Cölfen, H.Vol. 131, 2006
Scattering Methods and the Propertiesof Polymer MaterialsVolume Editors: Stribeck, N., Smarsly, B.Vol. 130, 2005
Mesophases, Polymers, and ParticlesVolume Editors: Lagaly, G., Richtering, W.Vol. 129, 2004
Surface and Colloid ScienceVolume Editor: Galembeck, F.Vol. 128, 2004
Analytical Ultracentrifugation VIIVolume Editors: Lechner, M. D., Börger, L.Vol. 127, 2004
Trends in Colloid and Interface Science XVIIVolume Editors: Cabuil, V., Levitz, P., Treiner, C.Vol. 126, 2004
From Colloids to NanotechnologyVolume Editors: Zrinyi, M., Hórvölgyi, Z. D.Vol. 125, 2004
Aqueous Polymer DispersionsVolume Editor: Tauer, K.Vol. 124, 2004
Trends in Colloid and Interface Science XVIVolume Editors: Miguel, M., Burrows, H. D.Vol. 123, 2004
Aqueous Polymer – Cosolute SystemsVolume Editor: Anghel, D. F.Vol. 122, 2002
Molecular Organisation on InterfacesVolume Editor: Lagaly, G.Vol. 121, 2002
Lipid and Polymer-Lipid SystemsVolume Editor: Nylander, T.Vol. 120, 2002

Progress in Colloid and Polymer Science
Editors: F. Kremer, Leipzig and W. Richtering, Aachen
Volume 132 · 2006
Characterizationof Polymer Surfacesand Thin Films
Volume Editors:Karina GrundkeManfred StammHans-Jürgen Adler
123

IV
The series Progress in Colloid and Polymer Science is also available electronically (ISSN 1437-8027)
– Access to tables of contents and abstracts is free for everybody.– Scientists affiliated with departments/institutes subscribing to Progress in Colloid and Polymer Science
as a whole also have full access to all papers in PDF form. Point your librarian to the Springerlink access registration format http://www.springerlink.com
ISSN 0340-255XISBN-10 3-540-31241-2ISBN-13 978-3-540-31241-3DOI 10.1007/b104970Springer Berlin, Heidelberg, New York
This work is subject to copyright. All rights arereserved, whether the whole or part of the materialis concerned, specifically the rights of translation,reprinting, reuse of illustrations, recitation, broad-casting, reproduction on microfilm or in any otherway, and storage in data banks. Duplication ofthis publication or parts thereof is permitted onlyunder the provisions of the German CopyrightLaw of September 9, 1965, in its current version,and permission for use must always be obtainedfrom Springer. Violations are liable for prosecu-tion under the German Copyright Law.
The use of registered names, trademarks, etc. inthis publication does not imply, even in the absenceof a specific statement, that such names are exemptfrom the relevant protective laws and regulationsand therefore free for general use.
Springer is a part of Springer Science +Business Media
http://www.springer.com
© Springer-Verlag Berlin Heidelberg 2006Printed in Germany
Cover design: eStudio Calamar S. L.,F. Steinen-Broo, Pau/Girona, Spain
Typesetting and production: LE-TEXJelonek, Schmidt & Vöckler GbR, Leipzig
Printed on acid-free paper

Progr Colloid Polym Sci (2006) 132: V© Springer-Verlag 2006 PREFACE
Dresden Polymer Discussions have been organized by the Leibniz Institute of Polymer Research Dresden and the Institute ofMacromolecular and Textile Chemistry of the Technische Universität Dresden now since 1986. Every two years, interestedscientists, researchers and students from polymer research centres, universities and industry from all over the world discusslatest results, trends and new demands on research and development in different fields of polymer science.
Following this tradition the 10th Dresden Polymer Discussion took place in the charming environment of the old town ofMeißen near the Saxonian capital Dresden, from April 10 to 13, 2005. The meeting was dedicated to the topic “Characterizationof Polymer Surfaces and Thin Films”. Surface and thin film properties of polymer materials can be related to micro structureand molecular origin, which remains a central problem in physics, chemistry, biology and materials science. It forms the basisfor technological control and improvement of existing as well as the design of new and innovative materials. To achieve thisaim comprehensive characterization of surfaces and interfaces with a wide spectrum of analytical techniques is necessary.
The contributions of this volume were presented at the meeting and selected for publication in “Progress in Colloid andPolymer Science” covering a representative spectrum of surface sensitive techniques and their application to polymer surfaceand thin film characterization as well as recent examples of technologically relevant materials and process development.
February 2006 Karina GrundkeManfred Stamm
Hans-Jürgen Adler

Progr Colloid Polym Sci (2006) 132: VI–VII© Springer-Verlag 2006 C O N T E N T S
Kazarian SG, Chan KLA: Sampling Approachesin Fourier Transform Infrared Imaging Applied to Polymers . . . . . . . . . . . . . . . 1
Salzer R, Zimmerer C, Kitsche M,Steiner G, Braun H-G:
Molecular Imaging of Microstructured Polymer Surfaces . . . . . . . . . . . . . . . . . 7
Busche S, Kasper M, Mutschler T,Leopold N, Gauglitz G:
Interaction Behaviour of the Ultramicroporous Polymer Makrolon®
by Optical Spectroscopic Methods . . . . . . . . . . . . . . . . . . . . . . . . . . . . . . . . . . . . . . 16
Müller-Buschbaum P: High-resolution Grazing Incidence Small Angle X-ray Scattering:Investigation of Micrometer Sized Structured Polymer Films . . . . . . . . . . . . . . 23
Serghei A, Kremer F: Unexpected Preparative Effects on the Properties of Thin Polymer Films . . . 33
Osterhold M: Characterizing Physical Properties of Coating Surfaces –Mar Resistance and Surface Structure . . . . . . . . . . . . . . . . . . . . . . . . . . . . . . . . . . . 41
Albrecht V, Janke A, Drechsler A,Schubert G, Németh E, Simon F:
Visualization of Charge Domains on Polymer Surfaces . . . . . . . . . . . . . . . . . . . 48
Temmel S, Kern W, Luxbacher T: Zeta Potential of Photochemically Modified Polymer Surfaces . . . . . . . . . . . . . 54
Friedrich J, Kühn G, Mix R,Hoffmann K, Resch-Genger U:
Tailoring of Polymer Surfaces with Monotype Functional Groupsof Variable Density Using Chemical and Plasma Chemical Processes . . . . . . . 62
Synytska A, Ionov L, Dutschk V,Minko S, Eichhorn K-J, Stamm M,
Grundke K:
Regular Patterned Surfaces from Core-Shell Particles.Preparation and Characterization . . . . . . . . . . . . . . . . . . . . . . . . . . . . . . . . . . . . . . . 72
Drechsler A, Petong N, Bellmann C,Busch P, Stamm M, Grundke K,
Wunnicke O, Reichelt J:
The Effect of Adsorbed Cationic Surfactant on the Pattern Collapseof Photoresist Lines in Photolithographic Processes . . . . . . . . . . . . . . . . . . . . . . 82
Ermakova TB, Sergeeva IP,Anuchkina AD, Sobolev VD,
Churaev NV:
Electrokinetic Study of Layer-by-Layer Polyelectrolyteand Surfactant Adsorbed Layers . . . . . . . . . . . . . . . . . . . . . . . . . . . . . . . . . . . . . . . . 95
Schwarz S, Nagel J, Janke A,Jaeger W, Bratskaya S:
Adsorption of Polyelectrolytes with Hydrophobic Parts . . . . . . . . . . . . . . . . . . . 102
Spange S, Wolf S, Simon F: Adsorption of Poly(vinyl formamide-co-vinyl amine) (PVFA-co-PVAm)onto Metal Surfaces . . . . . . . . . . . . . . . . . . . . . . . . . . . . . . . . . . . . . . . . . . . . . . . . . . . 110
Elsner N, Dubreuil F, Weinkamer R,Wasicek M, Fischer FD, Fery A:
Mechanical Properties of Freestanding Polyelectrolyte Capsules:a Quantitative Approach Based on Shell Theory . . . . . . . . . . . . . . . . . . . . . . . . . 117
Dedinaite A, Joseph I,Gorochovceva N, Makuska R,
Claesson PM:
Interfacial Properties of Chitosan-PEO Graft Oligomers:Surface Competition with Unmodified Chitosan Oligomers . . . . . . . . . . . . . . . 124

VII
Walawska N, Rybicki E, Filipowska B: Physicochemical Changes on Wool Surfaceafter an Enzymatic Treatment . . . . . . . . . . . . . . . . . . . . . . . . . . . . . . . . . . . . . . . . . . 131
Roosjen A, Norde W, van der Mei HC,Busscher HJ:
The Use of Positively Charged or Low Surface Free Energy Coatingsversus Polymer Brushes in Controlling Biofilm Formation . . . . . . . . . . . . . . . . 138
Pareek P, Adler H-JP, Kuckling D: Tuning the Swelling Behaviorof Chemisorbed Thin PNIPAAm Hydrogel Layersby N,N-Dimethyl Acrylamide Content . . . . . . . . . . . . . . . . . . . . . . . . . . . . . . . . . . 145
Guérin G, Raez J, Wang X-S,Manners I, Winnik MA:
Polyferrocenylsilane Block Copolymers:Nanotubes and Nanowires through Self-Assembly . . . . . . . . . . . . . . . . . . . . . . . 152
Bocharova V, Gorodyska G, Kiriy A,Stamm M, Simon P, Mönch I,
Elefant D, Lou X, Stoffelbach F,Detrembleur C, Jérôme R:
Synthesis and Deposition of Water-Dispersed Prussian Blue Nanocrystalson Polymers and CNTs . . . . . . . . . . . . . . . . . . . . . . . . . . . . . . . . . . . . . . . . . . . . . . . . 161
Author/Title Index . . . . . . . . . . . . . . . . . . . . . . . . . . . . . . . . . . . . . . . . . . . . . . . . . . . . 168
Keyword Index . . . . . . . . . . . . . . . . . . . . . . . . . . . . . . . . . . . . . . . . . . . . . . . . . . . . . . . 170


Progr Colloid Polym Sci (2006) 132: 1–6DOI 10.1007/2882_034© Springer-Verlag Berlin Heidelberg 2006Published online: 10 March 2006
Sergei G. KazarianK. L. Andrew Chan Sampling Approaches
in Fourier Transform Infrared ImagingApplied to Polymers
Sergei G. Kazarian () ·K. L. Andrew ChanDepartment of Chemical Engineering,Imperial College London, SW7 2AZ, UKe-mail: [email protected]
Abstract FTIR imaging is a pow-erful tool that combines enhancedvisualisation with chemical infor-mation. However, prior to applyingthis method to polymer systems oneneeds to appreciate the advantagesand limitations of a particular imag-ing mode, i.e. its spatial resolutionand field of view. Therefore, thereis a need to discuss the differencesbetween the two main FTIR imaging
modes: transmission and AttenuatedTotal Reflection (ATR) and to reviewrecent developments in macro FTIRimaging that include innovativeintroduction of a diamond ATRaccessory for imaging applications.
Keywords Focal Plane Array ·FTIR · Imaging · Infraredspectroscopy · Polymer blends
Introduction
Combining microscopy with chemical recognition repre-sents a powerful approach to study heterogeneous poly-meric materials. This combination has been enhanced fur-ther as a chemical imaging method using FTIR spec-troscopy with an array rather than a single element detec-tor [1–13]. Focal plane array detectors had been originallydeveloped for applications in military technology (as a partof the smart missiles guidance systems) and astronomy(as a detection device for the imaging of galaxies). Fortu-nately, these array detectors (such as 64×64 or 128×128elements arrays) are now available for materials research.These arrays allow one to simultaneously measure thou-sands of FTIR spectra from different locations in a sample.These FTIR spectra then provide information about theconcentration of specific compound and their distributionin the sample within the measured field of view. Therefore,FTIR imaging can be thought of as a chemical photogra-phy [14]. FTIR imaging does not require the use of anydyes or labelling techniques and provides fast and reli-able 2D imaging for enhanced visualisation of biological,pharmaceutical and polymeric materials. Nevertheless, theapplicability of this method, when applied in transmission(which is still the most common approach in FTIR mi-
croscopy and imaging [15–17]) is restricted by the diffrac-tion limit of light in air and by the necessity to microtomesamples for transmission measurements. We have recentlydemonstrated that that micro-ATR imaging objective withgermanium crystal allowed us to achieve spatial resolutionthe order of 3–4 µm which was below the diffraction limitof infrared light in air [18]. Importantly, this enhanced spa-tial resolution was achieved without the use of expensivesynchrotron source which provided, for example, clear im-ages of the medulla of the hair [19] and detected hetero-geneity of the distribution of cholesterol esters in aorticplaques [20]. ATR imaging mode requires minimal sam-ple preparation which is important for many biomedicalsamples and polymeric materials.
Our group was the first to report imaging with a di-amond ATR accessory that provided a field of view ofca. 1 mm2 and the spatial resolution of ca. 15 µm withoutthe use of an infrared microscope [18]. The demonstra-tion of the applicability of a diamond ATR accessory forFTIR imaging opened up a range of new opportunities inpolymer research, from compaction of tablets [21–23] tostudying phase separation in polymer blends subjected tosupercritical fluids [24]. This imaging approach was suc-cessfully utilised for the study of dissolution of tablets inaqueous solutions [25]. We have also demonstrated macro

2 S.G. Kazarian · K.L.A. Chan
ATR imaging using an inverted pyramid ATR crystal madeof ZnSe applied to drug release from polymer/drug for-mulations [14, 25]. The range of applications of the macroATR imaging approach to polymeric materials is signifi-cant, and therefore, this paper introduces some technicalaspects of the approach and compares this method to imag-ing in transmission. This should help polymer scientist tochoose an approach that would be the most suitable forstudying a particular system using FTIR imaging.
Experimental Sections
FTIR Measurements
Similar to conventional FTIR measurements, FTIR imag-ing with FPA detector can be operated in transmission orATR mode.
Transmission Imaging. In transmission mode, the infraredlight goes through the sample and the absorbance is meas-ured by the detector. The transmission method usuallyyields spectra with a high signal to noise ratio (SNR) be-cause the detector receives high infrared light intensity.However, sample thickness is important for this type ofmeasurement. In order to avoid the infrared energy beingtotally absorbed, the sample needs to be sectioned to pro-duce a thin film. A sample of uniform thickness is alsonecessary for accurate quantitative analysis. When imag-ing a heterogeneous sample by the transmission method,the domain size of the component of interest also needsto be considered when choosing the sample thickness. Thethickness should be similar to or smaller than the domainsize in order to produce meaningful results. Otherwise,the spatial resolution will be degraded by variation in the“Z-axis” (the axis that measures thickness of the sample).If the domain size of a sample is less than the samplethickness (see Fig. 1), any overlapping of domains in the
Fig. 2 Transmission FTIR images showing the distribution of LDPE in the films with the thickness of A 3 µm and B 20 µm
Fig. 1 A schematic diagram showing the possible resultant imageof the same sample with different chosen thickness
Z-axis will produce a misleading image of the componen-t’s distribution in the sample. Therefore the thickness ofthe sample is not only important for preventing total ab-sorption of infrared energy but also for the accuracy of theresult.
To demonstrate this, a sample blend of polystyrene(PS) – low density polyethylene (LDPE) were microtomedcryogenically into films of 3 µm and 20 µm of uniformthickness. FTIR images of these films were measured intransmission under the infrared microscope (IRScope II,Bruker Optics) with an ×15 objective. The images of thedistribution of LDPE are shown in Fig. 2. The images weregenerated by plotting the integrated values of the LDPEabsorption band at 1466 cm−1 over the whole images area.The image of the sample with 3 µm thickness has shownclear and well defined domains of LDPE while the image

Sampling Approaches in Fourier Transform Infrared Imaging Applied to Polymers 3
of the sample with 20 µm has shown a more crowdeddistribution due to superposition of LDPE domain in theZ-axis of the sample.
Spatial Resolution in FTIR Imaging
A microscope, specially designed for FT-IR measure-ments, is needed to measure infrared spectra of smallsamples or to capture infrared images with higher spatialresolution. High spatial resolution of imaging methods isvery important to reveal the true distribution of differentcomponents in heterogeneous materials. The general per-ception is that the spatial resolution achieved with FT-IRimaging is poor (tens of micrometers) due to the rela-tively long wavelength of infrared radiation. Despite ofthis, many researches publications reported the spatialresolution of FTIR imaging of ca. 4–8 µm which is ob-tained by dividing the number of detector pixels by thewidth of the image. Consider a light ray focused on a smallspot by a lens, diffraction can be observed when the spotsize is smaller or equal to the wavelength of the light.A schematic diagram of a typical diffraction pattern isshown in Fig. 3. The area of the diffraction pattern spot iscalled the Airy Disc.
Most of the intensity of the signal from the spot fallsin the region between −r and r. Consider now there aretwo spots that are adjacent to each other. If the two spotsare separated by a distance less than the radius r, the inten-sity of the light from the two spots is heavily overlappedand hence it is very difficult to distinguish from one pointto the other. The two spots can not be resolved and appearas one bigger point. When the two spots are separated bya distance approximately equal to the radius r, the intensi-ties of the light are partly overlapped and the two spots canjust about be distinguished. When the two spots are sepa-rated by a distance more or equal to the diameter of the airydisc, the two spots are well separated and the two pointsare considered as resolved. The diagram shown in Fig. 4illustrates these three situations.
Fig. 3 Schematic diagram of the diffraction pattern of light
Fig. 4 Airy discs of two adjacent features with different separa-tions. Fringes of the Airy Disc are not shown
The radius, r, of the Airy Disc is given by the Rayleighcriterion equation which is shown in Eq. 1.
r = 1.22λ(2NA)−1 (1)
NA is defined as
NA = n sin θ (2)
where n is the refractive index of the imaging mediumbetween the objective and the sample λ is the wavelengthof light and θ is half the angular aperture.
It is clear that the spatial resolution (the separation be-tween the two points required for them to be resolved, i.e.2r) is not merely dividing the number of detector pixelsby the width of the image. The spatial resolution in trans-mission FTIR imaging should be in the order of 10–30 µmdepending on the wavelength of the absorption band used.
ATR Imaging. ATR imaging with visible light can be ob-served most easily when a glass of water is held by one’shand, the skin or finger print that made contact with theglass could be observed through the water surface whilethe rest of the light is totally internally reflected. The areawhere the surface of glass has made contact with the skinwould destroy the total reflection and formed an imageof the finger print. An ATR image of a finger print wasfirst demonstrated by Harrick [26]. He obtained the ATRimage by illuminating a prism with a finger pressed on thelarge surface and then he focused the light that is internallyreflected off the prism onto a photofilm. ATR-FT-IR spec-troscopic imaging applied the same principle described byHarrick. Total internal reflection occurs when an electro-magnetic wave (infrared is used in this application) travelsfrom a higher refractive index material (the ATR crystal) toa lower refractive index material (the sample) at an angle

4 S.G. Kazarian · K.L.A. Chan
Fig. 5 Schematic diagram of an evanescent wave in the sample
greater than the critical angle. At the interface where theradiation is totally internally reflected, the radiation pene-trates into the second medium of lower refractive index asan evanescent wave (Fig. 5). This wave decays exponen-tially with the depth of penetration, dp, given by Eq. 3.
dp = λ[2n1π(sin2 θ −n2
2n−21 )0.5
]−1(3)
θ is the incident angle, n1 and n2 are the refractive in-dices of the ATR crystal and the sample respectively andλ is the wavelength of the incident light. If the secondmedium absorbs this radiation, the evanescent wave causesan attenuation effect on the incident wave. Hence by de-tecting the attenuated radiation, an infrared spectrum canbe obtained.
Microscopic ATR Imaging
For micro-ATR measurements, the microscope operates inreflective mode. A specially designed objective is used toperform micro ATR spectroscopy. An ATR crystal (ger-manium is used in this system) is attached to the end ofthe objective which can be moved up or down. When theobjective is in visible mode (Fig. 6, left), it operates asa visible microscope objective which allows the samplingarea to be located with white light before an ATR measure-ment is taken. In measuring mode, the crystal is loweredto make contact with the sample as shown in Fig. 6 (right).The sampling surface of the ATR crystal is slightly convexto ensure good contact can be made between the sampleand the crystal. There are different levels of contact pres-sure which can be chosen to optimise the contact betweenthe sample and the crystal.
Since ATR image involved the sample being measuredin contact with an ATR crystal of high refractive index, n,the spatial resolution is improved according to Eq. 1 and2 [18]. When germanium is used as the ATR crystal, whichhas a refractive index of 4, the spatial resolution achievedcan be improved up to four times when compared to trans-mission using the same optical objective. The field of viewin micro ATR imaging is ca. 50×50 µm2.
To demonstrate the difference between the micro ATRand transmission imaging approach, the same PS/LDPEblend shown in Fig. 2 was measured using the micro ATRsystem. The resultant image showing the distribution of
Fig. 6 Schematic diagrams showing the ATR objective in reflectingvisible mode (left) and measuring mode (right). In the measuringmode, the Ge crystal is lowered to make contact with the sample.Different pressure can be applied onto the sample. (Drawings arenot to scale)
Fig. 7 ATR-FTIR image showing the distribution of LDPE in thePS/LDPE blend. The imaged area is 50×50 µm2
LDPE is presented in Fig. 7. The image shows a muchlower absorbance compared to the images in Fig. 2 be-cause the pathlength using this approach is much shorter(ca. 0.8 µm compared to 3 or 20 µm in the correspondingtransmission FTIR images). It is clear from the image inFig. 7 that the micro ATR imaging approach offers a highermagnification for the smaller imaged area. The size of theLDPE domains was found to be between 8–30 µm.
Diamond ATR Imaging
When a larger field of view is desired, FTIR images can beacquired without the use of a microscope. A macro cham-ber is employed which allows different type of spectro-scopic accessories to be used instead. FTIR imaging witha diamond ATR accessory (Golden Gate, Specac Ltd.) isa new innovative approach of FTIR imaging since the ac-cessory itself was not designed for imaging purpose. Theoptical pathlength inside the accessory is shown in Fig. 8.
The first image obtained using the diamond ATR ac-cessory was the surface of a finger because it was themost easily accessible sample with distinct features. Thechemical image shown in Fig. 9 is generated using theamide I band at 1640 cm−1. The fringes of the fingerare shown clearly with high contrast. The quality of thespectra obtained by this method is shown by the spec-trum extracted from an area indicated by the arrow (see

Sampling Approaches in Fourier Transform Infrared Imaging Applied to Polymers 5
Fig. 8 A schematic diagram of the diamond ATR accessory
Fig. 9 FT-IR image of a finger surface acquired using the diamondATR accessory. An extracted spectrum from the area indicated bythe arrow is shown on the right
Fig. 9). The region of the spectrum between 1900 cm−1
and 2500 cm−1 where diamond absorbs too strongly hasshown a higher noise level but no spectral artefact can beobserved. A higher number of co-additions can be appliedto improve the SNR in that region.
Conclusion
This paper summarises the advantages of FTIR imaging inATR mode compared to FTIR imaging in transmission andalso reviews two ATR imaging methods (micro and dia-mond ATR) with two different fields of view. ATR-FTIRimaging greatly broadens the range of materials amend-able for study, and in particular, this approach has tremen-dous potential in applications to polymeric materials. Inaddition, FTIR imaging in ATR mode is uniquely suitedfor the imaging of aqueous systems or systems in contactwith water due to the shallow penetration of the evanescentwave into the sample. The short pathlength (from a frac-tion to a few micrometers) results in obtaining images ofthin surface layers of the samples without the need to mi-crotome. It has been shown that imaging in transmissionmode could provide spurious images if the thickness ofthe sample exceeds the size of the domains in the sample.Macro ATR-FTIR imaging opens opportunities for chem-ical imaging of patterned polymeric materials, colloid sys-tems, emulsions and materials for high-throughput analy-sis. Opportunities exist to apply FTIR imaging in ATRand transmission modes under a controlled environment(relative humidity, vapour of organic solvent) which wouldassist the studies of polymer durability and performanceunder such conditions [16, 27, 28]. There is a great po-tential for applications of ATR-FTIR imaging to studydynamic polymer systems: dissolution, swelling, sorption,crystallisation, polymerisation and other processes. Thismethod offers new opportunities to a polymer scientist andit is hoped that this article would facilitate novel applica-tions of this chemical imaging technology in polymer andcolloid science.
Acknowledgement We thank EPSRC and Pfizer for the provisionof a CASE studentship for K.L.A. Chan. We thank Specac Ltd andBruker Optics for advice.
References1. Kidder LH, Haka AS, Lewis EN
(2002) Instrumentation for FT-IRImaging. In: Chalmers JM,Griffiths PR (eds) Handbook ofVibrational Spectroscopy, vol 2.Chichester: Wiley, p 1386–1404
2. Kazarian SG, Higgins JS (2002)Chemistry & Industry Issue 10:21–23
3. Bhargava R, Wang S-Q, Koenig JL(2003) Adv Polym Sci 163:137–191
4. Chalmers JM, Everall NJ,Schaeberle MD, Levin IW, Lewis EN,Kidder LH, Wilson J, Crocombe R(2002) Vib Spectrosc 30:43
5. Artyushkova K, Wall B, Koenig JL,Fulghum JE (2001) J Vac SciTechnol A 19:2791–2799
6. Koenig JL (1998) MicroscopicImaging of Polymers. ACS,Washington, DC
7. Koenig J (2002) Adv Mater14:457–460
8. Miller-Chou BA, Koenig JL (2002)Macromolecules 35:440–444
9. Miller-Chou BA, Koenig JL (2003)Macromolecules 36:4851–4861
10. Salzer R, Steiner G, Mantsch HH,Mansfield J, Lewis EN. Fresenius(2000) J Anal Chem 366:712–726
11. Snively CM, Koenig JL (1999) JPolym Sci Polym Phys 37:2353
12. Snively CM, Koenig JL (1999) JPolym Sci B: Polym Phys37:2261–2268
13. Sommer AJ, Tisinger LG, Marcott C,Story GM (2001) Appl Spectrosc55:252–256
14. Kazarian SG, Chan KLA (2003)Macromolecules 36:9866–9872
15. Gupper A, Wilhelm P, Schmied M,Kazarian SG, Chan KLA, Reussner J(2002) Appl Spectrosc 56:1515–1523
16. Gupper A, Chan KLA, Kazarian SG(2004) Macromolecules 37:6498–6503

6 S.G. Kazarian · K.L.A. Chan
17. Gupper A, Kazarian SG (2005)Macromolecules 38:2327–2332
18. Chan KLA, Kazarian SG (2003) ApplSpectrosc 57:381–389
19. Chan KLA, Kazarian SG, Mavraki A,Williams DR (2005) Appl Spectrosc59:149–155
20. Colley CS, Kazarian SG,Weinberg PD, Lever MJ (2004)Biopolymers 74:328–335
21. Chan KLA, Hammond SV,Kazarian SG (2003) Anal Chem75:2140–2147
22. Van der Weerd J, Chan KLA,Kazarian SG (2004) VibSpectrosc35:9–13
23. Van der Weerd J, Kazarian SG (2004)Appl Spectrosc 58:1413–1419
24. Kazarian SG, Chan KLA (2004)Macromolecules 37:579–584
25. Van der Weerd J, Kazarian SG (2004)J Contr Rel 98:295–305
26. Harrick NJ (1987) Internal ReflectionSpectroscopy, Harrick ScientificCorporation, p 327
27. Chan KLA, Kazarian SG (2005) JComb Chem 7:185–189
28. Chan KLA, Kazarian SG (2004)Vibrational Spectroscopy 35:45–49

Progr Colloid Polym Sci (2006) 132: 7–15DOI 10.1007/2882_040© Springer-Verlag Berlin Heidelberg 2006Published online: 8 March 2006
Reiner SalzerCordelia ZimmererMarco KitscheGerald SteinerHans-Georg Braun
Molecular Imagingof Microstructured Polymer Surfaces
Reiner Salzer () · Cordelia Zimmerer ·Marco Kitsche · Gerald SteinerInstitute of Analytical Chemistry, DresdenUniversity of Technology, 01062 Dresden,Germanye-mail: [email protected]
Hans-Georg BraunLeibniz Institute of Polymer ResearchDresden, Hohe Str. 6, 01069 Dresden,Germany
Abstract Within last decade bothIR and Raman spectroscopy gainedthe potential of imaging the chemicalheterogeneity of material surfaces.IR spectroscopic imaging offers theadvantage of fast measurements withlateral resolution of a few microm-eters. Due to the high acquisitionrate of spectral data even dynamicsystems can be studied at a time reso-lution of seconds. This report willdemonstrate the unique opportunitiesby FTIR spectroscopic imaging toinvestigate material characterizedby small thickness of the samplelayer and non-crystalline state. SPRimaging is a new technique based onthe classical SPR that combines highsensitivity with excellent lateral reso-
lution. In the second part of this reportwe shall discuss the laterally resolvedinvestigations of polymer materialby a combination of FTIR imagingand SPR imaging. For the first time,pores in metal supported polymermembranes having a diameter offew micrometers could be generatedby using information obtained viathe new way of convoluting spectralimage data. The approach can betransferred to applications havinga domain size of few micrometers.
Keywords FTIR imaging ·SPR imaging ·Microstructured polymer ·Data fusion
Introduction
Fourier-Transform Infrared (FTIR) spectroscopy as well asRaman spectroscopy are well established as methods forstructural analysis of compounds in solution or when ad-sorbed to surfaces or in any other state. Analysis of thespectra provides information of qualitative as well as ofquantitative nature. Very recent developments, FTIR imag-ing spectroscopy as well as Raman mapping spectroscopy,provide important information leading to the developmentof novel materials. If applied under optical near-field con-ditions, these new technologies combine lateral resolutiondown to the size of nanoparticles with the high chemicalselectivity of a FTIR or Raman spectrum. These tech-niques now help us obtain information on molecular orderand molecular orientation and conformation [1].
Here we report on the analytical methods applied forthe optimization of the microstructuring process withinpolymer membranes on metal substrates. Two opticalimaging techniques have been employed, FTIR imag-ing and surface plasmon resonance (SPR) imaging. FTIRimaging preferentially probes chemical molecular proper-ties, SPR imaging mainly indicates physical bulk parame-ters at a much better lateral resolution. Finally we reportour first results on an emerging digital technique calleddata fusion, which is used to combine the complemen-tary information of two independent analytical techniques.Aim of the data fusion procedure described here is chem-ical information at improved lateral resolution.
In a previous study we demonstrated that natural ionchannels can be integrated into thin polymer membranesand channel gating can be measured using the patch-clamptechnique [2]. Ion channels were obtained from the elec-

8 R. Salzer et al.
trical organ of the ray torpedo marmorata [3]. In those ex-periments [2], thin polyester membranes with small poresof 10 to 20 µm in diameter were used as matrix for the ionchannels. Pores in the membrane were formed by ion beambombardment and subsequent widening of the ion tracksby etching steps. A lipid bilayer of soy bean lipoid S 75with cholesterol was stretched across the pores and, sub-sequently, ion channels were integrated by spreading anenriched lipid solution.
Patch-clamp measurements can well be performedunder stable laboratory conditions but neither under fieldconditions nor in a highly parallelized manner like ina sensor array. These restrictions can be overcome by anoptical detection scheme based on SPR. SPR permits labelfree optical detection, which is of great interest for proteinbiochips [4]. A recent development is SPR imaging, whichenables rapid analysis of sensor arrays in combination withvery high sensitivity [5]. The excitation of surface plas-mons requires a prism for coupling light into an ultra-thinmetal layer. The analyte to be measured is located adjacentto the metal layer, within the so-called evanescent fieldabove the surface. The extent of coupling between pho-tons and plasmons not only depends on the parameters ofincident light (e.g., angle of incidence and wavelength),but also on the optical properties of the analyte layer. Fora given optical arrangement and a given light source, theonset of resonance coupling causes a sharp minimum inthe spectrum of the reflected light. This SPR minimumis subject to wavelength shifts upon slightest changes ofoptical parameters within the analyte layer.
The intensity of the evanescent field above the ultra-thin metal layer decays by an exponential function. Forthis reason, reliable SPR imaging measurements of a sen-sor array require direct contact between the metal layerand the polymer scaffold containing the ion channels orany other sensing element. Bringing into contact the kindof porous polymer membranes described in the first para-graph and the metal layer does not provide the requireddirect contact due to the surface roughness of both items.The required sensitivity and durability of the metal – poly-mer compound can only be achieved by (i) formation ofthe polymer membrane directly on the metal surface and(ii) subsequent microstructuring of this membrane. Thegeneration of completely empty micropores in polymermembranes on metal substrates has not yet been describedin the literature.
Experimental
SF6 glass prisms were thoroughly cleaned, rinsed withorganic solvents, treated in a plasma cleaner and, subse-quently, heated in a vacuum chamber to a temperature ofapprox. 100 C. A 50 nm gold film was deposited. Duringdeposition the vacuum chamber was evacuated to 10−3 Pa.The thickness of the metal layer on the prism was con-
trolled in-situ during the evaporation process using a oscil-lating quartz gauge.
Poly(methyl)methacrylate (PMMA) was chosen aspolymer membrane. PMMA is a versatile polymer thatis well suited for many applications in microelectronics.PMMA is most commonly used as a high resolution photoresist for e-beam lithography as well as for UV and X-raymicrolithography [6]. Moreover, PMMA is known for itsgood biocompatibility, optical homogeneity and good ad-hesion on gold [7]. Thin membranes are obtained by spincoating of standard PMMA (molecular weight 950 000)dissolved in chlorobenzene. All PMMA membranes werebaked at 180 C for approx. 1 hour. Membrane thick-ness depends upon solid polymer concentration and spinspeed [8]. The thickness was measured by an optical re-flectometer (FTPadv, Sentech, Berlin Germany) equippedwith a microscope (IX 70 Olympus). Thickness and refrac-tive index were calculated by simulation of the spectrumaccording to the Fresnel formulas.
Microstructured patterns of PMMA on gold films weregenerated by electron beam lithography (LEO GeminiDSM 982, and electron beam lithographic system ELPHY,Zeiss Germany). The development process was carried outaccording to standard procedures. In a first step, the qualityof microstructure was probed by SEM.
SPR images were captured using a home-built in-strument [9]. A HeNe laser (Lasos GmbH, Jena, Ger-many) serves as monochromatic light source at a wave-length of 633 nm. A polarizer permits measurements bothwith s-polarized and p-polarized light, the latter is usedas reference. A 60 SF6 prism (nD = 1.8) is used asKretschmann ATR coupler. The reflected light is focusedby a glass lens and examined by means of a CCD ca-mera (KP-M1EK/Hitachi GmbH, Rodgau, Germany). TheCCD camera captures 756×581 pixels on an area of 10×10 mm.
Microstructured films were characterized by scan-ning electron microscopy (LEO GEMINI DSM 982/CarlZeiss NTS GmbH, Oberkochen, Germany) at low voltages(0.9–1 keV) in order to avoid sample charging.
The topology of the microstructure was investigated byatomic force microscopy (DualScope/DME, Herlev, Den-mark) in non-contacting mode. The scan speed of the can-tilever was set to 50 µm/s at a constant force of 0.16 nN.
The Bruker Hyperion FTIR imaging spectrometer(Fig. 1) is designed to operate both in step-scan andcontinuous-scan modes. The microscope houses botha conventional single element MCT detector and a fo-cal plane array (FPA) detector for imaging measurements.The sample area captured for one image is 270×270 µm2
under the microscope or 4 ×4 mm in the macro samplecompartment. The additional macro sample compartmentis a particular accessory of this instrument, it turned outto be indispensable for the investigation of larger sampleareas. Computer-controlled x;y-stages permit sequentialrecording of images, which can be pooled in the subse-

Molecular Imaging of Microstructured Polymer Surfaces 9
Fig. 1 FTIR Imaging Spectrometer Bruker IFS 66/S (left) equippedwith a Bruker Hyperion Microscope (mid) and a particular macrochamber for investigation of larger objects (right)
quent evaluation procedure in order to render larger sampleareas.
The currently used FPA has 64×64 detector elements,i.e. during one scan it probed the investigated sample areaby 4096 complete FTIR spectra. Elaborated chemometricmethods are needed to extract the molecular informationburied in the wealth of data. The usual procedure startswith filtering out bad spectra (e.g., ruptures in the biolog-ical sample of Fig. 2a), followed by data reduction andclassification routines. Non-supervised clustering methodsprovide sound results for the identification of slightestchemical differences across the investigated sample area.All spectra in the obtained data set are color-coded accord-ing to their cluster membership (Fig. 2b). Finally, all pixelsof the sample image will be color-coded according to thecluster-membership of their FTIR spectra (Fig. 2c).
Fig. 2 Generation of spectroscopic FTIR images. a Native sample,here a thin section of biological tissue. b FTIR spectra are collectedat every pixel of the native sample. “Bad” spectra, e.g. from areasoutside the sample, have already been removed. c “Good” spec-tra have been subject to a chemometric cluster analysis. Pixels arecolor-coded according to the cluster membership (spectral staining).Slightest chemical differences across the sample are now clearlyrevealed
Fig. 3 The measurement of FTIR images does not require muchsample preparation. Acquisition of spectra is very fast due to thehuge amount of elements in the detector array. By far most timeis spent for the evaluation of the molecular data. The figure givesa semi-quantitative impression of the size of the time slices
The basic difference between an common FTIR spec-trometer and a FTIR imaging spectrometer consists in thelayout of the detector. The FPA of the imaging spectrom-eter is made of the same material (MCT) as detectors ofcommon FTIR spectrometers, it only houses 4096 indi-vidual detector elements arranged in a 64×64 array. Thisresults in a 4096-fold increase in spectral data amount.Speed of data transfer and time needed for evaluation ofthousands of spectra are current the limiting factors tocapture and to evaluate FTIR images. A semi-quantitativedisplay of time fractions during measurement of FTIR im-ages is shown in Fig. 3.
Results and Discussion
Generation of Microporesin Metal Supported Polymer Membranes
Ion channels play an essential role in medical diagnosticsand drug development. Such applications require the inte-gration of ion channels together with a lipid bilayer intoan artificial microstructured polymer membrane (Fig. 4).The polymer membrane is attached to a metal coated opti-cal prism. The membrane contains micropores of approxi-mately one micrometer in diameter. Lipid bilayers arestretched across the pores. The bilayers host the receptormolecules. After activation of an ion channel, thousandsof ions stream into the cavity below the ion channel. Thechange of ion concentration can easily be detected by SPRmeasurements.
The properties of the polymer membrane must beadjusted to specific applications in order to: (i) consti-tute a matrix of polymer-free pores, (ii) form a reser-

10 R. Salzer et al.
Fig. 4 Ion channel biosensor. The ion channels and their surround-ing lipid bilayer are accommodated in a microstructured polymermembrane. Gating of the ion channel by an analyte results in an in-flux of ions into the pore. The concentration change is detected bysurface plasmons, which are excited by light in the underlying metallayer
voir for the ions that flow through the ion channel and(iii) ensure a stable linkage between the polymer mem-brane and the metal layer. The quality of the obtainedmicrostructures is usually assessed by scanning electronmicroscopy (SEM) or a similar microscopic technique.These microscopic techniques mainly provide images ofthe topology of the sample, they do not depict the dis-tribution of chemical features like domains within thelayer or like cross-linking of polymer chains. It is alsonot possible to assess, whether the micropores get com-pletely down to the gold surface. Any small residue ofPMMA remaining inside the pore will result in a dis-tinct loss in detector sensitivity due to reduced contrastwithin the SPR image, which in turn results in a failure tomonitor smaller changes in ion concentration within thepore.
Uniformity and thickness of the thin polymer mem-branes are crucial parameters for the performance of thesensor. Membranes of uniform thickness are expected tobe produced conveniently by spin coating. Microscopic in-terferometry in reflection mode is a relative simple andnon-destructive method to determine the exact thickness ofthin polymer membranes. The thickness of all membraneswas tested by a commercial reflectometer equipped witha standard microscope.
Micopores in gold-supported PMMA membranes weregenerated by electron beam lithography. The quality of themicropores was assessed by scanning electron microscopy(SEM). The SEM image in Fig. 5a gave rise to the im-pression of perfect pores, but the SPR image (Fig. 5b)shows only poor contrast. This PMMA layer was 0.8 µmthick. The poor contrast in the SPR image indicates imper-fect micropores of rather ill-defined shape and/or volume.Imperfections with respect to the volume are caused in par-ticular by polymer residues inside pores. Since the SPRsignal is mainly influenced by matter in regions of high in-tensity of the evanescent field – i.e. in regions closest tothe gold surface – polymer residues are expected to be lo-cated in the proximity of the gold layer. Only substance inthis region is able to evocate such a low contrast within theSPR image. This presumption is supported by AFM meas-urements (Fig. 5c). The AFM image indicates perfectlyshaped pores, as already seen in the SEM image. BothAFM and SEM images provide superior lateral resolutionbut do not provide any clue about the chemical nature ofthe investigated matter, in particular of the chemical natureor of the composition of the matter at the bottom of thepore. The AFM image does not provide means to decide,whether the bottom layer of the pore is made of remainingpolymer or whether it shows the bare gold substrate.
SEM, SPR, and AFM measurements rely of totally dif-ferent physical parameters of the sample. One particulardifference between SEM and AFM measurement on onehand and SPR measurement of the other hand is the obser-vation direction: SEM and AFM images are taken from topof the sample, whereas SPR images are measured from theback side of the polymer membrane. The penetration depthof the evanescent field (decay of the field intensity to 1/eof its size directly above the gold surface) is smaller thanthe thickness of the polymer membrane. In other words,SPR probes regions of the polymer membrane differentfrom regions probed by SEM or AFM.
Fig. 5 Evaluation of a microstructured PMMA membrane gen-erated by electron beam lithography. a The electron microscopicimage indicates a perfect array of micropores. The insert showsa magnified view on a single pore. b The SPR image of the PMMAmembrane reveals insufficient microstructuring. c The AFM imageindicates a perfect topology of the micropores. No conclusion aboutthe chemical nature of the bottom layer of the pore can be derivedfrom the AFM data

Molecular Imaging of Microstructured Polymer Surfaces 11
The presumption for gold-supported polymer mem-branes of remaining matter inside pores generated by elec-tron beam lithography can merely be verified by chemicalarguments. However, SPR imaging provides only physi-cal information. On the other hand, FTIR imaging spec-troscopy is capable of probing membranes on a molecularlevel but it can not achieve the high lateral resolution inthe high nanometer range as SPR imaging [10]. If samplespermit, FTIR imaging measurements may be performedat ATR (ATR – Attenuated Total Reflectance) conditions.According to the higher refractive index of the ATR crys-tall, FTIR-ATR imaging enables improved lateral reso-lution [11]. The ATR technique was not employed in thisstudy mainly due to the need to access the surface of theinvestigated sample and due to the profile of the evan-scent field across the PMMA membrane. The latter causesoverestimation of surface-near layers compared to lowerregions of the membrane. All measurement in the cur-rent report have been made by transmission FTIR imaging.A combination of both FTIR and SPR imaging should pro-vide a possibility to obtain as well as physical and chem-ical information of the sample at previously not achievablelateral resolution in the low micrometer range.
There are several reasons, why PMMA residues re-main at the pore bottom. One important consideration arebackscattered electrons, which may lead to enhanced crosslinking among polymer chains. Another issue are surfacereactions between gold and PMMA. Such reactions maybe initiated by the electron beam.
The infrared stretching vibration of the carbonyl group,ν(C = O), appears as a very strong band. This mode is wellsuitable for FTIR spectroscopy to detect PMMA down toa thickness of 2 nm [12], hence a FTIR image should beable to reveal the presence of polymer residues remain-ing within pores. The spectroscopic FTIR image shown inFig. 6a was taken from a microstructured PMMA mem-brane of similar size like shown in Fig. 5. The investigatedarea is 270 µm ×270 µm in size. The image consists of64 ×64 pixels, each pixel holds a complete FTIR spec-trum. All spectra were subject to a non-supervised clus-ter analysis. The cluster analysis resulted in 9 significantclusters. The membership of any of the individual FTIRspectra in Fig. 6a to one of the 9 clusters is indicated byshades of gray. Lighter shades represent clusters in regionsof lowest PMMA abundance (pore regions). Darker shadesrepresent clusters in regions of higher PMMA abundance(web regions). All spectra assigned to a particular clus-ter are very similar in number, location and size of theirvibrational bands. For this reason, every cluster can wellbe represented by its centroid spectrum, a kind of meanspectrum. The carbonyl stretching bands of the centroidspectra of the 9 clusters of Fig. 6a are shown in Fig. 6b.The strongest bands in Fig. 6b belong to clusters of thePMMA web with its bulk properties. Medium sized bandsbelong to the sloped pore walls. These clusters indicatethe transition from bulk material to the pores. Evidently,
Fig. 6 FTIR evaluation of a microstructured PMMA membrane(sample size 270× 270 µm2) generated by UV lithography. a TheFTIR image comprises 64× 64 pixels, i.e. 4096 individual FTIRspectra. All FTIR spectra have been subject to a cluster analysis.Cluster membership is indicated by gray-scale coding. b Average(centroid) spectra for the 9 clusters in the FTIR image in the car-bonyl spectral region. Spectra indicating higher absorbance belongto the clusters in the PMMA web. Less absorbing cluster are locatedwithin the pores. The absorbance never reaches zero. This clearlyindicates remaining PMMA even in the middle of the pores
none of the clusters exhibits spectra without a carbonylband. The lowest spectral trace reveals that the carbonylgroup still absorbs inside the pores. This clearly indicatesthe presence of PMMA residues at the bottom of the pore.
The carbonyl bands of the centroid spectra in Fig. 6bnot only reveal the presence of PMMA residues inside thepores of the microstructured polymer membrane. Closerinspection of the band location indicates a slight shiftof the band maxima. The maxima of the stronger bandsof the bulk regions appear at slightly lower frequenciesthan the maxima of the weaker bands (pore regions). Thisfrequency upshift of 5 cm−1 indicates differences in thechemical properties of carbonyl groups in bulk and inpore regions. Bands of clusters in pore regions appearat higher frequencies, indicating stronger carbonyl bondsfor the residues within the pore. High-energetic radiationused for microstructuring obviously enabled polar moi-eties like C = O groups to interact with the metal layerbeneath the polymer. It should be noted that common mi-croscopic techniques are neither able to reveal such smallamounts PMMA at the bottom of the pore nor do they pro-vide a chemical picture for the distribution of chemicalnon-equivalencies across the polymer membrane (Fig. 7).This knowledge is prerequisite for the optimization of themicrostructuring process. In order to achieve high detec-tion sensitivity for the sensor array, the remaining PMMAhas to be removed as completely as possible.
Subsequent plasma treatment, modified developmentprocesses or lower beam energy during lithography arepromising possibilities to produce pores totally free ofpolymer. Any progress can sensitively be indicated byFTIR spectroscopic imaging. The identification by FTIRimaging spectroscopy of the chemical reasons for the for-

12 R. Salzer et al.
Fig. 7 Sketch of chemical heterogeneity after microstructuring thePMMA membrane derived from C = O stretching bands. C = Ogroups within the bulk are depicted dark with a white hemlinewhereas C = O groups interacting with the metal substrate are whitewith a dark hemline
mation of PMMA residues at the bottom of the pores inthe polymer membrane provided the necessary basis forthe optimization of the microstructuring process. The sur-plus of energy during the microstructuring process avail-able for reactive groups to form strongly bound residuesis to a large extend provided by the electrons used for ir-radiation. This basic conclusion was verified by replacingthe gold film beneath the PMMA membrane by a sil-ver film. Gold has a much stronger backscattering effi-ciency for electrons than silver. The quantitative evaluationby FTIR imaging spectroscopy of the amount of PMMAresidue inside the pores revealed a distinct reduction forthe silver substrate compared to the gold substrate (Fig. 8).But even in case of silver substrates there are too manyelectrons available, and they initiate the formation of toomuch residue inside the pores. For this reason we re-
Fig. 8 Integrated absorbance of the C = O stretching band(1760–1680 cm−1) in micropore regions compared to bulk regionsof the PMMA membrane. The evaluation is based on the centroidspectra of the spectral clusters in the pore center and across the bulkregion
placed electron beam lithography by UV lithography. Thelower energy content of the UV photons results in the de-manded decrease in PMMA residue inside the pores. Thedecrease is so large that even gold can be used again. Goldhas the advantage of superior stability in sensor applica-tions.
The SPR image of an optimized PMMA membraneon gold substrate is shown in Fig. 9. It should be remem-bered that a SPR image reveals the backside of the polymermembrane. SEM and AFM images (top views) of this sam-ple exhibit a similar perfect impression like those in Fig. 5,they need not to be shown again. The sample in Fig. 9is superior to that of Fig. 5 both in terms of smaller poresize, of higher contrast between pore and bulk regions,and of pore shape. The latter is still rather ragged, furtherimprovement of the pore shape may be desirable. Nev-ertheless, pore diameters are now in the range of merelythree micrometers. This corresponds to roughly one tenthof the initial situation depicted in Fig. 5. Most of the poresin Fig. 9 exhibit a similar dark grade of contrast. More-over, the majority of pores shows a constant contrast acrossits cross-section. Both facts point to the absence of largeramounts of residues inside the pores, either evenly dis-tributed across the pore or fused together in grains at thebottom of the pore.
The comparison of the FTIR image in Fig. 6 andthe SPR image in Fig. 9 clearly reveals strengths andweaknesses due to underlying physical principles of thecorresponding methods. The FTIR image provides richchemical detail, but the lateral resolution of the spec-troscopic image controlled by the diffraction limit doesnot permit to identify the chemical background of theragged shape of the pores. On the other hand, SPR lackschemical specificity but provides physical informationfor a correspondingly large sample area at a correspond-ingly large resolution. The combination of the informationcontent of the two analytical techniques may providethe information needed for the generation in supportedpolymers of high-quality pores of diameters even below1 µm.
Fig. 9 SPR image of a PMMA membrane on gold after improve-ment of the microstructuring procedure

Molecular Imaging of Microstructured Polymer Surfaces 13
Data Fusion FTIR-SPR
The simultaneous use of multisource data can providea more reliable view on the observed object. In orderto exploit the information content, sophisticated color-related and numerical data fusion techniques have been de-veloped [13]. These techniques aim at the incorporation ofcomplementary information for the initially independentresults into a new combined data set in such a way thatan information surplus can be retrieved from the combineddata set. This information surplus remains inaccessible ifindividual data sets are evaluated separately.
Data fusion of spectroscopic images is a rather new ap-proach. Its terminology is not yet settled, which gives riseto some misunderstandings. A common misconception isrelated to the terms “image fusion” and “data fusion”.The general definition of “image fusion” refers to the con-ventional combination of two or more different imagesto form a new image by using a certain algorithm. Otherexpressions are sensor fusion [14], image merging [15],multisensor data fusion [16] and image integration [17].Image fusion is already well established in high-tech med-ical diagnosis like functional imaging [18]. Basically theterm “image fusion” describes the mere overlay of at leasttwo images, i.e. the combination of the contrast valuesof the initial images. On the other hand, “data fusion”refers to the convolution of information contained in thedata sets. In case of spectroscopic images this informa-tion content consists of a complete spectrum for everypixel in the image. Data fusion implies the use of ancil-lary (i.e. non-imaging) information other than remotelysensed images. The term “data fusion” (or “informationfusion”) refers to a different, higher level of image pro-cessing, where the images have already been transformedinto knowledge or information before being fused. Theparticular algorithms for data fusion have to be based onthe physical background of the measured information. Forthis reason, data fusion of FTIR and SPR results requiresthe development of a approach dedicated to the particularinformation content of the particular techniques. In the il-lustrated case (Fig. 10), the C = O str absorbance in theFTIR image was chosen to judge about the pore quality.The C = O str absorbance sensitively indicates the amountof PMMA at the particular pixel position. The two extremecases sketched in Fig. 10 are bulk and pore regions in thePMMA membrane. On the contrary, FTIR does not pro-vide clues about the presence of electrolyte inside the pore,i.e. whether the pore is completely filled by the adjacentliquid phase or not. Information about the filling status ofthe pore can easily be obtained from SPR data, whereasSPR is not able to differentiate between the polymer bulkand polymer pores perfectly filled by electrolyte. This ex-ample compares very well to the underlying principle ofthe meanwhile well established 2D techniques in chro-matography [19]. In case of 2D chromatography, Fig. 10would represent a plate with the axes “FTIR Imaging” and
Fig. 10 Access to hidden information by data fusion: contrast inthe SPR image depends on the refractive index; C = O str inten-sity in the FTIR image indicates the PMMA amount in the imagevoxel. FTIR differentiates very well between pore and bulk regionsbut not between pores w/o electrolyte. SPR differentiates very wellbetween pores w/o electrolyte but not between filled pore and bulkregions
“SPR Imaging” replaced by the description “eluent 1” and“eluent 2”. The sketched three spots on the plate wouldrepresent chromatographic fractions. The two fractions atthe bottom could not be separated by using merely elu-ent 1, the two fractions could not be separated by usingmerely eluent 2. The separation of all three fractions canonly be obtained by 2D chromatographic techniques butnot by two independent chromatographic runs even underidentical conditions to those of the 2D chromatographicexperiment. This example illustrates the potential of datafusion of two independent spectroscopic techniques. Datafusion may provide access to previously overlaid informa-tion.
The sketch in Fig. 10 is oversimplified in so far asit highlights only three boundary situations, bulk poly-mer on one hand and filled or empty pores on the otherhand. In terms of information content, every corner of thesquare in Fig. 10 represents different physical or chem-ical properties. An appropriate graphical representation ofa real application requires color coding. Every corner ofthe square, i.e. every property of the polymer investigated,has to be assigned a characteristic color. The interior areasof a square like that in Fig. 10 exhibit color mixing withevery tint representing a unique combination of the inves-tigated properties of the microstructured polymer.
The subsequent investigations are focused on the fillingstate of the micropores in the PMMA membrane, whereasthe preceding chapter referred to residues at the bottomof the micropores. Micropores have to be filled by elec-trolyte for their intended application as ion channel biosen-sor. The available imaging techniques revealed variationsamong the pore volumes after admission of electrolyte, but

14 R. Salzer et al.
none of these methods provided unequivocal clues whatcaused the variations. For this reason we employed thenew data fusion technique in order to combine the molecu-lar information obtained by FTIR imaging and the physicalinformation obtained by SPR imaging.
Figure 11 illustrates the necessary steps in order to ob-tain meaningful results by data fusion of FTIR and SPRimages. At first, the complete microstructured PMMAsample was measured by FTIR spectroscopic imaging. Thesample area of approx. 500 µm×500 µm required 4 FTIRimages to be taken (Fig. 11a). FTIR images were pooledand subsequently inspected for an initial quality test ofthe microstructuring process. After the quality check anSPR image was taken from the area to be investigated(Fig. 11b). Due to the different optical layouts of the in-struments, the rough images have to be corrected for dif-ferent observation angles and to remove possible overlaybetween the segments of the pooled FTIR images. Theimages in Figs. 11a and 11b already underwent the neces-sary correction steps, i.e. they are deskewed with respectto the exact location of the pixels. It is important to notethat only the location of the pixels got deskewed, whereasthe spectral data assigned to the pixels was not changedat all. The spectral data were then subject to data fusion.Depending upon the evaluation strategy and the amount ofspectral data utilized, the result of the data fusion can bemultidimensional like in every multivariate evaluation. InFig. 11c, the information content behind every pixel had tobe reduced to two dimensions in order to show it by gray-coded values. Details for some pores are given in Fig. 11d.
Fig. 11 Data fusion of FTIR and SPR images. a Pooled FTIR brightfield images of a microstructures polymer membrane. b SPR imageof a segment of the same polymer membrane. c Fused data of a andb. d Enlarged segment of c showing non-empty pores. The chemicalnature of the pore content can be deduced from the color coding ofthe fused data
The gray-scale has been inverted in Fig. 11d for clarity, i.e.pores completely filled with electrolyte are now dark. ThePMMA web clearly stands out in Fig. 11d. The pores in theupper row are well shaped, and they are completely filledby electrolyte. In contrast, the pores in the bottom row arewell shaped as well but hold inclusions. The distinct gray-shades of the inclusions point to different chemical natureof the inclusions. In the original fully-colored image theinclusions exhibit totally different colors, which permit theassignment of the inclusions in the bottom left pore to anair lock, whereas the inclusion in the pore to the right isa polymer residue. It should be emphasized that the size ofthis polymer inclusion is too small to be laterally resolvedin the FTIR image.
Conclusion
FTIR spectroscopic imaging provides new opportunitiesfor the investigation of material having small layer thick-ness, non-crystalline state and domain size of few microm-eters. Samples may even exhibit all three properties atonce, as it is the case for microstructured polymer mem-branes. This is a particular advantage of the new measuringapproach. Domain sizes may even be reduced to the up-per nanometer range if Raman spectroscopic mapping isemployed [20].
Microstructuring of the surface of a polymer membraneon solid support is commonly performed by various litho-graphic techniques. In previous applications is was notnecessary or it was not tested whether the microstructuredpores extend down to the neat support surface or whetherthe lower part of the pore remains filled with bulk poly-mer of with residues of the lithographic process. It couldbe shown by FTIR spectroscopic imaging for the first time,that residues remain inside the pores, which chemical ori-gin the residues have and how the microstructuring processcan be optimized towards completely empty pores, evenif the diameter of the pores does not exceed a couple ofmicrometers.
SPR imaging is a new and versatile technique for sen-sor applications. Combination of the physical informationprovided by SPR imaging with the chemical informationobtained by FTIR imaging by a process termed data fusionrevealed information content so far hidden. Fused data pro-vide insight into the chemical content of the mircrostruc-tured pores after their contact with an adjacent liquidphase. Information based on fused FTIR/SPR data pro-vides the necessary clue for further sensor applications ofmicrostructured polymer membranes on metal substrates.
References1. Salzer R, Steiner G, Kano A,
Richter T, Bergmann R, Rodig H,Johannsen B, Kobelke J (2003) SPIEProc 5047:362
2. Salzer R, Li J, Rautenberg C,Friedrich St (2001) Macromol Symp164:239
3. Schrattenholz A,Godovac-Zimmerman J, Schäfer HJ,Albuquerque EX, Maelicke A (1993)Eur J Biochem 216:671

Molecular Imaging of Microstructured Polymer Surfaces 15
4. Steiner G, Zimmerer C, Friedrich St,Salzer R, Braun HG (2003) Screening26:32
5. Steiner G (2004) Analyt BioanalytChem 379:328
6. Cerrina F (1997) In: Choudhury PR(ed) Handbook of Microlithography,Micromachining, and Microfabrica-tion. SPIE Press, p 253
7. Patnaik A, Li C (1998) J Appl Phys83:3049
8. Zimmerer C, Roy J, Braun HG,Kitsche M, Steiner G, Salzer R (2003)SPIE Proc 5047:403
9. Steiner G, Sablinskas V, Hübner A,Kuhne Ch, Salzer R (1999) J MolStruct 509:265
10. Salzer R, Steiner G, Mantsch HH,Mansfield J, Lewis NE (2000)Fresenius J Anal Chem 366:712
11. Chan KLA, Kazarian SG (2003) ApplSpectrosc 57:381
12. Balastre M, Berquier JM (1999)Langmuir 15:8691
13. Pohl C, van Genderen JL (1998) Int JRemote Sens 19:823
14. Phillips BE, Keys LD (1990) ImageProc Remote Sens 4:238
15. Carper WJ, Lillesand TM, Kiefer RW(1990) Photogramm Eng Remote Sens56:459
16. Blodgett CF, Franklin SE (1993)Comput Geosci 19:577
17. Ehlers M, Welch R (1998) Int JRemote Sens 9:873
18. Felix R, Lemke AJ, Niehues SM,Amthauer H, Rohlfing T (2004) RöFo176:1811
19. Link AJ, Eng J, Schieltz DM,Carmack E, Mize GJ, Morris DR,Garvik BM, Yates JR III (1999) NatBiotechnol 17:676
20. Krafft C, Knetschke T, Siegner A,Funk RHW, Salzer R (2003) VibSpectr 32:75

Progr Colloid Polym Sci (2005) 132: 16–22DOI 10.1007/2882_024© Springer-Verlag Berlin Heidelberg 2006Published online: 9 March 2006
S. BuscheM. KasperT. MutschlerN. LeopoldG. Gauglitz
Interaction Behaviourof the Ultramicroporous Polymer Makrolon®
by Spectroscopic Methods
S. Busche () · M. Kasper · T. Mutschler ·N. Leopold · G. GauglitzEberhard-Karls-University, Institute ofPhysical and Theoretical Chemistry,Auf der Morgenstelle 15, 72076 Tübingen,Germanye-mail:[email protected]
Abstract Makrolon®, a commer-cially available polycarbonate witha glassy ultramicroporous structure(mean pore-volume 0.1 nm3), wasoften employed as sensitive layer foroptical sensors in recent years. Due tothe definite pore volume-distribution,it can be used as a size-selectivesensitive layer. The interactionbehaviour of Makrolon of differentlayer-thicknesses under the influenceof methanol, ethanol and 1-propanolis characterized by Spectral El-lipsometry (SE), Surface PlasmonResonance Spectroscopy (SPR)
and Reflectometric InterferenceSpectroscopy (RIfS). Sorption intothe polymer layer follows a superpo-sition of Henry- and Langmuir-typebehaviour; this was discussed de-pending on the size of the respectiveanalyte. An adequate layer-thicknessfor the sensor methods RIfS and SPRis proposed.
Keywords ReflectometricInterference Spectroscopy ·Spectral Ellipsometry · SurfacePlasmon Resonance Spectroscopy ·Ultramicroporous Polymer
Introduction
A chemical sensor is a device that transforms chemicalinformation into an analytically useful signal. Chemicalsensors contain two basic functional units: a receptor partand a transducer part. The receptor part is usually a sen-sitive layer, therefore a well founded knowledge about themechanism of interaction of the analytes of interest and theselected sensitive layer has to be achieved. Various opticalmethods have been exploited in chemical sensors to trans-form the spectral information into useful signals whichcan be interpreted as chemical information about the ana-lytes [1]. These are either reflectometric or refractometricmethods. Optical sensors based on reflectometry are re-flectometric interference spectroscopy (RIfS) [2] and ellip-sometry [3, 4]. Evanescent field techniques, which are sen-sitive to changes in the refractive index, open a wide var-iety of optical detection principles [5] such as surface plas-mon resonance spectroscopy (SPR) [6–8], Mach-Zehnderinterferometer [9], Young interferometer [10], grating cou-pler [11] or resonant mirror [12] devices. All these optical
methods use sensitive layers; in case of chemosensors,polymers are established as receptors.
In recent years, optical sensory applications of the ul-tramicroporous polymer Makrolon as sensitive layer forthe discrimination of mixtures of different classes of com-pounds have been reported. The first implementation ofMakrolon in literature was the quantification of the ozone-depleting refrigerant R22 in the presence of its most im-portant substitute R134a using a RIfS-array [13]. The in-teraction characteristics of polymers taking advantage ofdifferent discrimination principles were determined. It wasnot necessary to reach the equilibrium between polymerand gaseous phase. Binary mixtures of the two refriger-ants were measured, and the sensor signals were evaluatedby artificial neural networks. Additionally, measurementswith a low cost set-up were conducted. This enables a fastand economical monitoring at recycling stations. By eval-uating different time-points of the sorption of the analytesinto the polymer, the different diffusion kinetics of the ana-lytes can be taken advantage of. Using artificial neural net-works, binary mixtures of methanol and ethanol could be

Interaction Behaviour of the Ultramicroporous Polymer Makrolon® by Optical Spectroscopic Methods 17
quantified with a single-sensor SPR set-up [14]. This con-cept was adapted for the quantification of binary mixturesof the above mentioned freones with a single-sensor SPRset-up. By using a thin sensitive layer (60 nm), the dura-tion of sorption and regeneration could be minimized [15].Numerous concentrations could be measured in a shorttime. Different approaches to the multivariate calibrationof the two refrigerants are reported in literature [16, 17].Single-sensor application of RIfS applying time-resolvedmeasurements could be adopted. Ternary mixtures of R22,R134a and R32 and R143a respectively were quantifiedeffectively [18]. Quantification of quaternary mixtures ofalcohols was performed by SPR as well as RIfS. Thedifferent kinetics for layers of different thicknesses wasutilized in a RIfS-array. Nevertheless, it was shown thatquantification of quaternary mixtures can be performed bysingle-sensor set-ups successfully for both methods [19].
In this study, for an accurate understanding of theinteraction behaviour of the ultramicroporous polymerMakrolon, as a receptor, under the influence of threealcohols is investigated by three transduction methods:Spectral ellipsometry (SE), RIfS and SPR.
These three methods are compared since each of themprovides complemantary information. SE offers the possi-bility to determine absolute values of the refractive indexn and physical layer thickness d by fitting a simulationto measured quantities for adequate layer systems. SPR ishighly sensitive towards changes in the refractive index.RIfS presents itself as a straightforward method for the de-termination of changes in the optical thickness (n ·d).
These three optical methods have different require-ments to the sensitive layer (optical transparency, homo-geneity, interference pattern for reflectometry, resonanceconditions for SPR etc.). Thus, the interaction behaviourof sensitive layers of different thicknesses and its effectson refractive index as well as on layer thickness under theinfluence of analytes must be known in order to build themost effective sensor device in respect to sensitivity, longterm stability, speed, cost-performance ratio etc.
The permeation of a gas through a porous polymer isgenerally described by equations based on the kinetic the-ory of gases. The sorption isotherm described by Eq. 1 isconcave to the pressure axis and is commonly observedfor a penetrant gas in a glassy polymer. It is composed ofHenry’s law and Langmuir-terms [20]:
C = CD +CH = kD p+ CHbp
1+bp(1)
where CD is the penetrant concentration dissolved by or-dinary dissolution (Henry’s law mode), kD is the Henry’slaw parameter and CH is the penetrant concentration de-scribed by the Langmuir equation. According to [21] theLangmuir adsorption occurs into the unrelaxed domains(ultramicropores) of the glassy polymer. The maximumpenetrant concentration (Langmuir capacity constant) isgiven by C′
H and b is the affinity constant.
Makrolon has a mean free pore-volume of 0.1 nm3 andthe width at half-height of the corresponding distributionis 0.04 nm3 [22]. The polymer layer reacts to the exposi-tion of the analyte molecules by swelling and by changesof the refractive index. Due to the pore-volume distribu-tion (see Fig. 1), the interaction kinetic depends on themolecule size [23]. The analytes used in this work aremethanol with a size smaller, ethanol with a size almostequal to and 1-propanol with a size bigger than the meanfree pore-volume.
At low analyte concentrations, the pores will be filledfirst, causing an increase of refractive index, since the an-alyte molecules with a refractive index nD = 1.329 formethanol, nD = 1.361 for ethanol and nD = 1.385 for1-propanol replace the air in the pores with a refractiveindex of 1 (all refractive indices are given for a wave-length of 589.3 nm corresponding to the D-line in thesodium spectrum and a temperature of 20 C). An increaseof layer thickness should also be observed, since the ana-lyte molecules interact with the pores and cause a swelling.After almost all pores are filled with analyte molecules,additional molecules will begin to sorb into the polymermatrix and cause a swelling of the polymer backbone [20].Thus, the swelling behaviour of the Makrolon correspondsto a superposition of Langmuir’s law describing the fillingof the pores and Henry’s law describing the sorption intothe polymer matrix. Different sized analytes will causedifferent swelling behaviours and thus different superposi-tions of both laws.
Fig. 1 Pore-volume distribution of the ultramicroporous poly-mer and the accessible volume for analytes in dependence of themolecule volume (a). Scheme of interaction between pores and dif-ferent sized molecules: for smaller analytes more pores are accessi-ble and the interaction between molecules and polymer backbone isweaker (b)

18 S. Busche et al.
At higher concentrations, when all available pores arefilled, a further swelling of the polymer layer should beobserved. The refractive index of Makrolon is nD = 1.586and because of the sorption of the analytes with a lower re-fractive index into the polymer matrix, it should decrease.By the observation of changes of the refractive index onthe one hand and the determination of changes of the layerthickness on the other hand, statements about the interac-tion behaviour will be made.
Another objective of this work is the interaction be-haviour of layers of different thicknesses under the influ-ence of the same analyte. Thus, Makrolon layers between35 nm and 455 nm were prepared and characterized underthe effect of the above named analytes with the considereddetection methods.
Methods and Material
Spectral Ellipsometry
In Spectral Ellipsometry, changes in the state of polarisa-tion of white light upon reflection at surfaces are moni-tored. This enables separation of the refractive index andphysical thickness by modelling of a layer system. To han-dle correlations between layer thickness and refractive in-dex, adequate layer thicknesses have to be guaranteed toavoid physically unreasonable solutions of the fitting dueto local minima.
SE-measurements were done with a Spectral Ellip-someter ES4G from Sopra, with a Xenon high-pressurel 2174-01 light source from Hamamatsu, a double mono-chromator with a slit width of 400 µm, a spectral rangefrom 230–930 nm and a spectral resolution of 0.05 nm.The evaluation of the measurements was carried out byFilm Wizard 32 with the Cauchy-model. The observationof the relative changes in the refractive index at 589.3 nmwas sufficient to monitor the sorption of the analytes.
Surface Plasmon Resonance Spectroscopy
The SPR-technique exploits the fact that, at certain condi-tions, surface plasmons of metallic layers can be excitedby radiation. The shift of the resonance wavelength or theshift of the angle of incidence is influenced by analytesinteracting with the sensitive layer.
For SPR-measurements a self-made apparatus based onthe Kretschmann configuration [14] was used. The metal-lic layer was prepared by evaporating silver onto the glassprism (half cylindrical, ground 20 ×40 mm) using a vac-uum evaporation system (Pfeiffer Vacuum GmbH, Wetzlar,Germany) at high vacuum (10−6–10−7 mbar) and at a rateof about 0.6–1 nm s−1. The deposition of approximately 50nm of silver was monitored by a crystal oscillator.
The conditions of the incident angle and the kindof glass were chosen to realize a resonance wavelength
of about 700 nm. As the refractive index is highlytemperature-dependent, the temperature is kept at a con-stant value by a thermoregulator.
Reflectometric Interference Spectroscopy (RIfS)
In the RIfS-method, one part of the radiation is reflected atthe interface of a thin layer, whereas the other penetrates thelayer and is there reflected at the other interface. These twopartial reflected beams become superimposed and form aninterference pattern resulting in constructive or destructiveinterference. This interference pattern depends also on theoptical thickness of the layer, which is given by the productof refractive index and the physical thickness of the layer.By a parabolic fit, the shift of an extremum is evaluated andthe change in the optical thickness is given as result.
The set-up used consists of a tungsten light source(20 W, 12 V), optical Y-fibre couplers (PMAA, 1 mm corediameter, microparts, Dortmund, Germany) and a diodearray spectrometer (MMS, Zeiss, Jena, Germany). Inter-ference spectra were recorded from 450–700 nm.
The temperature of the flow cell was kept constant bya thermoregulator.
Polymer Layers and Analytes
The investigated polymer is a glassy, ultramicroporouspolymer (Makrolon® M2400, Bayer AG Leverkusen, Ger-many). All measurements were performed below the glasstransition temperature (Tg = 145 C), so the glassy poly-mer chains are restricted in motion and cannot completelyhomogenize.
All sensitive layers were prepared from solutions ofMakrolon in mixtures of chloroform and dichlorobenzeneby a spin-coating process. By adjustment of the rotationspeed and time the thickness of the layers were varied be-tween 35 nm and 455 nm. Layer thicknesses and refractiveindices were determined by spectral ellipsometry. Further-more the polymer thicknesses were verified by a surfaceprofilometer (Alpha Step 500, Tencor Instruments, Moun-tain View, USA).
For SPR-measurements, two layers with a thicknessof less than 100 nm were prepared on BK7-prisms (re-fractive index nD = 1.51680, Krombach, Germany) andall other layers were prepared on NPH2-prisms (nD =1.92286, Ohara, Japan) to fulfil the resonance conditionsof the surface plasmons. To prepare layers for the RIfS-measurements, the solutions were spin-coated onto glass-substrates with a Ta2O5-layer for reflection enhancement.Si-wafers were used for the ellipsometric measurements.
The analytes (Aldrich Chemicals, Munich, Germany,p.a. quality) were evaporated from Chromosorb (W-AW-DMCS 80/100, Macherey & Nagel, Düren, Germany) bya computer-driven gas mixing station (MKS, Munich, Ger-many) at 5 C and the measurements were performed at

Interaction Behaviour of the Ultramicroporous Polymer Makrolon® by Optical Spectroscopic Methods 19
20 C. For reasons of comparability the partial pressure piof each analyte was referenced to its saturation pressurepi0. The sensitive layers were exposed to concentrations ofthe three homologous alcohols between 0 and 0.12 pi/pi0in eight steps. The measurements were performed in ran-dom order and each concentration was measured threetimes.
Results and Discussion
The interaction behaviour of the homologous alcoholsmethanol, ethanol and 1-propanol and the ultramicro-porous polymer Makrolon was investigated by threedifferent optical methods: spectral ellipsometry, surfaceplasmon resonance and reflectometric interference spec-troscopy.
The interaction kinetic of the smaller analytes methanoland ethanol is fast and reversible. For 1-propanol, the sen-sitive layers had to be exposed for longer periods to reacha stable signal. The desorption of this analyte is also muchslower, but still reversible. As the analytes sorb into thepolymer backbone, equilibrium is not reached during thetime of exposition.
First the ultramicropores are filled with analyte mole-cules, thereby mainly the refractive index is changed. Thefilling of the pores is leading to a Langmuir-type changeof the measurand. For the smallest analyte methanol(0.068 nm3, smaller than the mean pore-volume), mostpores are within reach. Langmuir-type behaviour can beobserved up to higher concentrations than for ethanoland 1-propanol. Due to the pore-volume distributionand 1-propanol being the largest analyte (0.125 nm3), ithas the least number of pores accessible (see Fig. 1a),meaning that 1-propanol has all its available pores occu-pied at lower concentration than ethanol (0.097 nm3) andmethanol. Admittedly, the interaction due to its size is thestrongest. After nearly all accessible pores are filled, fur-ther molecules can sorb into the polymer backbone andcause a swelling of the polymer resulting in a Henry-typeisotherm. For methanol, this swelling is the shallowest;it is highest for 1-propanol. This results in a smallerLangmuir-part and a greater Henry-part of the absorptionisotherm for this analyte.
The observed sorption behaviour can therefore bedescribed by a combined Langmuir-Henry absorptionsisotherm. Equation 1 was fitted to the calibration curves ofthe three methods and the Henry-Langmuir-behaviour wasverified.
As follows, the results for each measuring techniqueare described to outline its benefits to a comprehensive de-scription of the interaction behaviour of the analytes andthe polymeric layers.
In all figures, the mean signal changes and standard de-viations are shown. The results of the fitting of Eq. 1 areplotted as lines.
Ellipsometric Measurements
A Makrolon layer of 170 nm was exposed to the alco-hols to investigate the influence of the analytes on re-fractive index and layer thickness. In Fig. 2 the relativechanges in the refractive index and relative changes inphysical thickness for different concentrations (0 to 0.13pi/pi0) of 1-propanol are shown. For lower partial pres-sure, an abrupt rise is observed. This can be explained bythe replacement of air (nD = 1) in the pores by the an-alyte molecules (nD = 1.385). After the accessible poresare filled, furthermore no significant change in the refrac-tive index can be found with rising concentration of theanalyte. For the highest measured concentration even a de-crease of the refractive index is observed. This can beexplained by a swelling of the polymer by permeation ofanalyte molecules in the polymer backbone as the refrac-tive index of 1-propanol is lower than that of Makrolon.As shown in Fig. 2, the layer thickness increases with thepartial pressure of the analyte (Henry-type isotherm). Thissubstantiates the swelling of the glassy polymer due to in-trusion.
For methanol and ethanol similar results were found.The relative changes in the physical thickness were smallerthan for 1-propanol for equal concentrations, as the inter-action of the smaller analytes with the polymer backboneis weaker.
SPR-Measurements
For the characterization of the interaction behaviour, sixultramicroporous layers of thicknesses between 35 nmand 430 nm have been exposed to the three alcohols. InFig. 3 the SPR measurements of a 200 nm Makrolon layerwith methanol (nD = 1.329), ethanol (nD = 1.361) and
Fig. 2 Relative change in the refractive index (gray squares)and relative change in the physical thickness (open cycles) ofa Makrolon layer of 170 nm during exposition to different concen-trations of 1-propanol, measured by spectral ellipsometry

20 S. Busche et al.
1-propanol (nD = 1.385) are shown. The standard devia-tions of all measurements are very small, so the interactionof the analytes with the polymer is highly reproducible.
The evanescent field of the surface plasmons decayswithin some hundred nanometres and is not fully decayedwithin the 200 nm of this sensitive layer.
As can be seen in Fig. 3, the changes in the sensorsignals are increasing with higher concentrations for allanalytes. The signals for 1-propanol are higher than forethanol than for methanol because of the higher refractiveindex of 1-propanol.
The slope is steeper for the whole concentration range,but the filling of the pores is completed at lower partialpressures, as can be seen in the curvature of the fitted
Fig. 3 Shift of the resonance wavelength of the surface plasmons ofa layer of 200 nm caused by different concentrations of the three an-alytes. The sorption isotherms follow the Henry-Langmuir-equation
Fig. 4 Eight concentrations of methanol exposed to six differentMakrolon layers between 35 and 430 nm. The shift of the SPR res-onance wavelength is plotted versus the saturation pressure of thealcohol
graph. For methanol it is not clearly distinguishable whenthe filling of the pores is completed.
In Fig. 4 the saturation signals for methanol for the sixsensitive layers are plotted as mean and standard devia-tions. The shifts in the resonance wavelength are increas-ing with growing layer thicknesses. The signals for 350 nmand 430 nm layers are very similar as the evanescent fielddecays within some hundred nm and the saturation signalsfor layers of more than 300 nm shall be almost identical.The Langmuir-part of the graphs is protracted to higherconcentrations with increasing thickness of the polymerlayers because the total number of pores also rises and dif-fusion rate also plays an important role. The sorption anddesorption kinetics of thinner layers is much faster thanfor thicker layers. Therefore a compromise between signalheight and the ability of fast measurements has to be madefor sensing applications.
RIfS Measurements
The interaction behaviour of five Makrolon layers of dif-ferent thicknesses between 70 nm and 455 nm and thethree homologous alcohols was investigated by reflecto-metric interference spectroscopy. In Fig. 5 the changes ofthe optical thickness of a 205 nm layer is plotted ver-sus the concentrations of the three homologous alcohols.For methanol there is a relatively linear increase of thechange in optical thickness. For the two greater analytes,the curves are more arcuated and the Henry-Langmuir-behaviour can be seen more clearly.
In Fig. 6 the saturation signals for the five Makrolonlayers for methanol are given. The changes of opticalthickness depend on the thickness of the sensitive layer,but they are not growing linearly with the layer thick-ness. For the 70 nm layer the changes are very small andthe signal is very low which can be explained by the
Fig. 5 The change in the optical thickness of a 205 nm thickMakrolon layer plotted against the concentrations of the three ho-mologous alcohols, measured with RIfS

Interaction Behaviour of the Ultramicroporous Polymer Makrolon® by Optical Spectroscopic Methods 21
Fig. 6 RIfS-measurements of eight concentrations of methanol ex-posed to six different Makrolon layers between 35 and 430 nm.The change in the optical thickness is plotted versus the saturationpressure of the alcohol
poor interference pattern of the thin sensitive layer. Therelative changes of the optical thickness of the other in-vestigated layers are much higher. The Henry-Langmuir-behaviour of these layers increases with the layer thick-ness but is less distinctive than in the SPR-measurements.This is due to the fact that both changes in refractive in-dex as well as in layer thickness contribute to the changein the optical thickness. The interaction kinetic of thickerlayers is very slow. For practical application a compro-mise between signal height and kinetic aspects has to befound.
Summary and Conclusion
The 35 nm Makrolon layer shows a relatively linear sig-nal with only a slight curvature in the SPR-measurement.
RIfS-measurements with this layer were not possible be-cause such thin layers do not provide a distinctive in-terference pattern. Even the 70 nm layer provides verysmall signals for the RIfS-measurements due to the poorinterference pattern. For this method, the layer thick-ness should be at least 100 nm. By the use of thickerlayers of e.g. 205–455 nm, good interference patterns canbe obtained which result in higher signals. The disad-vantages of thicker layers are the slower interaction ki-netics which lead to longer sorption and regenerationtimes.
The layers from 35 nm to 300 nm show an increasingrelative signal in the SPR-measurements. The evanescentfield of the surface plasmons decays within some hundrednanometres and therefore the signal increases with increas-ing layer thicknesses, since the evanescent field protrudesless and less out of the layer. The saturation signals oflayers thicker than 300 nm are equal and the use of theselayers is not reasonable, especially since the interaction ki-netics of such thick layers are very slow and the analytemolecules will not interact with the evanescent field untilsorbed into the sensitive domain.
The Langmuir-part of the sorption isotherms of RIfScan be observed up to concentrations of approximately0.02 pi/pi0. Here the change in layer-thickness hasmore bearing on the signal. The isotherms of the SPR-measurements are all curved up to higher concentrations.
In any case a compromise between the aspects of sig-nal height and kinetics has to be found. The interactionkinetics of thick layers is very slow but high signal tonoise-ratios are found. For thinner layers, the signals areweaker and the fitting of the Henry-Langmuir-equation tothe calibration curve is less exact. But for all three methodsa good agreement to the sorption model was found.
The optimal layer thickness for the sensor methods de-pends on the method of observation and the analyte ofinterest. A good signal to noise ratio has to be obtainedwhile the regeneration should be completed rapidly.
References1. Gauglitz G (2005) Anal Bioanal Chem
381:1412. Brecht A, Gauglitz G, Kraus G,
Nahm W (1993) Sens Actuators B11:21
3. Azzam RMA, Bashara NM (1988)Ellipsometry and Polarized Light.North-Holland Physics Publishing,Amsterdam
4. Arwin H (2001) Sens Actuators A92:43
5. Gauglitz G (1996) in: Baltes H, GöpelW, Hesse J (eds) Sensors Update vol I.Wiley, Weinheim, p 1
6. Liedberg B, Nylander C, Lundström I(1983) Sens Actuators B 4:299
7. Piraud C, Mwarania E,Wylangowski G, Wilkinson J,O’Dwyer K, Schiffrin DJ (1992) AnalChem 64:651
8. Lakowicz JR (2004) Anal Biochem324(2):153
9. Brandenburg A, Henninger R (1994)Appl Optics 33:5941
10. Brandenburg A, Hinkov V, Kunz R(1992) in: Göpel W, Hesse J,Zemel JN (eds) Sensors, vol 6. Wiley,Weinheim, p 399
11. Clerc D, Lukosz W (1994) SensActuators B 19:581
12. Cush R, Cronin JM, Stewart WJ,Maule CH, Molloy J, Goddard NJ(1993) Biosens Bioelectron 8:347
13. Dieterle F, Belge G, Betsch C,Gauglitz G (2002) Anal Bioanal Chem374:858
14. Kieser B, Dieterle F, Gauglitz G(2002) Anal Chem 74:4781
15. Busche S, Dieterle F, Kieser B,Gauglitz G (2003) Sens Actuators B89:192

22 S. Busche et al.
16. Dieterle F, Busche S, Gauglitz G(2003) Anal Chim Acta 490:71
17. Dieterle F, Busche S, Gauglitz G(2004) Anal Bioanal Chem 380:383
18. Kasper M, Gauglitz G (2004) GITLabor-Fachzeitschrift 48:447
19. Kasper M, Busche S, Dieterle F,Belge G, Gauglitz G (2004) Meas SciTech 15:540
20. Toshima N (1992) Polymers for GasSeperation. Wiley, Weinheim
21. Michaels AS, Vieth WR, Barrie JA(1963) J Appl Phys 34:13
22. Dlubek G, Clarke A, Fretwell H,Dugdale SB, Alam MA (1996) PhysStatus Solidi A 157:351
23. Maier G (1998) Angew Chem110:3128

Progr Colloid Polym Sci (2006) 132: 23–32DOI 10.1007/2882_031© Springer-Verlag Berlin Heidelberg 2006Published online: 16 March 2006
P. Müller-Buschbaum High-resolution Grazing Incidence Small AngleX-ray Scattering: Investigation of MicrometerSized Structured Polymer Films
P. Müller-Buschbaum ()TU München, Physik Department LS E13,James-Franck-Str. 1, 85747 Garching,Germanye-mail: [email protected]
Abstract While bulk samples areroutinely probed by small angleX-ray scattering (SAXS) andultra-small angle X-ray scattering(USAXS), the grazing incidencegeometry enables the necessarysurface sensitivity to probe structuredpolymer films. Based on examples ofpolymer blend films of polystyreneand poly-n-butylacrylate as wellas polymeric nano-structures ofpolydimethylsiloxane the presentpossibilities of high-resolutiongrazing incidence small angle X-rayscattering (GISAXS) are demon-strated. Three different GISAXSresolutions, denoted with relaxed,high and ultra-high resolution arepresented. Thus GISAXS experimen-tally enables the determination ofa large range of length scale varyingfrom the molecular level (nanome-ter) to several micrometers. Thisdevelopment allows for an overlapwith optical techniques combined
with the very high sensitivity ofthe grazing incidence geometry.The impact of an enhanced surfacesensitivity is pictured by probingthe polymer structures at differentdepths. In addition, the possibilityof determining buried structures isaddressed. Depending on the char-acteristic structure of the thin filma simulation of the two-dimensionalGISAXS pattern is important todetermine the influence of structuralkey parameters. Therefore GISAXSpattern simulations are shown topicture sample induced limitingfactors of the detection of large scalestructures.
KeywordsGrazing incidence ·Optical microscopy ·Small-angle scattering ·Surface scattering ·Synchrotron radiation ·Thin film geometry
Introduction
The structure of polymer surfaces and thin polymeric filmsat the mesoscopic scale is of interest, both for applica-tion and basic research [1]. As the size of many tech-nological devices decreases, the natural length scales ofmany typical polymers such as the radius of gyration, thepersistence length, or the domain size in block copoly-mers, match the feature size and thus the materials areexpected to display a new behaviour [2–5]. On the otherhand, the tendency towards spontaneous structure forma-
tion may stabilize or even generate morphological featuresof larger size [6–9]. As a consequence, the range of in-teresting polymeric structures starts on the molecular leveland extends up to several micrometers. With the ongo-ing improvement of sample preparation techniques, thesestructures may extend to macroscopic surface areas of sev-eral tens of square centimetres [10]. Along this line ofenlarged structured surface areas, very local spatial probessuch as atomic force microscopy (AFM) and transmissionelectron microscopy (TEM) are of less statistical signifi-cance. With AFM and TEM only a few exemplary spots

24 P. Müller-Buschbaum
of the surface can be probed. The resulting low statisticsinclude the danger of being mislead by an artificial localstructure as for example caused by defects. The use ofa strongly averaging experimental technique such as scat-tering is therefore very advantageous [11–13].
It has been known for many decades that small angleX-ray scattering (SAXS) and ultra-small angle X-rayscattering (USAXS) used in a conventional transmissiongeometry are powerful tools to investigate electron dens-ity fluctuations on a mesoscopic scale. Thus, these nondestructive techniques are well suited to study bulk mate-rials; however, are limited when the structure of interestis confined in the surface region of the sample. In orderto overcome this limitation and achieve a surface sensitiv-ity, the transmission geometry simply has to be replacedby reflection geometry. By the combination of a grazingincidence geometry and the ideas of SAXS or USAXS,the powerful technique of grazing incidence small angleX-ray scattering (GISAXS) results [13–20]. Furthermore,replacing the transmission by a reflection set-up offersthe advantage to decouple the scattering signal of inter-est from the very intense direct beam. Whereas in USAXSthe regime of the smallest wavevectors is shadowed by thebeamstop which is urgently required to protect the detectoragainst the direct beam, in GISAXS due to the reflectionof the scattered intensity the direct beam is not at all onthe detector [21]. Thus geometrical constraints imposedby the use of beamstop are not present and an increasedresolution compared to transmission experiment is acces-sible.
Within the last years, GISAXS experiments receive anincreasing attention including the investigation of poly-meric films and surface structures. In general, GISAXSdoes not require a special sample preparation and thusenables kinetic investigations devoted to a structural devel-opment as a function of time. Moreover, GISAXS enablesthe detection of buried structures in a non destructive way.As compared to local probe techniques, GISAXS yieldsan excellent sampling statistics, which means that it av-erages over macroscopic regions to provide informationdown to a nanometer scale. AFM and TEM are still con-sidered as important complementary methods which canbe associated to the surface sensitive scattering techniques(i.e. GISAXS) [13]. Both inform about the order of mag-nitude of the correlation length in the surface structureand provide necessary input for the modelling of GISAXSdata [20].
One particular strength of GISAXS is the probingof small sized structures such as micro-phase separationstructures in copolymer films. Such molecular structuresare easily detected with a relaxed resolution [18–20]. Fol-lowing the same principles as in the transmission geometry(SAXS to USAXS) larger length scales may be addressedby an increase in the sample detector distance. In accor-dance to the transmission this sometimes yields a changein the used abbreviation from GISAX to GIUSAXS (or
X-ray reflection ultra small-angle scattering in pioneeringwork [21]). However, within this article we restrict to theterm GISAXS with the extension of the used resolution,very comparable to other areas of X-ray scattering. Highlycollimated X-ray beams enable the extension of GISAXSexperiments into the high-resolution regime. By makinguse of the absence of any beamstop, the resolution canbe optimised to the detector pixel size as demonstrated inthis article. With the ongoing development towards high-resolution set-ups large sized surface structures such asphase separation structures in polymer blend films are im-provingly determinable. In addition, this development en-ables the overlap with optical techniques combined withthe very high sensitivity of the grazing incidence geometry.However, the high demand on collimation requires the useof high flux sources of large scale facilities such as specialsynchrotron radiation beamlines.
Despite the growing interest in GISAXS and its appli-cation to a broad variety of sample systems, it is still anadvanced scattering technique and basic articles are verylimited in number. Within this article the possibilities ofhigh-resolution GISAXS and its application are focussed.This includes a short theoretical introduction as well as theprinciples of the experimental set-up required. Selected ex-amples are included to picture this in detail. Within theseexamples we restrict to polymer blend films and polymericnano-structures. Both enable to demonstrate all these ideasand blend films mark a class of samples difficult to accesswith X-rays due to the weak scattering and small contrastbetween the different blend components. For a compari-son, model calculations are shown to picture sample in-duced limiting factors of the detection of large scale struc-tures.
GISAXS – A Short Introduction
In the region of total external reflection, the incident andexit angle αi and α f are small enough to neglect the in-fluence of the periodic crystal structure and to use a de-scription based on one mean refractive index nj = 1−δj +iβj [22–24]. Since the dispersion part
δj(q, λ) = e2λ2
8π2mec2ε0ρj
∑k
[f 0k (q, λ)+ f ′(λ)
]∑k
Mk
in case of X-rays is larger than zero, each medium, such asa polymer film and its solid support are optically thinneras compared to the surrounding air or vacuum. In case ofpolymers the absorption contribution
βj(λ) = e2λ2
8π2mec2ε0ρj
∑k
f ′′(λ)
∑k
Mk

High-resolution GISAXS 25
is usually very small. Both contributions to the refractiveindex depend on the speed of light c, the elementary chargee, the electron rest mass me, the permittivity constant ε0,the mass density ρj , the wavelength λ, the atomic weightMk and the dispersion corrections f ′ and f ′′. f 0
k can beapproximated by the number of electrons Zk and the sum-mation is performed over all atoms k of a monomer subunitin the case of polymers under investigation.
Usually the coordinate system is chosen that way,defining the x, y-plane by the sample surface with the x-axis oriented in the direction of the X-ray beam [13, 25].As a consequence, the z-axis is perpendicular to the sam-ple surface (see Fig. 1). In this case
qx = 2π(cos ψ cos α f − cos αi)/λ
qy = 2π(sin ψ cos α f )/λ
qz = 2π(sin αi + sin α f )/λ
denote the components of the wave vector q. For specu-lar scattering, with αi = α f and ψ = 0, the wave vectorcomponents are qx = qy = 0 and qz = 0, sampling a depthsensitive information only. With off-specular scattering thelateral component is q|| = (qx, qy) = 0 probing the in-plane structure of the sample surface. To enable GISAXSexperiments a qy-resolution is required.
Figure 1 gives a schematic drawing of the basic set-up used in the GISAXS experiments. The two-dimensionaldetector is only recording the intensity reflected abovethe sample surface. The direct beam is not recorded withthe detector to avoid detector saturation as several ordersof magnitude in intensity separate the incoming intensityfrom the reflected one. In addition the specularly reflectedpeak (condition α f = αi) is shielded with a beam stop to
Fig. 1 Schematic top-view of the GISAXS geometry making useof a two-dimensional detector in the yz-plane to picture the scat-tering geometry. The sample is placed in the xy-plane and con-sists of a typical polymer blend structure. The incident angle isdenoted αi and the exit angle α f . The structural information isobtained from a y-cut out of the two-dimensional intensity distri-bution perpendicular to the scattering plane (xz-plane) indicated bythe blue triangles. The GISAXS signal is probed as a function ofthe out-of plane angle ψ. As figuratively shown the diffusely scat-tered intensity in the scattering plane, the detector scan, exhibitsa Yoneda peak (denoted Y) and a specular peak (S) as commonfeatures
use the full available flux of the synchrotron beamline be-cause specular and diffuse scattering are as well separatedby orders of magnitude in intensity. Figure 1 pictures theanisotropy of the observed scattering pattern recorded inthe yz-plane. Different main features are already deter-mined right from the two-dimensional images. The spec-ularly reflected peak (denoted S) in the upper part of thedetector and the Yoneda peak (denoted Y) [26] in the mid-dle of the detector are well separated.
Instead of handling the complete two-dimensional in-tensity distribution, the analysis of the scattering data canbe reduced to distinct cuts [13]. Basically two differenttypes of cuts are advantageous [15–17]: Horizontal slicesat constant qz and vertical slices at constant qy (the nam-ing of horizontal and vertical refers to the sample surface).For an improvement of the statistics the intensity is usu-ally integrated along a slice consisting of a few detectorlines only. To model the intensity distribution of a ho-rizontal slice (in literature frequently called out-of planescan or GISAXS cut), in the framework of the “effect-ive surface”-approximation the differential cross-sectionusing the distorted-wave Born approximation (DWBA)has the easy appearance [16]
dσ
dΩ= Cπ2
λ4
(1−n2
)2 |Ti |2∣∣Tf
∣∣2 F(q) ∝ F(q)
where C denotes the illuminated surface area, λ the wave-length used, n the refractive index, Ti, f the Fresnel trans-mission functions and F(q) the diffuse scattering factor.In contrast to conventional diffuse scattering experimentsthe Fresnel transmission functions act only as overall scal-ing factors, because the incident and exit angle are fixed.As a consequence, the diffuse scattering factor F(q) isdirectly probed and in case of N identical and centro-symmetrical objects with a random orientation it can beapproximated [17]
F(q) ∝ NP(q)S(q)
to depend on the form factor P(q) of the individual objectsand to depend on the structure factor S(q).
However, for more complex samples this easy data an-alysis is no longer sufficient and instead of one single ho-rizontal slice of a certain width, the full two-dimensionalintensity distribution needs to be modelled. This mod-elling of the GISAXS data is possible with the programIsGISAXS by R. Lazzari [27], which is freely available fornon-commercial use. Within the DWBA the program ac-counts for the four terms involved in the scattering process(associated to different scattering events which involve ornot a reflection of either the incident beam or the finalbeam collected on the detector). Local real space probessuch as AFM or TEM can give an important informationfor setting up the appropriate model with respect to shapeand distribution of the polymer structure [20].

26 P. Müller-Buschbaum
Experimental Requirementsfor High-resolution GISAXS
Despite the strong differences in the intensity between thediffusely scattered intensity carrying the desired informa-tion about the lateral sample surface structure and the spec-ularly reflected intensity, the use of a two-dimensional de-tector is very advantageous for any GISAXS experiment.Because the specular peak, broadened by the experimentalresolution function, is only helpful for alignment purpose,in the GISAXS experiment it is shielded with a beam-stop [13], which resembles a similarity to the commonSAXS experiments in which the direct beam has to beshielded for the same reasons as well. However, whereas inSAXS the intensity carrying information about large bulksample structures is located very close to this beamstopat small q-values, in GISAXS the Yoneda wing and thespecular peak (shielded with a beamstop) can be separateddue to the reflection geometry [13]. As a consequence,mainly three different types of GISAXS experiments canbe distinguished from the relative position of Yoneda wing(located at the critical angle αc of the material under inves-tigation) and specular peak (see Fig. 2).
To picture the possibilities of GISAXS within theframework of a statistical analysis, simulations of two-dimensional scattering patterns are presented in Figs. 2,3 and 4. The simulations were performed using the soft-ware IsGISAXS (version 2.5) by R. Lazzari [27]. In thesimulations cylindrically shaped polymer objects were as-sumed. For cylinders of radius R, height H and volumeV = πR2 H the form factor
Pcy(q, R, H) =2πR2 H
J1(q||R)
q||Rsin(qz H/2)
qz H/2exp(−iqz H/2)
contains the Bessel function of first order J1(x). A Gaus-sian type of distribution probability for the parameter Rwas selected, with the relative width σR/R of the dis-tribution of radii. The arrangement of the cylindrical ob-jects was described by an interference function (structurefactor S(q)). A 1D-paracrystal, which is a regular one-dimensional lattice with special cumulative disorder in-ducing a loss of long range order, was chosen. It was pa-rameterised by the position of first neighbour peak and thewidth w of the distance distribution. Moreover, the decou-pling approximation, supposing that the nature of the scat-terers and their position are not correlated in such a waythat the partial pair correlation functions depend only onthe relative positions of the scatterers and not on the classtype, was modelled. With respect to the electron densities,polystyrene structures sitting on top of a silicon substratewere taken.
1) In the first type of GISAXS experiment, the inci-dent angle fulfils αi < αc and consequently on the detec-tor the specular peak appears at α f = αi < αc below the
Fig. 2 Simulation of two-dimensional GISAXS scattering pat-tern assuming an array of cylindrically shaped nano-dots (heightH = 15 nm, radius R = 50 nm, σR/R = 0.25), distance D = 290 nmand w = 100 nm with a variation of the incident angle αi = a0.01, b 0.12, c 0.18, d 0.25, e 0.45 and f 0.55. The simu-lated angular range of 0.0 < α f < 0.55 in vertical direction and−0.48 < ψ < 0.48 in horizontal direction is well comparable withthe accessible range using a set-up at the HASYLAB. The positionand size of the specular peak is exemplarily shown by the red spot
Fig. 3 Simulation of two-dimensional GISAXS scattering patternassuming an array of cylindrically shaped nano-dots as explained inthe text with a variation of the nano-dot height: a H = 3.5, b 7.5,c 10.0, d 12.5, e 15.0 and f 17.5 nm. The simulated angular rangeof 0.0 < α f < 0.55 in vertical direction and −0.48 < ψ < 0.48in horizontal direction is well comparable with the accessible rangeusing a set-up at the HASYLAB
Fig. 4 Simulation of two-dimensional GISAXS scattering patternassuming an array of cylindrically shaped nano-dots as explained inthe text with a variation of the width of the nano-dot distance dis-tribution: a w = 30, b 50, c 100, d 150, e 200 and f 300 nm. Thesimulated angular range of 0.0 < α f < 0.55 in vertical directionand −0.48 < ψ < 0.48 in horizontal direction is well comparablewith the accessible range using a set-up at the HASYLAB

High-resolution GISAXS 27
Yoneda wing at α f = αc (see Fig. 2a). Depending on theexperimental resolution this will enable a separation ofboth signals along the α f -axis (or qz-axis) of the detectorand thus a proper separation of the diffuse and the specu-lar scattering, which is essential for the GISAXS analysis(see examples within this article). The extremely smallangle of incidence has the advantage of a very high surfacesensitivity in combination with a selection of the probedsample depth, such as in the standard grazing incidencediffraction (GID) experiments. But while GID experimentsprobe relatively large qy-values, GISAXS experiments fo-cus on significantly smaller qy-values and thus are muchmore sensitive to the quality of the beam alignment and thesample perfection (including quality of the sample edges).Therefore this type of GISAXS set-up is only rarely ap-plied with a standard-type beamstop or most likely usedin combination with a big linear beamstop oriented alongthe qz-axis [28–32]. This type of beamstop, which shieldsthe centre part of the two-dimensional detector, preventsaccess to high-resolution, whereas as demonstrated withinthis article the standard-type beamstop (circular) allowsfor high-resolution experiments.
2) In the second type of GISAXS experiment, an inci-dent angle of αi = αc (or αi ≈ αc) is selected (see Figs. 2bfor αc of polymer films and 2c for αc of substrate), tostrongly enhance the intensity by making use of the am-plification of the Fresnel transmission functions yieldinga factor of four. For this special alignment, the Yonedawing and the specular peak coincide on the detector atα f = αi = αc and GISAXS under these conditions reenactsall the disadvantages of the SAXS experiments. Such as inSAXS, the beamstop necessary to block the uninterestingpart of the intensity shadows the region of small qy-valuesof the diffusely scattered intensity as well. Therefore theadvantage of gaining a higher resolution in GISAXS ascompared to SAXS is completely wiped out and no high-resolution is possible. Consequently, data with this type ofsettings of the GISAXS experiment are not included in thisarticle.
3) In the third type, the incident angle fulfils αi > αc(see Figs. 2d–f) and the Yoneda wing is placed underneaththe specular peak on the detector [13, 19–21]. By increas-ing the incident angle, the separation between both signals,the Yoneda wing and the specular peak, is easily increasedas well (compare position of exemplarily shown specularpeak in Figs. 2d–f). With the disadvantage of losing thehigh surface sensitivity, along this line, the realization ofa high-resolution becomes accessible, too. The slit widthis adapted to the required resolution in qy and qz-directionthat way that basically the detector imposes the resolutionlimit. A very high resolution set-up is possible at verylarger distances (larger than 10 m) between sample and de-tector [21]. The requirements with respect to beam purityand qy-resolution are significantly higher as compared tolow-resolution GISAXS set-ups. As a consequence, typ-ical accumulation times in a high-resolution GISAXS or
GIUSAXS set-up are significantly longer as compared tothe GISAXS or GID geometry.
By comparing the different simulated two dimensional(2d) scattering patterns shown in Fig. 2, changes in the in-tensity distribution along the α f –direction are visible aswell. They arise from changes of the surface sensitivity.With increasing incident angle the probed sample sur-face volume increases in depth. In all simulations shown,the diffuse scattering contribution containing the relevantstructural information is plotted. The simulations are basedon the distorted wave born approximation (DWBA).
To figure out the influence of the individual parameterson the shape of the diffuse scattering in Figs. 3 and 4 twotypical parameters of the nano-dots are varied indepen-dently. A fixed incident angle αi = 0.55 > αc is chosen(third type of GISAXS experiment). The specular peakcontaining non of these information is not displayed forclarity. Of course it will be present in a real experiment inthe top region of the two-dimensional intensity distribution(compare to Fig. 2f). An array of nano-dots with cylin-drical shape is assumed. The diameter of the nano-dots isartificially set to 2R = 100 nm and the distance betweenadjacent nano-dots is fixed to D = 290 nm. For both, thediameter and the distance a Gaussian type of distribution ismodelled.
The simulations shown in Figs. 3 and 4 correspond toa typical scenario in polymer nano-structures. The nano-dots exhibit a rather broad distribution of the diameterσR/R = 0.25. As a consequence basically no form factorcontribution is visible in the two-dimensional scatteringpattern, which is purely dominated by the structure fac-tor contribution. This can be understood as a well definedtemplate with rather well arranged positions but ill definedindividual sizes of the nano-dots.
In Fig. 3 the height of the nano-dots is varied to pic-ture its influence on the shape of the Yoneda wing in theqz-direction. From Figs. 3a to 3f the height increases. Withrespect to the fixed diameter this increase corresponds toan increase in the aspect ratio from H/(2R) = 0.035 to0.175 and thus the shape of all nano-dots still remainsmore pancake-like rather than column-like as it is expectedfor polymer systems. The change in the object height isclearly visible creating an intensity modulation parallel tothe vertical axis (α f -direction) in the region of the Yonedawing. The structure factor contribution remains visible inthe central part of the two-dimensional intensity distribu-tion (two central, vertical, red lines). The drastic changesbetween Figs. 3d and 3e visualize the high sensitivity ofthe GISAXS technique, because a change in height only by12% has a strong effect.
In Fig. 4 the width w of the Gaussian distribution of thenano-dots distance is varied at a fixed height of all nano-dots of 15 nm picturing the visibility of the splitting ofthe Yoneda wing along the qy-direction (or ψ-direction).From Figs. 4a to 4f the distribution increases in its width.Figure 4a pictures the extreme case of a highly regular lat-

28 P. Müller-Buschbaum
tice type arrangement with an extremely small deviation inthe position, with respect to the assumed mean distance of290 nm. As a consequence the scattering pattern is dom-inated by the high order of the structure factor (vertical,red lines). With increasing width, the higher orders aredamped out as visible in Figs. 4b and 4c. At a distributionwidth of 200 nm (Fig. 4e) still first order maxima are vis-ible in the central part of the two-dimensional scatteringpattern and only at a value of 300 nm (Fig. 4f) the splittingof the Yoneda wing vanishes due to the loss of any lateralorder between the nano-dots.
Consequently, the presence of an intensity of theYoneda peak, split along the ψ-direction is present overa rather broad range of nano-dot distance distributions. Itshould be noted, that in polymer systems, a very high de-gree of order as shown in Fig. 4a is only rarely present. Inpolymer blend systems it is not expected at all.
For the selected experimental examples discussedwithin the next two sections the conditions of a broad sizeand distance distribution of the surface structures are wellsupported by the real space analysis. Thus in the follow-ing experimental sections instead of the full measured 2dintensity, only one selected horizontal slice at constant qz(of the critical angle of the polymer under investigation)will be shown [20]. From a comparison of the Figs. 2–4it is obvious, that in addition to the full 2d intensity, thesplit Yoneda peak is visible in a single horizontal slice atconstant qz as well.
Blend Film Structure
Blending different polymers and thereby conserving theirindividual properties in the blend is an extremely attrac-tive way to obtain new bulk materials [33, 34] or to coatsurfaces by functional films [35–40]. Thin films of suchblends provide micron-sized surface structures that arewell adapted to a large variety of applications where theemphasis is not on nano-structures as, for example, inoptics [6, 41, 42]. The resulting structures are mainly de-termined by the used blending ratio and solvent interac-tion [43–45].
The model system used consists of blend films of poly-styrene (PS) and poly-n-butylacrylate (PnBA) with mo-lecular weights Mw = 207 k (Mw/Mn = 1.02) and Mw =260 k (Mw/Mn = 3.78), respectively. Both componentswere blended in toluene solution at different weight ra-tios of PS : PnBA = 0.1 : 9.9 to 9 : 1 and prepared fromsolution casting onto pre-cleaned silicon (100) substrates.The chosen surface cleaning uses an acid bath of 100 ml of80% H2SO4, 35 ml H2O2 and 15 ml deionized water for 15minutes at 80 C, a subsequent rinsing in deionized waterand a final drying with compressed nitrogen. Varying thesolution concentration as well as the amount of solutiondeposited on the solid support enables the installation ofdifferent polymer film thicknesses as shown in Fig. 5b. The
Fig. 5 a Most prominent in-plane length Λ as determined from op-tical micrographs as a function of the weight fraction φPS of theblend component PS for a fixed amount of 3 mg/cm2 deposited.The coloured points resemble samples investigated by GISAXS.b Most prominent in-plane length Λ as a function of the amount ofsolution deposited for a fixed ratio of PS : PnBA = 3 : 7
smooth drying process in a special designed sample cham-ber at ambient conditions results in polymer blend filmswith marked surface structures due to phase separation (thepolymer-polymer interaction parameter of PS and PnBA is0.162 at 20 C).
Optical Analysis
The surface structures are analysed with optical mi-croscopy first. Optical micrographs are recorded withdifferent magnifications and the resulting grey-scale pic-tures are Fourier transformed to enable the detection ofmost prominent in-plane lengths. In contrast to Fouriertransformed height data which are equivalent to the powerspectral density function of the height-height correlationfunction, the Fourier transformed optical micrographs relyon the assumption that different colours (grey values)result from different sample heights [9]. As a conse-quence the obtainable intensity versus reciprocal lengthdata are not directly comparable with scattering data suchas GISAXS cuts. The intensity axis is arbitrary, whereasthe reciprocal length axis is exact. Because the preparationtechnique does not introduce a preferential orientation ofthe structures, the Fourier transformed exhibit radial sym-metry (see Fig. 6a) and statistics are improved by applyinga radial average (see Fig. 6b) [44].
The most prominent in-plane length is calculated fromthe position of the maximum of the intensity via Λ =1/ f [44]. As observed in other blend systems as well, themost prominent in-plane length shows a non linear depen-dence from the weight fraction φPS of the blend compon-ent PS. As visible in Fig. 5a Λ exhibits a maximum ata symmetric blending ratio PS : PnBA = 5 : 5 and stronglydecreases for asymmetric blending ratios. This decrease isaccompanied with strong changes in the type of surfacestructure. As determined by Stenert et al. [46] the ma-jority component forms a matrix embedding the minoritycomponent as disperse objects. The size of these objectsdecreases with decreasing amount of the minority com-ponent giving rise to the decrease in the most prominentin-plane length as shown in Fig. 5a.

High-resolution GISAXS 29
Fig. 6 a Example of Fourier transformed of an optical micrographwith high intensity shown in black and low intensity in white. b Re-sulting intensity versus reciprocal length f after radial averaging.The position of the most prominent in-plane length is pictured withan arrow
Comparable to samples prepared by spin-coating [10],the most prominent in-plane length increases with increas-ing film thickness. Figure 5b shows this behaviour, be-cause the deposited amount is directly proportional to theresulting film thickness. Thus weight fraction and filmthickness yield a good tool to prepare samples with differ-ent structural sizes which cover a range from 0.1 to 10 µm.
GISAXS
Within the following, we pick-out three different exam-ples to demonstrate different experimental resolutions ofa GISAXS experiment. The GISAXS measurements wereperformed at the BW4 USAXS beamline of the DORISIII storage ring at HASYLAB/DESY in Hamburg [47]using different experimental setting. The selected wave-length was 0.138 nm. The scattered intensity was recordedwith a 2d detector which consists of a 512×512 to 2048×2048 pixel array. Due to the sample-detector distance of≈ 13 m a high resolution becomes accessible. The beamdivergence in and out of the plane of reflection was setby two entrance cross-slits and a guard slit in front of thesample. At one fixed angle of incident the two-dimensionalintensity distribution was measured.
Medium Sized Structures. A blending ratio of PS : PnBA= 5 : 5 (weight fraction of the blend component PS φPS =0.5) and a small film thickness of 10 nm is chosen, giv-ing rise to structure with PnBA giving the matrix and PSforming disperse objects inside this matrix [46]. In theFig. 7 the corresponding GISAXS data (horizontal slicesat constant qz) measured with two different experimen-tal resolutions are compared in two different presentations(left: conventional SAXS, right: standard GISAXS plot).
In the so called relaxed-resolution set-up an experimen-tal resolution of ∆qy = 4.47 × 10⁻³ nm−1 was realizedwhich enables the detection of lateral lengths up to ap-proximately 1 µm. In Fig. 7 the data measured with thissettings are plotted with green dots. As visible by the pres-ence of the shoulder (marked by an arrow) in the decaying
Fig. 7 Example of blend film sample measured under two differentexperimental resolution conditions: relaxed resolution set-up (greendots) and high resolution set-up (blue open circles). The corres-ponding resolution limits are marked by vertical lines and the mostprominent in-plane length of 110 nm is marked by an arrow. a Con-ventional small-angle presentation of the data emphasizing on smalllength scales and b Standard GISAXS presentation of the data withthe emphasize on larger lengths. The solid lines are fits based ona model described in the text
intensity, the most prominent in-plane length of 110 nm iseasily resolved with this set-up already. It should be noted,that within a standard transmission geometry instead ofthe applied reflection geometry, the resolution would havebeen reduced by a factor of 5 and consequently, this set-upresembles the standard USAXS settings at the BW4 beam-line.
An improvement of the resolution becomes possiblefrom optimised slit settings and a replacement of the 512×512 pixel by a 1024 × 1024 pixel detector. By match-ing the resolution with the pixel size of 200 µm (yielding∆qy = 7.24 ×10⁻⁴ nm−1) lateral lengths up to 8 µm be-come accessible. Data measured with these settings areshown with blue open circles in Fig. 7. In the conventionalsmall-angle presentation (Fig. 7a), which emphasizes onthe small length scales, the strong improvement in reso-lution is less visible as compared to the standard GISAXSpresentation (Fig. 7b). Due to the enhanced resolution theshoulder in the decaying intensity is more pronouncedmainly due to the fact, that unresolved large length scaleswhich fall into the resolution limit are less smeared in qy.
Large Sized Structures. With an increased amount of de-posited material of 3 mg/cm2 and a blending ratio ofPS : PnBA = 3 : 7 (weight fraction of the blend componentPS φPS = 0.3) a larger in-plane structure results. A typi-cal optical micrograph is shown in Fig. 8b. Small PS dropsare embedded in a PnBA matrix [46]. The statistical an-alysis of the optical micrographs yields a most prominentin-plane length Λ = 1.13 µm (shown by the red dot inFig. 5a).
Therefore with the so called relaxed-resolution set-upthis length is inaccessible and the GISAXS data (shownwith green open circles in Fig. 8a) exhibits no markedshoulder or peak in the intensity. In contrast with the highresolution set-up this dominant length is still well resolved.The data shown in Fig. 8a (red dots) exhibits a well pro-nounced peak at a position qy,peak because in addition to

30 P. Müller-Buschbaum
Fig. 8 a Example of blend film sample measured under two dif-ferent experimental resolution conditions: relaxed resolution set-up(green open circles) and high resolution set-up (red crosses). Thecorresponding resolution limits are marked by vertical lines and themost prominent in-plane length of 1.3 µm is marked by an arrow.The solid lines are fits based on a model described in the text.b Corresponding optical micrograph
the improved resolution, the incident angle was changedfrom αi > αc to αi < αc which enhances the surface sen-sitivity. As demonstrated in Experimental Requirementsfor High-resolution GISAXS, the width of the peak dis-plays the width of the distribution function and it can beconcluded that the blend structures enlarge in their lateralextension with increasing distance from the sample sur-face. From the GISAXS data a most prominent in-planelength of 1.3 µm results. Thus it agrees well with the resultof the statistical analysis of the optical data, picturing theoverlap to the optical regime at high resolution. The slightdeviation between both values has to be attributed to thelimited possibilities in the statistical analysis of the opticaldata. As explained above, we have only access to coloursand not directly to height or chemical information.
Ultra-large Sized Structures. As shown in Fig. 5a, the in-crease in the weight fraction of the blend component PSto φPS = 0.5 gives rise to strong increase in the resultingin-plane structure. The calculated most prominent in-planelength is 5.12 µm and shown in Fig. 5a with the blue circle.The increase coincides with a change in the appearance ofthe structure in the optical data (see Fig. 9b).
In Fig. 9a GISAXS data measured with the high reso-lution set-up described in the previous section (blue opencircles) are compared with an ultra-high resolution set-up (red crosses). This further increase in resolution marksthe actual technical limit with the currently available set-tings at the BW4 beamline. A further drastic optimisationof the slit settings and the focussing conditions togetherwith a 2d dimensional detector with 78 µm pixel size onlyare the base of this improvement. The nominal resolutionis ∆qy = 2.75×10⁻⁴ nm−1 corresponding to 22 µm max-imum real space length. This maximum accessible laterallength scale of this ultra-high resolution set-up has beenconfirmed by the means of Monte-Carlo ray tracing simu-lation of the beamline BW4 [48]. Due to the limited sta-bility of this ultra-high resolution set-up with time, an ex-perimental validation of this exact value was not possibleup to now. However, despite the detailed number, with the
Fig. 9 a Example of blend film sample measured under two differ-ent experimental resolution conditions: high resolution set-up (blueopen circles) and ultra-high resolution (red crosses). The corres-ponding resolution limits are marked by vertical lines and the mostprominent in-plane length of 4.8 µm is marked by an arrow “A”.The solid lines are fits based on a model described in the text.b Corresponding optical micrograph
ultra-high resolution set-up in-plane structures larger than10 µm become detectable.
Along the line of the arguments from the previous sec-tion, the structure shown in Fig. 9b is close to the reso-lution limit of the high resolution set-up and easily de-tected with the improved resolution. The peak in the inten-sity (marked with “A”) corresponds to a most prominentin-plane length of 4.8 µm. It should be noted, that with-out fitting the data with a simple model as explained inGISAXS – A Short Introduction and Experimental Re-quirements for High-resolution GISAXS, just from theposition of the peak in the high resolution set up (blueopen circles in Fig. 9a) a smaller length would be deter-mined, due to the influence of the resolution function. Onlyin case of a clear separation of the resolution peak andthe structural peak, such as measured with the ultra-highresolution set-up for this particular example, the peak pos-ition directly gives access to the most prominent in-planelength via a simple Bragg-like analysis and without apply-ing a model fit.
Similar to the previous section in addition to the im-proved resolution, the incident angle was changed fromαi > αc to αi < αc which enhances the surface sensitiv-ity. Therefore the ultra-high resolution set-up operated atαi < αc is highly surface sensitive and probes only the lat-eral length visible in the optical micrographs, whereas thehigh-resolution set-up operated at αi > αc probes the sur-face and a surface near volume. It exhibits a second struc-tural feature marked with “B” in Fig. 9a which cannot berelated to a surface structure because it is invisible underthe surface sensitive conditions. The related real spacelength is 1.2 µm and pictures the possibility of GISAXS toprobe buried structures located inside the film, which arenot accessible to optical techniques, as well.
Polymeric Nano-structure
Micrometer sized surface structures in thin polymer blendfilms are detectable with optical techniques as well and

High-resolution GISAXS 31
the advantage of the more elaborate technique GISAXSis limited to an improved accuracy in the detection ofthe most prominent in-plane length and to the access toburied structures. In contrast, polymeric nano-structuresconsisting of several nanometer sized objects are not re-solvable with optical techniques and commonly visualizedby AFM [9, 10, 13]. However, the AFM visualization be-comes difficult in case these objects are separated by largedistances on the order of some micrometers. A possiblemechanism for the preparation of this type of surface struc-tures is the deposition from solution by mechanical wipingacross the substrate surface.
In the present example polydimethylsiloxane (PDMS)is deposited from an iso-propanol solution onto a glass sur-face [49]. Due to the small amount of PDMS deposited bythis technique, with optical microscopy the sample surfaceappears structureless. For the optical micrograph shownin Fig. 10b we selected a position which exhibits smalldust particles by purpose, to demonstrate that the surfacewas focused. By optical microscopy the untreated and thenano-structured glass surface are indistinguishable.
As shown in Fig. 10a, GISAXS is able to distinguishbetween both. The data of the untreated glass are plottedwith blue crosses and the data of the nano-structured glasswith red circles. Clearly in the GISAXS data of the nano-structured sample a peak in the intensity is visible (markedwith an arrow), which is not present in the data of theuntreated sample. The corresponding real space length is7.0 µm. The ultra-high resolution set-up was operated atαi < αc because the very high resolution and the highlysurface sensitivity are required both to probe this structure.
Summary
Based on examples of polymer blend films and polymericnano-structures the present possibilities of high-resolution
Fig. 10 a Example of polymeric nano-structure deposited fromsolution by mechanical wiping on a glass surface (red circles) com-pared to the untreated glass surface (blue crosses) as measured withthe ultra-high resolution set-up. The corresponding resolution limitis marked by a vertical line and the most prominent in-plane lengthof 7.0 µm is marked by an arrow. The solid lines are fits based ona model described in the text. b Optical micrograph of the nano-structures
GISAXS are illuminated within this article. Basically threedifferent resolutions have been presented, which for clarityhave been denoted within this article by relaxed (structuresup to 1 µm), high (up to 8 µm) and ultra-high resolution(more than 10 µm), although even the relaxed resolutionGISAXS set-up enables the detection of structures up toone micrometer, which is significantly larger as comparedto all USAXS experiments. Thus the switch from a trans-mission to a reflection geometry admits an increase inresolution due to the absence of the primary beam. Due totechnical improvements at the synchrotron beamline BW4(at HASYLAB, Hamburg) a further increase in resolutionwas achieved within recent beamtimes. Of course highresolution GISAXS experiments are not limited to this oneparticular beamline. Requirements are large collimationand sample-detector distances, beam focussing and a smalldetector pixel size.
As a result of the achieved high resolution, GISAXSexperiments expand into the optical regime. This allowsfor the detection of blend film structures, which have beendifficult to detect in the past. Moreover, high-resolutionGISAXS can cover the length scale regime, which natu-rally was only accessible by conventional diffuse scatter-ing within a so called rocking (or transverse) scan in thepast. Contrary to the spoiling of the structural signal by thefolding with the transmission functions in a rocking scan,with GISAXS object geometry, size distributions and spa-tial correlations are directly probed.
Nevertheless, GISAXS demands for high intensitysources such as synchrotron laboratories and the increasein resolution is mostly paid by a decrease in X-ray photonflux. Due to the time consuming installation of a ultra-highresolution set-up and its limited time stability (at least atthe present conditions) this type of experiments might bestill very limited in future. Compared to any AFM, TEMor optical probe, GISAXS is a very elaborate techniqueand therefore most likely not planned for replacing the realspace investigations, rather than complementing them. Ad-vantages as compared to the real space probes are mainlytwofold: On the one hand, GISAXS yields an increase inthe statistical significance of the detected most prominentin-plane length due to the significantly (in case of AFM)larger probed surface area. It averages over macroscopicregions to provide information on nanometer to micro-meter scale. On the other hand, GISAXS gives the accessto buried structures. As demonstrated, by tuning the in-cident angle, surface and film structures are separatelydetected.
Resulting from its high versatility GISAXS will receivea further increasing attention in the structural investigationof thin film samples.
Acknowledgement This work has benefited strongly from fruit-ful and enjoyable collaborations with W. Petry and M. Stamm.Support at HASYLAB at the BW4 beamline with respect toimprovement of the resolution was provided by S. Cunis, M. Dom-

32 P. Müller-Buschbaum
mach, R. Döhrmann, R. Gehrke and S. V. Roth. Cooperationof E. Bauer, A. Götzendorfer, T. Ittner, S. Loi, C. Lorenz-Haas,E. Maurer, P. Panagiotou, K. Schlögl, T. Titz and P. Volodin inmany beamtimes at HASYLAB and stimulating discussions with
A. Meyer, C. Papadakis and M. Rauscher is gratefully acknow-ledged. We thank M. Stenert and F. Bandermann for supplyingthe PnBA. Financial support was provided by the DFG SPP 1164“Nano-and Microfluidics” (Mu1487/2) and HASYLAB.
References1. Fedynyshyn TH (ed) (2002) Advances
in Resist Technology andProcessing XIX Proceedings of SPIEVol. 4690
2. Russell TP (2002) Science 297:9643. Spatz JP, Möller M, Noeske M,
Behm RJ, Pietralla M (1997)Macromolecules 30:3874
4. Hamley IW (1998) The Physics ofBlock Copolymers (Oxford:University Press)
5. Findenegg GH, Herminghaus S (1997)Curr Opin Coll Int Sci 2:301
6. Geoghegan M, Krausch G (2003) ProgPolym Sci 28:261
7. Binder K (1999) Advances in PolymerScience 138:1
8. Wagner AJ, Yeomans JM (1998) PhysRev Lett 80:1429
9. Müller-Buschbaum P (2003) J PhysCondens Matter 15:R1549
10. Müller-Buschbaum P, Bauer E,Wunnicke O, Stamm M (2005) J PhysCondens Matter 17:S363
11. Stamm M, Schubert DW (1995) AnnuRev Mater Sci 25:325
12. Stamm M (2000) In: Brown W,Mortensen K (eds) Scattering inPolymeric and Colloidal Systems(Amsterdam: Gordon and BreachScience Publisher)
13. Müller-Buschbaum P (2003) AnalBioanal Chem 376:3
14. Levine JR, Cohen JB, Chung YW(1991) Surf Sci 248:215
15. Salditt T, Metzger TH, Peisl J,Goerigk G (1995) J Phys D: ApplPhys 28:A236
16. Salditt T, Metzger TH, Peisl J,Reinker B, Moske M, Samwer K(1995) Europhys Lett 32:331
17. Naudon A, Babonneau D,Thiaudiere D, Lequien S (2000)Physica B 283:69
18. Smilgies DM, Busch P, Papadakis CM,Posselt D (2002) Synchrotron RadNews 5:35
19. Müller-Buschbaum P, Cubitt R,Petry W (2003) Langmuir 19:7778
20. Müller-Buschbaum P, Hermsdorf N,Roth SV, Wiedersich J, Cunis S,Gehrke R (2004) Spectrochimica ActaPart B: Atomic Spectroscopy 59:1789
21. Müller-Buschbaum P, Casagrande M,Gutmann J, Kuhlmann T, Stamm M,Cunis S, von Krosigk G, Lode U,Gehrke R (1998) Europhys Lett 42:517
22. Born M, Wolf E (1964) Principles ofOptics (Oxford: Pergamon Press)
23. James RW (1962) The OpticalPrinciples of the Diffraction of X-Rays(Woodbridge Connecticut: OxBowPress)
24. Tolan M (1999) X-ray scattering fromsoft-matter thin films (Berlin: Springertracts in modern physics, Vol. 148)
25. Holy V, Baumbach T (1994) PhysRev B 49:10668
26. Yoneda Y (1963) Phys Rev 131:201027. Lazzari R (2002) J Appl Cryst 35:40628. Babonneau D, Videnovic IR,
Garnier MG, Oelhafen P (2001) PhysRev B 63:195401
29. Chamard V, Bastie P, Le Bolloch D,Dolino G, Elkaim E, Ferrero C,Lauriat JP, Rieutord F, Thiaudiere D(2001) Phys Rev B 64:245416
30. Gibaud A, Hazra S, Sella C, Laffez P,Desert A, Naudon A, van Tendeloo G(2001) Phys Rev B 63:193407
31. Stemmer S, Li Y, Foran B, Lysaght PS,Streiffer SK, Fuoss P, Seifert S (2003)Appl Phys Lett 83:3141
32. Papadakis CM, Busch P, Posselt D,Smilgies DM (2004) Adv In SolidState Phys 44:327
33. Ryan AJ (2002) Nature Materials 1:834. Tanaka H (2001) J Phys Condens
Matter 13:463735. Walheim S, Böltau M, Mlynek J,
Krausch G, Steiner U (1997)Macromolecules 30:4995
36. Walheim S, Ramstein M, Steiner U(1999) Langmuir 15:4828
37. Flebbe T, Dünweg B, Binder K (1996)J Phys II 6:667
38. Karim A, Slawecki TM, Kumar SK,Douglas JF, Satija SK, Han CC,Russell TP, Liu Y, Overney R,Sokolov J, Rafailovich MH (1998)Macromolecules 31:857
39. Krausch G (1995) Mat Sci Eng Rep14:1
40. Wang J, Composto RJ (2003) InterfSci 11:237
41. Walheim S, Schäffer E, Mlyneck J,Steiner U (1999) Science 283:520
42. Fasolka MJ, Mayes AM (2001) AnnuRev Mater Res 31:323
43. Gutmann JS, Müller-Buschbaum P,Stamm M (1999) Farady Disc 112:285
44. Müller-Buschbaum P, Gutmann JS,Stamm M (1999) J Macromol Sci B38:577
45. Müller-Buschbaum P, Gutmann JS,Stamm M (2000) Macromolecules33:4886
46. Stenert M, Doring A, Bandermann F(2004) e-Polymers 15:1
47. Gehrke R (1992) Rev Sci Instrum63:455
48. Roth SV in preparation49. Müller-Buschbaum P, Roth SV,
Bauer E, Maurer E, Schlögl K,Gehrke R to be published

Progr Colloid Polym Sci (2006) 132: 33–40DOI 10.1007/2882_038© Springer-Verlag Berlin Heidelberg 2006Published online: 9 March 2006
Anatoli SergheiFriedrich Kremer Unexpected Preparative Effects
on the Properties of Thin Polymer Films
Anatoli Serghei () · Friedrich KremerInstitute for experimental physics I,University of Leipzig, Linnestr. 5,04103 Leipzig, Germanye-mail: [email protected]
Abstract Thin polystyrene filmsare prepared by spin-coating andannealed above the calorimetricglass transition temperature Tgalternatively in vacuum, in a purenitrogen atmosphere, in the presenceof water vapor or in ambient air.It is experimentally shown thatthese preparative conditions havea pronounced impact on the stabilityof the samples, on their surface
topography and on the molecularmobility. Our results are discussedwith respect to actual experiments.For thin polystyrene films annealed inhigh vacuum and measured in a purenitrogen atmosphere no Tg reductionsare found down to a thickness of20 nm.
Keywords Polymer mobility ·Confined polymers · Thin films
Introduction
The effects of geometrical confinement on the moleculardynamics of polymers together with the search for a deeperunderstanding of the glass transition phenomenon havestimulated the interest for the investigation of thin poly-mers films [1–31], a topic of technological importance, aswell. A multitude of linear polymers was studied (poly-styrene [1–7], polymethylmetacrylate [14–16], polyvinyl-acetate [16], polyisoprene [17], polydimethylsiloxane [18,19] etc.), and a variety of experimental techniques was em-ployed: ellipsometry, Brillouin light scattering, dielectricspectroscopy, neutron scattering, X-ray reflectometry. Onefocus represents the investigation of the polymer mobil-ity in thin films, a factor with manifold manifestations inphenomena like shifts of the glass transition temperature,dewetting, pattern formation, dynamics of polymers nearfree interfaces. Confinement effects on the glass transitionof thin PS films, detected for the first time one decadeago, are still intensively discussed in the literature. Whilea large body of data reports a reduction of the glass tran-sition temperature Tg in thin PS films [1–7], other studiesfind no indications of Tg shifts [20–27], even for filmthicknesses as small as ∼ 3 nm [20]. Unresolved issuesof dewetting, another phenomenon related to the mobility
of thin polymer films, are also controversial [28–30]. Bycomparing thin PS films annealed under different condi-tions, i.e. in vacuum, in a pure nitrogen atmosphere, in thepresence of water vapor or in ambient air, we show thatthese until now unconsidered factors have a pronouncedimpact on the properties of thin polymer films. Down toa thickness of 20 nm, no reductions of the glass transi-tion temperature Tg are detected by Broadband DielectricSpectroscopy and capacitive scanning dilatometry in thinpolystyrene films annealed in high vacuum and measuredin a pure nitrogen atmosphere.
Experimental
Broadband Dielectric Spectroscopy provides a direct ex-perimental access to the molecular relaxations of poly-mers over a broad frequency and temperature range. Itis also especially suitable for the investigation of thinpolymer films, because it does not suffer sensitivity loseswith decreasing sample amount. This technique does re-quire a special sample preparation for thin films, becauseof the need to have metal electrodes and good electri-cal contacts at both interfaces. Spin-coating, one of themost commonly employed methods for the preparation of

34 A. Serghei · F. Kremer
thin polymer films, has been successfully adapted for di-electric studies [3, 14, 17, 18]. Nevertheless, the resultingsample geometry, essential for a quantitative analysis ofthe dielectric data, has not been yet thoroughly charac-terized. This important factor is going to be addressed inthis paper, together with other important preparative as-pects as well: reproducibility of the sample preparation,thermal stability of thin polymer films, water adsorption,thickness determination, annealing. The polystyrene usedin this study for the preparation of thin films was pur-chased from PPS Polymer Standard Service GmbH. It hasa molecular weight of 700 000 g/mol and a polydispersityof 1.04.
Preparation of Thin Polymer Films
The preparation procedure is schematically illustrated inFig. 1. Glass plates of 1 cm × 1 cm × 1 mm, previouslycleaned in an ultra-sound alkaline bath, rinsed in pure ace-tone and dried under nitrogen flow, were used as supportsubstrates. After cleaning, aluminum electrodes (width0.5 mm, height 60 nm) were deposited on the glass sub-strate by thermal evaporation in high vacuum (10−6 mbar).Subsequently, thin polymer films were spin-coated fromsolution at a moderate spinning-rate (2000 rotations/min),to avoid possible chain breaking effects. The film thicknesswas adjusted by changing the concentration of the poly-mer in the solution. After spin-coating, the samples wereannealed at temperatures above the glass transition (i.e. Tg+50 K) in high vacuum (10−6 mbar) for at least 10 hours.The final step of the preparation procedure was the evapo-ration of the second aluminum counter-electrode on top ofthe polymer film.
Characterization of the Sample Geometry
Measurements by Atomic Force Microscopy (in tapping-mode, using a standard silicon tip with a radius of∼ 10 nm) of the surface topography of both the lower andthe upper interface (the surface of the aluminum elec-trode and that of the polymer film, respectively) revealeda typical root-mean square roughness of ∼ 3 nm or less
Fig. 1 Scheme illustrating the preparation of thin polymer films fordielectric studies
on micrometric domains (parameter Sq in Fig. 2a,b). Thedeviations of the real area of the rough interface from itscorresponding 2D projection did not exceed 2–3% (pa-rameter Sdr in Fig. 2a,b). The sample geometry for a filmthickness of ∼ 20 nm is illustrated in Fig. 2c, where theinterfaces represent linecuts in the above AFM images. Al-though the surface of the aluminum electrode might lookquite rough in Fig. 2c, it is in fact rather smooth if we con-sider the difference of three orders of magnitude betweenthe horizontal and the vertical scaling.
The half width of the thickness distribution, calculatedusing the geometrical profile measured by AFM, was typ-ically ∼ 4 nm (Fig. 3), this value representing the maincontribution to the error bars of the thickness determin-ation.
The deviations from parallel interfaces induced by theroughness were calculated in the manner illustrated in theinlet of Fig. 4: the tangent of the inclination angle is equalto the first derivative of the geometrical profile z = z(x),where z is the vertical coordinate and x the lateral one.The total deviation δ from parallel surfaces, defined as thedifference between the inclination angle of the upper andthe lower interface (δ = αupper −αlower), turned out to besmaller than one degree, which assured practically uniformelectrical fields between the electrodes.
Fig. 2 a Surface morphology (by AFM) of a PS film prepared byspin-coating (5 µm× 5 µm); b surface morphology (by AFM) ofan aluminum electrode prepared by thermal evaporation (5 µm×5 µm); Sq represents the root-mean-square roughness and Sdr theration between the real area of the rough surface and its corres-ponding 2D projection; c geometry of a thin film with an averagethickness of 20 nm; the interfaces represent linecuts in the AFMimages presented above
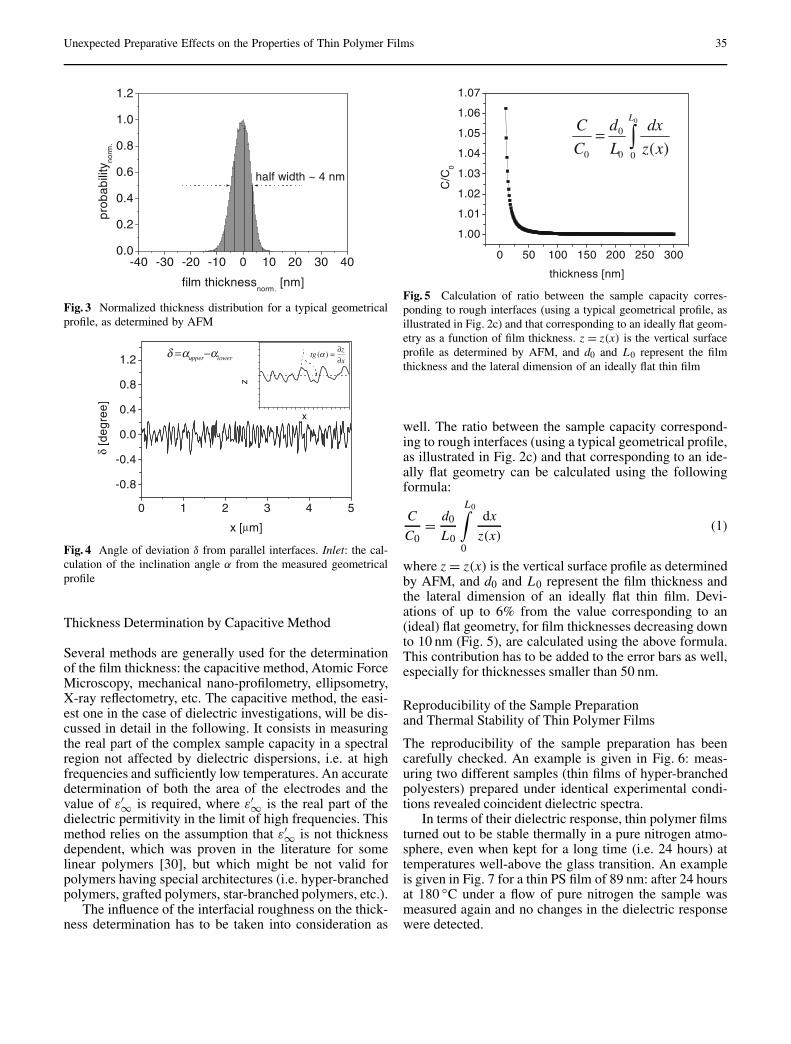
Unexpected Preparative Effects on the Properties of Thin Polymer Films 35
Fig. 3 Normalized thickness distribution for a typical geometricalprofile, as determined by AFM
Fig. 4 Angle of deviation δ from parallel interfaces. Inlet: the cal-culation of the inclination angle α from the measured geometricalprofile
Thickness Determination by Capacitive Method
Several methods are generally used for the determinationof the film thickness: the capacitive method, Atomic ForceMicroscopy, mechanical nano-profilometry, ellipsometry,X-ray reflectometry, etc. The capacitive method, the easi-est one in the case of dielectric investigations, will be dis-cussed in detail in the following. It consists in measuringthe real part of the complex sample capacity in a spectralregion not affected by dielectric dispersions, i.e. at highfrequencies and sufficiently low temperatures. An accuratedetermination of both the area of the electrodes and thevalue of ε′∞ is required, where ε′∞ is the real part of thedielectric permitivity in the limit of high frequencies. Thismethod relies on the assumption that ε′∞ is not thicknessdependent, which was proven in the literature for somelinear polymers [30], but which might be not valid forpolymers having special architectures (i.e. hyper-branchedpolymers, grafted polymers, star-branched polymers, etc.).
The influence of the interfacial roughness on the thick-ness determination has to be taken into consideration as
Fig. 5 Calculation of ratio between the sample capacity corres-ponding to rough interfaces (using a typical geometrical profile, asillustrated in Fig. 2c) and that corresponding to an ideally flat geom-etry as a function of film thickness. z = z(x) is the vertical surfaceprofile as determined by AFM, and d0 and L0 represent the filmthickness and the lateral dimension of an ideally flat thin film
well. The ratio between the sample capacity correspond-ing to rough interfaces (using a typical geometrical profile,as illustrated in Fig. 2c) and that corresponding to an ide-ally flat geometry can be calculated using the followingformula:
C
C0= d0
L0
L0∫
0
dx
z(x)(1)
where z = z(x) is the vertical surface profile as determinedby AFM, and d0 and L0 represent the film thickness andthe lateral dimension of an ideally flat thin film. Devi-ations of up to 6% from the value corresponding to an(ideal) flat geometry, for film thicknesses decreasing downto 10 nm (Fig. 5), are calculated using the above formula.This contribution has to be added to the error bars as well,especially for thicknesses smaller than 50 nm.
Reproducibility of the Sample Preparationand Thermal Stability of Thin Polymer Films
The reproducibility of the sample preparation has beencarefully checked. An example is given in Fig. 6: meas-uring two different samples (thin films of hyper-branchedpolyesters) prepared under identical experimental condi-tions revealed coincident dielectric spectra.
In terms of their dielectric response, thin polymer filmsturned out to be stable thermally in a pure nitrogen atmo-sphere, even when kept for a long time (i.e. 24 hours) attemperatures well-above the glass transition. An exampleis given in Fig. 7 for a thin PS film of 89 nm: after 24 hoursat 180 C under a flow of pure nitrogen the sample wasmeasured again and no changes in the dielectric responsewere detected.

36 A. Serghei · F. Kremer
Fig. 6 Dielectric loss vs. temperature at different frequencies, as in-dicated, for two thin films of hyper-branched polyesters of 27 nmand 28 nm
Fig. 7 Dielectric loss vs. temperature at different frequencies, as in-dicated, for a thin polystyrene film of 89 nm, before and after 24hours of annealing at 180 C in a pure nitrogen atmosphere
Annealing
The first annealing of each sample was carried out imme-diately after spin-coating in order to eliminate the solventand to equilibrate the thin polymer film. After evaporat-ing the aluminum counter-electrode and prior to dielectricmeasurements, a second annealing step was performed ina pure nitrogen atmosphere at temperatures above Tg forseveral hours in the cryostat of the dielectric spectrom-eter. An estimation of the required time was determinedby measuring the dielectric response of the sample duringannealing. An example is given in Fig. 8 for a thin filmof hyper-branched polyesters (17 nm thickness). The di-electric loss decreased steeply during the first few hoursof annealing at 200 C in a pure nitrogen atmosphere andreached a constant value after ∼ 10 hours. At this point, themeasurement sequence could be started, without exposingthe sample again to ambient air.
Fig. 8 Time dependence of the dielectric loss at 200 C and 0.3 Hzin a pure nitrogen atmosphere for a thin film of hyper-branchedpolyesters of 17 nm
Ambient Effects on the Propertiesof Thin Polymer Films: Water Adsorptionand Oxygen-Induced Chain Scissions
When adsorbed (from ambient air), water molecules mightact as plasticizers and alter the dynamics of polymers.Moreover, water has a strong dipole moment and, conse-quently, dielectric active relaxation processes, which couldpartially occlude significant parts of the dielectric spectraof interest. Special attention to this effect has to be paidwhen the dynamics of thin polymer films is investigated,for example in relation to phenomena like the glass transi-tion, dewetting, pattern formation, surface mobility etc.
Even if some polymers might be hydrophobic in thebulk, concerns about possible water adsorption effects inthin films are justified, because of the preponderant roleof the interface in confinement. For example, negligiblewater adsorption is reported in the handbook of polymersfor polystyrene in the bulk: 0.05% at 23 C and 50% rela-tive humidity. In spite of this, strong water adsorption-desorption effects were observed in thin polystyrene films:the dielectric loss decreased with more than one decadewhen a thin film was measured in a dry nitrogen atmo-sphere and after 2 hours of annealing at 135 C (Fig. 9,example for a film thickness of 223 nm). A pronounceddecrease of ε′ (∼ 20% at 1 Hz) was detected as well.
Conversely, on a time scale of minutes, both the realpart of the complex sample capacity (and correspondinglyε′) and the dielectric loss increased when a polystyrenethin film (20 nm) was replaced from a dry nitrogen at-mosphere and exposed to ambient water vapor at roomtemperature (Fig. 10).
Even more drastic effects were observed when suchan adsorption experiment was performed at temperaturesabove the glass transition (Fig. 11). A thin PS film of63 nm was kept at 180 C in vacuum (∼ 4 mbar). The realpart of the complex sample capacity, a parameter sensitive
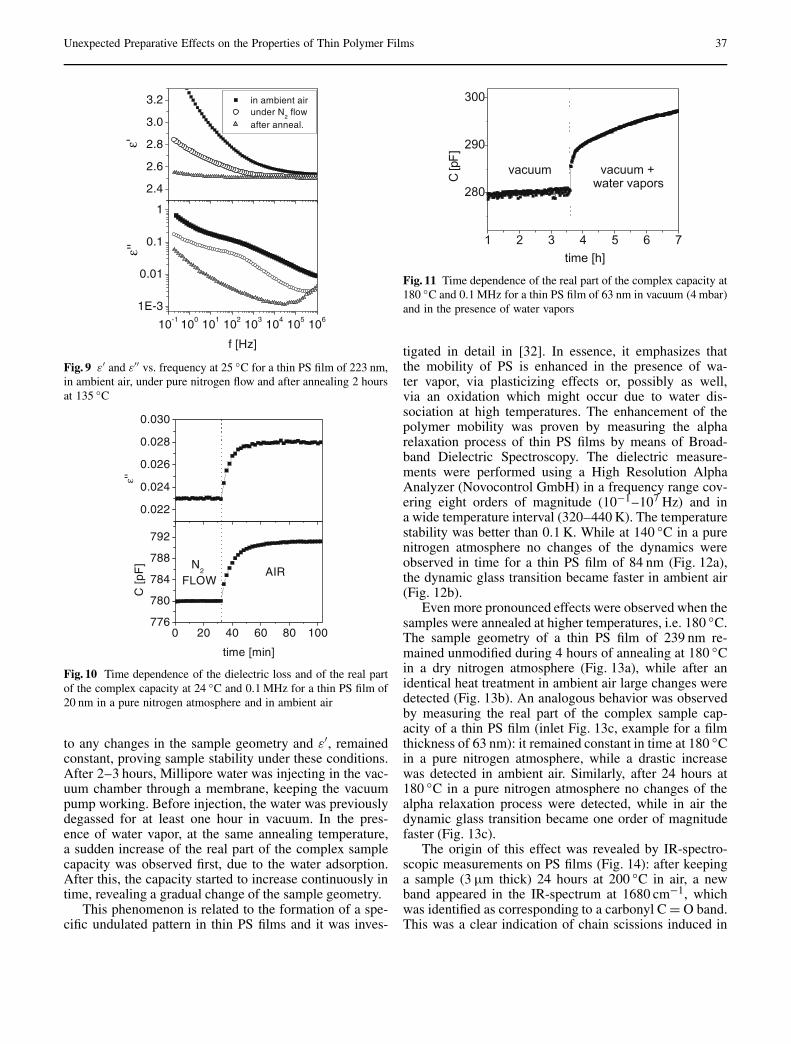
Unexpected Preparative Effects on the Properties of Thin Polymer Films 37
Fig. 9 ε′ and ε′′ vs. frequency at 25 C for a thin PS film of 223 nm,in ambient air, under pure nitrogen flow and after annealing 2 hoursat 135 C
Fig. 10 Time dependence of the dielectric loss and of the real partof the complex capacity at 24 C and 0.1 MHz for a thin PS film of20 nm in a pure nitrogen atmosphere and in ambient air
to any changes in the sample geometry and ε′, remainedconstant, proving sample stability under these conditions.After 2–3 hours, Millipore water was injecting in the vac-uum chamber through a membrane, keeping the vacuumpump working. Before injection, the water was previouslydegassed for at least one hour in vacuum. In the pres-ence of water vapor, at the same annealing temperature,a sudden increase of the real part of the complex samplecapacity was observed first, due to the water adsorption.After this, the capacity started to increase continuously intime, revealing a gradual change of the sample geometry.
This phenomenon is related to the formation of a spe-cific undulated pattern in thin PS films and it was inves-
Fig. 11 Time dependence of the real part of the complex capacity at180 C and 0.1 MHz for a thin PS film of 63 nm in vacuum (4 mbar)and in the presence of water vapors
tigated in detail in [32]. In essence, it emphasizes thatthe mobility of PS is enhanced in the presence of wa-ter vapor, via plasticizing effects or, possibly as well,via an oxidation which might occur due to water dis-sociation at high temperatures. The enhancement of thepolymer mobility was proven by measuring the alpharelaxation process of thin PS films by means of Broad-band Dielectric Spectroscopy. The dielectric measure-ments were performed using a High Resolution AlphaAnalyzer (Novocontrol GmbH) in a frequency range cov-ering eight orders of magnitude (10−1–107 Hz) and ina wide temperature interval (320–440 K). The temperaturestability was better than 0.1 K. While at 140 C in a purenitrogen atmosphere no changes of the dynamics wereobserved in time for a thin PS film of 84 nm (Fig. 12a),the dynamic glass transition became faster in ambient air(Fig. 12b).
Even more pronounced effects were observed when thesamples were annealed at higher temperatures, i.e. 180 C.The sample geometry of a thin PS film of 239 nm re-mained unmodified during 4 hours of annealing at 180 Cin a dry nitrogen atmosphere (Fig. 13a), while after anidentical heat treatment in ambient air large changes weredetected (Fig. 13b). An analogous behavior was observedby measuring the real part of the complex sample cap-acity of a thin PS film (inlet Fig. 13c, example for a filmthickness of 63 nm): it remained constant in time at 180 Cin a pure nitrogen atmosphere, while a drastic increasewas detected in ambient air. Similarly, after 24 hours at180 C in a pure nitrogen atmosphere no changes of thealpha relaxation process were detected, while in air thedynamic glass transition became one order of magnitudefaster (Fig. 13c).
The origin of this effect was revealed by IR-spectro-scopic measurements on PS films (Fig. 14): after keepinga sample (3 µm thick) 24 hours at 200 C in air, a newband appeared in the IR-spectrum at 1680 cm−1, whichwas identified as corresponding to a carbonyl C = O band.This was a clear indication of chain scissions induced in

38 A. Serghei · F. Kremer
Fig. 12 Dielectric loss vs. frequency at 140 C for a thin PS film of84 nm in a pure nitrogen atmosphere (a) and in air (b)
Fig. 13 a Optical image (top view) of the sample geometry fora thin PS film of 239 nm after 4 hours at 180 C in a pure nitro-gen atmosphere (∼ 1 mm×1 mm); b the same sample after 4 hoursat 180 C in air (∼ 1 mm× 1 mm); c the relaxation time of the dy-namic glass transition vs. inverse temperature for a thin PS film of63 nm after different annealing times at 180 C in a pure nitrogenatmosphere and in air. Inlet: time dependence of the sample cap-acity at 180 C and 0.1 MHz in a pure nitrogen atmosphere and inair
the presence of oxygen, causing a decrease of the averagemolecular weight, which, according to the Flory–Hugensrelation, has as a consequence a decrease of the glass tran-sition temperature Tg.
Fig. 14 IR-spectra for a PS film of 3 µm as prepared and after 24hours at 200 C in ambient air
Dynamic Glass Transitionin Thin Polystyrene Films
For thin polystyrene films annealed for 12 hours at 150 Cin high vacuum (10−6 mbar) and measured in a pure ni-trogen atmosphere the dynamic glass transition was char-acterized using two experimental techniques: capacitivescanning dilatometry and Broadband Dielectric Spec-troscopy. Data from the first method are presented inFig. 15a, showing the real part of the complex capacity at1 MHz as a function of temperature for a thin PS film of33 nm.
Fig. 15 a Real part of the complex capacity measured at 1 MHz fora thin PS film of 33 nm as a function of temperature; b and c thecorresponding first and second numeical derivative, respectively

Unexpected Preparative Effects on the Properties of Thin Polymer Films 39
Fig. 16 Glass transition temperature of thin PS films measured bycapacitive scanning dilatometry as a function of film thickness
The kink observed around 367 K corresponds toa change of the thermal expansion coefficient froma glassy to a liquid-like state and, by that, marks the pos-ition of the glass transition temperature. Usually, the Tg iscalculated as a intersection point between two linear de-pendencies. Nevertheless, a more convenient method isthe calculation of the first and second numerical deriva-tives of the experimental data (Fig. 15b,c). In this case, theTg is defined as the minimum position in the second nu-merical derivative plot (Fig. 15c). Down to a thickness of20 nm, no shifts of Tg as determined by capacitive scan-ning dilatometry were found (Fig. 16).
Similar results were obtained by Broadband DielectricSpectroscopy (Fig. 17): no shifts in the relaxation time ofthe dynamic glass transition were detected, even for PSfilms as thin as 20 nm.
Fig. 17 Relaxation rate of the dynamic glass transition vs. inversetemperature for different film thicknesses, as indicated. Inlet: di-electric loss vs. temperature at 31 kHz showing the dynamic glasstransition of thin PS films for different film thicknesses, as indicated
Conclusions
In conclusion, we show that thin polymer films are ex-tremely sensitive to ambient conditions, i.e. to the presenceof oxygen and water vapor. Without special experimentalprecautions, plasticizers effects and chain scission in thepresence of oxygen affect the measured parameters. Wehave shown that these preparative conditions have a pro-nounced impact on the molecular mobility, on the glasstransition temperature Tg, and on the surface topography,after annealing at elevated temperatures. Using two experi-mental techniques, no shifts of the glass transition in thinpolystyrene films were detected down to a thickness of20 nm for samples annealed in high vacuum and measuredin a pure nitrogen atmosphere.
Acknowledgement The authors thank B. Voit, K.-J. Eichhorn andY. Mikhailova for providing the hyperbranched polyesters.
References1. Keddie JL, Jones RAL, Corry RA
(1994) Europhys Lett 27:592. Forrest JA, Dalnoki-Veress K,
Dutcher JR (1997) Phys Rev E56:5705
3. Fukao K, Miyamoto Y (2000) PhysRev E 61:1743
4. Kawana S, Jones RAL (2001) PhysRev E 63:021501
5. Forrest JA (2002) Eur Phys J E 8:2616. Ellison CJ, Torkelson JM (2003)
Nature Mat 2:6957. Fryer DS, Nealey PF, Pablo JJ (2000)
Macromolecules 33:64398. Herminghaus S, Jacobs K, Seemann K
(2001) Eur Phys J E 5:531
9. de Gennes PG (2000) Eur Phys J E2:201
10. Torres JA, Nealey PF, Pablo JJ (2000)Phys Rev Lett 85:3221
11. Long D, Lequeux F (2001) EurPhys J E 4:371
12. Anderson PW (1995) Science267:1615
13. Binder K, Baschnagel J, Kob W,Paul W (1999) Physics World 12:54
14. Hartmann L, Gorbatschow W,Hauwede J, Kremer F (2002) EurPhys J E 8:145
15. Grohens Y, Hamon L, Reiter G,Soldera A, Holl Y (2002) EurPhys J E 8:217
16. Fukao K, Uno S, Miyamoto Y,Hoshino A, Miyaji H (2001) PhysRev E 64:051807
17. Serghei A, Kremer F (2003) Phys RevLett 91:165702
18. Hartmann L, Kremer F, Pouret P,Léger L (2003) J Chem Phys118:6052
19. Kremer F, Hartmann L, Serghei A,Pouret P, Léger L (2003) Eur Phys J E12:139
20. Efremov MYu, Olson EA, Zhang M,Zhang Z, Allen LH (2003) Phys RevLett 91:085703
21. Efremov MYu, Olson EA, Zhang M,Zhang Z, Allen LH (2004) 37:4607

40 A. Serghei · F. Kremer
22. Kim H, Rühm A, Lurio LB, Basu JK,Lal J, Lumma D, Mochrie SGJ,Sinha SK (2003) Phys Rev Lett90:068302
23. Weber R, Zimmermann K-M,Tolan M, Stettner J, Press W,Seeck OH, Erichsen J,Zaporojtchenko V, Strunskus T,Faupelet F (2001) Phys Rev E64:061508
24. Ge S, Pu Y, Zhang W, Rafailovich M,Sokolov J, Buenviaje C,Buckmaster R, Overney (2000) PhysRev Lett 85:2340
25. Liu Y, Russel TP, Samant MG, Stohr J,Brown HR, Cossy-Favre A, Diaz J(1997) Macromolecules 30:7768
26. Xie L, deMaggio GB, Frieze WE,DeVries J, Gidley DW, Hristov HA,Yee AF (1995) Phys Rev Lett 74:4947
27. Lupascu V, Huth H, Schick C,Wübbenhorst M (2005)Thermodinamica Acta 432:222
28. Thiele U (2003) Eur Phys J E 12:40929. Tsui OKC, Wang YG, Zhao H, Du B
(2003) Eur Phys J E 12:41730. Green PF, Ganesan V (2003) Eur
Phys J E 12:44931. Wallace WE, Beck Tan NC, Wu WL,
Satija S (1998) J Chem Phys 108:379832. Serghei A, Huth H, Schellenberger M,
Schick C, Kremer F (2005) PhysRev E 71:061801

Progr Colloid Polym Sci (2006) 132: 41–47DOI 10.1007/2882_030© Springer-Verlag Berlin Heidelberg 2006Published online: 16 March 2006
Michael Osterhold Characterizing Physical Propertiesof Coating Surfaces –Mar Resistance and Surface Structure
Michael Osterhold ()DuPont Performance CoatingsGmbH & Co. KG, Christbusch 25,D-42285 Wuppertal, Germanye-mail:[email protected]
Abstract Mar resistance and surfacestructure (appearance) are two of themost important physical propertiesto characterize the mechanicaland optical quality of a coatingsystem. In this paper the relevantmeasuring techniques are discussedusing typical examples reflectingthe current status of applicationin the automotive and coatingsindustry. Especially the techniquesto determine the mar resistancewere recently improved (single
scratch tests) giving additional resultsin characterizing the mechanicalbehavior of coatings. In addition,surface structure measurements oncoatings for plastics are shown.These investigations are of particularinterest due to the fact that plasticsare more and more used as exteriorcar parts.
Keywords Coatings · Scratch ·Mar Resistance · Surface Structure ·Appearance
Introduction
In addition to good flow (resulting in surface structure)and high gloss, resistance to mechanical damage – bystone chippings and scratching – is particularly importantin order to obtain a high-quality appearance for clearcoats.The brushes and dirt in a car wash, for example, producescratches measuring only a few micrometers in width andup to several hundred nanometers in depth.
With this background several measuring methods arecurrently being discussed in the automotive and paint in-dustry with the objective to obtain a clear characteriza-tion of the scratch resistance of clearcoats. Especially pro-cedures that create a single scratch have recently beendeveloped (micro or nano scratch method) [1–8]. Thesemethods are different from more practically oriented pro-cedures that are based on relatively simple methods to tryto test or even come close to reality (e.g. car wash brushmethod).
One of the best suited methods to determine the surfacestructure (smoothness of the surface) is based on mechani-cal profilometry. In the past, it was used mainly to examinethe influence of sheet substrate structures on the paint sur-
face [9–19]. In order to simulate the visual impressionobtained from optical inspection of surface structures, theGerman company Byk-Gardner developed the so-called“wave-scan DOI”. Here, the measuring principle is basedon the modulation of the light of a small laser diode re-flected by the surface structures of the sample. In this papersome methods for characterizing surface structure wereapplied to coatings for plastics.
Characterization of the Mar Resistance
Micro-Scratch Experiments
In micro-scratch experiments single scratches of character-istic and realistic phenotype can be generated. The inden-tation depth depends on the applied force and the inden-tation body (indenter). Indentation depth is usually in therange of 1 µm and smaller. A diamond indenter (radius atthe peak 1–2 µm) is pushed onto the sample surface apply-ing a defined force to generate the scratch while the sampleis moved in a linear direction at constant velocity under-neath the indenter (see Fig. 1). The applied normal force

42 M. Osterhold
Fig. 1 The principle of single-scratch tests
can be constant (1) or progressive (2) during the scratchingprocedure.
Basically it is possible to measure the tangential forcesand the indentation depth during the scratching procedure.Deformations or damages can be observed with a micro-scope or additionally with a video camera. The profileof the generated scratches can be measured using AFMtechnology. In combination with the parameters measuredduring the scratching procedure it is possible to calculatephysical parameters which allow conclusions about theelastic and plastic deformation behavior and the fracturebehavior.
Tests with Progressive Load. In this context a method wasdeveloped in the DuPont Marshall Lab. (Philadelphia) thatgenerates and evaluates a single scratch on a surface (nano-scratch method). This method is used for tests along withdevelopment work for clearcoats and it is constantly beingimproved.
A commercial instrument by the Swiss company CSEM(now CSM) was tested in the course of a project at theResearch Institute for Pigments and Paints (Forschungs-institut für Pigmente und Lacke e.V. (FPL)). This instru-ment is based on the method developed at the DuPontMarshall Lab. Objective of the project – where manufac-turers of paints, raw materials and automobiles workedtogether – was the evaluation of the CSEM nano-scratch-tester regarding reproducibility, accuracy and applicabilityunder the aspect of a realistic determination of scratch re-sistance.
The key point in this method is the determination ofthe critical load where first irreversible cracks or fracturesare generated and which therefore indicates the transitionfrom plastic deformation to significant/lasting damages.For that, the normal load is constantly increased and in-dentation depth and tangential load are simultaneouslyrecorded. The transition from plastic deformation to thefracture range is indicated e.g. by unsteadiness or fluctua-tions in the detected load flow and the indentation depth.This transition range can also be evaluated by additional
Fig. 2 AFM (top) and microscopical (light microscope) images(bottom) of cracks in different coating systems (A acrylate/melamine,B acrylate/isocyanate, C elast. melamine system)
optical or AFM analysis. As a typical dimension besidesthe critical load it is common to determine the residualindentation depth after scratching – typically at a normalload of 5 mN – in the range of plastic deformation.
A scratch experiment consits of three main steps (ex-perimental procedure):
• Prescan with scanning the surface at minimum load todetermine the level zero.
• Increasing the load up to maximum load to detect thecritical load = fracture threshold.
• Postscan at minimum load to determine the residualdepth.
Depending on the clearcoat system different values forcritical load and scratch profile can be observed – espe-cially in the transition range. Figure 2 shows the transitionranges of three so-called public domain samples (measure-ments by FPL).
The top pictures show AFM pictures of the scratchridge itself where cracks are clearly visible. The bottom
Fig. 3 Permanent deformation (scratch depth) as a function of crit-ical load

Characterizing Physical Properties of Coating Surfaces – Mar Resistance and Surface Structure 43
Fig. 4 Plastic resistance and fracture resistance (= critical load) fortypical coating systems
pictures are taken with a microscope at a magnificationfactor of app. 1000.
Critical load and indentation depth at 5 mN are the pa-rameters printed as a function of each other to evaluate thescratch resistance (see Fig. 3). A good scratch resistanceis the result of high values for the critical load when thevalues for residual indentation depth are low.
If the determined indentation depth at 5 mN is used tocalculate the ratio of load (5 mN) and depth as a measurefor plastic resistance, the result for typical 1 K, 2 K andUV systems is the correlation [20] shown in Fig. 4. It hasto be noted that in comparison with Fig. 3 the reciprocalvalue of the indentation depth is actually plotted on they-axis. Therefore, a good scratch resistance is the result ofhigh values for the critical load and also high values for theplastic resistance.
Dynamic Mechanical Analysis
For certain clearcoat systems a partial healing of scratchescan be observed on the time scale. In literature this isknown as the reflow effect [21]. Thermal relaxation phe-nomena may be used for a physical explanation of thiseffect. In connection with scratch resistance the cross-linking density of clearcoats is also a decisive factor.Meanwhile, dynamic mechanical analysis (DMA) hasbeen established as a method to determine cross-linkingdensity [21–23].
Several ranges can be characterized when observingthe behavior of the storage modulus E ′ as a function oftemperature. The glass transition range is followed by therubber elastic range, which can be more or less distinct de-pending on the degree of cross-linking. In this range thevalue of the storage module E ′ is connected with the cross-linking density. The value of E ′ at the local minimum isoften chosen as a quantitative measure for cross-linkingdensity. The clearcoats were examined by submitting freefilms to a tension test. A DMA 7 instrument by PerkinElmer was used for these tests. In this context, measure-ments of paint systems are described e.g. in [23].
Fig. 5 Correlation of scratch resistance (Amtec values) and cross-linking density (storage modulus E´)
Figure 5 shows a comparison of the results of DMAanalysis and values obtained in car wash simulations.
The clearcoat to be tested (applied on a standard metalsheet) is moved back and forth 10 times under a rotatingcar wash brush. The brush is sprayed with washing waterduring the cleaning procedure. Because the metal sheetsused for the test are clean, a defined amount of quartz pow-der is added to the washing water as a replacement forstreet dirt (Amtec method). A gloss measurement in 20-geometry is used to evaluate the scratch resistance. Theinitial gloss and the gloss after the cleaning procedure aremeasured. The percentage of residual gloss with regard tothe initial gloss is a measure for scratch resistance. Highvalues indicate good scratch resistance [8].
A clear correlation between E ′ as a measure for cross-linking density and the value for scratching can be ob-served. The quality of the scratching level (high residualgloss) increases with increasing cross-linking density [24].
Determination of the Surface Structure
Methods
Mechanical Surface Characterization. The surface pro-files were measured by mechanical profilometry usinga Hommeltester (Hommel, Germany). For all measure-ments, a dual-skid tracing system with a skid distance of10 mm or a so-called datum system both with a diamondtip radius of 5 µm were used. The vertical resolution ofthis mechanical profilometric system is approx. 0.01 µm.The surface profiles were recorded over a scan lengthof 48 or 15 mm and the detected signals were stored ina computer after digitizing. The evaluation of mechanicalprofile measurements according to typical roughness pa-rameters – e.g. average roughness Ra – gives an integratedinformation about the surface structure. In comparisonwith roughness parameters, Fourier techniques (FFT) yielda more detailed characterization of the surface structure.It is also possible to detect the surface structure pseudo-3-dimensional. The sample is moved by a precise positioning

44 M. Osterhold
table for a small distance between two line scans. A cutoff wavelength of 8 mm for a scan length of 48 mm wasused to separate between roughness and waviness profile(cut off 2.5 mm for 15 mm scan length).
In a so-called autopower spectrum, the intensity (squareof amplitudes) of the calculated sine/cosine waves repre-senting the surface profile is plotted versus the correspond-ing wave number (reciprocal wavelength).
For wavelengths from 10 to 1 mm (integral 1, longwaviness) and from 1 to 0.1 mm (integral 2, short wavi-ness), the intensities of the autopower spectra are added upand used for further evaluation of the surface structures.
Optical Surface Characterization.
wave-scan. To simulate the visual impression obtainedfrom optical inspection of surface structures, the Germancompany Byk-Gardner developed the so-called “wave-scan DOI”. The measuring principle is based on the de-tection of the modulation of the light of a small laserdiode reflected by the surface structures of the sample.The laser light shines on the surface at an angle of 60,and the reflected light is detected at the gloss angle (60opposite). During the measurement, the “wave-scan” ismoved across the sample surface over a scan length ofapprox. 10 cm, with a data point being recorded every0.027 mm. The signal is divided into 5 wavelength rangesin the range of 0.1 to 30 mm and computed by mathe-matical filtering. For each of the 5 ranges a characteristicvalue (Wa 0.1–0.3 mm, Wb 0.3–1.0 mm, Wc 1.0–3.0 mm,Wd 3.0–10 mm, We 10–30 mm) as well as typical wave-scan-values longwave (LW, approx. 1–10 mm), shortwave(SW, approx. 0.3–1 mm) were calculated. Low wave-scan-values means a smooth surface structure. Additionallya LED light source is installed in the wave-scan DOI andilluminates the surface under 20 after passing an aper-ture. The scattered light is detected and a so-called dull-ness value (du, < 0.1 mm) is measured. By using the threevalues of the short wave range Wa, Wb and du a DOI valueis calculated. Here a high value means a smooth, shiny sur-face.
Investigations on Plastics Coatings
Investigations on plastics coatings are of special interest toachieve a similar structure development on a painted carnot depending on the different substrate materials (steel orplastics) used. Against this background parameters influ-encing the surface of plastics parts are becoming recentlymore important.
Measurements on Reinforced Plastics (Structure Effect).Polymeric substrates (Poly-butylterephthalate PBT) withdifferent amount of glass fibers were painted with a typ-ical coating system for plastics. The complete coatings
Fig. 6 Measuring values of the coatings in dependence on the fibercontent
Fig. 7 Comparison FFT (arb. units) and wave-scan values
were measured by wave-scan and mechanical profilome-try [25]. Optical and mechanical measurements (Ra) showboth the same trend, an increasing measuring value ofstructure for an increasing amount of glass fiber (GF) inthe PBT (Fig. 6). The same correlation was found by usingthe integral-values of the FFT (Fig. 7).
In addition to the effect of the amount of fiber con-tent also a dependence on the type of the used fiber canbe observed in a different example (Fig. 8, [26]). In thisinvestigation it was possible to carry out the wave-scanmeasurements directly on the unpainted surfaces.
This effect is also demonstrated in Fig. 9 showinga comparison of 2 substrates with high and low surfacestructure. The amplitude of the structures is reduced, butthe basic structure of the substrate is partially transferredthrough each single coating layer and influences finallythe topcoat appearance. These results are very importantdue to the effect, that the substrate structure clearly influ-ences the final coating structure. Based on surface struc-ture measurements a preselection of plastics substrates canbe done to obtain an optimal structure (smoothness) of thecoating system applied.
Temperature Effect on Reinforced Plastics. Often, fibersand polymer matrix have different coefficients of ther-mal expansion. After painting the liquid coating flows

Characterizing Physical Properties of Coating Surfaces – Mar Resistance and Surface Structure 45
Fig. 8 Measurement of substrate structure (same polymer matrix)
off to a smooth surface equalizing structures of the sub-strate. During the drying process the polymer matrix isexpanding more than the fibers. After cross-linking thesolid coating is a duroplastic and not longer able to flow.Directly after taking the plastics parts out of the oventhe coated surface looks well. But after cooling downan inverse image of the warm phase is seen as topcoatstructure.
This physical behavior of the plastics is very import-ant due to the fact that in practice the steel car body and
Fig. 9 Comparison of two substrates and coating layers (mech. profilometry, roughness profiles, scan length 48 mm, y-scale ±2 µm)
the plastics exterior parts are connected at different stepsof the painting process (and therefore at different tempera-tures loads, off-line, on-line, in-line).
Figure 10 shows this effect. At the left side the to-pography and a line scan of the uncoated fiber reinforcedmaterial is shown. At the right side of Fig. 10 the rough-ness of the clearcoat, coated directly on the substrate anddried under varying conditions is represented. The higherdrying temperature causes a more distinct surface struc-ture.
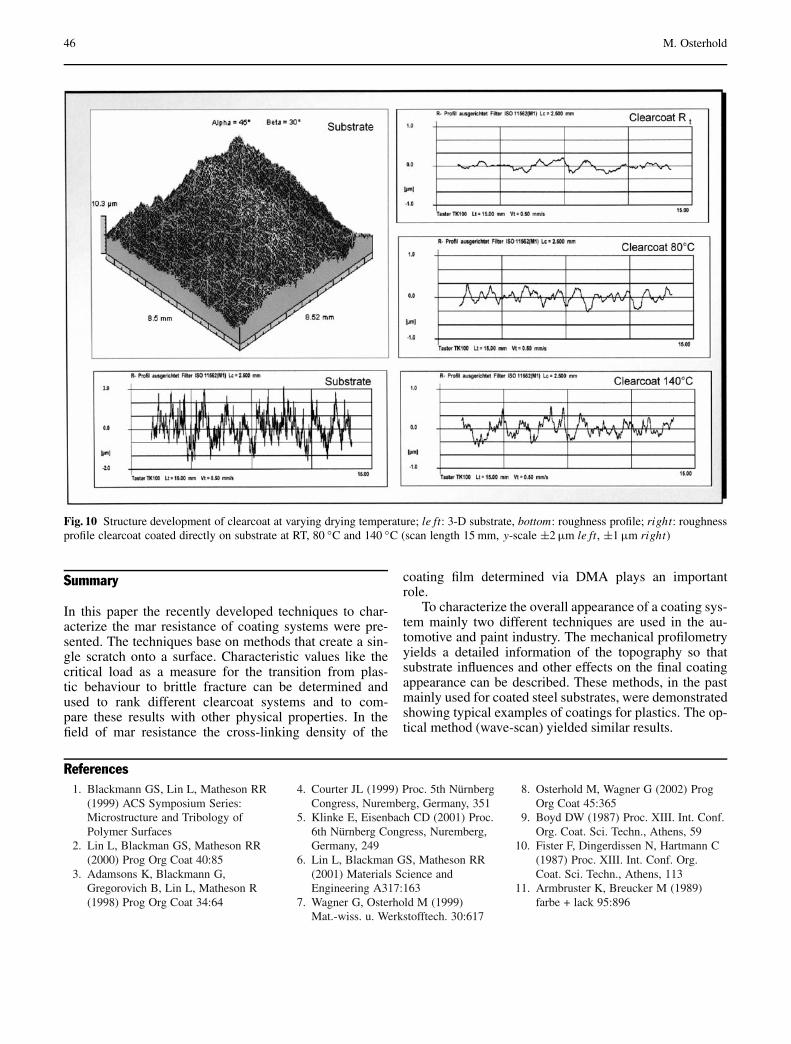
46 M. Osterhold
Fig. 10 Structure development of clearcoat at varying drying temperature; le ft: 3-D substrate, bottom: roughness profile; right: roughnessprofile clearcoat coated directly on substrate at RT, 80 C and 140 C (scan length 15 mm, y-scale ±2 µm le ft, ±1 µm right)
Summary
In this paper the recently developed techniques to char-acterize the mar resistance of coating systems were pre-sented. The techniques base on methods that create a sin-gle scratch onto a surface. Characteristic values like thecritical load as a measure for the transition from plas-tic behaviour to brittle fracture can be determined andused to rank different clearcoat systems and to com-pare these results with other physical properties. In thefield of mar resistance the cross-linking density of the
coating film determined via DMA plays an importantrole.
To characterize the overall appearance of a coating sys-tem mainly two different techniques are used in the au-tomotive and paint industry. The mechanical profilometryyields a detailed information of the topography so thatsubstrate influences and other effects on the final coatingappearance can be described. These methods, in the pastmainly used for coated steel substrates, were demonstratedshowing typical examples of coatings for plastics. The op-tical method (wave-scan) yielded similar results.
References1. Blackmann GS, Lin L, Matheson RR
(1999) ACS Symposium Series:Microstructure and Tribology ofPolymer Surfaces
2. Lin L, Blackman GS, Matheson RR(2000) Prog Org Coat 40:85
3. Adamsons K, Blackmann G,Gregorovich B, Lin L, Matheson R(1998) Prog Org Coat 34:64
4. Courter JL (1999) Proc. 5th NürnbergCongress, Nuremberg, Germany, 351
5. Klinke E, Eisenbach CD (2001) Proc.6th Nürnberg Congress, Nuremberg,Germany, 249
6. Lin L, Blackman GS, Matheson RR(2001) Materials Science andEngineering A317:163
7. Wagner G, Osterhold M (1999)Mat.-wiss. u. Werkstofftech. 30:617
8. Osterhold M, Wagner G (2002) ProgOrg Coat 45:365
9. Boyd DW (1987) Proc. XIII. Int. Conf.Org. Coat. Sci. Techn., Athens, 59
10. Fister F, Dingerdissen N, Hartmann C(1987) Proc. XIII. Int. Conf. Org.Coat. Sci. Techn., Athens, 113
11. Armbruster K, Breucker M (1989)farbe + lack 95:896

Characterizing Physical Properties of Coating Surfaces – Mar Resistance and Surface Structure 47
12. Nakajima T, Yoshida Y, Miyoshi Y,Azami T (1991) Proc. XVII. Int. Conf.Org. Coat. Sci. Techn., Athens, 227
13. Geier W, Osterhold M, Timm J (1993)Metalloberfläche 47:30
14. Bastawros AF, Speer JG, Zerafa G,Krupitzer RP, SAE Technical PaperSeries 930032
15. Timm J, Armbruster K, Osterhold M,Hotz W (1994) Bänder, Bleche, Rohre,35, No. 9:110
16. Osterhold M, Hotz W, Timm J,Armbruster K (1994) Bänder, Bleche,Rohre, 35, No. 10:44
17. Osterhold M (1996) Prog Org Coat27:195
18. Osterhold M (1998) Mat.-wiss. u.Werkstofftech. 29:131
19. Deutscher O, Armbruster K (2003),Proc. 3rd Stahl-Symposium,Düsseldorf, Germany
20. Dössel KF (2001) SURCAR, Cannes,France
21. Gräwe R, Schlesing W, Osterhold M,Flosbach C, Adler HJ (1999) Europ.Coat. Journal, No. 3:80
22. Schlesing W (1993) farbe + lack,99: 918
23. Schlesing W, Buhk M, Osterhold M(2004) Prog Org Coat 49:197
24. Frigge E (2000) farbe + lack 106, No.7:78
25. Stegen H, Buhk M, Armbruster K(2002) Paper TAW Seminar“Kunststofflackierung – SchwerpunktAutomobilindustrie”, Wuppertal,Germany
26. Armbruster K, Stegen H (2004) Proc.DFO Congress “Kunststofflackierung”,Aachen, Germany, 78

Progr Colloid Polym Sci (2006) 132: 48–53DOI 10.1007/2882_041© Springer-Verlag Berlin Heidelberg 2006Published online: 8 March 2006
Victoria AlbrechtAndreas JankeAstrid DrechslerGert SchubertErno NémethFrank Simon
Visualization of Charge Domainson Polymer Surfaces
Victoria Albrecht · Andreas Janke ·Astrid Drechsler · Frank Simon ()Leibniz Institute of Polymer ResearchDresden, Hohe Straße 6, 01069 Dresden,Germanye-mail: [email protected]
Gert Schubert · Erno NémethInstitute of Mechanical Process andReprocess Engineering, FreibergUniversity of Mining and Technology,Agricolastraße 1, 09596 Freiberg, Germany
Erno NémethSKZ Süddeutsches Kunststoff-Zentrum,Friedrich-Bergius-Ring 22,97076 Würzburg, Germany
Abstract The tribo-electric chargingof polymers is widely known andapplied in many technical processes.However, the molecular and elec-tronic reasons for this phenomenonare not fully understood. In a formerwork we showed that the tribo-electric charging of polymer particlescan be described by their electronpair acceptor and donator properties.But polymer charging cannot befully explained on a molecularlevel. During the collision of twoparticles expanded areas come intocontact and an enormous number ofmolecules is involved in the chargeformation process. In the presentstudy, the lateral distribution ofcharges and their dissipation overthe time were investigated using two
electric force microscopy techniques(surface potential imaging modeand electric force imaging mode).The recorded images show thatoppositely charged domains existon polymer surfaces side by side.The dissipation of deposited chargesdepends on the electronic propertiesof the polymer. Also water adsorbedfrom the surrounding atmosphereor incorporated in the polymer bulkhas a great influence on the chargestability.
Keywords Atomic forcemicroscopy · Charge dissipation ·Charge domains · Electric chargeson polymer surfaces · Electric fieldimaging mode · Surface potentialimaging mode
Introduction
Most polymers have a low electrical conductivity. Onecommonly known and often observed physical phe-nomenon is the electrical charging of those insulatormaterials. In the 18th century, the electrical charging ofamber was an object of scientific interest and public per-formances showed the electrostatic effects. Hence, theGreek name of amber ′HΛEKTPON (electron) is theorigin of all names related to electron, electricity, elec-tronics and so on. Today, the electrical charging is usedin innumerable technical processes and technologies, likeelectro-photography [1], electrostatic filtration as well asflocculation [2, 3] and electrostatic coating by means ofdye particles [4]. Technical processes were developed toseparate sodium and potassium chloride crystals in a scale
of thousands of tons per year [5]. And in our daily workwe do not want to miss the electrostatic phenomena forcopying and printing processes [6]. In contrast to the com-mon publicity and wide use of electrical charging effects,the electronic and molecular reasons of the observed phe-nomenon are largely unknown.
In his phenomenological study [1], Brück ordereda number of polymers in a row describing their affinityto become positively or negatively charged when rubbedwith each other. Brück’s row and other comparable rowsfirst demonstrated the fundamental relationship betweenthe chemical structure of a polymer and its tribo-electricalcharging properties. In a former work [2] we followed thatidea and showed that the tribo-electrical charging of twopolymer species charged in a fluidized bed clearly dependson the affinity of the polymer surface to take up electron

Visualization of Charge Domains on Polymer Surfaces 49
pairs (electron pair acceptor properties) or provide electronpairs (electron pair donator properties). In our study [3]we observed that particles of the same polymer speciescan be oppositely charged (bi-polar charging) in a fluidizedbed where all sides were lead with the polymer to pre-vent polymer particle/metal contacts. Therefore it can beconcluded that functional groups of the polymer may actboth as an electron pair donator and an electron pair accep-tor producing positive and negative charges on the particlesurface.
In reality, the charging of polymer particles cannot bedescribed only by interactions between single molecules orfunctional groups. The interacting surface must be consid-ered as an expanded area containing an enormous numberof molecules with the same chemical constitution and thesame functional groups. The non-conductivity of the poly-mer prevents a flux and a charge compensation betweenthe ionised sites. In our study [3] we found, however,a non-negligible influence of the ambient humidity on thetribo-electric charging of polymer surfaces.
In order to gain an insight into the surface charge dis-tribution and stability, particular atomic force microscopy(AFM) techniques, the surface potential imaging (SPM)and electric force imaging (EFM) mode were developed.Already in 1986 the principles of imaging electrostaticcharges with an AFM were described [4, 5]. Stern and co-workers [6, 7] used electrochemically etched Ni wires asAFM tips to study “one of the oldest unresolved problemsin physics . . . the mechanism of charge exchange betweencontacting surfaces when at least one of them is insu-lating”. They imaged charges on polycarbonate (PC) de-posited by contacting the polymer with the conductive Nitip on which a voltage was applied. A tribo-electric charg-ing was observed by slowly approaching a poly(methylmethacrylate) surface to the tip without applying a volt-age [7, 8]. Morita and Sugawara [9] studied the time evo-lution of deposited charges on silicon samples with a de-fined thin silicon oxide layer under ambient conditions byEFM measurements with atomic resolution. They conjec-tured that the contact charging and dissipation mechanismof positive charges involves only one stage, the chargecarrier’s diffusion on the silicon oxide surface. In con-trast, the dissipation of negative charges showed a morecomplex three-stage mechanism. The SPM technique (alsoknown as Kelvin force microscopy [9]) was employed todetect dipoles on buried nano-particle/polymer interfacesand record their potential distribution with accurate lateraland energetic resolution [10]. In this way it was able toquantify electronic anisotropies and charge transfer pro-cesses in semi-conductors [11].
The aim of the present paper is to explain the bipo-lar charging of chemically identical polymers observedin tribo-charging experiments [3] by showing the coexis-tence of negatively and positively charged domains side byside on the polymer surface. Using AFM surface poten-tial imaging, the distribution and strength of these charge
domains are visualized on various polymer surfaces. Thestability of charges and the influence of environmental hu-midity is investigated by electric force imaging.
Materials and Methods
Materials
All of the measurements described in this paper were car-ried out with polymers containing a minimum amount ofadditives, impurities and other accompanying substances(Table 1).
In order to remove water traces from the polymer sur-face and the bulk phase all polymer samples were carefullydried in a vacuum oven at 50 C and a slight vacuum atleast five days.
For all experiments employing the atomic force mi-croscopy (AFM) polymer melt films were prepared fromthe granules. One polymer granule was put on a siliconwafer and heated up to the melting point. Then, the poly-mer melt was pressed against a second silicon wafer usinga press, usually employed to prepare samples for infraredspectroscopy. After cooling, the silicon wafers were care-fully removed and the polymer film was mounted on a steelsample puck by a piece of electrically conductive double-sided adhesive tape. To detect surface impurities all meltlayers were analysed by means of X-ray photoelectronspectroscopy (XPS). Only samples without any surfaceimpurities and a surface composition equal to that of thegranules were used for the AFM measurements.
Atomic Force Microscopy (AFM)
All AFM measurements were carried out by means ofa NanoScope IIIa – Multimode (Veeco, USA). The in-strument was equipped with an electrically conductingcantilever with a silicon tip (Pointprobe EFM sensor,NanoSensors, Wetzlar, Germany). An overall metallic
Table 1 Polymers used for charging experiments
Polymer Abbreviation Trade name
Polyethylene PE Mirathen AL 21 FA
Polypropylene PP Daplen PP KS 10
Polyamide-12 PA Vestamid L 1600
Poly(vinyl chloride) PVC Decelith 23002
Poly(ethylene PET Polyclear T 86
terephthalate)
Poly(oxymethylene) POM Ultraform N 232003
Poly(methyl PMMA Plexiglas G7 clear 10100
methacrylate)

50 V. Albrecht et al.
coating (PtIr5) on both sides of the cantilever increasedthe electrical conductivity of the tip. The tip radius waslower than 25 nm. The spring constant was 2.8 N/m andthe resonance frequency 75 kHz. The sample mounted ona steel sample holder was grounded, the sample acted asa dielectric in a capacitor.
An environmental chamber ensured that temperatureand humidity were constant during the measurements.
All polymer films were used as prepared, i.e. the sam-ples were not mechanically rubbed. Samples that werecontacted with other polymer sheets and afterwards sepa-rated, showed highly electrically charged surfaces whichcannot be studied by the AFM techniques mentioned be-low.
Surface Potential Imaging Mode (SPM)
The SPM technique allows measurements of the local sam-ple surface potential. The NanoScope recorded two passes.In the first pass, the sample surface topography was ob-tained by the standard tapping mode. The surface potentialwas measured during the second pass carried out in the liftmode (lift height was 100 nm). Here the cantilever’s vibra-tion is turned off and an oscillating voltage UAC cos ωt isapplied directly to the cantilever tip. This creates an os-cillating electrostatic force F at the frequency ω on thecantilever:
F =(
dC
dz
)UACUDC (1)
where (dC/dz) is the vertical derivative of the tip/samplecapacitance, UDC the d.c. voltage between the tip and thesample, and UAC is the oscillating voltage applied to thecantilever tip.
An external d.c. voltage (Utip) applied on the tip com-pensates the voltage UDC between the tip and the sampleuntil the oscillation amplitude becomes zero (F = 0). Atthis point the external voltage Utip will be the same as theunknown surface potential.
The voltage Utip is analyzed to construct a voltageimage of the surface. The surface topography recorded in
Fig. 1 Distribution of the surface potential (Ψ surf) on polymer surfaces visualized by means of the SPM technique for PS (a) and line scan(b) along the white line in the SPM image
the first pass is involved to compensate topographic ef-fects.
Electric Force Imaging Mode (EFM)
The EFM technique was applied to detect the electricfield gradient’s distribution produced by electrical chargeson the sample surfaces. As explained above, the meas-urements were carried out by two passes where the firstpass records the sample surface topography. In the sec-ond pass (lift height was 100 nm) the cantilever vibrationstimulated by a piezoelectric element was kept near thecantilever’s resonant frequency and a d.c. voltage was ap-plied to the cantilever. As response on an additional forcegradient (e.g. due to the interaction of the charged tipand a charge domain on the sample surface) the resonantfrequency changes. Attractive forces (generated by oppo-sitely charged tip and surface) reduce the cantilever reso-nant frequency, and repulsive forces (generated by tip andsurface charges having the same sign) increase the reso-nant frequency. The frequency shift can be used to con-struct an image showing the lateral distribution of surfacecharges.
We used the EFM technique to study the stability ofcharge domains on polymer surfaces. After recording thesample surface topography the cantilever tip with an ap-plied d.c. voltage of +12 V or −12 V touched the sam-ple surface for 120 s. During this period charges weretransferred to the surface. A series of passes in the liftmode were carried out to detect the evolution of the lateralcharge distribution on the sample surface over the time.The applied d.c. voltage on the tip was −10 V.
Results and Discussion
Visualization of Potential Distributionon Polymer Surfaces
The SPM image in Fig. 1a shows a typical example of thelateral distribution of the surface potential for a polystyr-ene melt film.

Visualization of Charge Domains on Polymer Surfaces 51
The positively and negatively charged domains existside by side like a patchwork. The immediate neighbour-hood of positively and negatively charged domains, indi-cated by more or less sharp domain borders can lead toconsiderable electrical field strengths. Figure 1b shows anarbitrarily selected line-scan through the charge patternedpolystyrene surface. Along the line-scan the field strengthE was calculated to E ≈ 2.4 kV cm−1. The high value re-sults from the short distance of the two oppositely chargeddomains. However, the surface potential (Ψsurf ≈ 8.75 V)was too low to ionise molecules in the contacting gas phasethat could cause an electrical breakdown.
During the collision of two polymer grains areas witha size of a few square micrometers come into contact. Inthe contact zone an electron transfer can take place as de-scribed in [2] (Fig. 2a). In case of the collision of twochemically different polymer particles one of them prefer-ably interacts as electron pair donator and the other speciesas electron pair acceptor. In this way laterally expandedcharge domains can be formed (Fig. 2b). The low electri-cal conductivity of the polymer bulk and surface preventsa rapid charge dissipation, hence the formed domain struc-ture seems to be permanently stable.
However, in case of the contacting of two polymer sam-ples of the same chemical constitution the discussed elec-tron transfer does not fully explain the existence of later-ally expanded charge domains nor the bi-polar charging asthe chemically identical functional surface groups shouldnot predominately or selectively act as electron pair dona-tor or electron pair acceptor. A pronounced tribo-electriccharging is only observed for polymer species consist-ing of rather polar molecules. These polar molecules havepronounced electron pair donator or acceptor properties.The existence of a strong electron pair donator centre ina molecule creates an electron pair acceptor centre in itsimmediate neighbourhood and an electron pair acceptorcentre generates a donator centre [2]. However, the ten-dency to act as potential electron pair donator or acceptorwill not be different for those interacting particles.
The formation of charge domains showed that the fun-damental electron transfer process involves a high numberof surface sites. The tribo-electric charging of polymershas to be considered as a collective phenomenon.
Fig. 2 Model concept of the contact charging of polymer grains.a Contact between an electron pair donator domain (empty dots) ofthe particle 1 and an electron pair acceptor domain (grey dots) ofthe particle 2. Charge transfers (e−) are taking place. After separa-tion the two particles (b), a positively charged (⊕) and a negativecharged () domain, remain on the particles surface
Stability of Charge Domains on Polymer Surfaces
Because of the low surface and bulk conductivity of mostpolymer materials the stability of charges on polymer sur-faces should be stable over the time. However, the poly-mer surface is an interface where other substances cancome into contact with charged polymers and these sub-stances can provide charge carriers influencing the time-stability of the charges. Especially traces of water cansupport the discharging of polymer surfaces because thewater molecules auto-dissociate forming hydronium ions(H3O+) and hydroxyl ions (OH−). Brønsted acidic or ba-sic surface groups may be involved in the ion formationand provide additional charge carriers or traps to neutral-ize charges. The presence of water molecules does not onlydepend on the environment that is in contact to the polymersurface. Enormous amounts of water can also be containedin the polymer bulk [12] where the water molecules aremore or less mobile and able to transport ions. As shownin the work by Morita and Sugawara [13] EFM is suitableto deposit charges on insulator surfaces and study their be-havior over the time.
Figure 3 shows four series of EFM images recordedon different polymer melt film species. The first imageof each series shows the non-charged melt film surface(initial state). Employing a conductive silicon cantilevercharges were deposited on the polymer melt film surfaces.Immediately after the charge deposition the time was set att = 0.
After various time spans t the distribution of the de-posited charges was recorded. PE (Fig. 3a) and PP (notshown in Fig. 3) show a high stability of the depositedcharges. Over a time of a few hours no change in thecharge image was observed. PE and PP are rather non-polar polymers without pronounced electron pair acceptoror donator properties [2]. The low surface polarity does notallow a stabilization of adsorbed water films on the sur-face. Also, the bulk phase does not take up water [12].Hence, no charge flux can take place and a charge dissipa-tion cannot be observed.
According to the charge stability PMMA shows a simi-lar behaviour (Fig. 3c). Deposited charges seem very sta-ble over a long time. However, it is well known thatPMMA is able to adsorb and incorporate considerableamounts of water [12]. It is assumed that the watermolecules are immobilized in the network of the PM-MA’s bulk phase and cannot act as mobile charge carriers.PVC is a polymer with a rather low hydrophilic charac-ter comparable to the other polyolefins, and water filmsshould not be stable on the PVC surface. But PVC exhibitsa high electron pair acceptor strength as well as a consider-able value of electron pair donator strength [2]. From thispoint of view PVC can be considered as a polar polymer.The SPM images show pronounced oppositely chargeddomains on its surface. Charges deposited on the PVC sur-face do not seem to be stable. Figure 3b shows a lateral

52 V. Albrecht et al.
Fig. 3 Series of EFM images taken for PE (a), PVC (b), PMMA (c), and PA (d). The images show the initial states without depositedcharges, the states immediately after deposition of charges by the silicon cantilever (t = 0) and after different time spans (t = ti). The pos-itions of the deposited charges are indicated by a white circle. Negative charges appear pale, positive charges are dark. All measurementswere carried out at a relative humidity of ϕ = 30%
spreading of charges over the time. A conclusive evidencefor this phenomenon cannot be given. Light irradiationof PVC causes a substitution of chlorine by oxygen onthe PVC surface. Maybe traces of the carboxylic groupsformed in this way can act as adsorption centres for wa-ter molecules or provide hydronium ions which can act ascharge carriers.
PA is another polar polymer. It is able to take up andincorporate tidy amounts of water [12]. Figure 3d showsa quick spreading of the deposited charges within a few
Fig. 4 Series of EFM images taken for PET (a), PVC (b), and PMMA (c) in dependence on the relative humidity (ϕ). After deposition ofcharges by the silicon cantilever (t = 0) the samples were stored in an atmosphere of constant humidity for different time spans (t = ti). Inall images negative charge domains appear pale
minutes. It can be clearly seen that the charge flux followsthe grain boundary of the PA’s spherulites where watermolecules can move. Obviously, in the case of PA waterseems responsible for the charge transport that involves thedischarging of the PA surface.
The influence of water on the dissipation of surfacecharges can be studied by adjusting the environmental hu-midity which controls the water amount offered for ad-sorption. The influence of humidity on the charge stabilityis illustrated in Fig. 4. For three polar polymer samples the

Visualization of Charge Domains on Polymer Surfaces 53
charge stability was measured in dependence on the timeand the exactly adjusted humidity ϕ.
Figure 4 shows for all three polymer samples that in thecase of an environment containing a relative high amountof water charges immediately spread on the surfaces aftertheir deposition. In case of PMMA the spreading seemsmore moderate, but it can be clearly detected. The resultcorresponds with findings of the time-dependent measure-ments shown in Fig. 3c and the assumption of water whichis fix incorporated in the PMMA-network. The imageof the PET sample taken at ϕ = 30% indicates that thecharges rapidly spread. After a storage of the PET samplein wet atmosphere (ϕ = 60% and 90%) all charges weredissipated within only 25 min. For PVC the same course isobserved, however over a longer time span and the imagerecorded at ϕ = 90% indicates that a complete dissipationof charges does not take place. Here it is necessary to notethat the flux of charges starts immediately after the deposi-tion of the first charges on the PVC surface (an expandedpale area can be seen in Fig. 4b). That means, during thecharge deposition time a significantly higher number ofcharges were deposited.
Conclusions
The tribo-electric charging of polymers is a collective phe-nomenon of numerous electron transfer processes in thecontact zone of two colliding particles. The SPM tech-nique allows to visualize the charge distribution on poly-mer surfaces. It was shown that oppositely charge domainscan stably exist side by side although considerable filedstrengths are present.
The dissipation of deposited charges was studied bymeans of EFM measurements. Depending on the poly-mer’s polarity the rate of charge dissipation can be verydifferent what indicates different mechanisms of discharg-ing. Traces of water which can be adsorbed from the sur-rounding air or incorporated in the polymer bulk havea strong influence on charge dissipation. Furthermore, ki-netic studies quantifying the discharging mechanisms willbe published in a separate paper [14].
Acknowledgement The financial support from the DeutscheForschungsgemeinschaft (DFG-Sonderforschungsbereich 285) isacknowledged.
References1. Brück R (1981) Kunststoffe 71:2342. Németh E, Schubert G, Albrecht V,
Simon F (2003) J Electrostatics 58:33. Németh E, Schubert G, Albrecht V,
Simon F (2005) Aufbereitungstechnik45:35
4. Binnig G, Quate CF, Gerber C: PhysRev Lett 56:930
5. Martin Y, Williams CC,Wickramasinghe HK (1987) J ApplPhys 61:4723
6. Stern JE, Terris BD, Mamin HJ,Rugar D (1988) Appl Phys Lett53:2717
7. Terris BD, Stern JE, Rugar D,Mamin HJ (1989) Phys Rev Lett63:2669
8. Terris BD, Stern JE, Rugar D,Mamin HJ (1990) J Vac Sci TechnolA8:374
9. Zerweck U, Loppacher C, Otto T,Grafström S, Eng LM (2005) PhysRev B71:125424
10. Eng LM, Grafström S, Hellmann I,Loppacher C, Otto T, Renger J,Schlaphof F, Seidel J, Zerweck U(2004) In: Meyendorf N, Baaklini GY,Michel B (eds) SPIE ProceedingsTesting, Reliability, and Application
of Micro- and Nano-MaterialSystems II, p 21–35
11. Loppacher C, Zerweck U, Teich S,Beyreuther E, Otto T, Grafström S,Eng LM (2005) Nanotechnology 16:S1
12. Albrecht V, Simon F, Schubert G,Németh E (2002)Chemie-Ingenieur-Technik 74:1425
13. Morita S, Sugawara Y (2001) ThinSolid Films 393:310
14. Albrecht V, Janke A, Schubert G,Németh E, Simon F, Kinetics ofdischarging polymer samples independence on humidity.J Electrostatics, in preparation

Progr Colloid Polym Sci (2006) 132: 54–61DOI 10.1007/2882_032© Springer-Verlag Berlin Heidelberg 2006Published online: 9 March 2006
Susanne TemmelWolfgang KernThomas Luxbacher
Zeta Potential of Photochemically ModifiedPolymer Surfaces
Susanne TemmelPolymer Competence Center LeobenGmbH, A-8700 Leoben, Austria
Wolfgang Kern ()Institute for Chemistry and Technology ofOrganic Materials, Graz University ofTechnology, A-8010 Graz, Austriae-mail: [email protected]
Thomas LuxbacherAnton Paar GmbH, A-8054 Graz, Austria
Abstract The present work isfocused on the introduction ofsulfonic acid groups (−SO3H) ontolow-density polyethylene (LDPE)surfaces by photosulfonation. Thegeneration of sulfonic acid groupsat the polyethylene surfaces and thedegree of photosulfonation wereexamined by FTIR-spectroscopy,contact angle testing as well as zetapotential measurements. The contactangle θ of water decreased fromθ = 99 (pristine LDPE) to aboutθ = 30 (photosulfonated LDPE)and then remained constant. Fromcontact angle data with different testliquids a significant increase in thepolar component γP of the surfacetension γ was evidenced, while thedispersive component γD remainedalmost constant. Zeta potentialmeasurements were performed for theinvestigation of electrokinetic effectsat the solid/liquid interface. Theζ-potential of the modified LDPEsurfaces shifted to less negativevalues with increasing UV irradiationtime corresponding to a higherhydrophilicity of the photosulfonatedpolyethylene surfaces. Concomitantlythe isoelectric point was shifted to
lower pH values, which indicates anincreasing amount of acidic −SO3Hgroups present at the sample surface.However, strongly photosulfonatedLDPE surfaces became partly solublein aqueous media which limits theamount of −SO3H groups presentat the modified LDPE surface.To reduce these effects, LDPEsamples were cross-linked by e-beamirradiation and then subjected to thephotosulfonation process. Comparedto standard LDPE, crosslinked LDPEdisplayed a higher content of −SO3Hgroups and higher surface polarityafter photosulfonation. This wasevidenced both by zeta potential andcontact angle measurements. It isthus demonstrated that sample pre-treatment by crosslinking providesmore stable surfaces which maintaintheir polar properties during watercontact. This is explained by a loweramount of extractable components asa result of radiation-induced networkformation.
Keywords Contact angle ·Cross-linked LDPE ·Photosulfonation · Polyethylene ·Surface modification · Zeta potential
Introduction
The use of polymers in various industrial applications hasincreased dramatically during the past few decades [1, 2].Despite the variety of many plastics, their use is often
limited due to their surface properties, although their me-chanical properties may be well-suited. Therefore the sur-face of a polymer has to be modified to obtain the desiredsurface properties, such as hydrophilicity, conductivity orchemical composition without altering the bulk properties.

Zeta Potential of Photochemically Modified Polymer Surfaces 55
Several techniques including corona discharge [1], plasmatreatment [1, 3, 4], flame treatment [1], and irradiation withUV light in the presence of a UV sensitive gas [5–8] havebeen developed to modify the polymer surface. The princi-ple of those surface treatment technologies is to introducepolar groups onto the polymer surface. This provides sig-nificant improvement of wettability, paintability, biocom-patibility and also adhesion to other polymers or metals.
The growing demand for detergents led to the de-velopment in processes for introducing sulfonic acidgroups −SO3H (sulfonation) in organic molecules. Thisresults in changing the physical and chemical propertiesof molecules as the solubility in water, detergency, wet-tability, emulsifying power, and foaming power, which isof great practical interest. In the industry the most import-ant technique is sulfonation using oleum (SO3 in sulfu-ric acid) [9, 10]. The introduction of sulfonyloxy groupsin alkylbenzenes, olefins and fatty alcohols can also beachieved using sulfur dioxide. However, the sulfonationof saturated aliphatic hydrocarbons is not possible by thismethod due to absence of active sites. Alkanesulfonatescan be generated by two photochemical processes: sul-fochlorination and sulfoxidation [11]. In both methodsa gaseous mixture of SO2 and an oxidant is used. In thesulfochlorination chlorine is used as the oxidizing agent,whereas in the sulfoxidation oxygen is the oxidant. Theoverall process for photoinduced sulfoxidation (“photosul-fonation”) is represented in Eq. 1 [12–15].
RH+SO2 + 1
2O2
hν−→ RSO3H (1)
The application of photosulfonation reactions to in-troduce −SO3H groups onto low-density polyethylene(LDPE) surfaces has already been described in the liter-ature [16–20]. Both the reaction pathways and the op-timization of reaction conditions (e.g. the volume ratioSO2/air) have been discussed.
The aim of the present study was a closer investi-gation of the properties of LDPE surfaces subjected tophotosulfonation processes. Until today no zeta potentialstudies had been carried out on photosulfonated LDPE.In the present investigation such modified LDPE surfaceswere characterized by FTIR spectra, contact angle testingand zeta potential measurements were carried out. To im-prove the stability of modified LDPE surfaces, polyethy-lene samples were crosslinked by e-beam irradiation and
Table 1 Surface tensions γ , dispersive components γ D and polar components γ P of water and diiodomethane. Data taken from Ström [22]
γ γ D γ P Density Viscosity η Temperature
[mN/m] [mN/m] [mN/m] [g/cm] [mPa s] [C]
Water 72.8 21.8 51 0.998 1.002 25
Diiodomethane 50.8 50.8 0 3.325 2.762 20
subsequently photosulfonated. The surface properties ofcrosslinked LDPE are compared to those obtained withstandard LDPE. Such data are useful to exploit the po-tential of surface sulfonation processes both for laboratoryand technical purposes.
Experimental Section
Materials. Low density polyethylene (LDPE) foils (thick-ness: 37 µm) were purchased from a commercial supplier.Some LDPE samples were cross-linked using electronbeam irradiation (dose: 250 kGy) under inert gas condi-tions. SO2 of > 99.98% purity as well as compressed airwere received from Linde AG.
FTIR Spectroscopy. Infrared spectra were recorded ona Perkin Elmer Spectrum One FTIR spectrometer equippedwith a Deuterated Triglycine Sulfate (DTGS) detectorand KBr optics. Data collection was performed at 4 cm−1
spectral resolution in the region of 4000–450 cm−1 andaveraged over 5 scans. All samples were measured intransmission mode.
Contact angle measurements. The surface tension γ of thesample surfaces was determined by measuring the con-tact angle with a Drop Shape Analysis System DSA100(Krüss GmbH, Hamburg, Germany) using water and di-iodomethane as test liquids (drop volume ∼ 20 µL). Basedon the Owens-Wendt method [21], the surface tension γas well as the dispersive and polar components (γD andγP) were evaluated. The literature values for the surfacetension components of the test liquids used are given inTable 1 [22]. The contact angles were obtained by meansof the sessile drop method and they were measured withintwo seconds. The reproducibility was within 2.
Zeta potential measurements. The zeta potential ζ of thesample surfaces was determined by the streaming poten-tial method, using a clamping cell connected with an EKAelectrokinetic analyzer (Anton Paar GmbH, Graz, Aus-tria). In this cell the sample is pressed against a PMMAspacer with seven channels. The measurements were per-formed with a KCl electrolyte solution (10−3 M, 500 mL).The pH was adjusted to about 10 by adding NaOH (0.1 M,
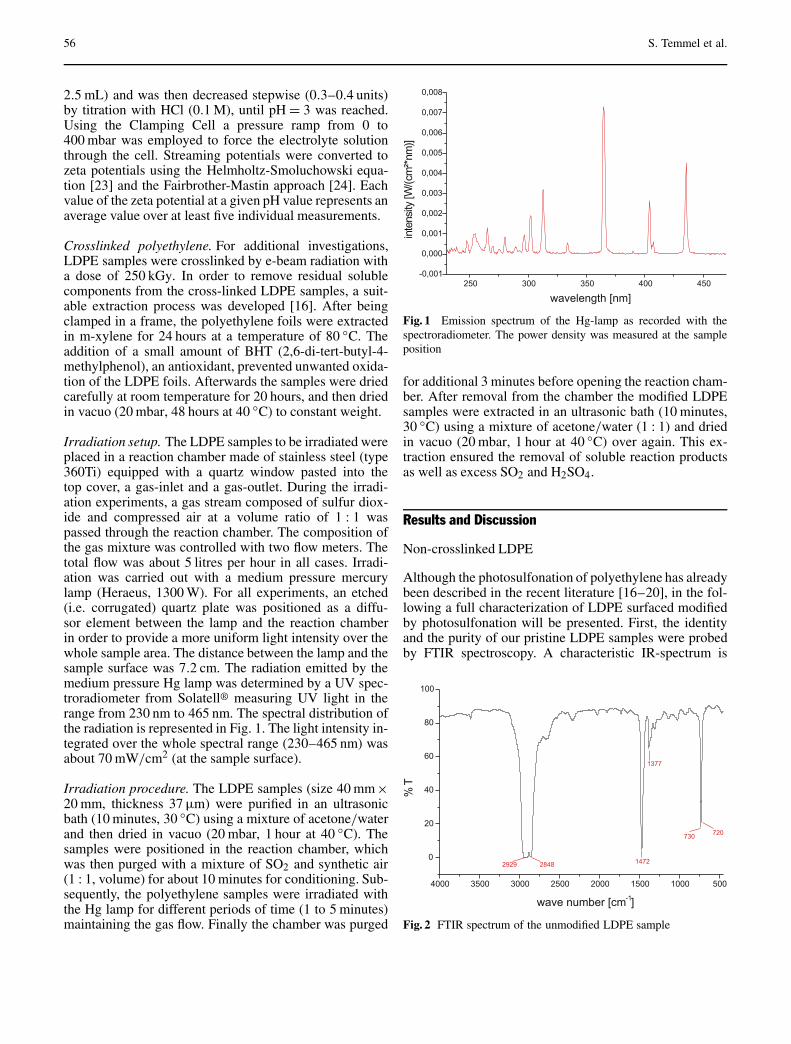
56 S. Temmel et al.
2.5 mL) and was then decreased stepwise (0.3–0.4 units)by titration with HCl (0.1 M), until pH = 3 was reached.Using the Clamping Cell a pressure ramp from 0 to400 mbar was employed to force the electrolyte solutionthrough the cell. Streaming potentials were converted tozeta potentials using the Helmholtz-Smoluchowski equa-tion [23] and the Fairbrother-Mastin approach [24]. Eachvalue of the zeta potential at a given pH value represents anaverage value over at least five individual measurements.
Crosslinked polyethylene. For additional investigations,LDPE samples were crosslinked by e-beam radiation witha dose of 250 kGy. In order to remove residual solublecomponents from the cross-linked LDPE samples, a suit-able extraction process was developed [16]. After beingclamped in a frame, the polyethylene foils were extractedin m-xylene for 24 hours at a temperature of 80 C. Theaddition of a small amount of BHT (2,6-di-tert-butyl-4-methylphenol), an antioxidant, prevented unwanted oxida-tion of the LDPE foils. Afterwards the samples were driedcarefully at room temperature for 20 hours, and then driedin vacuo (20 mbar, 48 hours at 40 C) to constant weight.
Irradiation setup. The LDPE samples to be irradiated wereplaced in a reaction chamber made of stainless steel (type360Ti) equipped with a quartz window pasted into thetop cover, a gas-inlet and a gas-outlet. During the irradi-ation experiments, a gas stream composed of sulfur diox-ide and compressed air at a volume ratio of 1 : 1 waspassed through the reaction chamber. The composition ofthe gas mixture was controlled with two flow meters. Thetotal flow was about 5 litres per hour in all cases. Irradi-ation was carried out with a medium pressure mercurylamp (Heraeus, 1300 W). For all experiments, an etched(i.e. corrugated) quartz plate was positioned as a diffu-sor element between the lamp and the reaction chamberin order to provide a more uniform light intensity over thewhole sample area. The distance between the lamp and thesample surface was 7.2 cm. The radiation emitted by themedium pressure Hg lamp was determined by a UV spec-troradiometer from Solatell® measuring UV light in therange from 230 nm to 465 nm. The spectral distribution ofthe radiation is represented in Fig. 1. The light intensity in-tegrated over the whole spectral range (230–465 nm) wasabout 70 mW/cm2 (at the sample surface).
Irradiation procedure. The LDPE samples (size 40 mm×20 mm, thickness 37 µm) were purified in an ultrasonicbath (10 minutes, 30 C) using a mixture of acetone/waterand then dried in vacuo (20 mbar, 1 hour at 40 C). Thesamples were positioned in the reaction chamber, whichwas then purged with a mixture of SO2 and synthetic air(1 : 1, volume) for about 10 minutes for conditioning. Sub-sequently, the polyethylene samples were irradiated withthe Hg lamp for different periods of time (1 to 5 minutes)maintaining the gas flow. Finally the chamber was purged
Fig. 1 Emission spectrum of the Hg-lamp as recorded with thespectroradiometer. The power density was measured at the sampleposition
for additional 3 minutes before opening the reaction cham-ber. After removal from the chamber the modified LDPEsamples were extracted in an ultrasonic bath (10 minutes,30 C) using a mixture of acetone/water (1 : 1) and driedin vacuo (20 mbar, 1 hour at 40 C) over again. This ex-traction ensured the removal of soluble reaction productsas well as excess SO2 and H2SO4.
Results and Discussion
Non-crosslinked LDPE
Although the photosulfonation of polyethylene has alreadybeen described in the recent literature [16–20], in the fol-lowing a full characterization of LDPE surfaced modifiedby photosulfonation will be presented. First, the identityand the purity of our pristine LDPE samples were probedby FTIR spectroscopy. A characteristic IR-spectrum is
Fig. 2 FTIR spectrum of the unmodified LDPE sample

Zeta Potential of Photochemically Modified Polymer Surfaces 57
shown in Fig. 2. The typical IR bands of LDPE are ob-served around 2929 and 2848 cm−1 (C−H valence vibra-tion), 1472 and 1377 cm−1 (C−H deformation vibration),730 and 720 cm−1 (−CH2-rocking vibration).
Figure 3 shows an FTIR spectrum of LDPE after thephotomodification process with SO2 and O2. Besides thetypical IR bands of LDPE, new bands around 1170 and1037 cm−1 were detected after UV irradiation (3 minutes)in the presence of sulfur dioxide and air at a volume ratioof 1 : 1. The peak at 1170 cm−1 can be assigned to theasymmetric vibration mode of SO3 units, whereas the sig-nal at 1037 cm−1 originates from the symmetric stretchingvibration of SO3 units. These two bands are typical of sul-fonic acids and are getting more intense with increasingirradiation time until they remain constant after four min-utes of photosulfonation. The signal around 1720 cm−1
may be attributed to aliphatic aldehydes, which seem to beformed as a by-product during photosulfonation.
The contact angle of water on non-crosslinked poly-ethylene decreased from 99.2 (unmodified LDPE) to
Fig. 3 FTIR spectrum of a LDPE sample after UV irradiation inthe presence of SO2 and O2 and subsequent extraction with ace-tone/water.
Table 2 Contact angle and surface tension data for non-crosslinked LDPE subjected to photosulfonation
Irradiation Contact angle Contact angle γ γ D γ P Surfacetime [min] [], water [], diiodomethane [mJ/m2] [mJ/m2] [mJ/m2] polarity [%]
0 99.2 55.4 35.85 35.72 0.13 0.361 78.5 52.2 38.57 33.04 5.53 14.342 68.6 51 43.69 33.71 9.98 22.843 48.9 46.1 56.68 36.43 20.26 35.744 31.5 45.1 66.87 36.97 29.90 44.715 30.3 44.9 67.50 37.06 30.44 45.10
γ . . . surface tensionγ D . . . dispersive componentγ P . . . polar component
30.3 after an UV irradiation time of 5 minutes (photo-sulfonated LDPE, see Fig. 4). The increased wettability isattributed to the introduction of polar sulfur acid groupson the surface of polyethylene. The measgured contact an-gles and the surface tension data (γ , γD and γP) of theunmodified and sulfonated samples are listed in Table 2.The contact angle θ then remained constant after an UV ir-radiation time of about four minutes. Thus it appears thata saturation of the surface with sulfonic acid groups isachieved after this period. As expected from the increas-ing wettability, the value of the surface tension γ increasesat increasing irradiation time, see Fig. 5. The polar sur-face tension component γP rises significantly, whereas thedispersive component γD remains virtually constant. Toillustrate the improved wetting behaviour, Fig. 6 showsmicrographs of water droplets placed on the surface ofpristine and photosulfonated LDPE.
The ζ potential of the samples obtained using theClamping Cell is no absolute value since the groovedPMMA spacer of the measuring cell contributes one meas-ured surface while the other is the sample surface. Any-
Fig. 4 Contact angle θ of water on non-crosslinked () andcrosslinked LDPE () as a function of the UV irradiation timeunder SO2/air atmosphere

58 S. Temmel et al.
Fig. 5 Photosulfonation of LDPE. Surface tension γ versusUV irradiation time for non-crosslinked () and crosslinked ()polyethylene
Fig. 6 Photo of a water droplet placed on the surface of unmodi-fied (left) and sulfonated LDPE irradiated for 5 minutes (right). Thecontact angle decreases from 99 to 30
way, changes in the zeta potential of LDPE depending onthe degree of surface modification can be detected and in-terpreted quite well. Figure 7 displays the zeta potentialversus pH curves of unmodified and irradiated LDPE sam-ples (non-crosslinked). The repeatability of all zeta poten-tial measurements shown in this paper was within 2 mV.The ζ potential versus pH curve of unmodified polyethy-lene is very similar to the curve of the PMMA reference.The isoelectric point (IEP) around pH = 3.9 and the shapeof the curve are typical of polymers bearing no disso-ciating groups. Due to the hydrophobic character of theunmodified polyethylene, preferred absorption of the chlo-ride anions is observed which gives a negative zeta poten-tial in the range of pH = 4–10. Compared to the untreatedLDPE all modified samples showed a marked shift of theisoelectric point towards lower pH and a plateau occur-ring at high pH. The shift of the isoelectric point can beexplained by the presence of acidic groups (sulfonic acidgroups) on the surface and – as expected – this change inIEP is more pronounced at increasing irradiation time. Theplateau of the zeta potential curves at higher pH valuesis characteristic of acidic groups in general. We observedthat the zeta potential shifts to less negative values (athigh pH) as a result of the photosulfonation. This is re-markable, since one would expect a trend to more negative
Fig. 7 Non-crosslinked LDPE: Zeta potential versus pH curvesof unmodified LDPE () and photosulfonated LDPE (• 1 min; 2 min; 3 min; ♦ 4 min; + 5 min of UV irradiation). (×) PMMAreference
values when strongly acidic −SO3H units are attached tothe surface. This finding can be explained as follows: onthe one hand, the sulfonic acid groups are deprotonatedat high pH values, which would shift the zeta potential tomore negative values. On the other hand, the increasinghydrophilicity of the modified LDPE leads to increasingwater adsorption and also swelling during contact with theelectrolyte solution. Consequently the adsorption of chlo-ride anions to the surface is decreased which results ina shift of the zeta potential to less negative values. Whenthe second effect exceeds the first one, the overall result isa shift of the zeta potential towards less negative values. In-deed, a similar result has been reported in the literature forthe sulfonation of polypropylene [25]. As shown in Fig. 7,the photosulfonation of polyethylene seems to be almostfinished after four minutes of UV processing. It is foundthat the changes in the zeta potential (and the IEP) corres-pond well with the variation in surface tension.
In another part of this study we wished to see the ef-fects of post-modification treatments on the properties ofthe modified LDPE surface. Polyethylene samples werephotosulfonated for different periods of time. Afterwardsthey were subjected to an after-treatment by condition-ing in an electrolyte solution (aqueous KCl, 10−3 M) for48 hours and then characterized by zeta potential meas-urements. This conditioning process resulted in a shift ofζ to even less negative values (see Fig. 8). This findingmay be explained by the swelling of the polymer sam-ples (water adsorption) in water that causes a shift of theshear plane of the electrochemical double layer into theliquid phase. This effect demonstrates that storage condi-tions and pre-conditioning may exert a pronounced influ-ence on the zeta potential recorded for surface-modifiedpolymers. Phenomena of this kind have already been de-scribed in previous literature [26, 27].
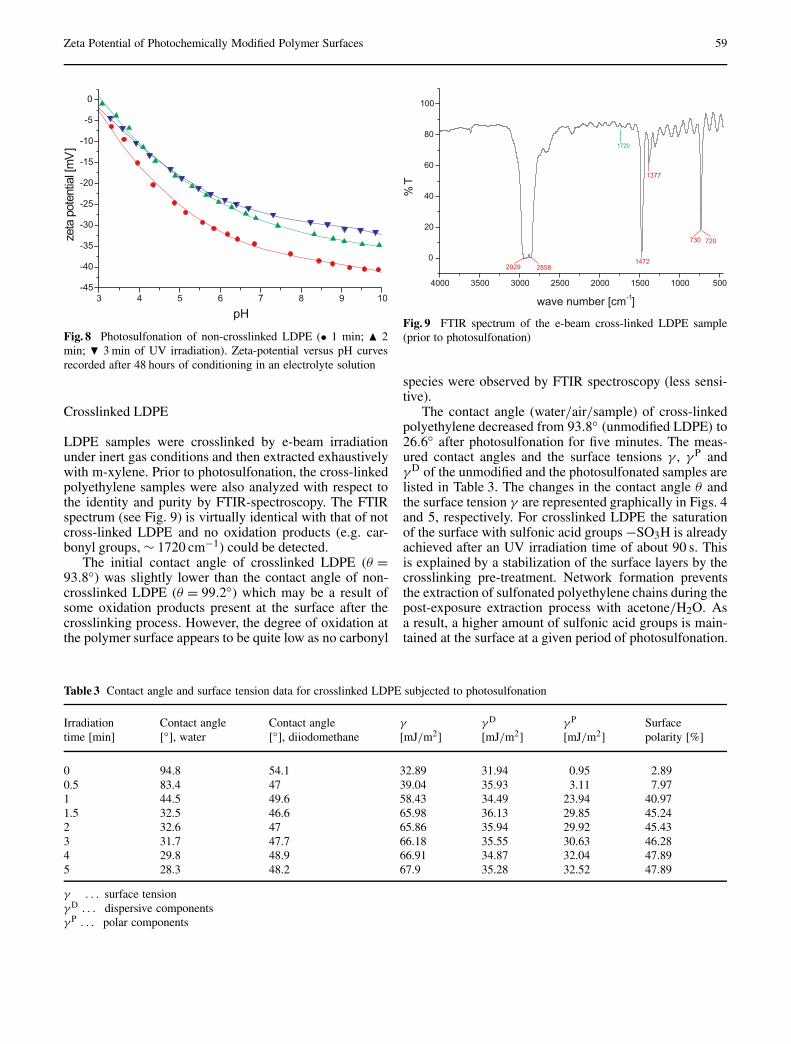
Zeta Potential of Photochemically Modified Polymer Surfaces 59
Fig. 8 Photosulfonation of non-crosslinked LDPE (• 1 min; 2min; 3 min of UV irradiation). Zeta-potential versus pH curvesrecorded after 48 hours of conditioning in an electrolyte solution
Crosslinked LDPE
LDPE samples were crosslinked by e-beam irradiationunder inert gas conditions and then extracted exhaustivelywith m-xylene. Prior to photosulfonation, the cross-linkedpolyethylene samples were also analyzed with respect tothe identity and purity by FTIR-spectroscopy. The FTIRspectrum (see Fig. 9) is virtually identical with that of notcross-linked LDPE and no oxidation products (e.g. car-bonyl groups, ∼ 1720 cm−1) could be detected.
The initial contact angle of crosslinked LDPE (θ =93.8) was slightly lower than the contact angle of non-crosslinked LDPE (θ = 99.2) which may be a result ofsome oxidation products present at the surface after thecrosslinking process. However, the degree of oxidation atthe polymer surface appears to be quite low as no carbonyl
Table 3 Contact angle and surface tension data for crosslinked LDPE subjected to photosulfonation
Irradiation Contact angle Contact angle γ γ D γ P Surfacetime [min] [], water [], diiodomethane [mJ/m2] [mJ/m2] [mJ/m2] polarity [%]
0 94.8 54.1 32.89 31.94 0.95 2.890.5 83.4 47 39.04 35.93 3.11 7.971 44.5 49.6 58.43 34.49 23.94 40.971.5 32.5 46.6 65.98 36.13 29.85 45.242 32.6 47 65.86 35.94 29.92 45.433 31.7 47.7 66.18 35.55 30.63 46.284 29.8 48.9 66.91 34.87 32.04 47.895 28.3 48.2 67.9 35.28 32.52 47.89
γ . . . surface tensionγ D . . . dispersive componentsγ P . . . polar components
Fig. 9 FTIR spectrum of the e-beam cross-linked LDPE sample(prior to photosulfonation)
species were observed by FTIR spectroscopy (less sensi-tive).
The contact angle (water/air/sample) of cross-linkedpolyethylene decreased from 93.8 (unmodified LDPE) to26.6 after photosulfonation for five minutes. The meas-ured contact angles and the surface tensions γ , γP andγD of the unmodified and the photosulfonated samples arelisted in Table 3. The changes in the contact angle θ andthe surface tension γ are represented graphically in Figs. 4and 5, respectively. For crosslinked LDPE the saturationof the surface with sulfonic acid groups −SO3H is alreadyachieved after an UV irradiation time of about 90 s. Thisis explained by a stabilization of the surface layers by thecrosslinking pre-treatment. Network formation preventsthe extraction of sulfonated polyethylene chains during thepost-exposure extraction process with acetone/H2O. Asa result, a higher amount of sulfonic acid groups is main-tained at the surface at a given period of photosulfonation.

60 S. Temmel et al.
Fig. 10 Zeta potential versus pH curves of cross-linked LDPEprior to () and after photosulfonation (• 1 min; 2 min; 3 min;♦ 4 min; + 5 min of UV irradiation)
This is most evident from a comparison of the data ob-tained for crosslinked and non-crosslinked LDPE surfaces,see Figs. 4 and 5.
The zeta potential versus pH curves of unmodifiedand photosulfonated LDPE (e-beam crosslinked) are illus-trated in Fig. 10. Compared to Fig. 7, a larger amount ofsulfonic acid groups seems to be present on the LDPE sur-face. The shift of the zeta potential to less negative values(at high pH) is an indication for a higher amount of sul-fonic acid groups present at the surface of the crosslinkedLDPE sample. The zeta potential data are in perfect accor-dance with the results from contact angle measurements:insolubilization of the polymer by network formation re-sults in a stable surface containing higher amounts of po-lar groups after photo-induced surface modification. Com-pared to non-crosslinked LDPE (Fig. 7) the IEP of theunmodified crosslinked sample is somewhat lower (∼ 3.2).This can be again explained by the formation of oxidationproducts during the cross-linking process.
Conclusions
From these investigations the following conclusions can bedrawn:
The introduction of sulfonic acid groups onto low-density polyethylene (LDPE) surface was achieved by UVirradiation in the presence of sulfur dioxide and air (pho-tosulfonation). The wettability of the modified polyethy-lene samples increased with increasing irradiation time butremained constant after prolonged UV irradiation, whichwas evidenced by contact angle measurements. The zetapotential of the modified LDPE surfaces shifted to lessnegative values with increasing UV irradiation time, whichis explained by an increase of the hydrophilicity of thepolyethylene surface. Concomitantly the isoelectric pointwas shifted to lower pH values, which indicates an in-creasing amount of sulfonic acid groups present at thesample surface. Furthermore it has been demonstrated thatzeta potential measurement is a very sensitive techniqueto characterize the degree of surface modification of poly-mers since the contact angle measurements show a plateauafter prolonged UV irradiation, whereas the changes of ζpotential-pH-profiles are low, but still noticeable.
Post-modification treatments like storage conditions(air/water) and preconditioning may exert a pronouncedinfluence on the zeta potential obtained for surface modi-fied polymers. Sulfonated LDPE samples, which were sub-jected to an after-treatment by conditioning in an elec-trolyte solution, showed a shift of the zeta potential toeven less negative values. This may be explained by theswelling of the polymer samples, which occur during stor-age in aqueous media.
A crosslinking pre-treatment of LDPE prevents the ex-traction of sulfonated polyethylene chains during the post-exposure extraction process with acetone/H2O. This iscaused by a radiation-induced network formation. As a re-sult, a higher amount of sulfonic acid groups is maintainedat the surface at a given period of sulfonation. This wasevidenced both by zeta potential and contact angle meas-urements.
Acknowledgement This study was performed at the PolymerCompetence Center Leoben GmbH (PCCL, Austria) within theframework of the Kplus-program of the Austrian Ministry of Traffic,Innovation and Technology with contributions of Graz Universityof Technology (TU Graz), Anton Paar GmbH (Graz) and KEKE-LIT Kunststoffwerk GmbH (Linz). PCCL is funded by the AustrianGovernment and the State Governments of Styria and Upper Aus-tria. Further thanks to ARC Seibersdorf research GmbH (Dr. J.Wendrinsky) for performing the e-beam irradiation experiments.
References1. Chan C-M (1994) Polymer Surface
Modification and Characterization.Hanser, Munich
2. Chan C-M, Ko T-M, Hiraoka H(1996) Surf Sci Rep 24:1
3. Armbruster K, Osterhold M (1990)Kunststoffe 80:1241
4. Giroux TA, Cooper SL (1991) J ApplPolym Sci 43:145
5. Bevington JC, Ratti L (1972) EurPolym J 8:1105
6. Niino H, Yabe A (1993) Appl PhyLett 63:3527
7. Meyer U, Kern W, Ebel MF,Svagara R (1999) Macromol RapidCommun 20:515
8. Okoshi M, Murahara M, Toyoda K(1992) J Mater Res 7:1912
9. Garbassi F, Morra M, Ochiello E(1998) Polymer Surfaces – From

Zeta Potential of Photochemically Modified Polymer Surfaces 61
Physics to Technology. Wiley,Chichester
10. Siqueira-Petri DF, Wenz G, Schunk P,Schimmel T, Bruns M, Dichtl MA(1999) Colloid Polym Sci 277:673
11. Braun M, Maurette MT, Oliveros E(1991) Photochemical Technology.Wiley, Chichester
12. Orthner L (1950) Angew Chem62:302
13. Graf R (1952) Justus Liebig AnnChem 578:50
14. Asinger F, Geisler G, Eckholdt H(1956) Chem Ber 89:1037
15. Harting H (1975) Chem Ztg 99:175
16. Feiertag P (2000)Oberflächenmodifizierung vonPolymeren durch Photosulfonierung.Diploma Thesis, Graz University ofTechnology
17. Feiertag P, Kavc T, Meyer U,Gsoels I, Kern W, Rom I, Hofer F(2001) Synthetic Metals 121:1371
18. Kavc T, Kern W, Ebel MF, Svagera R,Pölt P (2000) Chem Mater 12:1053
19. Kern W, Kavc T (2001) Patentapplication EP 890227.2
20. Kaneko M, Sato H (2004) MacromolChem Phys 205:173
21. Owens DK, Wendt RC (1969) J ApplPolym Sci 13:1741
22. Ström G, Frederiksson M, Stenius P.J Coll Interf Sci 10, 119/2:352
23. Smoluchowski M (1921) Handbook ofElectricity and Magnetism Vol. 2.Barth, Leipzig
24. Fairbrother F, Mastin H (1924) JChem Soc 75:2318
25. Stakne K, Smole MS, Kleinschek KS,Jaroschuk A, Ribitsch V (2003) J MatSci 38:2167
26. Bismarck A, Mohanty AK,Aranberri-Askargorta I, Czapla S,Misra M, Hinrichsen G, Springer J(2001) Green Chemistry 3:100
27. Wuertz C, Bismarck A, Springer J,Königer R (1999) Prog Org Coat37:117

Progr Colloid Polym Sci (2006) 132: 62–71DOI 10.1007/2882_028© Springer-Verlag Berlin Heidelberg 2006Published online: 10 March 2006
J. FriedrichG. KühnR. MixK. HoffmannU. Resch-Genger
Tailoring of Polymer Surfaceswith Monotype Functional Groupsof Variable Density Using Chemicaland Plasma Chemical Processes
J. Friedrich () · G. Kühn · R. Mix ·K. Hoffmann · U. Resch-GengerBundesanstalt für Materialforschung und-prüfung, 12200 Berlin, Germanye-mail: [email protected]
Abstract Polymer surfaces weremodified in low-pressure glowdischarge plasmas for introductionof monotype functional groups ofdifferent type and density. For thispurpose three ways are selected, (i)oxygen plasma treatment followedby wet-chemical reduction of Ofunctional groups to OH groups, (ii)plasma bromination for introducingC−Br groups and (iii) coating bydeposition of thin plasma (co-)polymerized layers of functionalgroups-bearing monomers with OH,NH2, COOH, epoxy etc. functionali-ties. Subsequently, these groups wereused as anchoring points for chem-ical grafting of spacer molecules,oligomers, prepolymers, fluores-cent labels, ionic and nucleic acidresidues, employing different chem-ical routes. The yield in monosort
functional groups at polymer surfacesranged from 10–14 (process i), 20–40 (process ii) and 18–31 groupsper 100 C atoms (process iii) asmeasured by XPS after derivatiza-tion. The consumption of functionalgroups amounted to 40–90% of allfunctionalities present at the surfaceand depended on the dimensions ofgrafted molecules. For infinitely vari-ably tuning the number of functionalgroups process iii was performedas copolymerization of a func-tional group-carrying comonomerwith a non-functionalized(“chain-extending”) comonomer.
KeywordsIntroduction of functionalgroups · Plasma modification ·Reactions at polymer surfaces
Introduction
The aim of this work was to introduce monotype func-tional groups at polymer surfaces for subsequent chemicalgrafting of a variety of functional molecules, oligomersand polymers. The controlled introduction of functionalgroups onto most often chemically inert polymer surfacescan be preferentially performed using plasmachemicalprocesses. Such low-temperature glow discharge plas-mas are well suited to attack the polymer surface, form-ing thereby reactive sites, which present binding sitesfor functional group-forming atoms or radical fragmentsfrom plasma. First attempts were made by Hollahanwho used NH3 plasma for introducing primary amino
groups onto polypropylene surfaces and thus using thesesurfaces for interaction with heparin [1]. Later on itcould be shown that the reaction of ammonia plasmawith polymer surfaces always lead to the formation ofco-existing N-functionalities of different types amongthem NH2 groups not exceed a threshold concentrationgreater than 1–3 NH2 groups per 100 C also for a totalN-concentrations ≥ 20N/100 C [2]. Attempts to unbal-ance this product distribution using a NH3/H2 gas mix-ture remained unsuccessful [3]. Using the oxygen plasmaalso a broad variety of different O-functional groups isproduced at polymer surfaces [4], amongst them the con-centrations of OH groups typically amounting to 2–4OH groups/100 C. The formation of OH groups de-

Tailoring of Polymer Surfaces 63
mands the preceding abstraction of H from the poly-mer. Since the binding energies of C−H and C−Cbonds are energetically similar a simultaneous polymerchain scission is plausible. Thus, a polymer rearrange-ment is often observed. Also in this case an improve-ment in selectivity of the formation of monotype ofO-functional groups is not realistic, otherwise the O-functionalization passes into polymer degradation andetching. Therefore, only a two-step process can be con-sidered that counterbalances the unsatisfying result of theO2 plasma modification by using a wet-chemical reductionprocess. This was first presented by Nuzzo and Smolin-sky [5] and later perfected [6]. In this way a concentra-tion of 10–14 OH groups/100 C was realized (process i)with a maximum selectivity of about 60% within all O-functionalities [7].
An elegant one-step process was introduced by ourgroup consisting of the polymer surface bromination byHCBr3 (process ii) [8]. Tuning of the Br-concentration wasachieved by varying the treatment time. Thus, 20–40 cova-lently bonded Br-groups/100 C could be introduced ontothe surface, with selectivities near 100%. Only traces ofBr-anions were found as side-product.
A more complicated but very variable process (iii) wasthe pulsed plasma-initiated polymerization or copolymer-ization. Here, the desired monotype functional groups areprovided by the monomer, which are polymerized in thepulsed plasma. The art in producing such 50 nm thickmonotype functionalized polymer coatings lays in carry-ing out the plasma process under as mild conditions aspossible to avoid fragmentation of monomers and to pre-serve and remain the functional groups of the respectivemonomers.
More recently, application of the continuous-waveplasma mode allowed polymerization of any evaporableorganic substance. Alone this ability showed the com-plete different polymerization mechanism in plasmas incomparison to classic polymerizations. Accordingly, theplasma polymerization was characterized as “fragmentation-polyrecombination” process or as “atomic” polymer-ization [9, 10]. It is to be expected that using sucha continuous-wave plasma polymerization the retentionof functional groups during the process is low withinirregular polymer structures caused by the complete frag-mentation and random recombination processes. However,this process could be significantly improved by introduc-tion of the pulsed plasma technique consisting of shortplasma pulses (0.1–1 ms), required for monomer activa-tion, and long plasma-off periods (1–100 ms) needed fora pure chemical chain propagation instead of the randomrecombination of fragments. Together with minimizing theplasma power-input the monomer fragmentation could besuppressed and the number of retained functional groupsin the deposited plasma polymer layer should be max-imum in comparison to the number of functional groupsoriginally present in the monomer molecules. 60–95% of
the functional groups could be recovered at the polymersurface [11].
The variety of monomers suited for this “plasma-initiated” polymerization is similar to that of ordinarypolymer chemistry. Thus, allyl alcohol, allylamine oracrylic acid produce OH, NH2 or COOH groups, however,with the anomaly that under low pressure conditions thedegradative chain transfer is absent, so that it is possible toproduce high-molecular weight allyl polymers. The samereaction principle is valid for the copolymerization used toadjust the number of functional groups. However, also inthis case, the rules of classic copolymer chemistry are validfor combining compatible pairs of comonomers. Never-theless yet, to a smaller content, the known disadvantagesof all plasma techniques remain, such as occurrence oftrapped radical sites, auto-oxidation, crosslinking and ir-radiation defects etc. [12].
The accordingly generated functional groups can thanbe subject to further derivatization and grafting, for ex-ample using dioles and diamines (Br groups), silanes andisocyanates (OH groups), aldehydes (NH2 groups) or al-cohols (COOH groups), respectively. In this paper dif-ferent strategies for controlled functionalization of poly-mer surfaces are presented including subsequent graftingroutes for the introduction of functional molecules, spac-ers, biomolecules, and prepolymers.
Experimental
Polymer Substrates
Polypropylene (PP) foils with a thickness of 100 µm(goodfellow, U.K.) or 300 µm (Ciba Geigy Switzerland) aswell as polyethylene (PE, Lupolen, BASF) foil (100 µm)were ultrasonically cleaned in a diethyl ether bath for15 min. The monomers used, i.e. acrylic acid, allyl al-cohol and allylamine (all > 99%), were purchased fromMerck KGaA, Darmstadt, Germany and distilled beforeuse. The monomers, ethylene and butadiene-1,3, suppliedby Messer-Griesheim GmbH, Germany, were used as re-ceived.
Plasma Functionalization of Polymer Surfaces
Plasma treatments (O2 and HCBR3 plasmas) were per-formed in a cylindrical plasma reactor of 50 dm3 volume.The design of the plasma reactor has been described indetail in [13]. The reactor was equipped with a radio-frequency (r.f., 13.56 Mhz) generator with an automaticmatching unit and an r.f. bar antenna (length: 35 cm). Thesubstrate foil was mounted on a continuously rotating,grounded steel cylinder (ø = 10 cm, length = 35 cm, ro-tating frequency = 0.5–1 s−1) at the distance of 10 cm tothe r.f. powered electrode. Surface functionalization of PPfoils in the O2 plasma was performed in the continuous-wave (cw) mode. The power input was varied between

64 J. Friedrich et al.
P = 10–100 W. Mass flow controllers for gases anda standard pressure of 6 Pa were adjusted. For productionof an oil-free high vacuum a turbomolecular pump was ap-plied. Using aggressive gases or vapours a cryo trap wasinterposed between reactor and pump.
Deposition of Functional GroupsBearing Plasma Polymer Layers
Plasma polymer layers were deposited in the same reac-tor as described before. However, in this case, the pulsedplasma mode was applied. The duty cycle of pulsingwas adjusted generally to 0.1 and the pulse frequencyto 103 Hz. The power input was varied between P =100–300 W. Mass flow controllers for gases and vapours,a heated gas/vapour distribution in the chamber, and con-trol of pressure and monomer flow by varying the speedof the turbomolecular pump were used. The gas flow wasadjusted to 75–125 sccm and the pressure was varied be-tween 10 to 26 Pa depending on the respective polymeriza-tion or copolymerization process. The deposition rate wasmeasured by a quartz microbalance.
Surface Analysis
The XPS (X-ray Photoelectron Spectroscopy) and IR ana-lyses have been described in detail elsewhere [14]. Here,only some important facts are summarized. The XPS dataacquisition was performed with a SAGE 150 Spectrometer(Specs, Berlin, Germany) using a non-monochromatizedMgKα or AlKα radiation with 12.5 kV and 250 W settingsat a pressure ≈ 10−7 Pa in the analysis chamber. XPS spec-tra were acquired in the constant analyzer energy (CAE)mode at 90 take-off angle. Peak analysis was performedusing the peak fit routine from Specs.
The FTIR spectra were recorded with a NEXUS in-strument (Nicolet, USA) using the ATR (Attenuated TotalReflectance, 45 angle of incidence) technique with a di-amond or a Ge cell (“Golden Gate”, Specac, Kent, UK).The IR signal results from a near-surface layer of the poly-mer film. The information depth depends on the materialused as ATR crystal and amounts to about < 1.5 µm usingGermanium and 2.5 µm applying diamond.
Metal Evaporation and Peel Test
For measuring the Al-polymer (PP) peel strengths theplasma polymerization was performed using the previ-ously described reactor. Then, the plasma polymer coatedpolymer samples were transferred into a separate elec-tron beam metallizer (Auto 306, Edwards, UK). Thethickness of deposited aluminium layers was adjusted to150–200 nm using a quartz microbalance. The metal peel-
ing technique for Al-PP and Al-PTFE systems followedDuPont’s preparation and peeling procedure. The Al sideof the composite was fixed on a double-faced scotch tape,which was pressed onto a steel plate. Then, a 90 peel testwas carried out at a peel speed of 25 mm/min for all Al-polymer systems.
Spectroscopic Characterizationof Surface Functionalities by Means of XPS Probing
Derivatization of OH Groups. Samples with OH groupsat the surface were exposed to trifluoroacetic anhydride(TFAA) vapour for 10–15 min after evacuation to 103 Pain order to transform the hydroxyl groups into a fluorinatedderivate that can much better detected and quantified:
|−OH+ (CF3 −CO)2O
→ |−O−CO−CF3 +CF3 −COOH
Afterwards these samples were degassed at a pressureof 10−5 Pa to remove free trifluoroacetic acid [15]. Thederivatization of OH groups was proved to be highlyselective (ca. > 90% [16]). F1s peak intensities in theXP spectrum as well as > C = O (1785 cm−1) and CF3(1223 cm−1) stretching vibrations were used to evaluatethe number of surface OH groups. The yield of this reac-tion is about 90%.
Derivatization of NH2 Groups. Primary amino groupsreact with pentafluorobenzaldehyde (PFBA) by formationof an schiff’s base:
|−NH2 +OHC−Phenyl−F5 → |−N = C−Phenyl−F5
Similar to the OH derivatization, labelling of the NH2groups was performed as a gas-phase reaction. The sam-ples were exposed to PFBA vapour at 45 C for 2 h andsubsequently degassed at a pressure of 10−5 pa for 8 hto remove non-consumed PFBA. This labelling reactionreaches yields in the range of 80% [17].
Derivatization of COOH Groups. Carboxylic groups wereidentified by labelling with vapours of trifluoroethanol inthe presence of di-tert-butyldiimide and pyridine over 8 to20 h [18]:
|−COOH+CF3 −CH2 −OH+(CH3)3C−N = C = N−C(CH3)3 →|−COO−CH2 −CF3 +(CH3)3C−NH−CO−NH−C(CH3)3
Afterwards the samples were degassed at a pressure of10−5 Pa to remove non-reacted components. The yield ofthis reaction is about 90% (see also [19]).

Tailoring of Polymer Surfaces 65
Reduction and Grafting Techniques
General Method. All solvents used were of analyticalreagent grade. Toluene and THF were refluxed under N2,and over sodium and benzophenone. Pyridine was distilledand stored over KOH pellets. Water was doubly distilledbefore use. All the silanes were vacuum-distilled and allreactions were performed under N2 atmosphere. Reactionson polypropylene films were normally carried out withpieces of 5×5 cm or for industrial applications with foilsof 35×24 cm.
Reduction of O2 Plasma Treated Polypropylene Film. Theoxygen plasma treated foils were stirred under N2 at roomtemperature in 12 ml dry THF and 3 ml of 1 M diboranesolution for 18 hours. The foils were removed and im-mersed in an alkaline H2O2 and THF for 2 hours. Then,the foils were washed with THF, water (thrice) and withmethanol. The modified foils were dried and stored ina desiccator. The reduction with LiAlH4 was performed inether for 2 hours. Vitride (SDMA-Sodium dihydrobis(2-methoxyethoxy)aluminate) was processed in toluene for 2hours and then the reaction product was hydrolized withNaOH.
Glycolate Spacer. For grafting of glycolate spacers PPfoils with C−Br groups were dipped into a glycolate so-lution. For this purpose dried glycolates were dissolvedin dried tetrahydrofuran and mixed with sodium at 50 Cemploying NaI as catalyst. Then, the plasma-brominatedPP foil was rotated in the glycolate solution for 20 h.Washing and extracting processes to remove by-productscompleted the reaction. The derivatization with diaminespacers was achieved using a similar procedure as withglycolates.
|−Br +Na[O−CH2 −CH2]6 −OH →|−[O−CH2 −CH2]6 −OH+NaBr (Williamson)
|−Br +Na[NH−CH2 −CH2]6 −NH2 →|−[NH−CH2 −CH2]6 −NH2 +NaBr (Gabriel-like)
Undecenylsilane Spacer. The undecenyl chloride was pre-pared by chlorination of undecenyl alcohol using carbontetrachloride and triphenyl phosphine, in 80% yield. Afterpurification of undecenyl chloride, it was converted intoa Grignard reagent and was added to a solution of SiCl4 indry benzene. This afforded 10-undecenyltrichlorosilane ina 75% yield. NMR and IR spectroscopies characterized allintermediates and final products.
Adsorption of Undecenyl Trichlorosilane onto the Polypro-pylene Film. Chemisorption of undecenyltrichloro-silanewas performed at ambient temperature in stirred solution of
undecenyltrichlorosilane (concentration −0.02 M) in a sol-vent mixture of 80% n-hexadecane + 12% carbon tetra-chloride + 8% chloroform. All the solvents were passedthrough columns of alumina and chloroform was stabi-lized with absolute ethanol (1 vol %). The polypropylenefilm was immersed in the above solution for 1–2 minutesand washed with carbon tetrachloride and water and thenextracted with 1 : 1 v/v chloroform and ethanol for 15 min-utes in a Soxhlet apparatus [20].
|−OH+Cl3Si− (CH2)9 −CH = CH2 →|−O−Si(OH)2 − (CH2)9 −CH = CH2
Hydroboration of Vinyl Groups. The 10-undecenyltri-chlorosilane coated polypropylene substrate was im-mersed into a solution of diborane in THF (1M, Aldrich)and was dipped for 1 minute into an alkaline H2O2 solu-tion. The film was rinsed with distilled water and dried.
|−O−Si(OH)2 − (CH2)9 −CH = CH2 +B2H6/H2O2 →|−O−Si(OH)2 − (CH2)11 −OH
Adsorption of γ -Aminopropyltrimethoxysilane onto thePolypropylene Film. The reaction with γ -aminopropyltri-methoxysilane was performed using 2% v/v toluene so-lution under N2 atmosphere for 16 hours. The film wassuccessively washed with toluene, chloroform, and ace-tone. Then the film was washed with water for half an hour.Finally, methanol washing was performed and the film wasdried.
Introduction of the Glutaraldehyde Spacer. The γ -amino-propyltrimethoxysilane modified surface was treated with5% v/v aqueous glutaraldehyde solution. The reaction wasperformed at ambient temperature for 24 hours. The filmwas washed with water and dried.
Alanine or Cysteine Grafting. The PP surface modifiedwith γ -aminopropyltrimethoxysilane and glutaraldehydewas incubated in a solution consisting of 1.0 g of alanineor cysteine dissolved in 10 ml of doubly distilled water fora period of 3 hours. The, the film was washed with waterand methanol and dried.
Reactions of Isocyanates with OH and NH2 Groups.Under exclusion of humidity, isocyanate-containing mono-mers react slowly with OH groups at polymer surfaces.The reaction was catalyzed by dibutyltin dilaureate. Thus,a covalent linkage by formation of urethane groups wasreached. Using diisocyanates and hydrolyzing the non-consumed isocyanate groups the formation of spacerbonded amino groups is possible. Using surfacial NH2groups instead of OH groups isocyanates react under for-mation of urea linkages.

66 J. Friedrich et al.
Results
Monotype Functionalization
Reduction of Oxygen Plasma Introduced Oxygen-con-taining Groups on PP and PE Surfaces to OH Groupsby Diborane. Using the oxygen r.f. pulsed-plasma mod-ification the attachment of oxygen containing functionalgroups onto the surface of PP could be demonstratedby a series of ATR-FTIR spectra (Fig. 1). A strongcarbonyl band (≈ 1700 cm−1), alcoholic structures (≈1100–1200 cm−1), a broad OH peak and adsorbed wa-ter related features (≈ 3100–3500 cm−1) appear. Surfaceswith an O/C ratio of about 0.2 were used for further chem-ical processing.
The XP spectra of PP of different stages of process-ing are shown in Fig. 2, e.g. for as received, after low-pressure oxygen plasma pretreatment, diborane reductionand derivatization with TFAA. The plasma treatment pro-duces a strong O1s peak. After TFAA derivatization ofplasma-generated OH groups only a small F1s peak ata binding energy of 689 eV is detected at the PP surface in-dicating low concentration of OH groups after O2 plasmatreatment.
This low concentration of OH groups is not surpris-ing because the oxygen plasma cannot deliver additionalhydrogen for the formation of OH groups. Such hydro-gen sources may be abstracted hydrogen from the poly-mer backbone and hydrogen from dissociation of desorbedwater from the walls of the reactor. Comparing the F1speaks in the survey scans with and without diborane reduc-tion and derivatization of formed OH groups (cf. Fig. 2)it is obviously that the diborane reduction strongly in-creases the yield of OH groups from about 2–4 OH/100C without further chemical post-plasma treatment to 11–
Fig. 1 ATR-FTIR absorbance spectra after different treatment stepsof PP foils using a Ge crystal and 45 angle of incidence
Fig. 2 XP spectra after different treatment steps of pp foils
13 OH/100 C under optimal conditions of the reductionwith diborane. These conditions were the hydrolysis withNaOH and the oxidation of C = C bonds in the presence ofH2O2.
Comparison of Reduction between Diborane and LiAlH4.Using LiAlH4 as reducing agent C−O−C bonds canbe additionally converted to OH groups. Accordingly, theyield in OH groups is thus slightly increased (Fig. 3).However, the C−O−C scission are unwished, leads toa degradation of the polymer backbone and a decrease inmolecular weight. Thus, it cannot be excluded that a num-ber of newly formed OH groups are removed together withpolymer fragments during wet-chemical processing. Simi-lar results were obtained using vitride as reducing agent.
Fig. 3 Yield of OH groups for different types of wet-chemicalreduction of O functional groups produced by O2 plasma pretreat-ment

Tailoring of Polymer Surfaces 67
Bromination. Bromination of polymer surface employingthe bromoform plasma presents a highly selective methodof controlled surface functionalization. Only traces of Branions were detected as negligible side-products by meansof XPS and, under adverse conditions, the deposition ofpolymer layers was observed as measured with a microbal-ance. The XPS measured introduction of Br at polymersurfaces for two types of plasma treatment is illustrated inFig. 4.
The percentage of surface bromination could be ad-justed between 0 and 45 Br per 100 C by variation of treat-ment time. Exposure to air causes a post-plasma additionof oxygen.
Fig. 4 Introduction of Br vs. treatment time
Williamson’s Ether Synthesis. The C−Br groups ofbrominated PP surfaces reacted with sodium ethylene gly-colates with n = 2, 3, 4, 5 and 22 (PEG 1000) glycol unitsyielding in spacer-bonded OH groups. The concentrationof these spacer-bonded terminal OH groups was in thesame order as that of the directly to the surface bondedOH groups. It was also possible to attach a C6 spacer ontoC−Br groups with an amino end group using sodium hex-amethylene diamine (Fig. 5).
Both end groups at the spacer molecule, OH and es-pecially NH2, are important for further biochemical syn-thesis. As follows from XPS measurements, in all casesonly 2% Br was not consumed and remained at the PPsurface. It was assumed that either steric problems playeda role or these bromine groups were not situated directly atthe surface. For all glycolate spacers a “functionalizationdensity” of about 5 spacer-bonded OH groups per 100 Cwas measured. Additionally, two directly at the surfacebonded (without spacer) OH groups per 100 C atoms werealso detected. 4–5 NH2 groups/100 C were found using
Fig. 5 Scheme of synthesis at brominated or hydroxylated polymersurfaces
the hexamethylene diamine spacer. In each case the start-ing concentration of bromine groups was about 10 C−Brgroups, so that about 50% of these groups were consumedby attachment of spacer molecules.
Silane Spacer. Undecenyltrichlorosilane was reacted withOH groups produced by oxygen plasma modification andhydroboration (B2H6/H2O2) (cf. Fig. 5). The yield of thisreaction (attachment of C11 spacers) amounts to about 7.This means a selectivity of about 70% starting with 10OH groups per 100 C. Additionally 2–3 unreacted and di-rectly bonded OH groups per 100 C atoms remained at thepolymer surface. Subsequently, the undecenyl spacer wasmodified and now bearing bromo, cyano or amino groupsin comparable yields and selectivities.
Azomethine Group Containing Spacers and Coupling ofAmino Acids. Another approach to covalently fix spacermolecules onto a hydroxylated polymer surface consistedin the attachment of γ -aminopropyltrimethoxysilane. Thisresults in a polymer surface coated with primary aminogroups. These groups reacted with glutaraldehyde actingas a spacer. The spacer can facilitate the attachment ofbioactive molecules such as phospholipids or amino acidsand can be also used as a starting-point for biochemi-cal synthesis. Therefore, simple amino acids, alanine andcysteine, were attached to the spacer (cf. Fig. 6). 4 to 6 car-boxylic end groups were formed by this reaction pathwaystarting from 10 OH/100 C produced by oxygen plasmatreatment and diborane reduction.
Isocyanate Grafting. Weakly O2 plasma-treated and dib-orane reduced polypropylene foils with about 7 OH/100C were reacted with diisocyanates (hexamethylene di-isocyanate (HDI), methylene-di-p-phenylene isocyanate(MDI) and toluylene-2,4-diisocyanate (TDI)) as schemati-cally shown in Fig. 7. Subsequently, different fluorescence

68 J. Friedrich et al.
Fig. 6 Reaction scheme of covalent alanine grafting onto polypropy-lene surfaces
Fig. 7 Schematics of the reactions of hydroxylated PP surfaces withdiisocyanates and fluorophores
labels as dansylchloride (DNS), dansylhydrazine (DNH)and dansylcadaverine (DNC) were grafted.
The reaction with HDI was too slow and the hydrol-ysis (Fig. 7a) not clearly reproducible. Using MDI andTDI the reactions 7b and 7c result in the attachment ofca. 1 fluorophore/100 C and in satisfying absorbance-fluorescence spectra.
Stability of Surface Functionalization. Precondition forany chemical processing of functional groups at polymersurfaces is their stability during storage and chemical con-sumption. According to XPS data, long-time storage ofO2 plasma treated and diborane reduced polymer sam-ples resulted in a loss of functional groups. 30 to 50% ofall OH groups disappeared after storage of 6 month. Thisdecrease in concentration of functional groups during ex-posure to the air could be mostly prevented by storage at−20 C. However, the reactivity of these long-time storedsamples was high enough for further biochemical process-ing. One possible explanation for the diminution of func-tional groups was given by H. Yasuda who had observeddiffusion of functionalized macromolecule segments awayfrom the surface to the bulk of polymers [21].
Moreover, wet-chemical processing, especially the di-borane reduction, has quenched all trapped C radical sitesin polymers (cf. [22]), inevitably formed by each plasmaprocessing of polymers. Thus, auto-oxidation processesduring storage are nearly eliminated as XPS results let sug-gest. The formation of low molecular weight species in thesub-surface during plasma treatment and then their sub-sequent diffusion to the surface was generally avoided byusing short plasma treatment times (O2 plasma t ≤ 2 s,HCBr plasma t ≤ 5 s. More recently, it could be demon-strated that such short exposure to the oxygen plasma nei-ther change the supermolecular structure of polymers norproduce polymer degradation [23].
Deposition of Functional Groups-carrying PlasmaDeposited Homopolymers as Anchoring Pointsfor Grafting
Pulsed Plasma Polymerization. Allyl alcohol, allylamineand acrylic acid were polymerized in pulsed plasma to re-tain a maximum in functionalities in the resulting plasmapolymer. The retention of functional groups during theplasma process, introduced by functional-group carryingmonomers and followed by deposition to polymer layers,was primarily measured by XPS including the chemicalderivatization of these groups as described in Experi-mental. These layers were also checked for side-productsby respective IR spectra. The results are summarized inTable 1.
Table 1 Absolute and relative yields in functional groups at the sur-face of deposited pulsed plasma polymer layers measured with XPSafter derivatization (cf. Experimental, 100 W)
Group Mono- Theoretical Measured Yield in Charac-mer stoichio- stoichio- functional teristic side-
metry metry groups products(per 100 C)
OH Allyl 100 C/ 100 C/ 31 > C = Oalcohol 33 O 33 O (95%)
NH2 Allyl- 100 C/ 100 C/ 21 C−N−C,amine 33 N 36 N/4 O (65%) C ≡ N,
C−OCOOHAcrylic 100 C/ 100 C/ 26 > C = O
acid 67 O 60 O (79%)– Ethy- 100 C 100 C/ – > C = O,
lene 3 O C−O,C = C
Homopolymerization. OH and COOH groups contain-ing homopolymer layers could be reproducibly depositedwithout significant amounts of by-products and withoutageing tendency if exposed to the air. Therefore, these
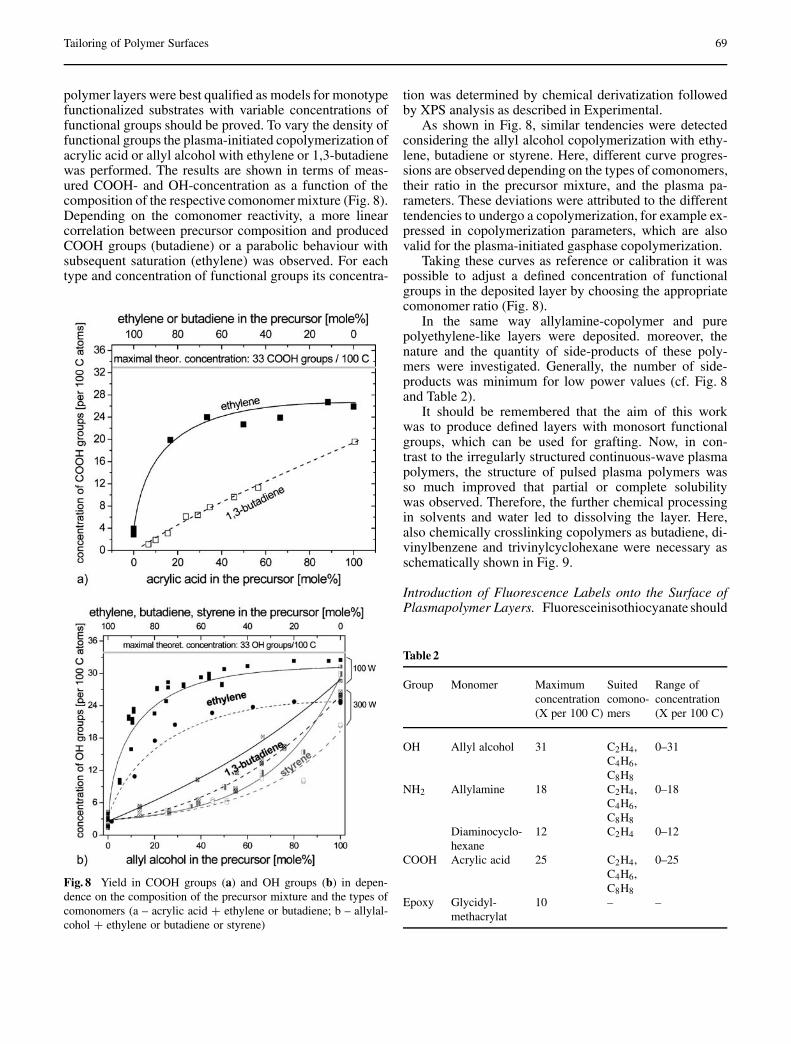
Tailoring of Polymer Surfaces 69
polymer layers were best qualified as models for monotypefunctionalized substrates with variable concentrations offunctional groups should be proved. To vary the density offunctional groups the plasma-initiated copolymerization ofacrylic acid or allyl alcohol with ethylene or 1,3-butadienewas performed. The results are shown in terms of meas-ured COOH- and OH-concentration as a function of thecomposition of the respective comonomer mixture (Fig. 8).Depending on the comonomer reactivity, a more linearcorrelation between precursor composition and producedCOOH groups (butadiene) or a parabolic behaviour withsubsequent saturation (ethylene) was observed. For eachtype and concentration of functional groups its concentra-
Fig. 8 Yield in COOH groups (a) and OH groups (b) in depen-dence on the composition of the precursor mixture and the types ofcomonomers (a – acrylic acid + ethylene or butadiene; b – allylal-cohol + ethylene or butadiene or styrene)
tion was determined by chemical derivatization followedby XPS analysis as described in Experimental.
As shown in Fig. 8, similar tendencies were detectedconsidering the allyl alcohol copolymerization with ethy-lene, butadiene or styrene. Here, different curve progres-sions are observed depending on the types of comonomers,their ratio in the precursor mixture, and the plasma pa-rameters. These deviations were attributed to the differenttendencies to undergo a copolymerization, for example ex-pressed in copolymerization parameters, which are alsovalid for the plasma-initiated gasphase copolymerization.
Taking these curves as reference or calibration it waspossible to adjust a defined concentration of functionalgroups in the deposited layer by choosing the appropriatecomonomer ratio (Fig. 8).
In the same way allylamine-copolymer and purepolyethylene-like layers were deposited. moreover, thenature and the quantity of side-products of these poly-mers were investigated. Generally, the number of side-products was minimum for low power values (cf. Fig. 8and Table 2).
It should be remembered that the aim of this workwas to produce defined layers with monosort functionalgroups, which can be used for grafting. Now, in con-trast to the irregularly structured continuous-wave plasmapolymers, the structure of pulsed plasma polymers wasso much improved that partial or complete solubilitywas observed. Therefore, the further chemical processingin solvents and water led to dissolving the layer. Here,also chemically crosslinking copolymers as butadiene, di-vinylbenzene and trivinylcyclohexane were necessary asschematically shown in Fig. 9.
Introduction of Fluorescence Labels onto the Surface ofPlasmapolymer Layers. Fluoresceinisothiocyanate should
Table 2
Group Monomer Maximum Suited Range ofconcentration comono- concentration(X per 100 C) mers (X per 100 C)
OH Allyl alcohol 31 C2H4, 0–31C4H6,C8H8
NH2 Allylamine 18 C2H4, 0–18C4H6,C8H8
Diaminocyclo- 12 C2H4 0–12hexane
COOH Acrylic acid 25 C2H4, 0–25C4H6,C8H8
Epoxy Glycidyl- 10 – –methacrylat

70 J. Friedrich et al.
Fig. 9 Schematics of chemically crosslinking by copolymerization
be covalently bonded to polymer surfaces via NH2 groupsinstead of OH groups. For this purpose, allylamine (andallylamine-butadiene copolymers – in process) poly-mer layers were deposited onto polypropylene foils (cf.Fig. 10). These layers were relatively stable at processingin aqueous solution or in thf. by means of derivatiza-tion of NH2 groups with pentafluorobenzaldehyde orp-trifluoromethylbenzaldehyde their concentration wascalculated to about 12 NH2/100 C. Two reaction pathwaysfollow, the consumption with the thioisocyanate (a) and withglutaraldehyde and dansylhydrazine or dansylcadaverine(Fig. 10). Immediate transfer to wet-chemical processingavoided problems with the auto-oxidation of the aminogroup containing plasmapolymers, when exposed to air.
Fig. 10 Covalent bonding of fluorophores onto primary aminogroups of allylamine pulsed plasma polymer layers (a – fluores-cein bonding; b – dansylhydrazine bonding; c – dansylcadaverinebonding)
Application of Plasmapolymers as Adhesion-promotingLayers in Metal-polymer Composites. Functional groupcarrying plasma polymers are also well suited as adhesion-promoting interlayers in metal-polymer composites [24].Monotype-functional groups at polypropylene surfacesand tuning of their density are prerequisites for theinvestigation of the individual contribution of alumin-ium-functional group interactions to the respective bondstrength of Al-evaporated (200 nm) – polypropylene com-posites. A linear dependence of aluminium adhesive bondstrength on the concentration of functional groups at the
interface was found for peel strengths from 0 to at least300 N/m (Fig. 11). This linearity is limited by changingfrom pure interface failures to cohesive failures in themetal-polymer systems. The slope of these linear curvesections correlates well with the tendencies of functionalgroups to undergo a reaction with aluminium atoms andwith the strength of formed covalent Al-polymer bonds.An important message from these experiments was thatchemical interactions of metal-functional groups playa dominant role as demonstrated by the high strength ofcomposites with functional groups, which can form chem-ical interactions or bonds to Al.
It should be remarked that the plasma surface func-tionalization by oxygen plasma with and without reductionto monotype OH functional groups yields a lower peelstrength compared to the use of the monotype functionalgroups bearing adhesion-promoting plasmapolymer layers(cf. Fig. 11).
Fig. 11 Dependence of Al-polymer peel strengths on type of poly-mer surface modification (thick lines – adhesion-promoting plasmapolymers, thin dotted lines – O2 plasma treated) and concentrationof functional groups at polymer surfaces
Conclusions and Summary
A few synthetic routes were presented for preparationof inert polymer surfaces with chemically reactive func-tional groups as Br, OH, COOH, NH2 etc. These func-tional groups are accessible for grafting of other chem-ical species as organic molecules with specific functionsand prepolymers. Another application of these functionalgroups is their reactivity towards metal atoms for produc-ing well-adhering metal-polymer composites. For the firsttime, these functional groups are provided as more or lessmonotype functional groups. This monosort functionaliza-tion on polymer surfaces is a pre-requisite for both thestarting of chemical graft reactions of biomolecules as well
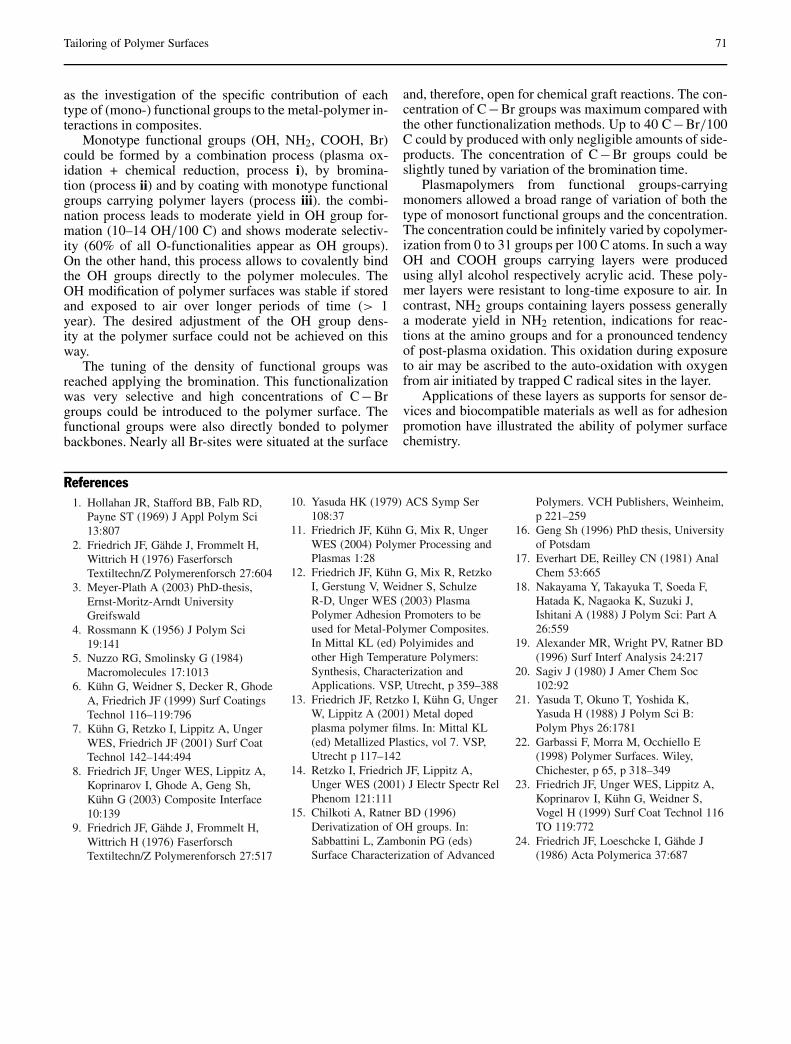
Tailoring of Polymer Surfaces 71
as the investigation of the specific contribution of eachtype of (mono-) functional groups to the metal-polymer in-teractions in composites.
Monotype functional groups (OH, NH2, COOH, Br)could be formed by a combination process (plasma ox-idation + chemical reduction, process i), by bromina-tion (process ii) and by coating with monotype functionalgroups carrying polymer layers (process iii). the combi-nation process leads to moderate yield in OH group for-mation (10–14 OH/100 C) and shows moderate selectiv-ity (60% of all O-functionalities appear as OH groups).On the other hand, this process allows to covalently bindthe OH groups directly to the polymer molecules. TheOH modification of polymer surfaces was stable if storedand exposed to air over longer periods of time (> 1year). The desired adjustment of the OH group dens-ity at the polymer surface could not be achieved on thisway.
The tuning of the density of functional groups wasreached applying the bromination. This functionalizationwas very selective and high concentrations of C−Brgroups could be introduced to the polymer surface. Thefunctional groups were also directly bonded to polymerbackbones. Nearly all Br-sites were situated at the surface
and, therefore, open for chemical graft reactions. The con-centration of C−Br groups was maximum compared withthe other functionalization methods. Up to 40 C−Br/100C could by produced with only negligible amounts of side-products. The concentration of C−Br groups could beslightly tuned by variation of the bromination time.
Plasmapolymers from functional groups-carryingmonomers allowed a broad range of variation of both thetype of monosort functional groups and the concentration.The concentration could be infinitely varied by copolymer-ization from 0 to 31 groups per 100 C atoms. In such a wayOH and COOH groups carrying layers were producedusing allyl alcohol respectively acrylic acid. These poly-mer layers were resistant to long-time exposure to air. Incontrast, NH2 groups containing layers possess generallya moderate yield in NH2 retention, indications for reac-tions at the amino groups and for a pronounced tendencyof post-plasma oxidation. This oxidation during exposureto air may be ascribed to the auto-oxidation with oxygenfrom air initiated by trapped C radical sites in the layer.
Applications of these layers as supports for sensor de-vices and biocompatible materials as well as for adhesionpromotion have illustrated the ability of polymer surfacechemistry.
References1. Hollahan JR, Stafford BB, Falb RD,
Payne ST (1969) J Appl Polym Sci13:807
2. Friedrich JF, Gähde J, Frommelt H,Wittrich H (1976) FaserforschTextiltechn/Z Polymerenforsch 27:604
3. Meyer-Plath A (2003) PhD-thesis,Ernst-Moritz-Arndt UniversityGreifswald
4. Rossmann K (1956) J Polym Sci19:141
5. Nuzzo RG, Smolinsky G (1984)Macromolecules 17:1013
6. Kühn G, Weidner S, Decker R, GhodeA, Friedrich JF (1999) Surf CoatingsTechnol 116–119:796
7. Kühn G, Retzko I, Lippitz A, UngerWES, Friedrich JF (2001) Surf CoatTechnol 142–144:494
8. Friedrich JF, Unger WES, Lippitz A,Koprinarov I, Ghode A, Geng Sh,Kühn G (2003) Composite Interface10:139
9. Friedrich JF, Gähde J, Frommelt H,Wittrich H (1976) FaserforschTextiltechn/Z Polymerenforsch 27:517
10. Yasuda HK (1979) ACS Symp Ser108:37
11. Friedrich JF, Kühn G, Mix R, UngerWES (2004) Polymer Processing andPlasmas 1:28
12. Friedrich JF, Kühn G, Mix R, RetzkoI, Gerstung V, Weidner S, SchulzeR-D, Unger WES (2003) PlasmaPolymer Adhesion Promoters to beused for Metal-Polymer Composites.In Mittal KL (ed) Polyimides andother High Temperature Polymers:Synthesis, Characterization andApplications. VSP, Utrecht, p 359–388
13. Friedrich JF, Retzko I, Kühn G, UngerW, Lippitz A (2001) Metal dopedplasma polymer films. In: Mittal KL(ed) Metallized Plastics, vol 7. VSP,Utrecht p 117–142
14. Retzko I, Friedrich JF, Lippitz A,Unger WES (2001) J Electr Spectr RelPhenom 121:111
15. Chilkoti A, Ratner BD (1996)Derivatization of OH groups. In:Sabbattini L, Zambonin PG (eds)Surface Characterization of Advanced
Polymers. VCH Publishers, Weinheim,p 221–259
16. Geng Sh (1996) PhD thesis, Universityof Potsdam
17. Everhart DE, Reilley CN (1981) AnalChem 53:665
18. Nakayama Y, Takayuka T, Soeda F,Hatada K, Nagaoka K, Suzuki J,Ishitani A (1988) J Polym Sci: Part A26:559
19. Alexander MR, Wright PV, Ratner BD(1996) Surf Interf Analysis 24:217
20. Sagiv J (1980) J Amer Chem Soc102:92
21. Yasuda T, Okuno T, Yoshida K,Yasuda H (1988) J Polym Sci B:Polym Phys 26:1781
22. Garbassi F, Morra M, Occhiello E(1998) Polymer Surfaces. Wiley,Chichester, p 65, p 318–349
23. Friedrich JF, Unger WES, Lippitz A,Koprinarov I, Kühn G, Weidner S,Vogel H (1999) Surf Coat Technol 116TO 119:772
24. Friedrich JF, Loeschcke I, Gähde J(1986) Acta Polymerica 37:687

Progr Colloid Polym Sci (2006) 132: 72–81DOI 10.1007/2882_037© Springer-Verlag Berlin Heidelberg 2006Published online: 8 March 2006
Alla SynytskaLeonid IonovVictoria DutschkSergiy MinkoKlaus-Jochen EichhornManfred StammKarina Grundke
Regular Patterned Surfacesfrom Core-Shell Particles.Preparation and Characterization
Alla Synytska · Victoria Dutschk ·Klaus-Jochen Eichhorn · Manfred Stamm ·Karina Grundke ()Leibniz Institute of Polymer ResearchDresden e.V., Hohe Str. 6, 01069 Dresden,Germanye-mail: [email protected]
Leonid IonovMax-Planck-Institute of Molecular CellBiology and Genetics, Pfotenhauerstr. 108,01307 Dresden, Germany
Sergiy MinkoChemistry Department, ClarksonUniversity, Potsdam, NY13699-5810,USA
Abstract A simple route for fabri-cation of regularly patterned surfaceswith specifically designed surfaceroughness and chemistry is re-ported using colloidal particles.The surface was built up from self-assembled submicrometer- andmicrometer-sized monodispersecore-shell particles of different radius(0.1–10 µm) forming ordered arrays.In this way, an increase in the verticalroughness is achieved with increasingparticle radius, but without changingthe Wenzel roughness factor. Themorphology of the ordered particlearrays was characterized using an op-tical imaging method (MicroGlider),scanning force (SFM) and scanningelectron (SEM) microscopy. Theorganic shell was either preparedby covalent grafting of polymerbrushes or by chemisorption ofa silane with a long fluoroalkyl tail.From FTIR-ATR, diffuse reflec-tion IR spectroscopy, and capillarypenetration experiments, it wasconcluded that the grafted polymercompletely covers the surface of thesilica particles. The solid surfacetension of the organic shell obtainedfrom contact angle measurementson smooth surfaces decreased inthe following order: polystyrenebrush-PS (γsv = 28.9 mJ/m2) >copolymer of polystyrene and
2,3,4,5,6-pentafluoropolystyrenebrush-FPS (γsv = 24.3 mJ/m2) >chemisorbed (tridecafluoro-1,1,2,2-tetrahydrooctyl)dimethylchlorosilane-FSI(γsv = 18.3 mJ/m2). Water con-tact angle measurements revealedan influence of the surface heightroughness and the shell chemistryon the wettability. For all surfacesinvestigated, the contact angle hys-teresis increased on the rough modelsurfaces compared to the smoothsurfaces due to the increase of theadvancing contact angle and thedecrease of the receding angle.The lower the surface free energyof the shell chemistry, the smalleris the contact angle hysteresis onthe closely packed surface arrays.Further the contact angles varied withincreasing height roughness. A pos-sible explanation for this behaviour isthat the vertical roughness influencesthe curvature radius of the liquid intrapped air pockets at the solid-liquidinterface as was already assumedin the literature for nanostructuredmetal surfaces and paraffin-coatedsteel balls.
Keywords Core-shell particles ·Modification · Patterned surfaces ·Roughness · Wettability

Regular Patterned Surfacesfrom Core-Shell Particles.Preparation and Characterization 73
Introduction
It is well known that the surface properties of polymers arestrongly influenced by the topography of the surface. Inparticular, wetting processes can be controlled by the sur-face roughness [1–21]. The understanding of wetting onrough surfaces is therefore of great importance for funda-mental research, but also for numerous industrial applica-tions such as coatings, paintings, adhesives, microfluidictechnology, microelectronics, etc. Rough polymer surfacespossessing a low surface free energy are very promising assuper water-repellent synthetic materials with reduced ad-hesion properties [1–21]. In the centre of interest is herethe question of how does a microtexture reinforce the nat-ural hydrophobicity of a polymer surface. In most cases,wetting is studied on rough substrates prepared by plasmatreatment [22], corona discharge [23] or initially poroussubstrates [24]. Non-regularity and non-uniformity of suchsurfaces hamper the interpretation of the contact anglesand comparison with theoretical considerations. There-fore, regular structured surfaces appear to be suitable ob-jects for modelling of the liquid wetting behaviour. Theycan be prepared by different techniques including mould-ing [25], photolithography [8, 26] or soft lithography [27],microsphere sedimentation [28], parallel plate fluidic con-finement [29], microfluidic [30] and electrochemical depo-sition [31].
In this work, we report a new, versatile and experimen-tally simple approach for designing regularly patternedsurfaces for thorough study of wetting phenomenon.This approach is based on use of core-shell colloidalparticles. The surface is built up from self-assembledsubmicrometer- and micrometer-sized monodisperse core-shell particles forming ordered arrays. The preparationof structured surfaces from core-shell particles has sev-eral advantages: (i) immobilization of various polymersand low molecular weight compounds on the surface ofsilica particles allows control of wetting properties ofthe particle layer; (ii) spheres of any size can be coated;(iii) prepared surfaces are resistant to mechanical, chem-
Fig. 1 Chemical formulas of the polymers used: a carboxy-terminated polystyrene PS-COOH; b random carboxy-terminated copolymerof polystyrene and 2,3,4,5,6-pentafluoropolystyrene FPS-COOH; c 3-glycidoxypropyl trimethoxysilane (GPS); d tridecafluoro-1,1,2,2-tetrahydrooctyl) dimethylchlorosilane FSI
ical and thermal treatment; (iv) easily controlled surfaceroughness parameters (most important in this work) areavailable. Such surfaces can potentially be both modelsurfaces for fundamental research and templates for tech-nologically relevant micro scale structures with uniquegeometric and topographic properties. In this work wereport about the preparation, characterization and appli-cation of these surfaces for wetting experiments aimed toa better understanding of wetting on hydrophobic roughsurfaces.
Experimental Section
Materials
Highly polished single-crystal silicon wafers with nativesilicon oxide layers (Semiconductor Processing, Germany)were used as substrates. They were pre-cleaned by rinsing3 times in dichloromethane in an ultrasonic bath for 5 minfollowed by washing in a mixture of deionized water, am-monia solution (25%) and hydrogen peroxide (30%) in the1 : 1 : 1 volume ratio at 60 C for 1 h. After washing, thesubstrates were thoroughly rinsed with deionized reagent-grade water and then dried with nitrogen flux.
Carboxy-terminated polystyrene PS-COOH (Mn =45 900 g/mol, PDI = 1.05, purity 99.9%) synthesizedby anionic polymerisation was purchased from PolymerSource (Germany) (Fig. 1). Random carboxy-terminatedcopolymer of polystyrene (Aldrich) and 2,3,4,5,6-pentafluoropolystyrene (Aldrich), FPS-COOH (Mn =40 000 g/mol, PDI = 2.4) was prepared by free radicalpolymerisation in toluene with the ratio 80 : 20 (Fig. 1).Toluene (Aldrich) was distilled after drying over sodium.(Tridecafluoro-1,1,2,2-tetrahydrooctyl) dimethylchlorosi-lane (FSI) from Gelest (Germany) and 3-glycidoxypropyltrimethoxysilane (GPS) from ABCR (Germany) were usedas received (Fig. 1). Silica particles of different radius vary-ing from 0.1 to 10 µm were purchased in dry state fromGeltech (Germany), Microparticles (Germany) and DukeScientific Corporation (USA).

74 A. Synytska et al.
Scheme 1 Scheme of “grafting to” approach of carboxy-terminated polymer onto anchoring layer of GPS
Surface modification
The “grafting to” method was used to anchor polymerchains onto the surface of silica particles and siliconwafers (Scheme 1). The synthetic procedure starts with co-valent grafting of GPS to the surface. A self-assembledmonolayer of GPS on silicon wafer surfaces was preparedaccording to the procedure suggested by Luzinov [32]. Forthis, Si wafers were immersed in a 1% GPS toluene so-lution for 15 h under dry Ar atmosphere (< 1 ppm H2O).After treatment, GPS modified wafers were washed 3times in dry toluene under dry Ar atmosphere to avoidpolymerisation of non-grafted GPS and precipitation ofparticles. Afterwards, the silanized wafers were washed 2times with ethanol in ultrasonic bath for 5 min followed bydrying with nitrogen flux. The thickness of the GPS layerwas determined by null ellipsometry.
The similar procedure was used to adsorb GPS onto thesurfaces of silica particles. Before silanization, particleswere washed 3 times in dichloromethane followed by dry-ing in a vacuum oven at 110 C. GPS was chemisorbedfrom a 2% toluene solution. The particles concentration inthe solution was 5 wt %. To remove non-adsorbed GPS, theparticles were washed and centrifuged 6 times in toluene.
In the next step, polymer films (thickness: ∼ 200 nm)of PS-COOH or FPS-COOH were spin coated on the topof the GPS layer from 2% toluene solutions. After cast-ing, the films were annealed in a vacuum oven at 150 Cfor 15 h. Non-grafted polymer was removed by Soxhlet ex-traction in toluene for 6 h. The thickness of PS and FPSgrafted layers was determined using null ellipsometry.
For grafting of polymer onto the particle surface, GPSmodified particles were mixed with a 3% toluene solutionof desired polymer at room temperature during 24 h andthen dried. The particle concentration in the solution was3 wt %. Grafting was performed at 150 C during 15 h pro-ducing a dense polymer layer. Several circles of washingin toluene and centrifuging were needed to remove non-grafted polymer. FSI was chemisorbed from its vapouronto both Si wafer and layers of ordered particles at 100 C
during 4 h. The quality of FSI layers on Si wafer was con-trolled by water contact angle experiments and null ellip-sometry. It was found that the contact angle became con-stant, 113, after 2 h of deposition. Surfaces of Si wafersmodified with grafted polymers or FSI were smooth. Rootmean square roughness (rms) for all non-structured sur-faces was less than 1 nm.
Deposition of particles
Silica particles were deposited onto silica wafers usinga vertical deposition technique [33]. For this, a 1-wt %suspension of polymer-modified particles in toluene wasprepared. A suspension of non-modified particles was pre-pared in ethanol. Particles with grafted polymer were de-posited on the silicon wafer modified with the same poly-mer. Bare particles were deposited onto bare Si wafers. Forthis purpose, the wafer was vertically immersed into a col-loid suspension that was evaporated at 70 C during 4 h.Particles of a radius larger than 1.2 µm were deposited viasedimentation on a slightly inclined silica wafer modifiedwith a thin layer of the grafted polymer. The quality of thelayers was controlled by optical imaging instrument (Mi-croGlider), scanning force (SFM) and scanning electron(SEM) microscopy. In all cases substrates were covered bymultilayers of particles.
Sample characterization
Ellipsometry. Layer thickness of GPS, PS, FPS and FSI onthe flat silica wafers was evaluated at λ = 633 nm and anangle of incidence of 70 with a SENTECH SE-402 mi-crofocus null ellipsometer (lateral resolution is defined bythe beam spot of about 20 µm). The measurements wereperformed for each sample after each step of modificationto use the data of the previous step as a reference for thesimulation of ellipsometric data. Initially, the thickness ofthe native SiO2 layer (usually 1.4±0.2 nm) is calculatedat refractive indices n = 3.858 − i0.018 and n = 1.4598

Regular Patterned Surfacesfrom Core-Shell Particles.Preparation and Characterization 75
for the Si wafer and the SiO2 layer, respectively. Thethickness of the GPS layer (typically 0.8±0.1 nm) wasevaluated using the two-layer model Si/SiO2/GPS withn = 1.429. The thickness of PS, FPS was evaluated withthe three-layer model Si/SiO2/(GPS)/(PS or FPS) withn = 1.59 [34]. The thickness of FSI layers on the surfaceof silicon wafers was obtained using the two-layer modelSi/SiO2/FSI with n = 1.47.
FTIR-ATR spectra were taken with an IFS 55 (Bruker,Germany) spectrometer for both the chemisorbed GPS,FSI, and grafted PS-COOH and FPS-COOH layers usingthe Si prism with a native SiO2 layer as a substrate for thegrafting.
Diffuse reflection IR spectroscopy was used for deter-mination of grafted amount of polymer. It was evaluatedusing calibration curves plotted from the absorbency spec-tra of the samples, made from a mixture of the polymer andparticles (50 mg). The characteristic band at 1493 cm−1
was chosen for this estimation.Capillary penetration experiments. Using a series of
nonpolar and polar probe liquids, the solid surface ten-sion of unmodified and modified particles was evaluatedby capillary penetration experiments [35, 36]. The strategyis based on a modified Washburn equation:
Kγlv cos θ =(η/ρ2
) (m2/t
), (1)
where K is a factor representing the geometry of the cap-illary system,
(η/ρ2
)reflects properties of the test liquid
(viscosity η and density ρ) and(m2/t
)is determined in
the experiment. The quantity(m2/t
)can be determined
by measuring the weight m of a penetrating liquid intoa particle packing as a function of time t using a microbal-ance. More experimental details about the set-up for cap-illary penetration measurements including the preparationof powder packings can be found in references [34–36].The solid surface tension, γsv, of the porous particle sys-tem was estimated directly from plots of Kγlv cos θ versusγlv [35]. The accuracy of this method depends on the dif-ferences between the surface tension values of the liquidsused for the characterization.
Surface topography. The surface topography was in-vestigated using scanning force microscopy (SFM), scan-ning electron microscopy (SEM) and optical analysis (Mi-croGlider, Germany).
Scanning Force Microscopy (SFM) studies were per-formed on a Dimension IV (Digital Instruments, USA)microscope. The tapping mode was used to map the sur-face morphology at ambient conditions. Standard silicontips with radius of about 10–30 nm, apex angle 65 andfrequency of about 300 kHz as well as ultra-sharp oneswith tip radius < 10 nm and apex angle 12 for the highestresolution imaging were used.
An imaging measuring instrument for the optical an-alysis of roughness (MicroGlider, Germany) was used asa complementary method because of its large-scale verti-
cal resolution from 10 nm to 300 mm and the possibilityto investigate samples with a maximal size area of 100 ×100 mm2. The lateral resolution is, however, determinedby the size of the reflected light on the sample, 1–2 µm.
The root mean square roughness Rq [38], the rough-ness factor rs, which is the ratio of the actual area of therough surface to the projected area, and the power spec-tral density (PSD) of the images were evaluated using SFMand FTR Mark III software, respectively. Images of thesurfaces were obtained at least at five different locations.Roughness parameters were determined for a particularsurface sample based on these images from five differentlocations.
A Scanning Electron Microscope (SEM), (DSM 982Gemini, ZEISS, Germany) was used for the evaluation ofsurface topography as well.
Contact angle measurements. Advancing and reced-ing contact angles were measured by the sessile dropmethod using axisymmetric drop shape analysis (ADSA)and a conventional goniometer technique (Krüss DSA 10,Hamburg, Germany). Details of the procedure and the ex-perimental setup for low-rate dynamic contact angle meas-urements by ADSA are given elsewhere [35]. Deionizedreagent grade water was used for contact angle measure-ments. In the case of the goniometer technique, at least 5droplets were put on each sample. Three different sampleswere used to calculate a mean contact angle value. Theerror of the mean contact angle values, calculated as thestandard deviation, did not exceed 2 and 3 for advancingand receding contact angles, respectively. All contact anglemeasurements were carried out at 24±0.5 C and relativehumidity of 40±3% which were kept constant.
The advancing contact angles, measured on smoothsilicon surfaces coated with the polymer brushes or thesilane, were used to calculate the solid surface tension γsvaccording to the equation of state approach (EQS) [39]:
1+ cos θY = 2√
γsv
γlve−β(γlv−γsv)
2(2)
where β is a constant which was experimentally found tobe 0.0001247 (mJ/m2)−2, γsv, γlv denote the interfacialtensions of the solid-vapour and liquid-vapour interfaces,respectively; θY is the Young contact angle.
Results and Discussion
Grafting of polymers
Scheme 1 illustrates the “grafting to” procedure of thepolymers onto a solid surface. It starts with covalent an-choring of GPS to the surface of a Si wafer and silicaparticles as well. The thickness of the GPS layer immo-bilized onto a silica wafer was found to be 0.8–1.2 nmthat corresponds to 1–1.5 theoretical layers. SFM imagesshow that the GPS layer was homogenous and smooth, the

76 A. Synytska et al.
Fig. 2 i FTIR spectra of 0.1 µm silica particles in radius: (a) bare; (b) with chemisorbed GPS; (c) with grafted PS; ii Calibration plot forPS grafted layer in the mixture of PS powder with silica particles: 0.1 µm; and 1.2 µm in radius in terms of the FTIR spectrum integralabsorbance vs. mass fraction of the polymer
rms roughness was less than 1 nm. The immobilization ofGPS onto the particle surfaces was monitored by FTIR-ATR measurements (Fig. 2ib). The characteristic bands ofepoxy groups (736–854, 863–950 and 1260 cm−1) couldnot be detected in a very thin layer of grafted GPS. Onlythe hydrocarbon bands (C−H stretching vibrations) at2800–3100 cm−1 were identified. Recently it was found,that the GPS chemisorption involves not only hydroly-sis and reaction of trimethoxysilane groups with surfacesilanol groups (Scheme 1) but also opening of the epoxyring of GPS [32, 34]. Consequently, the chemisorbed GPSforms a layer with different functional groups and at leastone of them (epoxy groups) can be used for grafting of thecarboxyl-terminated polymers.
The next step of the synthetic procedure consists ingrafting of the carboxy-terminated polymers (PS-COOHor FPS-COOH) onto the surface of the GPS modified par-ticles. Reaction of esterefication between terminating car-boxyl groups and epoxy groups on the surface leads tochemical bond formation between polymer chains and thesurface. FTIR-ATR spectra, shown in Fig. 2ic for 0.1 µmparticles in radius, provide further evidence for graftingof PS-COOH onto the surface. Very pronounced bandsat 1601, 2923, and 3027 cm−1 appear after grafting ofPS-COOH. The grafted amount of PS-COOH was de-termined by diffuse reflection IR spectroscopy from thecalibration curves (Fig. 2ii). The results show that about4–5 mg/m2 of polymer was grafted onto the Si particlesurface, which corresponds to a total thickness of 4–5 nm.Previous findings show that such a thick polymer layercompletely covers the surface [32, 34]. In the case of largerparticles, the polymer layer thickness could not be deter-mined due to the very low ratio of the PS band to the noiselevel.
Additionally, the changes in the surface-energetic prop-erties of the silica particles due to the grafting of polymers
Fig. 3 Plot of Kγlv cos θ vs. γlv for cleaned and non-cleanedbare silica particles; • polystyrene modified particles (0.5 µm inradius)
were investigated. By plotting Kγlv cos θ versus the li-quid surface tension, γlv, the solid surface tension of theparticles, γsv, could be estimated. Figure 3 shows the re-sults for bare silica particles (non-cleaned and cleaned)and modified particles where the shell consists of polystyr-ene brushes. Each curve shows a maximum that corres-ponds to the solid surface tension of the particles (Fig. 3).In the case of the PS modified particles, this maximumis shifted to distinctly lower values compared to the baresilica particles. It is in reasonable agreement with the γsvvalue (28.9 mJ/m2) obtained from contact angles meas-ured on polystyrene brushes that were grafted to flat andsmooth solid surfaces (Table 1). Moreover, γsv the solidsurface tension of the polystyrene modified silica particlesis also in good agreement with the solid surface tensionof a polystyrene powder [36]. Hence, the capillary pene-tration experiments confirm that the surface of the silica

Regular Patterned Surfacesfrom Core-Shell Particles.Preparation and Characterization 77
Table 1 Advancing and receding water contact angles, contact angle hysteresis and the surface energy values for smooth surfaces coveredby PS and FPS and chemisorbed FSI
Polymer θA, deg θR, deg ∆θ = θA −θR, deg γsv1), mJ/m2 rs
PS 89.5±0.2 82.0±1.0 7.5 28.9 1.001
FPS 97.0±0.3 93.0±1.5 4.0 24.3 1.001
FSI 113.0±0.2 107.0±1.2 6.0 18.3 1.001
1) Values of surface solid energy obtained form the advancing contact angles using EQS considering the measured value of water surfacetension of 71.8 mN/m
particles is completely covered by the grafted polymerlayer.
Surface topography and roughness
Figure 4 shows representative SEM, SFM, and opti-cal microscopy images (MicroGlider) for patterned sur-faces from core-shell particles of different radius (0.1 µm,. . . 2.5 µm). All techniques revealed densely packed andwell-ordered particle layers. SFM and optical microscopyimaging provide quantitative roughness parameters. Sur-faces composed from particles smaller than 2.5 µm inradius were characterized by SFM, whereas MicroGliderwas applied to the patterned surfaces consisting of par-ticles larger than 2.5 µm. The PSD images (Fig. 4a–d,insets) show an almost perfect hexagonal order of the par-ticle arrays. Six sharp first order peaks and the presenceof higher order reflections can be clearly seen. For par-ticle arrays consisting of particles with 0.1 and 1.2 µm inradius, the sectional analyses of the height profiles alongthe [100] axis in the 2D hexagonal lattice is presented in
Fig. 4 Representative topography images of the particle arrays:a SEM for 0.1 µm particle layer; b SFM for 0.5 µm particle layer;c optical microscopy (MicroGlider) for 1.2 µm particles; d opti-cal microscopy (MicroGlider) for 2.5 µm particle layer; e opticalmicroscopy (MicroGlider) for 2.5 µm particle layer (larger scale)
Fig. 5. These results show the regular embossments causedby the particles, but no additional roughness on the nmscale indicating that the surface of the modified particle isvery smooth.
In Fig. 6, experimentally determined roughness pa-rameters are compared with the calculated roughness. Itcan be clearly seen that the height roughness (root mean
Fig. 5 Representative SFM images and corresponding height pro-files along the [100] direction for 0.1 µm (a) and 1.2 µm particlesin radius (b)
Fig. 6 Experimental values (symbols) of Rq: • SFM; MicroGliderand calculated (solid line: Model 1, dotted line: Model 2)

78 A. Synytska et al.
square roughness values Rq) determined from the SFMand MicroGlider images increases with increasing particleradius. However, the Rq value of the patterned surfacewith 2.5 µm large particles obtained by MicroGlider ishigher than that obtained by SFM. We suppose that thisresult originates from different resolution of SFM and Mi-croGlider. The resolution of SFM is strongly limited by thetip shape geometry (radius and apex angle) and sample to-pography to a large extend. On the other hand, the lateralresolution of the MicroGlider is limited by the width ofthe light beam (1–2 µm). Therefore, the absolute values ofthe height roughness values may be tampered by the lim-itations of each technique. Nevertheless, both techniquesreflect clearly the steady increase in the height roughnesswith increasing particle radius.
Simple mathematical calculations of the surface com-posed from hexagonally packed spheres were undertaken.For this, we considered two possible geometries of theparticle array, taking into account different probing depthof various experimental techniques (SFM, MicroGlider).Since the lower half of the particles is not visible andone observes only the pore between them, the followingmodels are suggested. Both models (Fig. 7a,b) considerthe surface consisting of the hexagonally packed hemi-spheres with a radius R. In the second model, the hexag-onally packed hemispheres are situated on the cylinderswith a height R (Fig. 7b). The elementary cell of suchstructures is a triangle connecting the points where spherestouch each other (Fig. 7c). The roughness characteristicscalculated for this elementary cell are representative forthe whole ordered surface. These two models are used forcalculation of Rq and roughness factor rs for structured
Fig. 7 Possible geometries of the particle layer: a Model 1 and bModel 2 and c elementary cell as a triangle connecting the touchedpoints of adjacent spheres within the hexagonally packed particlelayer
particle layers. The root mean square roughness is definedby
Rq =√√√√ 1
S
∫
S
(Z − Z0)2 dS , (3)
where Z is the height in some particular location, Z0 isaveraged height, S is the effective surface area.
It was found, that Rq predicted from the first and sec-ond mathematical model is in reasonable agreement withthose values experimentally obtained by SFM and Mi-croGlider (Fig. 6). From the first model, Rq is equal to0.32R and from the second to 0.54R. In fact, the SFMtip is unable to penetrate into pores between particles andreflects a smoother surface compared to the real roughsurface. The first model considers this fact. On the otherhand, the light beam of MicroGlider reaches the bottomsurface of particle layers resulting in Rq values, whichare similar to the calculated ones according to the secondmodel.
Since the Wenzel roughness factor is an importantparameter in many theoretical considerations of wettingphenomena [11–21], it was also calculated as the ratiobetween the actual surface area to the projected one(Eq. 4). A surface of hexagonally packed hemispheresis considered. In this case, the roughness factor is inde-pendent of the particle radii and approximately equal to1.91 [31, 40, 41]:
rs = Sactual
Sgeometric= Ssphere segment + Spore
Striangle(4)
= πR2 + R2√
3− πR2
2
R2√
3≈ 1.9069 .
rs values determined by SFM were again lower due to thetip shape geometry and do not reflect the real roughness forthis type of surface.
Wettability
There are two general states in which a drop can resideon a given rough surface [16–21]. The liquid drop eithersits on the asperities of the rough surface (“heterogeneouswetting regime”) or wets their grooves (“homogeneouswetting regime”) [11, 20, 21]. For the latter case, Wenzelderived that roughness increases the liquid contact angleon a hydrophobic surface (θY > π/2). If air is entrappedinside the grooves, underneath the liquid (“heterogeneouswetting regime”), the drop is sitting on a “composite” sur-face consisting of the asperities and air. This behaviour canbe described by the Cassie-Baxter equation [12, 20]. Re-cently, Marmur [20] has shown that the Wenzel and theCassie-Baxter equations are necessary but not sufficientconditions for describing wetting equilibrium on roughsurfaces. From theoretical considerations he deduced, that

Regular Patterned Surfacesfrom Core-Shell Particles.Preparation and Characterization 79
different wetting regimes could occur depending on thedetailed solid surface topography (semicircular grooves,semicircular protrusions, or saw-toothed profiles). In thiswork, the fabricated ordered arrays can be compared withthe case of “semicircular protrusions”.
However, the difficulty that results from the experi-mental contact angle measurements is contact angle hys-teresis. Instead of an equilibrium contact angle, a numberof mechanically stable contact angles exists. Therefore,a maximum (θa) and minimum (θr) contact angle shouldbe measured for the advancing and the receding contactline. The difference, ∆θ = θa − θr, is called contact anglehysteresis. In the “homogeneous wetting regime” largevalues of contact angle hysteresis are observed due to anincrease in the advancing and a decrease in the reced-ing contact angle (liquid fill up the roughness grooves).Drop pinning is favoured. In the “heterogeneous wettingregime” the contact angle hysteresis is small or extremelysmall as in the case of ultrahydrophobicity. Johnson andDettre predicted for a sinusoidal surface a transition froma nonporous (Wenzel or “homogeneous wetting regime”)to a porous surface (Cassie-Baxter or “heterogeneous wet-ting regime”) with increasing surface roughness rs [13,14]. According to these results hysteresis increases untilthis critical roughness is reached and then decreases. Wecould verify this transition by experimental results for an-odically oxidized aluminium surfaces and oxygen plasmaetched polytetrafluoroethylene surfaces [7] and [42]. How-ever, contact angle hysteresis was strongly dependent onthe geometrical nature of the roughness features, and thetype of roughness rather than its absolute size was the de-termining factor to obtain a transition to an ultrahydropho-bic surface [7].
In this work, ordered arrays of core-shell particles wereused as model surfaces to study the water wetting be-haviour of these surfaces. Two factors were varied in thewetting experiments: (i) the shell chemistry and hencethe solid surface tension of the organic shell, and (ii) theheight roughness from sub-µm up to µm roughness valueswhereas the Wenzel roughness factor was kept constant.
Figure 8 summarizes the influence of the height rough-ness (particle radius) and the chemistry of the shell poly-mer on the wetting behaviour of the hexagonally packedparticle arrays. For each surface, the maximum (advancingangle θa) and the minimum (receding angle θr) contact an-gles were determined. In general, contact angle hysteresiswas higher on the rough patterned surfaces in compari-son to the smooth surfaces of the same shell chemistry.In Fig. 8b, the results of two different contact angle tech-niques, a conventional goniometer technique and ADSAcontact angle measurements, are shown for FPS modifiedsurfaces. The measured advancing contact angles are invery good agreement for both techniques. In the case of re-ceding angles, ADSA yields sometimes no receding angle(drop pinning occurs) or lower angles compared to thegoniometer technique. However, the general trend for the
Fig. 8 a Water advancing and receding contact angle vs. particleradius; b Water advancing and receding contact angle measured byADSA and DSA vs. particle radius; c Advancing water contact an-gles vs. particle radius on a logarithmic scale for different “shell”chemistry
receding angles with increasing height roughness is thesame for both contact angle techniques.
On PS particle modified arrays, which were less hy-drophobic (solid surface tension of γsv = 28.9 mJ/m2), thelargest increase in contact angle hysteresis was observeddue an increase in the advancing and a decrease in thereceding angle (Fig. 8a). This behaviour is typical for a“homogeneous wetting regime” when the drop wets thegrooves of the rough surface. If the surface chemistry was

80 A. Synytska et al.
changed to more hydrophobic surfaces and hence lowersolid surface tensions (PS (γsv = 28.9 mJ/m2) > FPS(γsv = 24.3 mJ/m2) > FSI (γsv = 18.3 mJ/m2) (Table 1)then the contact angle hysteresis decreased in the sameorder. Obviously, the grooves or pores were less wetted bywater when the solid surface tension becomes lower result-ing in higher receding angles. The lowest hysteresis wasobserved for the surfaces modified by chemisorbed FSI.Here, the advancing contact angle was increased with in-creasing height roughness while the receding contact anglestays nearly constant (above 90). However, with increas-ing the height roughness (particle radius > 2.5 µm), thecontact angle hysteresis becomes also higher on patternedFSI modified surfaces. Of course, this behaviour cannot beexplained by the Wenzel equation because this equationdoes not predict contact angle hysteresis. Moreover, for thepresent case of rough surfaces, the Wenzel roughness pa-rameter is 1.91, independent of the particle radius. For thisreason Wenzel equation would predict a constant contactangle of 89 with increasing height roughness for the PSmodified particle surfaces with an intrinsic contact angleof 89.5.
In the literature, the increase of the advancing con-tact angle with increasing vertical roughness but a constantWenzel roughness parameter was explained by a change inthe radius of curvature of the liquid in trapped air pocketsat the solid/liquid interface [31, 40]. Figure 8c indicatesthat the advancing water contact angle on FPS and FSIshows a behaviour that is roughly consistent with this pre-dicted behavior. However, more studies, both experimentaland theoretical, are needed to thoroughly understand thewetting behaviour on this special type of rough surfaces
characterized by hydrophobic hemispherical close-packedprotrusions.
Conclusions
A simple and effective approach for designing regu-larly patterned surfaces with specifically designed surfaceroughness and chemistry using core-shell colloidal par-ticles was demonstrated. The chemistry was varied by co-valent grafting of polymer brushes onto silica particles orby chemisorption of fluorosilane. The modified colloidalspheres were organized into closely packed hemisphericalhexagonal arrays either by a vertical deposition technique(0.1–1.12 µm large particles in radius) or by sedimenta-tion on slightly inclined coated silicon wafers (2.5, 5.0, and10.0 µm large particles in radius). In this way, an increasein the vertical roughness was achieved with increasingparticle radius, but without changing the Wenzel rough-ness factor of 1.91. It was found that contact angles variedwith increasing height roughness on this type of surfaces.The wetting results show an enhance of the surface hy-drophobicity with increasing the “shell” hydrophobicityin the sequence PS–FPS–FSI. With increasing the particleradius, the water contact angle hysteresis remained largeeven for the most hydrophobic FSI “shell”. Hence, ultra-hydrophobic properties could not be obtained on this typeof regularly patterned surfaces from core-shell particles.
Acknowledgement Authors thank Dr. M. Motornov for providingassistance in grafting of particles, Ms. G. Adam, Ms. G. Zedler andMr. U. Streller for FTIR-ATR, capillary penetration and SEM inves-tigations, respectively.
References1. Barthlott W, Neinhuis C (1997) Planta
202:12. Tsujii K, Yamamoto T, Onda T,
Shibuichi S (1997) Angew Chem109:1042
3. Nakajima A, Fujishima A,Hashimoto K, Watanabe T (1999)Adv Mater 11:1365
4. Youngblood J, McCarthy TJ (1999)Macromolecules 32:6800
5. Chen W, Fadeev AY, Hsieh MC,Öner D, Youngblood J, McCarthy T(1999) Langmuir 15:3395
6. Minko S, Müller M, Motornov M,Nitschke M, Grundke K, Stamm M(2003) J Am Chem Soc 125:3896
7. Grundke K, Nitschke M, Minko S,Stamm M, Froeck C, Simon F,Uhlmann S, Pöschel K, Motornov M(2003) In: Mittal KL (ed) ContactAngle, Wettability and Adhesion,vol 3, p 1–25
8. Öner D, McCarthy TJ (2000)Langmuir 16:7777
9. Onda T, Shibuichi S, Satoh N,Tsujii K (1996) Langmuir 12:2125
10. Shibuichi S, Onda T, Satoh N,Tsujii K (1996) J Phys Chem100:19512
11. Wenzel RN (1936) Ind Eng Chem Res28:988
12. Cassie A (1948) Discuss Faraday Soc3:11
13. Johnson RE, Dettre RH (1964) In:Contact angle, Wettability andAdhesion. Adv Chem Ser 43:112
14. Dettre RH, Johnson RE (1964) In:Contact angle, Wettability andAdhesion. Adv Chem Ser 43:136
15. Johnson RE, Dettre RH (1968) J PhysChem 64:1744
16. Bico J, Tordeux C, Quere D (2001)Europhys Lett 55:214
17. Quere D (2003) Nanotechnology14:1109
18. Patankar NA (2003) Langmuir19:1249
19. Patankar NA (2004) Langmuir20:7097
20. Marmur A, Krasovitski B (2003)Langmuir 19:8343
21. Zhang J, Kwok DY (2005) J ColloidInterface Sci 282:434
22. Coulson SR, Woodward I, Badyal JPS,Brewer SA, Willis C (2000) J PhysChem B 104:8836
23. Shirtcliffe N, Thiemann P,Stratmann M, Grundmeier G (2001)Surf Coat Technol 142:1121
24. Dae-Hwan J, Park J, Choi YK,Lee SB, Park HS, Rühe J (2002)Langmuir 18:6133
25. Bartell FE, Shepard JW (1953) J PhysChem 57:211

Regular Patterned Surfacesfrom Core-Shell Particles.Preparation and Characterization 81
26. Krupenkin TN, Taylor JA,Schneider TM, Yang S (2004)Langmuir 20:3824
27. Yang SM, Migues H, Ozin GA (2002)Adv Func Mater 12:425
28. van Blaaderen A, Ruel R, Wiltzius PP(1997) Nature 385:321
29. Park SH, Qin D, Xia Y (1998) AdvMater 10:1028
30. Yang SM, Ozin GA (2000) ChemCommun 24:2507
31. Lee W, Jin MK, Yoo WC, Jang ES,Choy JH, Kim JH, Char K, Lee JK(2004) Langmuir 20:287
32. Luzinov I, Julthongpiput D, Malz H,Pionteck J, Tsukruk VV (2000)Macromolecules 33:1043
33. Goldenberg LM, Wagner J, Stumpe J,Paulke BR, Görnitz E (2002)Langmuir 18:3319
34. Minko S, Patil S, Datsyuk V, Simon F,Eichhorn KJ, Motornov M, Usov D,Tokarev I, Stamm M (2002) Langmuir18:289
35. Kwok DY, Gietzelt T, Grundke K,Jacobasch HJ, Neumann AW (1997)Langmuir 13:2880
36. Grundke K, Augsburg A (2000) JAdhesion Sci Technol 14:765
37. Grundke K (2001) In: Holmberg K(ed) Handbook of Applied Surfaceand Colloid Chemistry: Wetting,Spreading and Penetration, chapter 7,vol 2, p 119–140
38. Scanning Probe Microscopy (2000)Training Notebook, DigitalInstruments, Veeco Metrology Group,Santa Barbara, CA, p 40
39. Kwok DY, Neumann AW (1999) AdvColloid Interface Sci 81:167
40. Nakae H, Inui R, Hirata Y, Saito H(1998) Acta Mater 46:2313
41. Synytska A, Ionov L, Minko S,Motornov M, Eichhorn KJ, Stamm M,Grundke K (2004) Polym Mater SciEng 90:624
42. Hennig A, Grundke K, Frenzel R,Stamm M (2002) Tenside SurfactantsDetergents 39:243

Progr Colloid Polym Sci (2006) 132: 82–94DOI 10.1007/2882_029© Springer-Verlag Berlin Heidelberg 2006Published online: 9 March 2006
A. DrechslerN. PetongC. BellmannP. BuschM. StammK. GrundkeO. WunnickeJ. Reichelt
The Effect of Adsorbed Cationic Surfactanton the Pattern Collapse of Photoresist Linesin Photolithographic Processes
A. Drechsler () · N. Petong ·C. Bellmann · P. Busch · M. Stamm ·K. Grundke · J. ReicheltLeibniz Institute of Polymer ResearchDresden e.V., Hohe Strasse 6,01069 Dresden, Germanye-mail: [email protected]
O. Wunnicke · J. ReicheltInfineon Technologies SC300,Koenigsbruecker Str. 180, 01099 Dresden,Germany
Abstract A crucial problem inthe manufacturing of high aspectratio structures in the microchipproduction is the collapse of photore-sist patterns caused by unbalancedcapillary forces. A new concept toreduce the pattern collapse baseson the reduction of the capillaryforces by adsorption of a cationic sur-factant. The application of a cationicsurfactant rinse step in the photolitho-graphic process leads to a reductionof the pattern collapse. Physico-chemical investigations elucidate themechanism of surfactant adsorption
and its effect on the surface propertiesof the photoresist. It is shown thatthe best pattern collapse reduction isobtained at a surfactant concentrationreferring to monolayer coverage.In this concentration range thecapillary forces are minimized dueto a hydrophobizing of the processedphotoresist by adsorbed cationicsurfactant.
Keywords Adsorption · Capillaryforces · Cationic surfactant ·Hydrophobizing · Pattern collapse
Introduction
The microelectronics industry is continuously reducing thefeature size of integrated circuits. In 2006, a DRAM half-pitch, i.e. line widths of 70 nm will be put into practice,until 2010 a reduction to 45 nm is laid down in the In-ternational Technology Roadmap for Semiconductors [1].An integrated circuit consists of a series of patterned func-tional layers (insulators, metal wires). The structure ofeach layer is transferred from a mask via a photolitho-graphic process followed by etching or ion implantation.These manufacturing processes must be able to producethe required feature sizes.
In the photolithographic process, the functional layeris covered by a photoresist film. State-of-the-art circuitsare fabricated with chemically amplified photoresists con-sisting of a polymer with an acid-labile pendant protec-tion group, photoacid generator molecules (PAG), andadditional additives [2]. Upon exposure to UV radiationthrough a patterned mask, the PAG is decomposed gener-ating a low concentration of acid. In a post-exposure bake
the acid diffuses and catalyzes a deprotection reaction thatcleaves the pendant group of the insoluble polymer result-ing in a polymer soluble in the developer solution. Thisdeprotection reaction can be generally written as shown inScheme 1.
In a wet-development using a 2.38 wt % TMAH (tetra-methyl ammonium hydroxide solution), the exposed resistis removed [3]. A pattern of unexposed photoresist linesremains. To fulfill the demands for minimizing the featuresize, the width of the photoresist structures must shrinkadequately. Their height, however, cannot be reduced inthe same way since the etch resistance must be retained.This leads to a drastically increasing ratio of line height toline width, the aspect ratio. With increasing aspect ratio,the mechanical strength of the photoresist lines decreasesleading to a collapse of the structures during the develop-ment process. An example for collapsed and non-collapsedstructures is shown in Fig. 1. This so-called pattern col-lapse has been found to be caused by unbalanced capillaryforces acting between the lines during the drying step afterthe development [4, 5].

The Effect of Adsorbed Cationic Surfactant on the Pattern Collapse 83
Scheme 1 Acid-catalyzed deprotection reaction. In the post-exposure bake, the acid generated by the photoacid generatormolecules (PAG) in a photochemical reaction catalyzes a depro-tection reaction that cleaves the pendant group of the insolublepolymer, resulting in a polymer that is soluble in the developer
Fig. 1 Cross-section SEM images of free standing photoresist lines(left) and photoresist structures after pattern collapse (right).
To maintain the reduction of the feature size, it is of es-sential importance to prevent the pattern collapse. Severalapproaches have been proposed:
1. The mechanical stability of the photoresist has beenimproved in several ways: by changing its polymerbackbone, by using nanocomposites [6] or by increas-ing the cross-linking density [7].
2. The adhesion between photoresist and the sub materialis improved by special sub-coatings or by increasingthe contact area [8].
3. The capillary forces are reduced by using hydrophobicphotoresists, by rinse additives, by freeze-drying or bydrying with supercritical CO2 [9].
Approaches 1 and 2 require the design of new resistsand coatings and are rather long-term items. Freeze-dryingand drying with supercritical fluids is very effective butcomplicated and expensive. The most promising way istherefore the reduction of capillary forces by adding suit-able substances to the rinsing liquid [5].
The pressure difference between both sides of a pho-toresist line caused by capillary forces can be quantified bythe Laplace equation assuming the meniscus is shaped asa section of a cylinder between two infinite lines [10]:
∆P = 2γlv cos Θ
(1
S1− 1
S2
), (1)
where γlv is the surface tension of the rinse liquid, Θ thecontact angle of the solution on the photoresist and S1 andS2 the spacings besides the structure. Since the spacings
are given, the pressure difference can be reduced by de-creasing the wetting tension γ cos Θ, i.e. by lowering thesurface tension of the rinse liquid or by raising the contactangle of the photoresist.
Several studies deal with the reduction of pattern col-lapse by adding surfactants to the rinse liquid. A widevariety of surfactants has been applied. At concentrationsnear the critical micelle concentration (cmc), the surfacetension is lowered significantly. Therefore it is assumedthat the capillary forces are reduced, too. It was shownthat surfactant rinse indeed is able to shift the patterncollapse to higher aspect ratios [4]. The results of vari-ous groups are, however, very contrary. Hien et al. [11]found a positive effect only with an amphoteric but notwith nonionic surfactants. Tanaka et al. [7] discovereda maximum of the pattern collapse reduction for a non-ionic surfactant at a concentration above the cmc. Sev-eral authors [10, 12–14] determined the wetting tensionγ cos Θ but only Junarsa et al. [10] could find a direct cor-relation between minimum wetting tension and maximumpattern collapse reduction using an amphoteric fluorosur-factant.
The highest efficiency to reduce pattern collapse wasfound for concentrated surfactant solutions. This may,however, have serious disadvantages. Watanabe et al. [15]noticed that high surfactant concentrations melt the pho-toresist and amplify the pattern collapse. In contrary,Miyahara et al. [16] found that some nonionic surfactantsstabilize the photoresist surfaces and prevent melting. Inaddition, concentrated surfactant solutions tend to foamwhich also might cause structure defects. Zhang et al. [17]therefore proposed a less foaming diol-type surfactant forthe reduction of pattern collapse.
It can be summarized that the addition of surfactantsto the rinse liquid in many cases leads to reduced patterncollapse. There is, however, no systematic study of theperformance of surfactants; neither of the surfactant con-centration nor of the surfactant type or chain length. Noneof the authors investigated the adsorption of the surfactantat the interface photoresist – fluid in more detail. There-fore the effect of surfactants to reduce pattern collapse isnot really understood by now.
The aim of the present study is to elucidate the mech-anisms of pattern collapse reduction by surfactant rinsefor a special class of surfactants, the cationic surfactants.The basic idea was to use a rinse additive that at the sametime reduces the surface tension of the rinse liquid and in-creases the contact angle of the liquid on the photoresist.It is known that ionic surfactants adsorb with their po-lar headgroup onto oppositely charged surfaces renderingthem hydrophobic [18]. In the case of photoresists beingnegatively charged in the rinse liquid, cationic surfactantsfulfill this requirement. For negatively charged silica andquartz, a maximum value of the contact angle of about 60is reported at cationic dodecylpyridinium chloride concen-trations far below the cmc [19, 20].
84 A. Drechsler et al.
On one hand it is investigated how the addition ofcationic surfactants affects the pattern collapse of 193 nmphotoresist lines. On the other hand, the adsorption of thesurfactant on model photoresist surfaces is explored bya variety of surface chemical methods. Of special inter-est is how the surfactant changes the surface propertiesof the photoresist as surface potential and wettability. Foran optimum modelling of the properties of real photore-sist structures, both unexposed photoresists and photore-sists that have been UV exposed, baked and developed arestudied.
Experimental
Substances. A commercially available 193 nm resist basedon a methacrylate platform was used. It was chosen due toits collapse behaviour at 75 nm dense lines. The surfactantunder study is a commercially available cationic surfac-tant of high purity (> 99%). Surfactant solutions of variousconcentrations have been prepared by dilution with puri-fied water. Since all concrete data of the surfactant are thesubject of concealment, the surfactant concentration willbe given in this paper on a relative scale. A relative concen-tration of 1 refers to the cmc which was determined fromthe surface tension of the solutions.
Investigation of pattern collapse. For the investigationof pattern collapse, a photoresist layer with a thickness of230 nm was used to reach an aspect ratio of 3. Lines of55 to 80 nm width were produced by deep ultraviolet light(DUV) exposure (193 nm), baking and wet development.The line width was varied by changing the exposure dose.The surfactant rinse step was inserted prior to spin-dryingthe wafers. The surfactant solution is added as a puddlestanding on the wafer between 1 and 900 s. Top-down an-alysis of the photoresist structures was carried out usingscanning electron microscopy (SEM). For each exposuredose, a 5 µm2 area of interest is defined. If one or morelines are collapsed, the field is labelled as “collapsed”. Fora more global view, defect density measurements were per-formed. More details of the procedure are given in [21].
As a measure of pattern collapse, the maximum usableexposure latitude (MUEL) was defined:
MUEL = Ecollapse − Esize
Esize, (2)
where Ecollapse is the exposure dosis at which the patternscollapse and Esize is the dose needed to produce the tar-get line width. The larger the MUEL, the larger are thecapabilities to reduce pattern collapse [21].
Physico-chemical characterization. For the physico-chemical characterization of the photoresist, flat modelsurfaces are needed that are accessible for the methodsdescribed below. They were prepared by spin-coating thephotoresist directly onto a silicon wafer with a native oxidelayer. Then, they were exposed to DUV radiation with var-ious doses by open frame exposure. The exposed wafers
were baked, developed and rinsed without surfactant. Pho-toresist layers that have undergone these preparation stepswill be named “processed” in the following. For charac-terization experiments the wafers were broken into smalluniformly exposed pieces of the required size. Details ofthis procedure are described elsewhere [22].
Scanning Force Microscopy. The sample topographywas investigated in air with a scanning force micro-scope (SFM) DI-3100 (Digital Instruments, Santa Barbara,USA). The SFM was used in tapping mode to avoid dam-age of the photoresist surface. The cantilevers were oper-ated at their resonance frequency of about 275 kHz. Dif-ferent scan ranges ranging from 1 µm ×1 µm, to achievea high lateral resolution, up to 10 µm ×10 µm, to detectpossible large agglomerates, were applied. From the data,the root mean square (RMS) roughness over the completescan area was calculated.
Zeta potential measurements. Electrokinetic meas-urements were performed using the streaming potentialmethod with an ElectroKinetic Analyser EKA (AntonPaar GmbH, Graz, Austria). A home-built rectangular cellfor small flat pieces was applied. Two small pieces ofthe wafer (10 ×20 mm2) were arranged face to face tobuild a streaming canal inside this cell. The measuringfluid (electrolyte solutions with different pH or contain-ing surfactant) was streaming through this canal. We usedAg/AgCl-electrodes for determining the streaming poten-tial (U). The zeta potential (ζ) was calculated according toSmoluchowski [23]:
∆U
∆p= −εr ·ε0 · ζ
η ·κ . (3)
U is the streaming potential, p is the pressure, εr and ε0are the dielectric constant and the electric constant, re-spectively. η is the viscosity and κ is the conductivity ofthe solution. Since the instrument requires a minimumconductivity of the solution, measurements were done ina background electrolyte (KCl) concentration of 10−5 to10−3 M.
Ellipsometry. The thickness of the photoresist layerswas measured in air using a null ellipsometer in a polarizer-compensator-sample-analyzer arrangement (Multiskop,Optrel Berlin) with a He-Ne laser light source of 632.8 nmwavelength. The angle of incidence was 70. A multi-layer model (silicon/silicon oxide/photoresist) was usedto calculate the thickness of the photoresist layer from theellipsometric angles [24]. The adsorption of the surfactantwas monitored in situ in the same device using a special li-quid cell with an angle of incidence of 68. Details of thisprocedure are described elsewhere [21].
Contact Angle Measurements. Axisymmetric dropshape analysis – profile (ADSA-P): The hydrophobicity/hydrophilicity of a solid surface is usually expressed interms of wettability, which can be quantified by contactangle measurements. ADSA-P is a technique to deter-mine liquid-fluid interfacial tensions and contact angles

The Effect of Adsorbed Cationic Surfactant on the Pattern Collapse 85
from the shape of sessile and pendant drops or captivebubbles [25, 26]. Assuming that the experimental drop isLaplacian and axisymmetric, ADSA-P finds a theoreticalprofile that best matches the drop profile extracted from animage of a real drop, from which the contact angle, liquidsurface tension, drop volume, surface area and three-phasecontact radius can be computed simultaneously. Advanc-ing and receding contact angles can be obtained with highaccuracy (±0.3) by increasing and decreasing the volumeof the drop using a motorized syringe. In this study, ses-sile water droplets and captive air bubbles were used tocharacterize the resist surfaces.
The “captive bubble method” was applied to quantifythe wettability of the resist in contact with water, with sur-factant solutions of different concentration and with waterafter contact with the surfactant solution. The wafer pieceis mounted with the photoresist layer down in a cuvettefilled with the solution of interest. Through a small hole inthe wafer an air bubble is placed under the photoresist sur-face. The shape of the drop is analyzed while its volumeis slowly increased and decreased and the contact angleof the bubble is computed. It has to be converted into thewater contact angle by subtracting its value from 180.
As a complementary method, the wetting behaviorof dry photoresist surfaces that have been pretreatedwith surfactant solutions was investigated. Pieces of thephotoresist-covered wafers were inserted in surfactantsolutions of various concentrations for 3 minutes. After-wards, the solution was removed and the surface dried witha nitrogen flow. After several hours, the contact angle ofwater droplets was measured with the Dynamic ContactAngle Tester FIBRO DAT 1100 (FIBRO Systems, Swe-den). A water droplet of 8 µl volume was placed ontothe surface. Its contact angle was measured in time inter-vals of 20 ms. From the slope of the contact angle curve
Fig. 2 Top-down SEM images (860× 860 nm2) of photoresist structures with variable line width after surfactant rinse (a) and afterconventional rinse (b). The numbers give the average line width. Small lines stand upright, broad lines represent collapsed patterns
as a function of time, the contact angle at first contact(t = 20 ms) was extrapolated. This value gives a measureof the contact angle on the dry surfactant layer adsorbedon the photoresist before the desorption of the surfactantstarts.
Surface Tension Measurement. The surface tension ofthe surfactant solution was determined by means of theDynamic Contact Angle Tester FIBRO DAT 1100 (FIBROSystems, Sweden) using the pendant drop method. It wasalso an output of the ADSA captive bubble contact anglemeasurements with surfactant solutions.
Results and Discussion
Influence of the Cationic Surfactant Rinseon the Pattern Collapse
To investigate whether the rinse with cationic surfactantsdoes affect the pattern collapse, the photolithographic pro-cess as described in Experimental was performed withoutsurfactant rinse and with an additional rinse step with fourdifferent concentrations of the surfactant. The results ofthese experiments have been discussed in detail by Wun-nicke et al. [21]. Here only a short summary is given.
In Fig. 2, top-down SEM images of photoresist struc-tures of variable line width are shown after cationic sur-factant rinse (upper row) and after conventional rinse with-out surfactants (lower row). The improvement is evident:While without surfactant rinse the lines start to collapse ata width between 65 and 70 nm; they collapse after surfac-tant rinse below 60 nm. Defect density measurements, too,showed a significant reduction of defects due to patterncollapse by surfactant rinse [21].
For the rinse process with various surfactant concentra-tions, the maximum usable exposure latitude (MUEL) has

86 A. Drechsler et al.
Fig. 3 Maximum usable exposure latitude (MUEL) as a functionof the concentration of the surfactant solution used in the surfactantrinse. The dashed line gives the concentration ceff assumed to havethe highest efficiency to reduce pattern collapse
been calculated according to Eq. 2. It is shown in Fig. 3as a function of the surfactant concentration. Increase ofthe MUEL represents a shift of the pattern collapse on-set towards higher exposure doses, i.e. lower line width. Itcan be seen that all surfactant concentrations yield a posi-tive MUEL, i.e. an improvement against the conventionalrinse. A maximum of MUEL is expected at the concen-tration ceff between the relative surfactant concentrations0.04 and 0.2. At higher concentrations the MUEL de-creases again. The concentration ceff will be used in allphysico-chemical investigations to mark the concentrationof maximum pattern collapse reduction.
Further investigations have been carried out to eluci-date the influence of the puddle time of the surfactant rinseon the pattern collapse. It was varied between 1 and 900 s.It has been found that the performance of the surfactantrinse did not depend on the time [21]. This fact is veryimportant since in manufacturing processes short processtimes are essential.
Characterization of the Model Photoresist Surface
Dry photoresist layers. The capillary forces causing pat-tern collapse act on the vertical sidewall of the photoresiststructures. These surfaces are formed during the develop-ment at the interface between soluble and insoluble pho-toresist. It is generally accepted that a photoresist witha deprotection level above 80% is soluble in the devel-oper [3]. Therefore it can be concluded that the structuresidewalls consist of a blend of more than 20% protectedand less than 80% deprotected photoresist. Because oftheir small dimensions, the sidewalls are not accessible formost surface chemical methods. To allow an investigation,they have to be modelled by flat photoresist surfaces. Tosimulate the properties of the real sidewalls, these surfaceshave to be processed, i.e. exposed, baked and developed.One goal of this study is to find out which of the flat
surfaces processed with different exposure doses is the op-timum model for the real photoresist sidewalls.
Photoresists used in microelectronic manufacturing aredesigned that way that they are not changed significantlyby processing if the exposure dose is lower than a thresh-old dose (also named “dose-to-zero”). If the threshold doseis exceeded, the deprotection exceeds 80% and the pho-toresist is dissolved nearly completely in the developersolution. Figure 4 illustrates the change of some surfaceproperties of processed photoresist as a function of the ex-posure dose which is given in % of the threshold dose.
Figure 4a shows the thickness of the photoresist layer.Below the threshold dose, nearly no thickness change isobserved. When the threshold dose is reached, the layerthickness goes to near zero. Above the threshold dose,a small residual layer was detected that disappears atabout 120% of the threshold dose. This behaviour leadsto the conclusion that the sidewalls of processed photore-sist structures are in a state comparable to that of a pro-
Fig. 4 Characteristic parameters of the processed photoresist layersas a function of the exposure dose: a layer thickness, b RMS rough-ness (from AFM images), c isoelectric point (from zeta potentialmeasurements), d contact angle (ADSA sessile drop). The dashedvertical line denotes the threshold dose

The Effect of Adsorbed Cationic Surfactant on the Pattern Collapse 87
cessed flat photoresist layer in the vicinity of the thresholddose [22]. To gain insight in the change of the properties ofthe photoresist around the threshold dose, both unexposedand processed photoresists treated with variable exposuredoses have been characterized by a variety of methods.
SFM images of unexposed photoresists and photore-sists processed well below the threshold dose show a ho-mogeneous, flat surface with a RMS roughness of 0.3 to0.4 nm (Fig. 5 left). When the threshold dose is reached,the surface becomes structured with a RMS roughness ofabout 1 to 1.4 nm (Fig. 5 right). This structure supports thehypothesis that the remaining photoresist layer is a blendof unchanged and deprotected photoresist where the lat-ter is partly dissolved during the development [22]. Withan exposure dose of 107% of the threshold dose, a lowroughness is observed again. The residual layer seems tobe homogeneous. Figure 4b compares the RMS rough-ness of photoresist layers processed at various exposuredoses.
To investigate the chemical functionality or the orderof deprotection of the photoresist surface, the zeta po-tential of some chosen photoresist samples was measuredin electrolyte solutions as a function of the pH value. Itis shown in Fig. 6. In consequence of dissociation andadsorption processes at the surface the zeta potential de-creases monotonically. The pH value at which the zetapotential function passes zero is called the isoelectric point(iep). Figure 4c shows the iep as a function of the exposuredose. It is shifted to smaller values if the exposure doseapproaches the threshold value. This is caused by the gen-eration of acid groups at the surface during processing (cf.Scheme 1). In the case of unexposed photoresist no func-tional groups exist at the surface. Ion adsorption processes
Fig. 5 SFM images of photoresist layers processed with 80% of the threshold dose (left) and with the threshold dose (right). Image size:2×2 µm2, z-scale 10 nm
Fig. 6 Zeta potential of flat photoresist layers processed with vari-ous exposure doses: 0% (squares), 79% (circles), 100% (triangles),104% (diamonds) of the threshold dose as a function of the pHvalue, measured in 10−3 M KCl. The arrows mark the isoelectricpoint (iep) for the lowest and highest exposure dose
determine the electrokinetic properties, the iep is 4.2. Byprocessing the photoresist more and more acid functionalgroups are generated at the surface. The electrokineticproperties are governed by dissociation processes of thefunctional groups. In the case of acid groups the iep de-creases. For samples processed above the threshold dose,an iep of 3.4 was measured which is comparable to the iepof bare silicon wafers.
Of special importance for the capillary forces responsi-ble for the pattern collapse is the wettability of the photore-
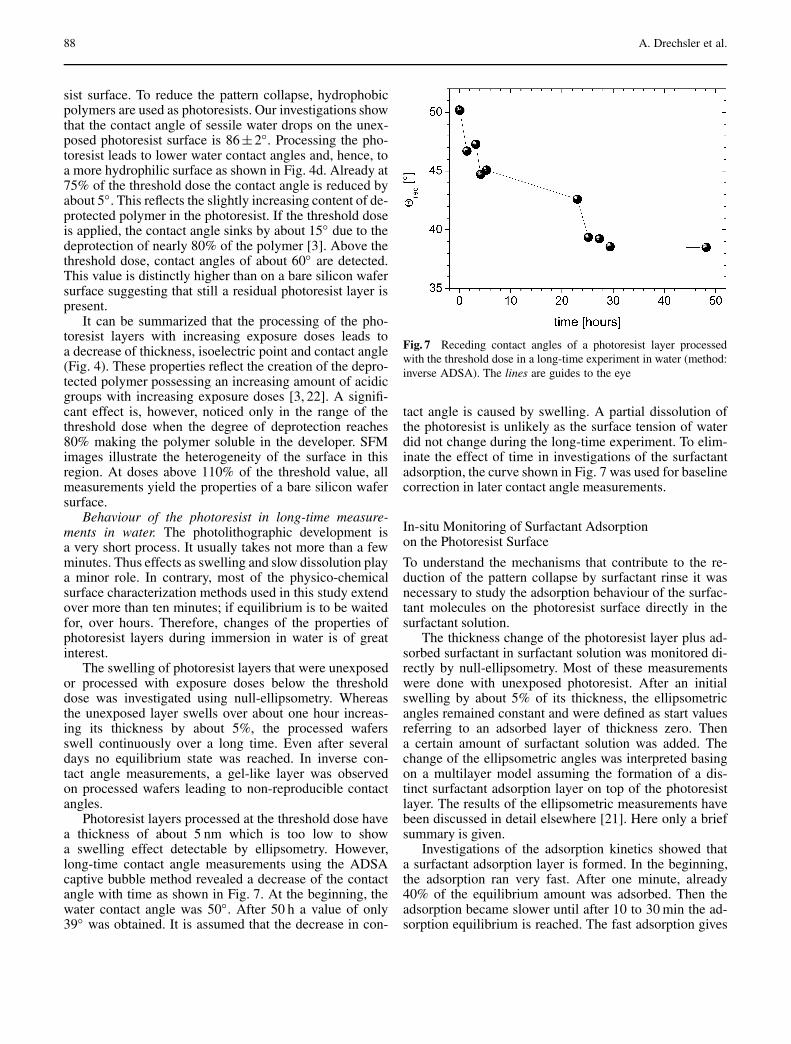
88 A. Drechsler et al.
sist surface. To reduce the pattern collapse, hydrophobicpolymers are used as photoresists. Our investigations showthat the contact angle of sessile water drops on the unex-posed photoresist surface is 86±2. Processing the pho-toresist leads to lower water contact angles and, hence, toa more hydrophilic surface as shown in Fig. 4d. Already at75% of the threshold dose the contact angle is reduced byabout 5. This reflects the slightly increasing content of de-protected polymer in the photoresist. If the threshold doseis applied, the contact angle sinks by about 15 due to thedeprotection of nearly 80% of the polymer [3]. Above thethreshold dose, contact angles of about 60 are detected.This value is distinctly higher than on a bare silicon wafersurface suggesting that still a residual photoresist layer ispresent.
It can be summarized that the processing of the pho-toresist layers with increasing exposure doses leads toa decrease of thickness, isoelectric point and contact angle(Fig. 4). These properties reflect the creation of the depro-tected polymer possessing an increasing amount of acidicgroups with increasing exposure doses [3, 22]. A signifi-cant effect is, however, noticed only in the range of thethreshold dose when the degree of deprotection reaches80% making the polymer soluble in the developer. SFMimages illustrate the heterogeneity of the surface in thisregion. At doses above 110% of the threshold value, allmeasurements yield the properties of a bare silicon wafersurface.
Behaviour of the photoresist in long-time measure-ments in water. The photolithographic development isa very short process. It usually takes not more than a fewminutes. Thus effects as swelling and slow dissolution playa minor role. In contrary, most of the physico-chemicalsurface characterization methods used in this study extendover more than ten minutes; if equilibrium is to be waitedfor, over hours. Therefore, changes of the properties ofphotoresist layers during immersion in water is of greatinterest.
The swelling of photoresist layers that were unexposedor processed with exposure doses below the thresholddose was investigated using null-ellipsometry. Whereasthe unexposed layer swells over about one hour increas-ing its thickness by about 5%, the processed wafersswell continuously over a long time. Even after severaldays no equilibrium state was reached. In inverse con-tact angle measurements, a gel-like layer was observedon processed wafers leading to non-reproducible contactangles.
Photoresist layers processed at the threshold dose havea thickness of about 5 nm which is too low to showa swelling effect detectable by ellipsometry. However,long-time contact angle measurements using the ADSAcaptive bubble method revealed a decrease of the contactangle with time as shown in Fig. 7. At the beginning, thewater contact angle was 50. After 50 h a value of only39 was obtained. It is assumed that the decrease in con-
Fig. 7 Receding contact angles of a photoresist layer processedwith the threshold dose in a long-time experiment in water (method:inverse ADSA). The lines are guides to the eye
tact angle is caused by swelling. A partial dissolution ofthe photoresist is unlikely as the surface tension of waterdid not change during the long-time experiment. To elim-inate the effect of time in investigations of the surfactantadsorption, the curve shown in Fig. 7 was used for baselinecorrection in later contact angle measurements.
In-situ Monitoring of Surfactant Adsorptionon the Photoresist Surface
To understand the mechanisms that contribute to the re-duction of the pattern collapse by surfactant rinse it wasnecessary to study the adsorption behaviour of the surfac-tant molecules on the photoresist surface directly in thesurfactant solution.
The thickness change of the photoresist layer plus ad-sorbed surfactant in surfactant solution was monitored di-rectly by null-ellipsometry. Most of these measurementswere done with unexposed photoresist. After an initialswelling by about 5% of its thickness, the ellipsometricangles remained constant and were defined as start valuesreferring to an adsorbed layer of thickness zero. Thena certain amount of surfactant solution was added. Thechange of the ellipsometric angles was interpreted basingon a multilayer model assuming the formation of a dis-tinct surfactant adsorption layer on top of the photoresistlayer. The results of the ellipsometric measurements havebeen discussed in detail elsewhere [21]. Here only a briefsummary is given.
Investigations of the adsorption kinetics showed thata surfactant adsorption layer is formed. In the beginning,the adsorption ran very fast. After one minute, already40% of the equilibrium amount was adsorbed. Then theadsorption became slower until after 10 to 30 min the ad-sorption equilibrium is reached. The fast adsorption gives

The Effect of Adsorbed Cationic Surfactant on the Pattern Collapse 89
an explanation of the fact that the puddle time, i.e. the timethe surfactant solution is applied in the photolithographicprocess, has no significant influence on the reduction ofthe pattern collapse. Already after a time of 20 sec as usualin the process, an appropriate amount of surfactant is ad-sorbed. This justifies that most of our investigations aredone in equilibrium although the photolithographic pro-cess is far from reaching equilibrium.
Both the adsorption velocity and the adsorbed amountin equilibrium rise with increasing concentration. The ad-sorption isotherm (adsorbed amount as a function of theconcentration) shows a plateau in the vicinity of ceff. Thatwas interpreted basing on a two-step model [27] as forma-tion of a surfactant monolayer. From the adsorbed amountof about 1.2±0.3 µmol/m2 at ceff an area per molecule of1.3±0.3 nm2 was calculated which is typical for a loosemonolayer of the used type of surfactant.
Ellipsometric measurements with processed photore-sists showed a long-time swelling over several days. At-tempts to investigate the adsorption after addition of sur-factant delivered only an continued swelling. It could notbe distinguished between the effects of swelling and of thesurfactant adsorption.
It can be summarized that ellipsometric measurementsproved the formation of a surfactant adsorption layer onthe photoresist surface. At ceff it is assumed to forma monolayer. To get more information about the adsorptionlayer and its influence on the surface properties of the pho-toresist, an electrokinetic characterization of unexposedand processed photoresist in solutions of the cationic sur-factant was carried out. The zeta potential of the photore-sist layers is given in Fig. 8 as a function of the surfactantconcentration. The measurement was performed at pH = 6in a background electrolyte (KCl) concentration of 10−5 Mto ensure the minimum conductivity of the solution neces-sary for the measurement.
In water and low concentrations of the cationic surfac-tant, the photoresist is negatively charged. The photore-sist processed at or above the threshold dose has a highernegative potential due to its acid groups. With increasingconcentration, more and more positively charged surfac-tant ions adsorb onto the surface. The amount of the zetapotential decreases. At the point of zero charge (pzc), thesign of the zeta potential changes. Up to this concentra-tion the adsorption is governed mainly by an electrostaticattraction between the negatively charged surface and thepositively charged surfactant headgroups [28]. The pzcrefers to a complete compensation of the surface chargeby adsorbed surfactant and counter-ions. As a first ap-proximation, at the pzc the surfactant is assumed to forma monolayer on the photoresist surface.
The pzc is marked in Fig. 8 for photoresist layers pro-cessed with < 80% and ≥ 100% of the threshold dose. Forthe latter, the pzc is about one order of magnitude higherthan for unexposed photoresist, i.e. a higher surfactantconcentration is necessary to neutralize the acid groups
Fig. 8 Zeta potential of flat photoresist layers processed with vari-ous exposure doses: 0% (squares), 79% (circles), 100% (triangles),104% (diamonds) of the threshold dose as a function of the surfac-tant concentration measured in 10−5 M KCl.The arrows mark thepoints of zero charge (pzc) for various exposure doses, the dashedline the concentration ceff
on the highly deprotected photoresist. Therefore a higheradsorbed amount would be expected on these processedlayers in the vicinity of the pzc. Unfortunately this couldnot be proved by ellipsometry due to the strong swelling asdiscussed above.
Raising the surfactant concentration above the pzc, thezeta potential increases steadily in the positive range. Atceff, the most efficient concentration for the reduction ofthe pattern collapse, both unexposed and processed pho-toresists have a positive zeta potential between 10 and16 mV. This is surprising since the maximum pattern col-lapse reduction is assumed (and will be shown in the nextsection) to be correlated to maximum hydrophobizing bya surfactant monolayer in the vicinity of the pzc [29].In contrary, a positive zeta potential is interpreted as anexcess of positively charged surfactant molecules form-ing a bilayer or admicelles. One reason for this differ-ence might be the influence of the background electrolyteneeded for the zeta potential measurement. It is knownthat in the presence of electrolytes adsorption and aggre-gation processes of ionic surfactants are shifted to lowerconcentrations [30]. The effect of a 10−5 M KCl solutionis, however, expected to be negligible. Another possibleexplanation is that the hydrophobic tails of the surfac-tant molecules aggregate around ceff to form positivelycharged hemi-micelles on the surface [30]. At the inter-face photoresist-solution this may be energetically morefavorable. If the solution front recedes during evapora-tion or in the captive bubble experiment, the hemi-micellesmight transform into a monolayer which is more favor-able in contact with air. This hypothesis as well as theinfluence of electrolytes will be the subject of furtherinvestigations.

90 A. Drechsler et al.
The Influence of Surfactant on the Capillary Forces
It was outlined that the surfactant rinse is expected to re-duce the pattern collapse by lowering the capillary forcesbetween the photoresist structures. For a given geometry,the capillary forces are proportional to the wetting tensionγlv cos Θ, the product of surface tension and the cosine ofthe contact angle (cf. Eq. 1). In the case of an evapora-tion process, the receding contact angle of the evaporatingsolution has to be taken into account.
The inverse Axisymmetric Drop Shape Analysis(ADSA-P) allows to measure simultaneously the surfacetension and the contact angle of a receding solution frontby increasing the volume of an air bubble that is in con-tact with the photoresist layer. Therefore it is suited verywell to simulate the conditions during the evaporationof the solution in the photolithographic process as is il-lustrated in Scheme 2. There is, however, one significantdifference between the evaporation process and the captivebubble method: The evaporation takes place within sec-onds; the contact angle measurement can be started at leastthan 10 minutes after insertion of the sample in the liquidand may exceed over hours. To eliminate this influenceof swelling on the contact angle, for each contact anglemeasured by the captive bubble method the correspond-ing change of the contact angle in time was estimated fromFig. 7. This correction value was added to the measuredcontact angle.
Several series of contact angle measurements weredone on unexposed photoresist and photoresist processedbelow the threshold dose. All these measurements showeda continuous decrease of the contact angle with increas-ing surfactant concentration even if the contribution ofswelling was subtracted. No hydrophobizing due to the ad-sorption of surfactant was observed in surfactant solutions.
To find out whether a hydrophobizing effect can beobtained by surfactant adsorption, photoresist layers pro-cessed with exposure doses between 50% and 120% ofthe threshold dose have been investigated by the cap-tive bubble method. Their receding contact angle was first
Scheme 2 Comparison of the geometries of the receding contactangle responsible for the capillary forces between photoresist linesin the photolithographic process (left image) and the receding con-tact angle measured by the captive bubble method (right image)
measured in water. Then the wet photoresist layers wereinserted for 15 min in a surfactant solution of concen-tration ceff. When a sufficient amount of surfactant wasassumed to be adsorbed, the wafer pieces were shortlyrinsed with water and transferred into water to measurethe receding contact angle again under the same condi-tions. Figure 9 shows the receding contact angles beforeand after surfactant adsorption. With this method, for allexposure doses an increase of the contact angle (2 to 8)after the surfactant adsorption is recorded. At the thresh-old dose, the increase of the contact angle is remarkablyhigher, about 15.
The experiment described above does surely not yieldthe contact angles that determine the capillary forces sincethe surfactant layer is desorbed partially in water. It proves,however, that a noticeable hydrophobizing effect after sur-factant adsorption can be found for the rather hydrophilicphotoresist surfaces processed with the threshold dose.
Therefore, in another captive bubble experiment, thereceding contact angle of the surfactant solutions on pho-toresist processed with the threshold dose was measuredwhen the photoresist was directly in contact with the solu-tion. The photoresist sample was inserted in water and thesurfactant concentration was stepwise increased. Contactangles were determined after each concentration changewhen equilibrium was reached and corrected by the timeeffect. Figure 10a compares the receding angles of thesurfactant solution on the photoresist surface with the si-multanously measured surface tension of the solution. Thecontact angles were obtained in two independent measure-ment series.
In the investigated concentration range, the surface ten-sion of the surfactant solution is always above 70, i.e. it is
Fig. 9 Receding contact angles (inverse ADSA) of photoresistlayers processed with various exposure doses in water (open circles)and in water after 15 min contact with surfactant solution of con-centration ceff (full circles) as a function of the exposure dose. Thedashed line marks the threshold dose.
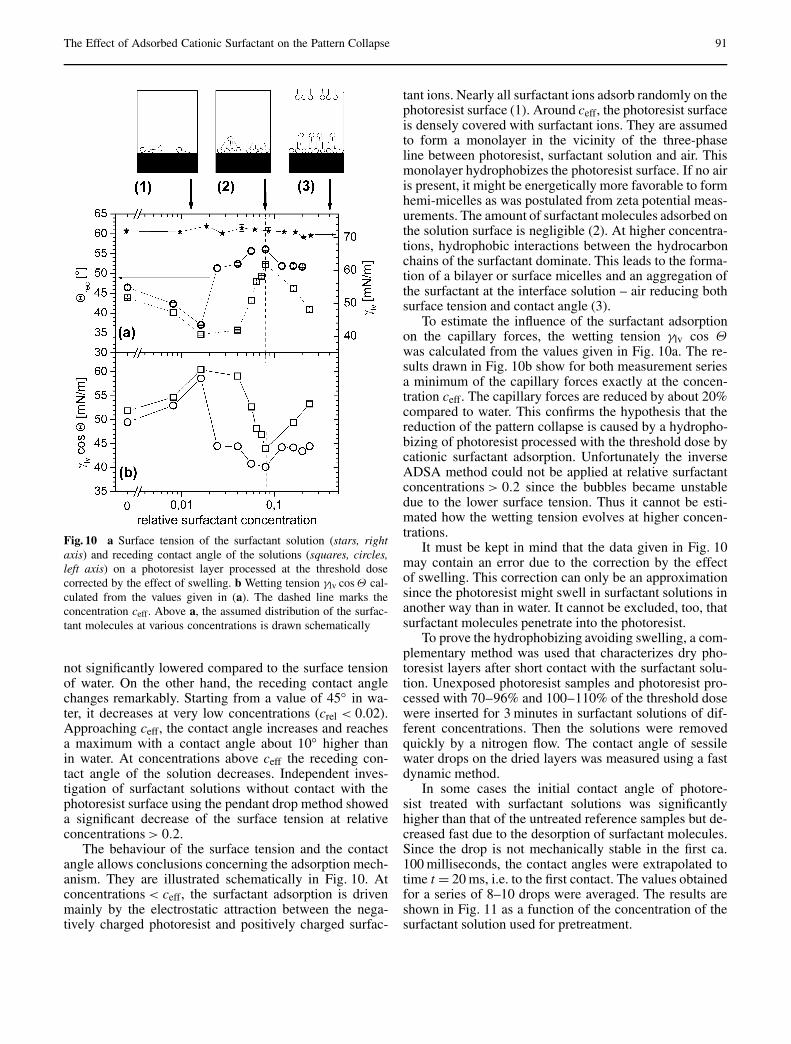
The Effect of Adsorbed Cationic Surfactant on the Pattern Collapse 91
Fig. 10 a Surface tension of the surfactant solution (stars, rightaxis) and receding contact angle of the solutions (squares, circles,left axis) on a photoresist layer processed at the threshold dosecorrected by the effect of swelling. b Wetting tension γlv cos Θ cal-culated from the values given in (a). The dashed line marks theconcentration ceff. Above a, the assumed distribution of the surfac-tant molecules at various concentrations is drawn schematically
not significantly lowered compared to the surface tensionof water. On the other hand, the receding contact anglechanges remarkably. Starting from a value of 45 in wa-ter, it decreases at very low concentrations (crel < 0.02).Approaching ceff, the contact angle increases and reachesa maximum with a contact angle about 10 higher thanin water. At concentrations above ceff the receding con-tact angle of the solution decreases. Independent inves-tigation of surfactant solutions without contact with thephotoresist surface using the pendant drop method showeda significant decrease of the surface tension at relativeconcentrations > 0.2.
The behaviour of the surface tension and the contactangle allows conclusions concerning the adsorption mech-anism. They are illustrated schematically in Fig. 10. Atconcentrations < ceff, the surfactant adsorption is drivenmainly by the electrostatic attraction between the nega-tively charged photoresist and positively charged surfac-
tant ions. Nearly all surfactant ions adsorb randomly on thephotoresist surface (1). Around ceff, the photoresist surfaceis densely covered with surfactant ions. They are assumedto form a monolayer in the vicinity of the three-phaseline between photoresist, surfactant solution and air. Thismonolayer hydrophobizes the photoresist surface. If no airis present, it might be energetically more favorable to formhemi-micelles as was postulated from zeta potential meas-urements. The amount of surfactant molecules adsorbed onthe solution surface is negligible (2). At higher concentra-tions, hydrophobic interactions between the hydrocarbonchains of the surfactant dominate. This leads to the forma-tion of a bilayer or surface micelles and an aggregation ofthe surfactant at the interface solution – air reducing bothsurface tension and contact angle (3).
To estimate the influence of the surfactant adsorptionon the capillary forces, the wetting tension γlv cos Θwas calculated from the values given in Fig. 10a. The re-sults drawn in Fig. 10b show for both measurement seriesa minimum of the capillary forces exactly at the concen-tration ceff. The capillary forces are reduced by about 20%compared to water. This confirms the hypothesis that thereduction of the pattern collapse is caused by a hydropho-bizing of photoresist processed with the threshold dose bycationic surfactant adsorption. Unfortunately the inverseADSA method could not be applied at relative surfactantconcentrations > 0.2 since the bubbles became unstabledue to the lower surface tension. Thus it cannot be esti-mated how the wetting tension evolves at higher concen-trations.
It must be kept in mind that the data given in Fig. 10may contain an error due to the correction by the effectof swelling. This correction can only be an approximationsince the photoresist might swell in surfactant solutions inanother way than in water. It cannot be excluded, too, thatsurfactant molecules penetrate into the photoresist.
To prove the hydrophobizing avoiding swelling, a com-plementary method was used that characterizes dry pho-toresist layers after short contact with the surfactant solu-tion. Unexposed photoresist samples and photoresist pro-cessed with 70–96% and 100–110% of the threshold dosewere inserted for 3 minutes in surfactant solutions of dif-ferent concentrations. Then the solutions were removedquickly by a nitrogen flow. The contact angle of sessilewater drops on the dried layers was measured using a fastdynamic method.
In some cases the initial contact angle of photore-sist treated with surfactant solutions was significantlyhigher than that of the untreated reference samples but de-creased fast due to the desorption of surfactant molecules.Since the drop is not mechanically stable in the first ca.100 milliseconds, the contact angles were extrapolated totime t = 20 ms, i.e. to the first contact. The values obtainedfor a series of 8–10 drops were averaged. The results areshown in Fig. 11 as a function of the concentration of thesurfactant solution used for pretreatment.
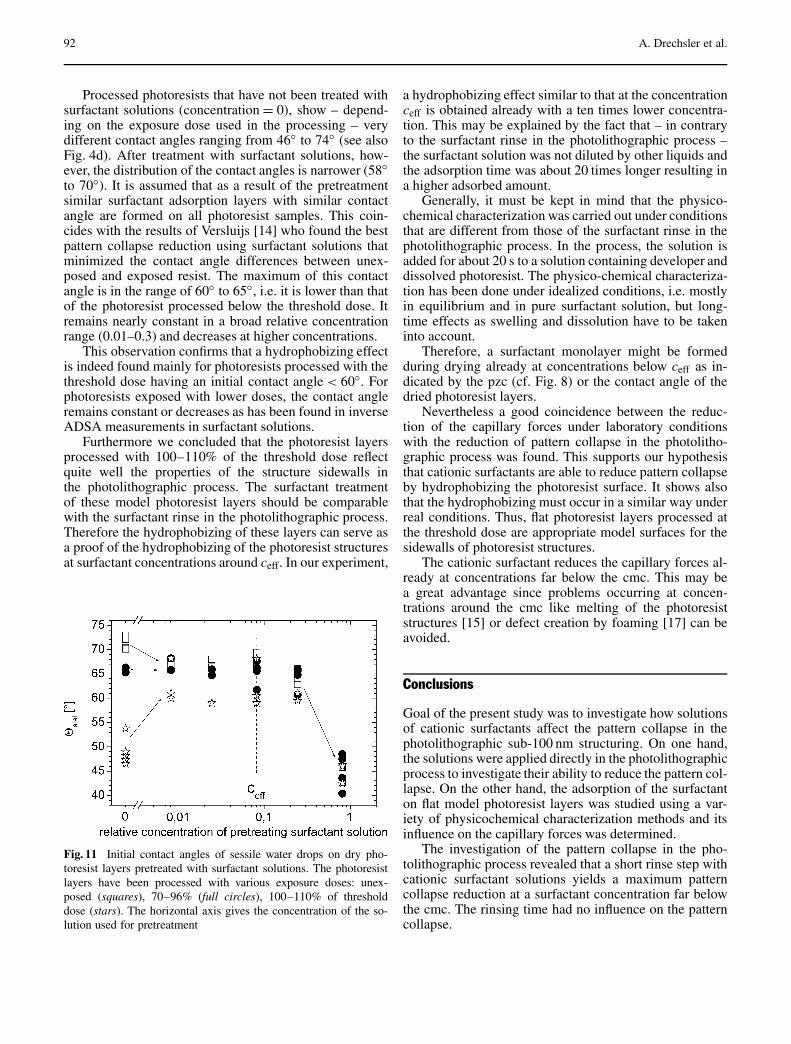
92 A. Drechsler et al.
Processed photoresists that have not been treated withsurfactant solutions (concentration = 0), show – depend-ing on the exposure dose used in the processing – verydifferent contact angles ranging from 46 to 74 (see alsoFig. 4d). After treatment with surfactant solutions, how-ever, the distribution of the contact angles is narrower (58to 70). It is assumed that as a result of the pretreatmentsimilar surfactant adsorption layers with similar contactangle are formed on all photoresist samples. This coin-cides with the results of Versluijs [14] who found the bestpattern collapse reduction using surfactant solutions thatminimized the contact angle differences between unex-posed and exposed resist. The maximum of this contactangle is in the range of 60 to 65, i.e. it is lower than thatof the photoresist processed below the threshold dose. Itremains nearly constant in a broad relative concentrationrange (0.01–0.3) and decreases at higher concentrations.
This observation confirms that a hydrophobizing effectis indeed found mainly for photoresists processed with thethreshold dose having an initial contact angle < 60. Forphotoresists exposed with lower doses, the contact angleremains constant or decreases as has been found in inverseADSA measurements in surfactant solutions.
Furthermore we concluded that the photoresist layersprocessed with 100–110% of the threshold dose reflectquite well the properties of the structure sidewalls inthe photolithographic process. The surfactant treatmentof these model photoresist layers should be comparablewith the surfactant rinse in the photolithographic process.Therefore the hydrophobizing of these layers can serve asa proof of the hydrophobizing of the photoresist structuresat surfactant concentrations around ceff. In our experiment,
Fig. 11 Initial contact angles of sessile water drops on dry pho-toresist layers pretreated with surfactant solutions. The photoresistlayers have been processed with various exposure doses: unex-posed (squares), 70–96% (full circles), 100–110% of thresholddose (stars). The horizontal axis gives the concentration of the so-lution used for pretreatment
a hydrophobizing effect similar to that at the concentrationceff is obtained already with a ten times lower concentra-tion. This may be explained by the fact that – in contraryto the surfactant rinse in the photolithographic process –the surfactant solution was not diluted by other liquids andthe adsorption time was about 20 times longer resulting ina higher adsorbed amount.
Generally, it must be kept in mind that the physico-chemical characterization was carried out under conditionsthat are different from those of the surfactant rinse in thephotolithographic process. In the process, the solution isadded for about 20 s to a solution containing developer anddissolved photoresist. The physico-chemical characteriza-tion has been done under idealized conditions, i.e. mostlyin equilibrium and in pure surfactant solution, but long-time effects as swelling and dissolution have to be takeninto account.
Therefore, a surfactant monolayer might be formedduring drying already at concentrations below ceff as in-dicated by the pzc (cf. Fig. 8) or the contact angle of thedried photoresist layers.
Nevertheless a good coincidence between the reduc-tion of the capillary forces under laboratory conditionswith the reduction of pattern collapse in the photolitho-graphic process was found. This supports our hypothesisthat cationic surfactants are able to reduce pattern collapseby hydrophobizing the photoresist surface. It shows alsothat the hydrophobizing must occur in a similar way underreal conditions. Thus, flat photoresist layers processed atthe threshold dose are appropriate model surfaces for thesidewalls of photoresist structures.
The cationic surfactant reduces the capillary forces al-ready at concentrations far below the cmc. This may bea great advantage since problems occurring at concen-trations around the cmc like melting of the photoresiststructures [15] or defect creation by foaming [17] can beavoided.
Conclusions
Goal of the present study was to investigate how solutionsof cationic surfactants affect the pattern collapse in thephotolithographic sub-100 nm structuring. On one hand,the solutions were applied directly in the photolithographicprocess to investigate their ability to reduce the pattern col-lapse. On the other hand, the adsorption of the surfactanton flat model photoresist layers was studied using a var-iety of physicochemical characterization methods and itsinfluence on the capillary forces was determined.
The investigation of the pattern collapse in the pho-tolithographic process revealed that a short rinse step withcationic surfactant solutions yields a maximum patterncollapse reduction at a surfactant concentration far belowthe cmc. The rinsing time had no influence on the patterncollapse.

The Effect of Adsorbed Cationic Surfactant on the Pattern Collapse 93
The physico-chemical characterization of processedflat photoresist layers showed that the properties of thephotoresist change significantly if it is processed with thethreshold exposure dose that makes the photoresist solu-ble in the developer. Caused by a deprotection reaction,the photoresist becomes acidic and more hydrophilic. Itwas postulated that the thin residual photoresist layers pro-cessed with the threshold dose are appropriate model sur-faces for the sidewalls of the photoresist structures in thephotolithographic process.
By ellipsometry it was proved that the surfactant ad-sorbs on the photoresist surface. In the first minute, theadsorption runs very fast. In or slightly below the con-centration range that accounts for highest pattern collapsereduction the major part of the surfactant ions adsorbsonto the photoresist layer. It is assumed that they forma monolayer or hemimicelles that transform into a mono-layer during contact with air. A remarkable hydrophobiz-ing effect was found for photoresist layers that had beenprocessed with the threshold dose. The contact angle ofthese layers was increased from 45 to 55. Althoughthe surface tension was not lowered significantly, the hy-drophobizing causes a reduction of the wetting tension byabout 20%.
The minimum of the capillary forces in the model sys-tem correlates with the maximum of the pattern collapsereduction in the real photolithographic process. It is con-cluded that the sidewalls of the photoresist structures arehydrophobized in a similar way as the model surfaces bythe cationic surfactant rinse even although the conditionsin the process differ from those of the characterization ex-periments. The resulting reduction of the capillary forcesduring the drying of the structures is the essential factor inthe reduction of pattern collapse.
A great advantage of the cationic surfactant rinse is thatthe minimum of the capillary forces is obtained already atconcentrations far below the cmc. Low amounts of surfac-tant are needed and problems as melting of the structuresor foaming occurring at high surfactant concentration areavoided.
Acknowledgement Financial support for this work provided bythe German Federal Ministry of Education and Research (ProjectNo. 01M3154D) and by Infineon Technologies SC300 is gratefullyacknowledged. The authors also would like to thank A. Casparifor the zeta potential measurements, B. Pinter, I. Mäge, T. Pearce,M. Voigt for the defect density measurements and the unit processteam – resist of Infineon Technologies and J. Kobisch for waferprocessing.
References1. International Technology Roadmap
for Semiconductors (2004)http://public.itrs.net
2. Wallraff GM, Hinsberg WD (1999)Chem Rev 99:1801
3. Lin EK, Soles CL, Goldfarb DL,Trinque BC, Burns SD, Jones RL,Lenhart JL, Angelopoulos M,Wilson CG, Satija SK, Wu W (2002)Science 297:372
4. Cao HB, Nealey P, Domke WD(2000) J Vac Sci Technol B 18:3303
5. Domke WD, Graffenberg VL, Patel S,Rich GK, Cao HB, Nealey PF (2000)Proc SPIE 3999:139
6. Shibata T, Ishii T, Nozawa H,Tamamura T (1997) Jap J Appl Phys36:7642
7. Tanaka K, Naito R, Kitada T, Kiba Y,Yamada Y, Kobayashi M, Ichikawa H(2003) Proc SPIE 5039:1366
8. Lee SK, Jung JC, Lee MS, Lee SK,Kim SY, Hwang YS, Bok CK,Moon SC, Shin KS, Kim SJ (2003)Proc SPIE 5039:166
9. Namatsu H, Yamazaki K, Kurihara K(1999) Microelectronic Engineering46:129
10. Junarsa I, Stoykovich MP,Yoshimoto K, Nealey PF (2004) ProcSPIE 5376:842
11. Hien S, Rich GK, Molina G, Cao HB,Nealey PF (2002) Proc SPIE 4690:254
12. Lee G, Lee SK, Hwang YS, Jung JC,Bok CK, Moon SC, Shin KS (2003)Proc SPIE 5039:1416
13. Jung MH, Lee SH, Kim HW, Woo SG,Cho HK, Han WS (2003) Proc SPIE5039:1298
14. Versluijs JJ, Misat SI, Maenhoudt M,Grozev G, Furusho R (2003) ProcInterface 2003 Symposium, ArchChemicals
15. Watanabe M, Tomo Y, Yamabe M,Kiba Y, Tanaka K, Naito R (2003)Proc SPIE 5037:925
16. Miyahara O, Tanaka K, Wakamizu S,Kitano J, Yamada Y (2004) Proc SPIE5376:830
17. Zhang P, King DM, Karwacki EJ(2002) MICROMagazine June 2002,http://www.micromagazine.com/archive/02/06/zhang.html
18. Stache H (1981) Tensid-Taschenbuch,2nd edition. Carl Hanser, MünchenWien
19. Koopal LK, Goloub T, de Keizer A,Sidorova MP (1999) Colloids Surf A151:5
20. Fuerstenau DW, Jia R (2004) ColloidsSurf A 250:223
21. Wunnicke O, Reichelt J, Busch P,Petong N, Bellmann C, Pinter B,Mäge I, Pearce T, Voigt M,Hermsdorf N, Drechsler A, Stamm M,Grundke K (2004) High aspect ratiopatterning by utilizing surfactant rinseprocess, Proc Interface 2004Symposium. Arch Chemicals
22. Wunnicke O, Hennig A, Grundke K,Stamm M, Czech G (2002) Proc SPIE4690:332
23. Smoluchowski M (1921) Handbuchder Elektrizität und des Magnetismus,Band II. Barth-Verlag, Leipzig
24. Azzam RMA, Bashara NM (1999)Ellipsometry and Polarized Light.North Holland, Amsterdam
25. Lahooti S, del Rio OI, Cheng P,Neumann AW (1996) In: NeumannAW, Spelt K (eds) Applied SurfaceThermodynamics, Marcel Dekker,p 441
26. Grundke K, Bogumil T, Werner C,Janke A, Pöschel K, Jacobasch HJ(1996) Colloids Surf A 116:79

94 A. Drechsler et al.
27. Atkin R, Craig VSJ, Wanless EJ,Biggs S (2003) Adv Colloid InterfaceSci 103:219
28. Parfitt GD, Rochester CH (1983) In:Parfitt GD, Rochester CH (eds)
Adsorption from Solution at theSolid/Liquid Interface. AcademicPress London, p 247
29. Churaev NV, Sergeeva IP, SobolevVD, Jacobasch HJ, Weidenhammer P,
Schmitt FJ (2000) Colloids Surf A164:121
30. Goloub TB, Koopal LK (1997)Langmuir 13:673
31. Fuerstenau DW (1970) Pure ApplChem 24:981

Progr Colloid Polym Sci (2006) 132: 95–101DOI 10.1007/2882_043© Springer-Verlag Berlin Heidelberg 2006Published online: 8 March 2006
Tatiana B. ErmakovaInessa P. SergeevaAnna D. AnuchkinaVladimir D. SobolevNikolay V. Churaev
Electrokinetic Studyof Layer-by-Layer Polyelectrolyteand Surfactant Adsorbed Layers
Tatiana B. Ermakova () ·Inessa P. Sergeeva · Anna D. Anuchkina ·Vladimir D. Sobolev · Nikolay V. ChuraevLaboratory of Thin Liquid Films,Institute of Physical Chemistry andElectrochemistry by A.N. Frumkin ofRussian Academy of Science, Leninskyprospect, 31, 119991 Moscow, Russiae-mail: [email protected]
Abstract Investigations of alternateadsorption regularities of cationicpolyelectrolytes a) copolymer ofstyrene and dimethylaminopropyl-maleimide (CSDAPM) and b)poly(diallyldimethylammoniumchloride) (PDADMAC) and anionicsurfactant – sodium dodecyl sulfate(SDS) on fused quartz surface werecarried out by capillary electrokineticmethod. The adsorption/desorptionkinetics, structure and propertiesof adsorbed layers for both poly-electrolytes and also for the secondadsorbed layer were studied independence on different conditions:molecular weight of polyelectrolyte,surfactant and polyelectrolyte con-centration, the solution flow ratethrough the capillary during theadsorption, adsorbed layer formation
time. For PDADMAC adsorbedlayers evolution of the structureand rheological properties wasobserved. Adsorption of anionicsurfactant leads to the overcharge ofpreliminarily modified quartz surfaceby cationic polyelectrolyte anddepends on the SDS concentrationand prehistory of the first adsorbedlayer. The desorption study showedthat in all cases the partial desorptionof SDS took place, the value of thisdesorption depended on the structureof the first adsorbed layer and SDSconcentration.
Keywords Adsorbed layerdeformation · Adsorption · Aging ·Polyelectrolytes · Streaming potentialmethod
Introduction
In recent years the investigation of polymer-surfactant in-teractions is a rapidly growing field of interest of moderncolloid science [1–4]. The mixtures and multilayer struc-tures of polyelectrolytes and surfactants are widely usedfor industrial application to govern the wetting, adhesion,flotation processes and so on.
The formation of multilayer structure can be carriedout by several ways: 1) adsorption on liquid/liquid inter-face – Langmuir-Blodgett films [5, 6]; 2) adsorption onsolid/liquid interface – alternate adsorption of oppositelycharged polyelectrolytes (PE) and surfactants on flat sur-faces or spherical particles [7, 8]. To control the processof multilayer systems formation, it is necessary to under-
stand the different factors influence on the structure andproperties of layers formed, such as charge distributiondensity on the solid surface, the state of polyelectrolyte ina bulk solution (i.e. its charge and conformation), molecu-lar weight of polyelectrolyte and salt concentration.
It is important to concentrate special attention on thefirst step of the process, viz on the study of polyelectrolyteadsorption on charged surface. The time dependence oflayer growing and structural reconstruction can give theinformation of formation mechanism of the multilayer.
The initial step of any multilayer formation model isthe surface overcharge as a result of one polyelectrolytelayer adsorption. Only in this case the adsorption of thesecond oppositely charged polyion/surfactant ion layer ispossible [9]. In our work the negatively charged surface
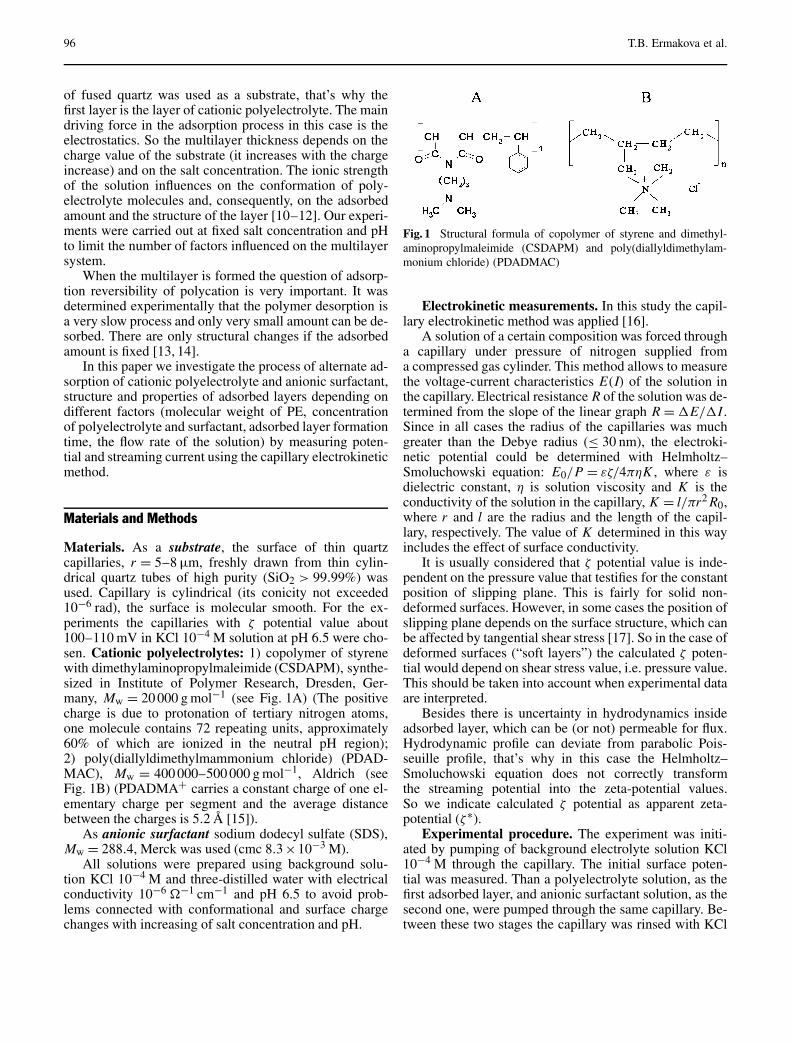
96 T.B. Ermakova et al.
of fused quartz was used as a substrate, that’s why thefirst layer is the layer of cationic polyelectrolyte. The maindriving force in the adsorption process in this case is theelectrostatics. So the multilayer thickness depends on thecharge value of the substrate (it increases with the chargeincrease) and on the salt concentration. The ionic strengthof the solution influences on the conformation of poly-electrolyte molecules and, consequently, on the adsorbedamount and the structure of the layer [10–12]. Our experi-ments were carried out at fixed salt concentration and pHto limit the number of factors influenced on the multilayersystem.
When the multilayer is formed the question of adsorp-tion reversibility of polycation is very important. It wasdetermined experimentally that the polymer desorption isa very slow process and only very small amount can be de-sorbed. There are only structural changes if the adsorbedamount is fixed [13, 14].
In this paper we investigate the process of alternate ad-sorption of cationic polyelectrolyte and anionic surfactant,structure and properties of adsorbed layers depending ondifferent factors (molecular weight of PE, concentrationof polyelectrolyte and surfactant, adsorbed layer formationtime, the flow rate of the solution) by measuring poten-tial and streaming current using the capillary electrokineticmethod.
Materials and Methods
Materials. As a substrate, the surface of thin quartzcapillaries, r = 5–8 µm, freshly drawn from thin cylin-drical quartz tubes of high purity (SiO2 > 99.99%) wasused. Capillary is cylindrical (its conicity not exceeded10−6 rad), the surface is molecular smooth. For the ex-periments the capillaries with ζ potential value about100–110 mV in KCl 10−4 M solution at pH 6.5 were cho-sen. Cationic polyelectrolytes: 1) copolymer of styrenewith dimethylaminopropylmaleimide (CSDAPM), synthe-sized in Institute of Polymer Research, Dresden, Ger-many, Mw = 20 000 g mol−1 (see Fig. 1A) (The positivecharge is due to protonation of tertiary nitrogen atoms,one molecule contains 72 repeating units, approximately60% of which are ionized in the neutral pH region);2) poly(diallyldimethylmammonium chloride) (PDAD-MAC), Mw = 400 000–500 000 g mol−1, Aldrich (seeFig. 1B) (PDADMA+ carries a constant charge of one el-ementary charge per segment and the average distancebetween the charges is 5.2 A [15]).
As anionic surfactant sodium dodecyl sulfate (SDS),Mw = 288.4, Merck was used (cmc 8.3×10⁻³ M).
All solutions were prepared using background solu-tion KCl 10−4 M and three-distilled water with electricalconductivity 10−6 Ω−1 cm−1 and pH 6.5 to avoid prob-lems connected with conformational and surface chargechanges with increasing of salt concentration and pH.
Fig. 1 Structural formula of copolymer of styrene and dimethyl-aminopropylmaleimide (CSDAPM) and poly(diallyldimethylam-monium chloride) (PDADMAC)
Electrokinetic measurements. In this study the capil-lary electrokinetic method was applied [16].
A solution of a certain composition was forced througha capillary under pressure of nitrogen supplied froma compressed gas cylinder. This method allows to measurethe voltage-current characteristics E(I) of the solution inthe capillary. Electrical resistance R of the solution was de-termined from the slope of the linear graph R = ∆E/∆I .Since in all cases the radius of the capillaries was muchgreater than the Debye radius (≤ 30 nm), the electroki-netic potential could be determined with Helmholtz–Smoluchowski equation: E0/P = εζ/4πηK , where ε isdielectric constant, η is solution viscosity and K is theconductivity of the solution in the capillary, K = l/πr2 R0,where r and l are the radius and the length of the capil-lary, respectively. The value of K determined in this wayincludes the effect of surface conductivity.
It is usually considered that ζ potential value is inde-pendent on the pressure value that testifies for the constantposition of slipping plane. This is fairly for solid non-deformed surfaces. However, in some cases the position ofslipping plane depends on the surface structure, which canbe affected by tangential shear stress [17]. So in the case ofdeformed surfaces (“soft layers”) the calculated ζ poten-tial would depend on shear stress value, i.e. pressure value.This should be taken into account when experimental dataare interpreted.
Besides there is uncertainty in hydrodynamics insideadsorbed layer, which can be (or not) permeable for flux.Hydrodynamic profile can deviate from parabolic Pois-seuille profile, that’s why in this case the Helmholtz–Smoluchowski equation does not correctly transformthe streaming potential into the zeta-potential values.So we indicate calculated ζ potential as apparent zeta-potential (ζ∗).
Experimental procedure. The experiment was initi-ated by pumping of background electrolyte solution KCl10−4 M through the capillary. The initial surface poten-tial was measured. Than a polyelectrolyte solution, as thefirst adsorbed layer, and anionic surfactant solution, as thesecond one, were pumped through the same capillary. Be-tween these two stages the capillary was rinsed with KCl

Electrokinetic Study of Layer-by-Layer Polyelectrolyte and Surfactant Adsorbed Layers 97
10−4 M solution. It should be emphasized that desorptionand deformation studies were also carried out in solutionfree of polyelectrolyte and surfactant molecules.
Results and Discussion
Kinetics of Layer-by-Layer Adsorptionof Polyelectrolyte and Surfactant
Since the negative charged surface of fused quartz wasused as a substrate, the first adsorbed layer was the layerof cationic polyelectrolyte. In our previous works [18–20] the adsorption kinetics of cationic polyelectrolyte CS-DAPM was studied in detail. The estimation of adsorptionwas carried out by changing of ζ∗ potential of chargedquartz surface during the cationic polyelectrolyte adsorp-tion.
Here we represent the comparative results of adsorp-tion on the quartz surface of two polyelectrolytes with ter-tiary ammonium (CSDAPM) and quaternary ammoniumgroups (PDADMAC), which are weak and strong poly-electrolytes, respectively (Figs. 2 and 3).
All adsorbed layers were formed at different pressures(from 2 atm up to 10 atm). But measurements were done at∆P = 10 atm (as our data will show hereinafter, there is noany deformation of adsorbed layers above ∆P = 10 atm).The constant ζ∗ potential value establishment doesn’t de-pend on the flow conditions at each concentration.
As can be seen from the Figs. 2 and 3, the characterof dependencies doesn’t qualitatively differ for polyelec-trolytes of different nature. The quantitative characteristicssuch as the time of establishment of surface potential mag-nitude and its values are different.
For both polyelectrolytes the adsorption of polymermolecules occurs mostly due to the forces of electrostaticattraction at concentrations below 10−4 g/l. At higher PE
Fig. 2 The dependence of apparent zeta-potential as a functionof time in the course of CSDAPM adsorption on quartz surface(1−C = 10−5 g/l; 2−C = 2.5×10⁻⁴ g/l; 3−C = 10−4 g/l; 4−C = 10−3 g/l; 5−C = 10−2 g/l; 6−C = 5×10⁻¹ g/l)
Fig. 3 The dependence of apparent zeta-potential as a functionof time in the course of PDADMAC adsorption on quartz sur-face (1−C = 10−5 g/l; 2−C = 10−4 g/l; 3−C = 10−3 g/l; 4−C = 10−2 g/l)
concentration (C ≥ 10−4 g/l) the rapid decrease in thenegative values of ζ∗ potential is observed, following bythe charge reversal of the surface, which occurs the ear-lier the higher the polymer concentration is. The constantpositive values of ζ∗ potential correspond to the adsorptionsaturation of the quartz surface.
The observed charge reversal can prove the presenceof two types of the PE adsorption sites on the capillarysurface. At low concentration, the electrostatic adsorp-tion of positively charged PE molecules predominantlyoccurs on the negatively charged sites of quartz surface.Thereafter (or simultaneously), on the surface of a capil-lary covered with a polymer adsorbed layer, the adsorp-tion of the PE molecules can occur due to the forces ofmolecular attraction and attraction between hydrophobicsites of polyelectrolyte and surface (e.g. siloxane groups).Their competition with the electrostatic repulsion forcesthat increase in the course of further adsorption of PEmolecules determines the completion of the adsorption andthe formation of equilibrium (with the solution) adsorbedlayer.
After the establishment of constant PE adsorption valuethe capillary was rinsed with background KCl 10−4 M so-lution and then the adsorption of the second layer wascarried out.
The second adsorbed layer was formed due to thepumping through the capillary with preadsorbed polyelec-trolyte layer of anionic surfactant solution of different con-centrations below cmc. To clear out the influence of thefirst adsorbed PE layer on the formation of the second an-ionic surfactant layer, we studied the adsorption of SDS onPE layers of different structures (see Deformation of Ad-sorbed Layers): when the PE molecules adsorbed in flatconformation (CSDAPM at C = 10−4 g/l) and when theextended layer with loops and tails was formed (CSDAPMat C = 10−2 g/l and PDADMAC at C = 10−2, 10−3 and10−4 g/l).

98 T.B. Ermakova et al.
A) CSDAPM + SDS. Figures 4 and 5 represent thekinetics of ζ∗ potential change during the SDS adsorp-tion on the modified quartz surface. As can be seen fromFig. 4, when the SDS adsorption takes place from solu-tions with concentrations 10−4 M (curve 1) and 10−3 M(curve 2) on the cationic polyelectrolyte layer with con-centration 10−4 g/l, the strong overcharge of the surfaceoccurs. This fact may testify that there is another adsorp-tion mechanism except electrostatic one possibly due tothe hydrophobic interaction of non-polar tails of surfac-tant molecules with hydrophobic sites of cationic polyelec-trolyte adsorbed layer. The overcharge and consequentlythe adsorption increase with the increasing of surfactantconcentration, although the surface charge caused by PEadsorption is equal in both cases.
The similar dependencies are observed when the pread-sorbed layer was formed from 10−2 g/l CSDAPM solution(Fig. 5).
The comparison of the findings shows that the ζ∗potential and the SDS adsorption values depend on the
Fig. 4 The adsorption kinetics of SDS with concentrations C =10−4 M (curve 1) and C = 10−3 M (curve 2) on the quartz sur-face preliminary adsorbed by cationic polyelectrolyte CSDAPMC = 10−4 g/l
Table 1
CPE, g/l ζ∗PE, mV ∆ζ∗
PE CSDS, M ζ∗SDS, mV ζ∗
PE −ζ∗SDS ∆ζ∗
SDS ζ∗, mV, rinsing
at ∆P = 10 atm
10−4 +65 non-deformed 10−4 −20 85 40 +13
in 6 days
10−4 +53 14 10−3 −76 129 57 −43
10−3 +75 30 10−4 −37 113 80 +22
10−3 +73 10 10−3 −80 153 60 −50
10−2 +103 20 10−4 −30 133 74 +30
10−2 +111 10 10−3 −70 181 70 −35
Fig. 5 The adsorption kinetics of SDS with concentrations C =10−4 M (curve 1) and C = 10−3 M (curve 2) on the quartz sur-face preliminary adsorbed by cationic polyelectrolyte CSDAPMC = 10−2 g/l
PE solution concentration from which the first adsorbedlayer is formed and also on the SDS concentration: atCPE = 10−4 g/l and CSDS = 10−4 M (Fig. 4, curve 1)and 10−3 M (Fig. 4, curve 2) the adsorption values esti-mated by ζ∗ potentials difference (ζ∗
PE − ζ∗SDS) are 74 mV
and 123 mV, respectively. And at CPE = 10−2 g/l andCSDS = 10−4 M (Fig. 5, curve 1) and 10−3 M (Fig. 5,curve 2) ζ∗
PE − ζ∗SDS are 105 mV and 142 mV, respectively.
B) PDADMAC + SDS. The results of adsorption ofSDS with concentrations of 10−3 and 10−4 M on thequartz surface preliminarily modified by PDADMAC ofconcentration range from 10−4 to 10−2 g/l are shown inthe Table 1.
The comparison of results of the SDS adsorption onthe CSDAPM and PDADMAC preadsorbed layers showsthat in the second case the adsorption of anionic surfactantalso leads to the overcharge of the surface and increaseswith the increasing of surfactant concentration. Whereasthe time of SDS adsorption on different polyelectrolytesis various. For example, when SDS 10−4 M adsorbs on

Electrokinetic Study of Layer-by-Layer Polyelectrolyte and Surfactant Adsorbed Layers 99
CSDAPM 10−4 g/l ζ∗ potential values reach the equilib-rium in about 50–60 minutes while at the same SDS con-centration on PDADMAC 10−4 g/l – in 120 minutes. Suchdifference can be connected with the nature of polyelec-trolytes, molecular weight and different deformation ofadsorbed layers on which the SDS adsorption takes place.
Deformation of Adsorbed Layers
The capillary electrokinetic method allows to get the in-formation about the structure of the adsorbed layers bymeasuring the dependence of ζ∗ potential on the pressureenclosed (∆P) (Figs. 6 and 7).
In the case of CSDAPM (Fig. 6) the measured values ofzeta-potentials are independent of the solution flow rate atthe concentrations of PE C < 10−2 g/l (curve 1). At highersolution concentration C ≥ 10−2 g/l the considerable de-pendence shows up.
According to these data, one may draw a conclusionthat at low concentrations PE molecules adsorb in flat con-formation and at high concentrations more extended layerwith loops and tails is formed. These data about conforma-tion of polyelectrolyte molecules are in a good agreementwith other experimental and theoretical works [21–23].Note that the curves are reversible and ζ∗ potential valuesestablish immediately at each pressure value after pressurerising and decreasing. This is the argument that the de-formation of adsorbed layers but not desorption of macro-molecules takes place on experimental time scale, sinceour measurements are carried out in polyelectrolyte-freesolution.
Fig. 6 The dependence of ζ∗ potential on the pressure enclosedfor CSDAPM solution for concentrations of 10−4 g/l (curve 1),10−3 g/l (curve 2), 10−2 g/l (curve 3)
Fig. 7 The dependence of ζ∗ potential on the pressure enclosedfor PDADMAC solution for concentrations of 10−4 g/l (curve 1),10−3 g/l (curve 2), 10−2 g/l (curve 3)
In the case of PDADMAC the dependence of ζ∗ poten-tial on the pressure was observed at the whole concentra-tion range investigated (Fig. 7). Even at low PE concen-tration the conformation of macromolecules differs fromthe flat one. It can be a consequence of the high molecularweight of PDADMAC.
One more interesting fact noted was the time evo-lution of PDADMAC structure and rheological proper-ties, namely, there were the change of deformation value(here, the change of the value of ∆ζ∗ = ζ∗
∆P=2.5 atm –ζ∗∆P=45 atm) of PDADMAC adsorbed layer with time. The
dependence of the ζ∗ potential on the pressure was meas-ured immediately after the reaching of equilibrium valuesof ζ∗ potential (so-called “freshly” formed layer), in oneday and in some cases in 6 days. For example, in Fig. 8the dependence of ζ∗ potential on the pressure for thePDADMAC solution with concentration of C = 10−4 g/lis represented. Here, ζ∗ changed from +113 to +36 mVfor “freshly” formed layer (∆P = 3–45 atm) (curve 1), forthe adsorbed layer in one day ζ∗ changed from +74 to+51 mV (curve 2) and in 6 days there were no ζ∗ potentialdependence on the pressure (ζ∗ = 64 mV) (curve 3).
The absence of CSDAPM adsorbed layer aging can bethe sequence of this PE nature: this polyelectrolyte is weakand has low molecular weight in comparison with PDAD-MAC. Hence, the reconstruction inside the adsorbed layermay occur during less time, in our case during the adsorp-tion time scale.
Now it is rather well established that ionic surfac-tants associate with cationic polyelectrolytes both in thebulk solution and at the interface. In our study it wasfound that the deformation increases after the SDS ad-sorption in the whole concentration range investigated.As can be seen from the Table 1, the SDS adsorptionon practically non-deformed first adsorbed layer leads tothe increase in ζ∗ potential change value with pressure.

100 T.B. Ermakova et al.
Fig. 8 The dependence of ζ∗ potential on the pressure forthe PDADMAC solution with concentration of C = 10−4 g/l for“freshly” formed adsorbed layer (curve 1) and in one day (curve 2)
This fact can’t be explained only by the thickness growthdue to the adsorption of not large SDS molecules, but itcan also be connected with conformational changes in PElayer followed by reduction of affinity between PE chainand negatively charged surface. This comes in a goodagreement with AFM study performed by V. Bergeronand P.M. Claesson [24]. They showed that before additionof SDS the polyelectrolyte coated the surface homoge-neously, but after SDS addition the association and mate-rial redistribution took place and large features were ob-served. So we may say that the anionic surfactant causesthe significant “swelling” of the preadsorbed layer. Suchswelling tendency was also observed in several works [3,25, 26].
Strictly speaking the dependencies of ζ∗ potential onpressure may be caused not only by the thickness changesdue to the deformation but also by the changes of flow con-ditions inside the layer [27]. That’s why values calculatedhere are evaluative to a greater extent. However, the de-pendencies obtained describe the processes taking place inadsorbed layers in reality.
Desorption Study
The desorption study of polyelectrolytes (CSDAPM andPDADMAC) by pumping through the capillary of thebackground electrolyte solution under high pressure(∆P ≈ 30 atm) during one day showed that the adsorptionis not reversible. One of the reason may be that the poly-electrolytes are firmly bound to the quartz surface via greatnumber of attachments, which is a consequence of theirlarge size [3, 28–30].
A) Surface/CSDAPM/SDS system. The desorptionwas carried out by pumping of the background electrolytesolution through the capillary under different pressurevalues. Electrokinetic potential values of SDS adsorbed
layer formed on non-deformed PE layer (10−4 g/l) varyfrom −30 to −40 mV. If the rinsing was carried out at∆P = 5 atm, ζ∗ reached the value of −3 mV in 15 min-utes and +30 mV in 3 hours. The pressure increasing upto 10 atm didn’t change the ζ∗ potential value, i.e. the SDSlayer came off almost completely. These results testify thatthe ζ∗ potential change is not connected with the PE de-sorption after adsorption of anionic surfactant since thepotential values of the first layer become former as a resultof rinsing.
If SDS adsorption occurred on deformed PE (10−2 g/l),the rinsing of the capillary during long time didn’t lead tothe full desorption of SDS molecules; its surface stayednegatively charged. This may be the result of adsorptionof SDS molecules inside the more extended PE layer. Thedesorption of these molecules wasn’t observed even if thepressure was increased up to 20–30 atm during one day.
B) Surface/PDADMAC/SDS system. The desorptionstudy was carried out for the SDS adsorbed layers formedduring 1 day (see Table 1). As the bilayer structure becamemore compact, the value of desorption was determinedby SDS concentration. It was shown that bilayer structurewith the second SDS adsorbed layer of C = 10−3 M ismore stable in comparison with SDS C = 10−4 M: in thefirst case the negatively charged surface stays negative andwhen the SDS concentration equals to 10−4 M the over-charge of the surface takes place.
Partial desorption for both systems can be explained bythe fact that the part of surfactant molecules could induceinto preadsorbed cationic PE layer and form “internal mi-celles” that was reported in some works [31–33]. And inthis case only surfactant molecules that are not in such “in-ternal micelles” structures would be desorbed.
Conclusions
In this paper we have investigated the regularities of bi-layer adsorption of cationic polyelectrolytes a) copoly-mer of styrene and dimethylaminopropylmaleimide (CS-DAPM) and b) poly(diallyldimethylammonium chloride)(PDADMAC) and anionic surfactant (SDS) on fusedquartz surface by capillary electrokinetic method. It wasfound that the adsorption of the first layer depended onmolecular weight and concentration of PE. The adsorptionincreased with PE concentration and the time of the con-stant adsorption value establishment was less for PE withhigher molecular weight (PDADMAC).
The adsorption in all cases was irreversible. No desorp-tion was observed even at high velocity of the solution flowthrough the capillary.
Our study revealed the time effect on the structure ofadsorbed layer. It was noted that the deformation abilityof PDADMAC layer decreased in one day after its forma-tion. This means that the conformation rearrangement timeis more than the adsorption time.

Electrokinetic Study of Layer-by-Layer Polyelectrolyte and Surfactant Adsorbed Layers 101
Adsorption of oppositely charged SDS on pread-sorbed PE layer resulted in the surface overcharge. Thebilayer deformation study showed the increase in defor-mation values as a result of SDS adsorption, hence theanionic surfactant caused “swelling” of the preadsorbedlayer.
The desorption study indicated that the SDS adsorptiondid not result in PE desorption, whereas desorption of SDS
took place for all bilayer structures. The desorption valuedepends on preadsorbed layer structure and SDS concen-tration.
Acknowledgement We thank Dr. S. Zschoche (IPF, Dresden,Germany) for providing us with polyelectrolyte (CSDAPM). Thiswork was supported by the Russian Foundation for Basic Research,project no. 04-03-32455.
References1. Kwak JCT (1998) Polymer-Sufactant
Systems. Marcel Dekker, New York2. Goddard ED, Ananthapadmanab-
han KP (1993) Interaction ofSurfactants with Polymers andProteins. CRC Press, Boca Raton FL
3. Kjellin URM, Claesson PM,Audebert R (1997) J Colloid and IntSci 190:476
4. Geffroy C, Lebeau MP, Wong K,Cabane B, Cohen Stuart MA (2000)Colloids and Surf A: Phys and EngAspects 172:47
5. Poloucek P, Pietch U, Geue T,Symietz CH, Brezesinski G (2001)J Phys D: Appl Phys 34:450
6. Lvov Y, Decher G, Sukhorukov G(1993) Macromolecules 26:5396
7. Schwarz S, Eichorn KJ, Wischer-hoff E, Laschewsky A (1999) CollSurf A 159:491
8. Hoogeveen NG, Cohen Stuart MA,Fleer GJ (1996) Langmuir 12:3675
9. Caselnovo M, Joanny J-F (2000)Langmuir 16:7524
10. Van der Schee HA, Lyklema J (1984)J Phys Chem 88:6661
11. Shubin V, Linse P (1997)Macromolecules 30:5944
12. Steitz R, Leiner V, Siebecht R,v Klitzing R (2000) Colloids and SurfA: Physicochem Eng Aspects 163:63
13. Plech A, Salditt T, Münster C, Peisl JJ(2000) Colloid Interface Sci 223:74
14. Sukhishvili SA, Dhinojwala A,Granick S (1999) Langmuir 15:8471
15. McAloney RA, Sinyor M, Dudnik V,Goh MC (2001) Langmuir 17:6655
16. Churaev NV, Sergeeva IP, Sobo-lev VD, Zorin ZM, Gasanov EK(1993) Colloids Surf A 76:23
17. Churaev NV, Sergeeva IP, Sobo-lev VD (1995) J Colloid and Int Sci169:300
18. Sergeeva IP, Ermakova TB, Sobo-lev VD, Churaev NV (2004) Colloid J66:378
19. Sergeeva IP, Ermakova TB, Sobo-lev VD, Churaev NV (2003) Colloid J65:606
20. Sergeeva IP, Ermakova TB,Churaev N, Grundke K, Yudin O(2002) Colloid J 64:478
21. Marra J, Hair ML (1988) J PhysChem 92:6044
22. Biggs S, Proud AD (1997) Langmuir13:7202
23. Bremmell KE, Jameson GJ, Biggs S(1998) Colloid and Surf A: Phys andEng Aspects 139:199
24. Bergeron V, Claesson PM (2002) Advin Colloid and Int Sci 96:1
25. Shubin V, Petrov P, Lindman B (1994)Colloid Polym Sci 272:1590
26. Plunkett MA, Claesson PM,Rutland MW (2002) Langmuir18:1274
27. Cohen Stuart MA, Waajen FHWH,Cosgrove T, Vincent B, Crowley TL(1984) Macromolecules 17:1825
28. Parfit GD, Rochester CH (1983)Adsorption from Solution at theSolid/Liquid Interface. AcademicPress, London,NY
29. Shubin V, Linse P (1988) J Phys Chem92:6044
30. Lowack K, Helm CA (1998)Macromolecules 31:823
31. Lindman B, Thalberg K (1993) In:Goddard ED, Ananthapadmanab-han KP (eds) Interactions ofsurfactants with polymers andproteins. CRC Press, Boca Raton FL
32. Voisin D, Vincent B (2003) Adv inColloid and Int Sci 106:1
33. Claesson PM, Dedinaite A, Blom-berg E, Sergeyev VG (1996) BerBunsenges Phys Chem 100:1008

Progr Colloid Polym Sci (2006) 132: 102–109DOI 10.1007/2882_039© Springer-Verlag Berlin Heidelberg 2006Published online: 10 March 2006
S. SchwarzJ. NagelA. JankeW. JaegerS. Bratskaya
Adsorption of Polyelectrolyteswith Hydrophobic Parts
S. Schwarz () · J. Nagel · A. JankeLeibnitz-Institut für PolymerforschungDresden e.V., Hohe Str. 6, 01069 Dresden,Germanye-mail: [email protected]
W. JaegerFraunhofer Institut für AngewandtePolymerforschung, Geiselbergstr. 69,4476 Golm, Germany
S. BratskayaInstitute of Chemistry, Far EastDepartment of Russian Academy ofSciences, 159, Prosp. 100-letiyaVladivostoka, 690022 Vladivostok, Russia
Abstract Polyelectrolytes offernumerous possibilities for modifi-cation of particles, planar inorganicor polymer surfaces, and control ofcolloidal stability. Significant en-hancement of flocculation propertiescan be achieved through introduc-tion of hydrophobic functionalitiesinto polyelectrolyte backbone thatincreases surface activity and al-low formation of polyelectrolyteaggregates. Here the flocculationperformance of a high molecularweight cationic polyelectrolytewith hydrophobic functionalities,PMBQ (poly(methacryloyloxyethyldimethylbenzyl-ammonium chlo-ride)) was investigated in stablekaolin dispersions using turbiditymeasurements for efficiency esti-mation. Polyelectrolyte aggregatesof PMBQ obtained at high ionicstrength have shown superior floccu-
lation properties in comparison withnon-aggregated PMBQ. Remarkabledifference in water and salt solutionswas found in mono- and multilayerformation using polyanion mediummolecular weight polystyrenesul-fonate (PSS) and PMBQ. Streamingpotential measurements, in-situSPR and AFM were used to followand quantify layer build up andcharge reversal at the solid/liquidinterface at the molecular level.SPR measurements, allowing in-situcontrol of polyelectrolyte adsorptionprocess, have revealed that the layersthickness depended strongly on ionicstrength. However, AFM has shownthat the layers obtained had very highroughness.
Keywords Layer thickness ·Polyelectrolyte layer · SPR ·Streaming potential
Introduction
Interfacial interactions between a polyelectrolyte and solidsubstrate via adsorption from aqueous solution is an im-portant phenomenon in numerous industrial fields whichdetermines high academic and technological interest tothis subject. Wide range of polyelectrolytes applicationsin waste water treatment, paper processing, productionof functional polymeric coatings, etc. promotes consid-erable attention of scientists to the investigation of poly-mer adsorption at solid-liquid interfaces [1–6]. A deepunderstanding of this phenomenon is required to con-trol and optimize technological processes involving poly-
electrolytes, which are used in many fields to regulatestability and flocculation properties of disperse systems.It is well established that charge and conformation ofthe adsorbed polyelectrolytes have decisive influence onthe stability and flocculation of dispersions [7–10]. Usu-ally, the range of polyelectrolyte concentration provid-ing efficient flocculation is very narrow, and followedby restabilization of pollutants by polymer overdosingdue to steric or electrosteric effects. However, a broadflocculation window is highly desirable for industrialapplications, since considerable changes in continuouswaste stream parameters (solid content, ionic strength,pH, presence of surfactants stabilizing fine suspensions)

Adsorption of Polyelectrolytes with Hydrophobic Parts 103
are possible within one day or even within an hour. Ifthe flocculation range is too narrow, calculation and dos-ing of the appropriate flocculant amount become veryproblematic.
Aggregates like polyelectrolyte complexes having pos-itive charges and hydrophobic domains show a broader op-timum flocculation concentration range and are consideredas new reactive “nanoparticles” [11–14]. Thus, polyca-tions with hydrophobic functionalities represent an inter-esting class of water-soluble associating polyelectrolytesrelevant for controlled stabilization/flocculation of disper-sions in numerous industrial applications.
In our investigations we used a new type of high mo-lecular weight flocculant with hydrophobic parts to buildup self-assembled thin films. Thin polymer films can be as-sembled on charged substrates by alternating deposition ofpolyanions and polycations [15–17]. Each deposition stepintroduces a reproducible quantity of polyelectrolyte onthe oppositely charged surface and reverses the charge onthe surface, providing favorable conditions for depositionof the next polymer layer with opposite charge. Repeat-ing the deposition steps allow to build up films from theangstrom up to the micrometer range under precise controlof the total film thickness.
Polycations like polyethyleneimine, poly(diallyldime-thylammonium chloride) and poly(allylammonium chlo-ride) have mainly been used to build up multilayers. Inthis paper we followed the layer-by-layer formation of thinfilms using PMBQ as a cationic component and PSS as ananionic component. The alternating adsorption of PMBQand PSS was investigated by streaming potential, in-situSPR, and AFM.
Experimental
Materials
The polyelectrolytes used in this study are displayed inTable 1. Hydrophobic flexible polyelectrolyte moleculesof poly(methacryloyloxyethyl dimethylbenzylammoniumchloride) (PMBQ) with a molecular weight of 4.2 Miog/mol was synthesized by free radical polymerization inwater solution as described elsewhere [18, 19]. Poly(so-dium styrenesulfonate) (PSS) with molecular weight of70 000 g/mol was purchased from Aldrich and was usedwithout further purification. Water purified and deion-ized (reverse osmosis followed by ion exchange andfiltration) by means of Milli-RO 5Plus and Milli-QPlus systems (Millipore GmbH, Germany) was used asa solvent.
Flocculation Test
Stable model suspensions of kaolin (Sigma) with aver-age diameter of particles 610 nm as determined by means
Table 1 Used polyelectrolytes
Poly-Methacryl-oyloxyethyl- Poly(sodium
dimethylbenzyl-amonium-chloride styrenesulfonate)
PMBQ PSS
of the flow-type histogram analyzer FPIA-2100 (Sysmex,Japan) based on microscopy principle were used for theflocculation tests. The flocculation studies were carriedout using a conventional test equipment for the charac-terization of the flocculation and sedimentation processunder static conditions. After addition of the appropriateamount of polycation solution followed by 10 minutes stir-ring and 20 minutes sedimentation, the supernatant wasseparated. The efficiency of the flocculation was estimatedas the decrease in turbidity measured as optical density at500 nm (OD500) by means of spectrophotometer Lambda900 (Perkin Elmer, UK).
Multilayer Deposition
Glass slides with the dimensions of 76×26×1 mm wereused as supports for the multilayers. The slides were thor-oughly cleaned by a mixture of sulfuric acid and potassiumdichromate at 80 C for about 2 hours in an ultrasonic bathprior to the films deposition. The initial concentration c0of polyelectrolytes in the solution was 1×10⁻² mole ofthe repeating units per liter. The pH value of the solutionwas about 6. Adsorption was carried out at room tempera-ture in open glass beakers of 100 mL without stirring for20 min. After every deposition step, the glass slides wererinsed three times for 1 min with Millipore Milli-Q water.The substrate was not dried between the adsorption steps.
For some experiments (surface plasmon resonance),high refractive index glass slides SF10 (Hellma OpticGmbH, Germany) covered by a thin evaporated gold layerwith the thickness of approximately 50 nm were used assupports.

104 S. Schwarz et al.
Electrokinetic Measurements
Electrokinetic measurements for the polyelectrolyte layerswere carried out by means of an Electrokinetic Analyzerdevice (A. Paar KG, Austria). The glass substrate afterpolyelectrolyte deposition was several times rinsed withdeionized water to ensure that unadsorbed polymers do notcontribute to the ζ-potential measured. The values of ζ-potential were calculated according to the formula:
ζ = η
ε0εr
∆U
∆pκ , (1)
where ∆U is streaming potential measured between twoAg/AgCl electrodes located at the opposite ends of thesubstrates, η, εr, κ are dynamic viscosity, relative dielec-tric permittivity, and conductivity of the flowing elec-trolyte solution (0.001 M KCl), respectively. ε0 is dielec-tric permittivity of vacuum, and ∆p is the pressure applied(150 mbar). Solutions of 0.1 M KOH and HCl were used tochange pH of the flowing electrolyte solution in the rangefrom 9 to 3.
Surface Plasmon Resonance
Surface plasmon resonance data for the layers were ob-tained by means of the equipment consisting of a He-Nelaser with λ = 632.8 nm (Uniphase, USA), a semi-cylindermade of SF10 glass, a liquid flow cell with the volumeof 2.5 ml, and a E10V large area silicon photodiode de-tector with an integral preamplifier (Linos GmbH, Ger-many). The laser emitted polarized light (polarization ratio500 : 1) with power of 3 mW onto a semi-cylinder whoseplane face was coupled via an index matching fluid to thesubstrate examined (SF10 glass slide covered by the goldlayer and then by the polyelectrolyte layers). The liquidflow cell was attached to the other side of the substrate andsealed with a rubber O-ring. The light was reflected ontothe gold layer to excite surface plasmons. The intensity ofthe reflected light was measured by the photodiode. Boththe semi-cylinder and the detector were mounted in an in-house θ/2θ goniometer in such a way that the laser beamwas incident on the detector at any angle of incidence. Thegoniometer and the photodiode were interfaced (Motion-Master 3000, Newport Corp., USA) to a personal com-puter. An in-house 32-bit software package was used forgoniometer control, data acquisition, curve modeling, andcurve fitting. For scans over a certain range of incidenceangles, a step width of 0.1 was used. The curves obtainedwere fitted according to Fresnel equations for a four-layermodel (glass/metal/dielectric/surrounding medium). Sincethe refractive index of the adsorbed polymer layer couldnot be measured at the same time, it was assumed to be 1.5.This is a typical value of a dense polymer.
For the determination of the average thickness of thepolyelectrolyte layers the following procedure was ap-plied. At first, the angular dependence of reflectivity (an-
gular scan) was measured for the original slide in the flowcell that was brought into contact with water or 1 M KClsolution. The liquid was continuously circulated by a peri-staltic pump through the liquid flow cell at a speed of10 ml/min. Then, the water or salt solution was replacedby the polycation solution, in water or KCl. After 20 minan angular scan was measured again. The resulting filmthicknesses were fitted and plotted as a function of thenumber of double layers.
Atomic Force Microscopy
The AFM experiments were carried out with a MFP-3D(Asylum Research, Santa Barbara, USA) in the AC modeon air with a scan rate of 0.3 Hz. The tips used for theexperiments were silicon probes from Budgetsensors (Bul-garia).
All measurements were carried out at room tempera-ture.
Results and Discussion
The SEM picture (Fig. 1, insert a) confirms that themain part of kaolin particles has size in the range of300–600 nm, but the distribution is rather broad. Thiskind of kaolin with rather fine particles has a high spe-cific surface area and a high negative charge density of−13.75 C/g. Thus, the kaolin suspension remains stabledue the strong electrostatic repulsion between particles.
PMBQ was tested for the flocculation as a solutionin water as well as in aqueous 1 M KCl solution. The
Fig. 1 Optical density of kaolin dispersion at pH 8 as a function ofthe concentration of PMBQ and PMBQ-aggregates. Insets: a SEM-picture of kaolin; b floc size distribution in kaolin dispersion treatedwith 4 mg/g PMBQ and PMBQ-aggregates

Adsorption of Polyelectrolytes with Hydrophobic Parts 105
charge density in water was 3.8 meq/g as determined bypolyelectrolyte titration. In 1 M KCl solution the forma-tion of PMBQ aggregates with an average size of 1.2 µmwas observed. Here, the high ionic strength resulted prob-ably in the screening of the electrostatic repulsion betweenthe charges along the polymer backbone and, thus, favorsshort-range hydrophobic attraction leading to the forma-tion of the polyelectrolyte aggregates. The apparent chargedensity of PMBQ aggregates (freshly prepared) was re-duced to 1.8 meq/g. Thus, part of the positively chargedgroups may be hidden inside the aggregates.
The results of the flocculation investigations withPMBQ and PMBQ aggregates are shown in Fig. 1. PMBQin aqueous solution is an efficient flocculant in a nar-row concentration range: at polymer doses higher thanthose required for flocculation, redispersion takes placevery quickly. That is typical for highly charged polyelec-trolytes [20]. However, the PMBQ aggregates formed in1 M KCl solution exhibited a much broader flocculationwindow with low residual turbidity and noticeably largerflocs (Fig. 1, insert b) measured by means of flow-typehistogram analyzer FPIA-2100 (Sysmex, Japan).
Other potentially important fields of PMBQ aggregateapplications are the flocculation of problematic wastescontaining nanoparticles with low charge, such as dispersedyes from the textile factories, slurries from microelec-tronics, or emulsified oil products, which are notoriouslydifficult to remove using conventional hydrophilic floccu-lants. For these applications the flocculant PMBQ may besuitable because of the lower charges and the additionalhydrophobic parts. Previous investigations showed that as
Fig. 2 AFM images after adsorption of PMBQ, Adsorption on different substrates, PMBQ in water: a mica, b silicon-wafer, hydrophil, csilicon-wafer, hydrophob, PMBQ in 1 mol l−1 KCl: d mica, e silicon-wafer, hydrophil, f silicon-wafer, hydrophob
a result of conformation changes and drastic increase ofpolymer size in salt solution the flocculation properties ofPMBQ aggregates significantly differ from that of PMBQ.This was, first of all, illustrated by the fact that no restabil-isation of silica dispersions occurred [20].
It was shown [21] that polyelectrolytes having hy-drophobic functionalities show higher efficiency for suchsystems due to the synergetic effect of electrostatic and hy-drophobic interactions promoting the polymer adsorptionat solid/liquid or liquid/liquid interface.
Since the flocculation efficiency of polyelectrolyte isdirectly linked to their adsorption behavior it is interest-ing to investigate PMBQ deposition on planar surfaces.Several substrates varying in surface charge density andhydrophobicity (mica, hydrophilic and hydrophobized sil-icon wafers) were chosen to elucidate the difference inthe adsorbed amounts and in polymer conformations underdifferent experimental conditions. Figures 2a–c show theAFM images of PMBQ adsorbed from water solution. Itwas previously reported [22, 23] that PMBQ of lower mo-lecular weight adsorbs from water solution on mica aswormlike chains with a height of 0.75±0.05 nm, indepen-dent on polymer contour length. Increasing of salt concen-tration resulted in conformational changes from worm-liketo patch-like via partially segregated coil structures. How-ever even at high ionic strength coexistence of severalconformations was observed [23]. One can see (Figs. 2aand b) that adsorption of PMBQ of very high molecularweight follows the same trend. Two different conforma-tions – worm-like structures and aggregates could clearlybe distinguished for the polyelectrolyte adsorbed from wa-

106 S. Schwarz et al.
ter solution on hydrophilic substrates, mica and silicon-wafer.
In comparison with hydrophilic silicon wafers, remark-ably higher PMBQ adsorption from a salt-free solutionwas found for the hydrophobized silicon-wafer (Fig. 2c).This was related to an additional attraction by hydrophobicinteractions between surface sites and hydrophobic PMBQmoieties. The size of the adsorbed aggregates increasedwith the salt concentration, but in a more profound man-ner than it was observed for hydrophilic substrate. TheAFM micrographs revealed a very high heterogeneity ofthe adsorbed polymer, with highest values of roughness onhydrophobic substrate.
At high ionic strength significant increase of PMBQadsorbed amount was observed. Figure 2d shows that micasurface was completely covered by PMBQ aggregates withnarrow size distribution, while on silica wafers large andsmall aggregates coexisted, resulting in very high rough-ness of the surface (Fig. 2f).
Zeta potential and SPR measurements are sensitivetools to follow changes in surface properties induced bypolyelectrolyte adsorption in the wet state. The results ob-tained by these two methods for PMBQ layer on glassand glass coated with gold were in good agreement, con-
Fig. 3 Zetapotential-pH-profiles and SPR-results for one monolyaer of PMBQ- on glass and glass covered with gold in dependence of saltconcentration
firming that the higher the ionic strength the higher isthe adsorbed amount and the surface coverage. Figure 3shows that the zeta potentials of the glass surface afterdeposition of PMBQ were higher than those of the bareglass over all the studied pH range from 3 to 10. More-over, the zeta potentials of the PMBQ layer adsorbed from1 M KCl solution was substantially shifted to higher valuesin comparison with layers deposited from water or 0.1 MKCl. This tendency was confirmed by SPR measurements,where remarkable differences of the reflectivities of thePMBQ layers deposited from solutions with different saltconcentrations were detected (Fig. 3). A fully covered sur-face on glass over the whole investigated range of 2 µm×2 µm was observed for only one layer PMBQ absorbed butthe structure was not flat. The adsorption of polyelectrolyteon glass should be comparable to that on mica because ofclose charge densities of these substrates at pH 6, whilethe charge densities of silicon wafer and glass covered withgold are much lower [25].
The adsorption of polyelectrolytes at charged sur-faces is used frequently for both charge neutralizationand charge reversal. Polyelectrolyte multilayers formed bypolycation–polyanion pairs provide additional opportuni-ties to control surface morphology and film thickness [24].

Adsorption of Polyelectrolytes with Hydrophobic Parts 107
To be suitable for the preparation of multilayers poly-electrolytes have to provide reversed surface charge fromlayer to layer [14], sufficient number of binding sites withthe previously adsorbed layer, and certain number of re-maining charges as adsorption centers for the next layerdeposition. Since the glass surface is negatively charged inthe investigated pH range from 3.5 to 9, polycations maybe easily adsorbed from solution.
Figure 4 shows that deposition of one layer of PMBQfrom solution with pH = 6 resulted in drastic changesof surface properties. This was quantitatively character-ized by the shift of surface IEP (isoelectric point) frompH < 3.5 to 6. Since the isoelectric point of the PMBQsolution was higher than 12, it may be assumed that theelectrokinetic behavior was still determined by the com-
Fig. 4 Zetapotential-pH-profiles of PMBQ and PSS monolayersand multilayers of PMBQ/PSS on glass, Adsorption of polyelec-trolytes in water
Fig. 5 Reflectivity in dependence on angle for 15 double layer PMBQ/PSS, Adsorption of polyelectrolytes in water and 0.01 M KCl
bination of glass substrate and polycation rather than bya uniform PMBQ layer. This may be a result of the blob-wise adsorption of PMBQ under the shear flow during themeasurement. The adsorbed PMBQ was used for the de-position of the polyanion PSS. Although polyelectrolyteswith high charge densities like PMBQ are expected toadopt mainly a flat conformation in the adsorbed state,it is possible that a lot of loops and tails were extend-ing to the bulk solution due to the very high molecularweight of PMBQ. The low zeta potential values in therange of 6 to 10 indicated a thick and swollen polyelec-trolyte layer. It should be mentioned that usually surfaceproperties of multilayer films depend only on the natureof the top layer but not on the absolute number of layersdeposited. However, one can see that the zeta potential pro-file of PMBQ/PSS layers with PSS as the outermost layerwere noticeable different from the profile of a plain PSSlayer. This illustrates that the surfaces charges can varystrongly in dependence of the underlying surface. One ofthe possible reasons for this behavior is the extremely highmolecular weight of PMBQ (4.2 Mio g/mol) in compari-son with that of PSS (70 000 g/mol), which is responsiblefor extending loops and tails of PMBQ to the top of thefilm. This resulted in a surface with amphoteric properties.
The hydrophobic character of PMBQ may offer the fol-lowing advantages for surface modification: electrostaticas well as hydrophobic interactions may contribute to theadsorption. The surfaces were rendered hydrophobic (con-tact angle 80 in air), and the layers were very stable.
The thickness of adsorbed polyelectrolyte layers ongold-coated glass slides was determined by SPR in situduring the adsorption process in a measuring cell. This al-lowed measurements in aqueous medium [25]. Figure 5presents angular scans of the reflectivity for PMBQ/PSSlayers in water and in 0.01 M KCl, respectively. Measure-ments were done after adsorption of each double layer.Each curve showed shift of the SPR minimum due to theadsorption of macromolecules. The thicknesses are aver-ages over the beam spot. The multilayer thicknesses in-creased linearly with the number of double layers. The

108 S. Schwarz et al.
averaged thickness for one PMBQ/PSS double layer in wa-ter was approximately 0.6 nm.
The first steps of the adsorption of a multilayer with2 double layer PMBQ/PSS were followed by a time driveat which the angle of incidence was fixed to 55.7 andthe reflectivity was measured over the time. The timedrives show a fast adsorption process for both polyelec-trolytes (Fig. 6). The adsorption process was finished aftera few seconds, and rinsing with 1 M KCl solution did notlead to a polymer desorption. The comparison of the timedrives of the layers made from PMBQ with high molecu-lar weight and PSS with low molecular weight showedthat the adsorbed amount for PMBQ is larger. Becauseat low electrolyte concentration the adsorbed layers arethin and the adsorbed amount hardly depends on molecular
Fig. 6 Time drive for PMBQ/PSS-multilayers, Adsorption of2× (PMBQ/PSS(l)) in 1 M KCl
weight [26], we can assume that the adsorption of PMBQis not only driven by electrostatic attraction but also bynon-electrostatic forces.
Summary
PMBQ represents a special class of polyelectrolytes withhydrophobic functional groups, which tends to form ag-gregates in solution and exhibits a high affinity to hy-drophobic surfaces. The presence of hydrophobic parts inPMBQ enhanced its flocculation performance in differentdispersions. We have shown that formation of hydrophobicaggregates of PMBQ was responsible for the considerablebroadening of the flocculation window that is extremelyimportant and desirable for industrial application.
Study of the mono and multilayer deposition of PMBQand PSS on planar surfaces were used to characterize theadsorption behavior. The surface properties were investi-gated by zeta potential measurements, SPR and AFM. Itwas found that the adsorbed amount of PMBQ dependsstrongly on the type of substrate (charge density and hy-drophobicity) and salt concentration. The conformation ofthe adsorbed molecules varied from worm-like structuresto aggregates of different sizes. The higher surface cov-erage and larger aggregates were detected for PMBQ ad-sorption on hydrophobic surfaces. This was attributed toadditional hydrophobic interactions between surface sitesand polymer hydrophobic functionalities. However, AFMand SEM showed that PMBQ monolayer and PMBQ/PSSmultilayers had a very high surface roughness.
Acknowledgement The authors thank Norbert Stiehl and MarinaOelmann for a lot of experimental work. Financial support fromAiF under the project 12893 BR is gratefully acknowledged.
References1. Dautzenberg H, Jaeger W, Kötz J,
Phillip B, Seidel Ch, Stscherbina D(1994) Polyelectrolytes. Formation,Characterization and Application.Carl Hanser Verlag, München, p 272
2. Koetz J, Kosmella S (2002)Interactions of Polyelectrolytes withClay Surfaces. In: Hubbard A (ed)Encyclopedia of Surface and ColloidScience. Marcel Dekker, Inc, NewYork 1:2620
3. Rojas OJ (2002) Adsorption ofPolyelectrolytes on Mica. In:Hubbard A (ed) Encyclopedia ofSurface and Colloid Science. MarcelDekker, Inc, New York 1:517
4. Cohen Stuart MA, Hoogendam CV,de Keizer A (1997) Kinetics ofpolyelectrolyte adsorption. J Phys,Condens Matter 9:7767
5. Schwarz S, Buchhammer H-M,Lunkwitz K, Jacobasch HJ (1998)Polyelectrolyte adsorption on chargedsurfaces: study by electrokineticmeasurements. Colloids Surf A:Physicochem Eng Aspects140(1–3):377–384
6. Schwarz S, Eichhorn KJ,Wischerhoff E, Laschewsky A (1999)Polyelectrolyte adsorption onto planarsurfaces: a study by streamingpotential and ellipsometrymeasurements. Colloids Surf A:Physicochem Eng Aspects 159:491
7. Schuster Ch, Kötz J, Jaeger W,Kulicke WM (1996) Wechselwirkungzwischen Klärschlammpartikeln undPolyelektrolyten, Chem-Ing-Technik8:980
8. Bauer D, Buchhammer HM, Fuchs A,Jaeger W, Killmann E, Lunkwitz K,Rehmet R, Schwarz S (1999) Stabilityof colloidal silica, sikron andpolystyrene latex influenced by theadsorption of polycations of differentcharge density. Coll Surf A 156:291
9. Petzold G, Schwarz S, Lunkwitz K(2003) Higher efficiency in particleflocculation by using combinations ofoppositely charged polyelectrolytes.Chemical Engineering and Technology26:48
10. Solberg D, Wågberg L (2003)Adsorption and flocculation behaviourof cationic polyacrylamide andcolloidal silica. Colloids Surf A:Physicochem Eng Aspects 219:161
11. Buchhammer HM, Oelmann M,Petzold G (2001) Flockung von

Adsorption of Polyelectrolytes with Hydrophobic Parts 109
Dispersionsfarbstoffen in Abwässernmit Polyelektrolytkomplexen,Melliand Textilberichte 5:391
12. Buch-hammer HM, Petzold G, Lunkwitz K(2000) Nanoparticles based onpolyelectrolyte complexes: Effect ofstructure and net charge on thesorption capacity for solved organicmolecules. Colloid Polym Sci 278:841
13. Petzold G, Nebel A,Buchhammer HM, Lunkwitz K (1998)Preparation and Characterization ofDifferent Polyelectrolyte Complexesand their Application as Flocculants.Colloid Polym Sci 276:125
14. Schwarz S, Dragan S (2004)Nonstoichiometric interpolyelectrolytecomplexes as colloidal dispersionsbased on NaPAMPS and theirinteraction with colloidal silicaparticles. Macromolecular Symposia210(1):185
15. Decher G, Hong JD, Schmitt J (1992)Buildup of ultrathin multilayer filmsby a self-assembly process:III. Consecutively alternatingadsorption of anionic and cationicpolyelectrolytes on charged surfaces.Thin Solid Films 210/211:831
16. Hammond PT (2000) RecentExplorations in ElectrostaticMultilayer Thin Film Assembly.Current Opinion Colloid Interface Sci4:430
17. Bertrand P, Jonas A, Laschewsky A,Legras R (2000) UltrathinPolymer-Coatings by Complexation ofPolyelectrolytes at Interfaces –Suitable Materials, Structure andProperties. Macromol Rapid Commun21:319
18. Zimmermann A, Jaeger W,Reichert KH (1997) Polyelectrolytes –Dispersion polymerization of a watersoluble cationic vinyl monomer.Polymer News 22:390
19. Jaeger W, Paulke B-R, Zimmer-mann A, Lieske A, Wendle U,Bohrisch J (1999) Polymer Prep40:980
20. Schwarz S, Lunkwitz K, Keßler B,Spiegler U, Killmann E, Jaeger W(2000) Adsorption and Stability ofColloidal Silica. Colloids andSurfaces A 163:17
21. Bolto BA, Dixon DR, Gray SR,Chee H, Harbour PJ, Ngoc L,Ware AJ (1996) The use of solubleorganic polymers in waste treatment.Water Sci Technol 34:117
22. Kiriy A, Gorodyska G, Minko S,Jaeger W, Stepanek P, Stamm M(2002) Cascade of Coil-GlobuleConformational Transitions of SingleFlexible Polyelectrolyte Molecules inPoor Solvent. J Am Chem Soc124(45):13454
23. Minko S, Gorodyska G, Kiriy A,Jaeger W, Stamm M (2002)Visualization of single polyelectrolytemolecules. Polymeric MaterialsScience and Engineering 87:185
24. Schönhoff M (2003) Self-AssembledPolyelectrolyte Multilayers. CurrentOpinion in Colloid and InterfaceScience 8:86
25. Schwarz S, Nagel J, Jaeger W (2004)Comparison of PolyelectrolyteMultilayers Built Up withPolydiallyldimethylammoniumChloride and Poly (ethyleneimine)from Salt-Free Solutions by in-situSurface Plasmon ResonanceMeasurements. MacromolecularSymposia 211:201
26. van de Steeg HGM, Cohen Stuart MA,de Keizer A, Bijsterbosch BH (1992)Polyelectrolyte Adsorption: A Subtlebalance of Forces. Langmuir8:2538–2546

Progr Colloid Polym Sci (2006) 132: 110–116DOI 10.1007/2882_023© Springer-Verlag Berlin Heidelberg 2006Published online: 10 March 2006
Stefan SpangeSusan WolfFrank Simon
Adsorption of Poly(vinyl formamide-co-vinylamine) (PVFA-co-PVAm) onto Metal Surfaces
Stefan Spange () · Susan WolfDepartment of Polymer Chemistry,Technical University Chemnitz,Straße der Nationen 62, 09101 Chemnitz,Germanye-mail:[email protected]
Frank SimonLeibniz Institute of Polymer Research,Hohe Straße 6, 01069 Dresden, Germany
Abstract The formation of stablemetal/polymer joints is an enormouschallenge in material sciences. Goodadhesion requires an interphasewhich is able to specifically interactwith the metal substrate as wellas with the second component.Furthermore, the interphase shouldcompensate thermally generatedmechanical tensions between thetwo adhering components. It willbe shown that statistic copoly-mers of poly(vinyl formamide) andpoly(vinyl amine) (PVFA-co-PVAm)are potential candidates for adhesionpromoters. The polyelectrolytecharacter of the copolymers allowsto apply them from its aqueoussolutions. The primary amino groupsexhibit the copolymers as highlyreactive to metal surfaces as wellas to the second joint partner. The
adsorption mechanism of PVFA-co-PVAm onto metal surfaces dependsstrongly on the metal species and itssurface composition. On the otherhand, PVFA-co-PVAm copolymersoffer a wide variety in their numberof functional groups may be involvedin metal/polymer interactions. Here,the adsorption behavior of PVFA-co-PVAm copolymer samples ontodifferent metal species was underinvestigation. Correlations betweenthe copolymer’s composition andthe adsorbed amount allowed to getinformation for tailor-made adhesionpromoter systems.
Keywords Metal surface ·Poly(vinyl amine) copolymers ·Polyelectrolyte adsorption ·Solvatochromic measurements ·X-ray photoelectron spectroscopy
Introduction
Metals play an important role in technical applicationand academic research. One challenge in material sci-ence is to develop a technology forming permanently sta-ble adhesion joints between various technical materialssuch as polymers, glass, ceramics or rubber [1–7]. Es-pecially, the joining of metal with technical polymers isof high importance. Clean metal surfaces such as iron,copper, aluminium and zinc are characterized by highsurface free energies [8, 9]. Hence, a bare metal surfacecannot exist under ambient conditions. Water and oxy-gen form oxidic layers which are usually contaminatedby hydrocarbons lowering the surface free energy. The
presence of oxidic layers and other contaminations oneach metal surface strongly changes the chemical proper-ties of metal surfaces. Hence, a metal surface producedor stored under environments of technical interests cannotbe considered or defined as metal. In this work we willreport on the surface functionalization of metal powdersand metal sheets using the novel water-soluble polymerLupamine® provided by the BASF, Ludwigshafen [10–12]. Lupamines® are statistic poly(vinyl formamide-co-vinyl amine) (PVFA-co-PVAm) copolymers derived frompoly(vinyl formamide) by the hydrolysis reaction shown inScheme 1.
The polymer is applicable as an amine or cationic poly-electrolyte. Depending on the pH value the amino groups
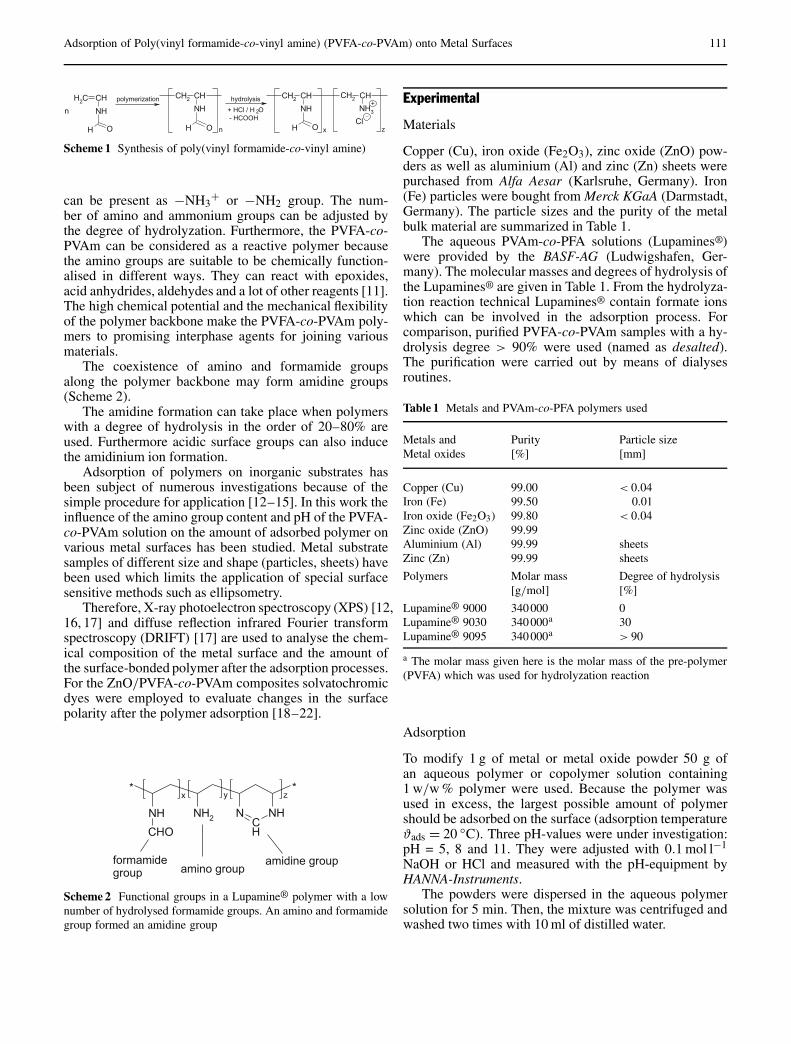
Adsorption of Poly(vinyl formamide-co-vinyl amine) (PVFA-co-PVAm) onto Metal Surfaces 111
Scheme 1 Synthesis of poly(vinyl formamide-co-vinyl amine)
can be present as −NH3+ or −NH2 group. The num-
ber of amino and ammonium groups can be adjusted bythe degree of hydrolyzation. Furthermore, the PVFA-co-PVAm can be considered as a reactive polymer becausethe amino groups are suitable to be chemically function-alised in different ways. They can react with epoxides,acid anhydrides, aldehydes and a lot of other reagents [11].The high chemical potential and the mechanical flexibilityof the polymer backbone make the PVFA-co-PVAm poly-mers to promising interphase agents for joining variousmaterials.
The coexistence of amino and formamide groupsalong the polymer backbone may form amidine groups(Scheme 2).
The amidine formation can take place when polymerswith a degree of hydrolysis in the order of 20–80% areused. Furthermore acidic surface groups can also inducethe amidinium ion formation.
Adsorption of polymers on inorganic substrates hasbeen subject of numerous investigations because of thesimple procedure for application [12–15]. In this work theinfluence of the amino group content and pH of the PVFA-co-PVAm solution on the amount of adsorbed polymer onvarious metal surfaces has been studied. Metal substratesamples of different size and shape (particles, sheets) havebeen used which limits the application of special surfacesensitive methods such as ellipsometry.
Therefore, X-ray photoelectron spectroscopy (XPS) [12,16, 17] and diffuse reflection infrared Fourier transformspectroscopy (DRIFT) [17] are used to analyse the chem-ical composition of the metal surface and the amount ofthe surface-bonded polymer after the adsorption processes.For the ZnO/PVFA-co-PVAm composites solvatochromicdyes were employed to evaluate changes in the surfacepolarity after the polymer adsorption [18–22].
Scheme 2 Functional groups in a Lupamine® polymer with a lownumber of hydrolysed formamide groups. An amino and formamidegroup formed an amidine group
Experimental
Materials
Copper (Cu), iron oxide (Fe2O3), zinc oxide (ZnO) pow-ders as well as aluminium (Al) and zinc (Zn) sheets werepurchased from Alfa Aesar (Karlsruhe, Germany). Iron(Fe) particles were bought from Merck KGaA (Darmstadt,Germany). The particle sizes and the purity of the metalbulk material are summarized in Table 1.
The aqueous PVAm-co-PFA solutions (Lupamines®)were provided by the BASF-AG (Ludwigshafen, Ger-many). The molecular masses and degrees of hydrolysis ofthe Lupamines® are given in Table 1. From the hydrolyza-tion reaction technical Lupamines® contain formate ionswhich can be involved in the adsorption process. Forcomparison, purified PVFA-co-PVAm samples with a hy-drolysis degree > 90% were used (named as desalted).The purification were carried out by means of dialysesroutines.
Table 1 Metals and PVAm-co-PFA polymers used
Metals and Purity Particle sizeMetal oxides [%] [mm]
Copper (Cu) 99.00 < 0.04Iron (Fe) 99.50 0.01Iron oxide (Fe2O3) 99.80 < 0.04Zinc oxide (ZnO) 99.99Aluminium (Al) 99.99 sheetsZinc (Zn) 99.99 sheets
Polymers Molar mass Degree of hydrolysis[g/mol] [%]
Lupamine® 9000 340 000 0Lupamine® 9030 340 000a 30Lupamine® 9095 340 000a > 90
a The molar mass given here is the molar mass of the pre-polymer(PVFA) which was used for hydrolyzation reaction
Adsorption
To modify 1 g of metal or metal oxide powder 50 g ofan aqueous polymer or copolymer solution containing1 w/w % polymer were used. Because the polymer wasused in excess, the largest possible amount of polymershould be adsorbed on the surface (adsorption temperatureϑads = 20 C). Three pH-values were under investigation:pH = 5, 8 and 11. They were adjusted with 0.1 mol l−1
NaOH or HCl and measured with the pH-equipment byHANNA-Instruments.
The powders were dispersed in the aqueous polymersolution for 5 min. Then, the mixture was centrifuged andwashed two times with 10 ml of distilled water.

112 S. Spange et al.
Scheme 3 Preparation of PVAm-co-PFA-functionalised metalsheets
Metal sheets were degreased with ethanol in an ultra-sonic bath, washed with distilled water, and dipped for5 min in the 1 w/w % polymer solution. To remove thepolymer excess the adsorbates were rinsed for 2 sec withdistilled water. The adsorption procedure for sheets is sum-marized in Scheme 3.
Characterization. All measurements were carried outwith dried specimens (particles or sheets). It is establishedthat the thickness of the water-loaded polymer layer ishigher than in the dried state, because dried polymer coilscollapse [21]. The amount of polymer, however, is notchanged after the drying process. Thus an average equilib-rium state is always measured.
XPS studies were carried out by means of an AXISULTRA photoelectron spectrometer (KRATOS ANALYTI-CAL, Manchester, England). The spectrometer was equip-ped with a monochromatic Al Kα (h · ν = 1486.6 eV) X-ray source of 300 W at 15 kV. The kinetic energy of thephotoelectrons was determined with an hemispheric anal-yser set to a pass energy of 160 eV for the wide scanspectra and 20 eV for the high-resolution spectra. Dur-ing all measurements electrostatic charging of the samplewas over-compensated by means of a low-energy electronsource working in combination with a magnetic immer-sion lens. Later, all recorded peaks were shifted by thesame amount which was necessary to set the C 1s peak to285.00 eV for saturated hydrocarbons. Quantitative elem-ental compositions were determined from peak areas usingexperimentally determined sensitivity factors and the spec-trometer transmission function. Spectrum background wassubtracted according to Shirley. The high-resolution spec-tra were deconvoluted by means of a computer routine.Free parameters of component peaks were their bind-ing energy, height, full width at half maximum and theGaussian-Lorentzian ratio.
The DRIFT spectra were recorded by a FTS 165 spec-trometer of BIO-RAD Laboratories (Philadelphia, USA)using the praying-mantis-diffuse-reflection attachment.Unmodified metal or metal oxide particles were used asreference. The spectra were measured in Kubelka-Munkunits collecting 32 scans. For data post processing thespectra were transformed in ASCII-files and processed inOrigin 5.0. Smoothing was not done.
UV/Vis-measurements were carried out using theMCS 400 spectrometer of Carl Zeiss Jena GmbH (Jena,
Germany) with a special reflection attachment for par-ticles.
Results and Discussion
As mentioned above, all metal surfaces used in these stud-ies contain an oxidic layer and non-specifically adsorbedsurface contaminations. Even the copper surface containsan oxidic layer in the order of 1–2 nm thickness. Thedifferences in the adsorption capacities of a metal andits corresponding metal oxide towards PVFA-co-PVAmwere compared by means of Zn and ZnO as well as Feand Fe2O3. XPS was employed in order to determine theamount of the polyelectrolyte adsorbed onto the metal ormetal oxide surface. XPS is a well established surface sen-sitive spectroscopic method with an information depth nothigher than 10 nm.
The direct determination of the polymer content ad-sorbed onto the solid surface avoids the systematic meas-uring error arising from particle-initiated PVFA-co-PVAmflocculation which can be important by the determinationof the PVFA-co-PVAm amount in the supernatant solu-tion after the adsorption [23]. Figure 1 shows a wide-scanXPS spectrum of PVFA-co-PVAm (degree of hydrolysis> 90%, pH = 8) adsorbed onto copper.
The adsorbed polyelectrolyte can easily identified bythe N 1s peak appearing from the amino and amide groupsof the polymer. The substrate is distinguished by the cop-per photoelectron (e.g. Cu 2p3/2, Cu 2p1/2, Cu 3p, Cu
Fig. 1 XPS wide-scan spectrum a of copper particles coatedwith PVFA-co-PVAm (molar mass of the PVFA pre-polymer= 340 000 g mol−1, degree of hydrolysis > 90%, adsorption atpH = 8). The insets show the C 1s (b), N 1s (c) and Cu 2p(d) element spectra

Adsorption of Poly(vinyl formamide-co-vinyl amine) (PVFA-co-PVAm) onto Metal Surfaces 113
3s) and Auger peak series. For the determination of theadsorbed amount of PVFA-co-PVAm carbon and oxy-gen cannot be considered as significant elements becausesurface contaminations can contribute to the carbon C1s peak and the metal oxidic layer could have a non-stoichiometric composition or traces of water may be in-corporated.
The C 1s spectrum in Fig. 1 shows four componentpeaks indicated by italic letter. The component peak Aappears from saturated hydrocarbons. Component peakB shows C−N bonds of the amino (C−NH2) and for-mamide (C−NH−CHO) groups. Component peak Cwith an area of ca. 5% of the whole C 1s peak ap-pears from the second carbon of the formamide groups(C−NH−CHO). It is assumed that the componentpeak D is the result of urea formation (N−C(O)−N)by the Brønsted-basic amino groups and atmosphericcarbon dioxide [23]. The nitrogen spectrum in Fig. 1cwas deconvoluted into two component peaks (E andF) where the main component F represents the aminogroups (C−NH2) and the small component peak Eshows the nitrogen of the residual formamide groups(C−NH−CHO). The two Cu 2p peaks (Cu 2p3/2 and Cu2p1/2, Fig. 1d) show the metallic copper species (indicatedby G and G′) and copper bonded to oxygen (indicated byH and H ′). In addition plasmon resonance peaks of themetallic species were observed (*).
As explained above, only the [N]:[Mt] ratio is of impor-tance to determine the amount of adsorbed polymer (where[N] and [Mt] mean the quantity of nitrogen and the metal,respectively).
For copper, the adsorption behaviour of PVFA-co-PVAm seems rather clear. With increasing the amino con-tent of the polymer the amount of adsorbed polymer in-creases (Table 2). This result is not surprising, because thestrong tendency of bonding of copper ions to amines iswell known even for copper surfaces [1, 3, 7].
The influence of pH on the amount of adsorbed poly-mer was studied using a molar mass of 10 000 g mol−1. pHhas been varied from 5, 8, to 11. The increase of pH leadsto a significant increase of the measured [N]:[Cu] ratioas seen from Table 2. This result is reasonable, becausethe content of free amino groups increases with pH dueto −NH3
+ groups become deprotonated. This result also
Table 2 The influence of pH on the [N]:[Cu] ratio at adsorption ofPVAm-co-PFA (molar mass > 10 000 g/mol, degree of hydrolysis> 90%) onto copper surface
pH [N]:[Cu] ratio
5 0.318 0.34
11 0.99
Table 3 The influence of molar masses of PVAm-co-PFA on the ad-sorption of PVAm-co-PFA (degree of hydrolysis > 90%, pH 8) ontocopper surface
Molar masses [g/mol] [N]:[Cu] ratio
> 10 000 0.3445 000 0.82
340 000 2.92
shows that binding sites of the copper surface to free aminogroups play the major role in the adsorption process. Itis well known that copper atoms form strong coordinativebonds to amino groups [1, 3, 7].
To investigate the influence of molecular weight on ad-sorption, a pH of 8 has been chosen. The results are shownin Table 3. The effect of molecular weight on the amountof adsorbed polymer is striking. The [N]:[Cu] ratio in-creases eight fold from 10 000 to 340 000 g mol−1 usingthe same amount polymer. This result is in line with thatobserved for the influence of pH and supports the inter-pretation that coordinative bonds between copper atomson the surface and free amino groups of the polymer areresponsible for the strong adsorption. The more aminogroups are present along the polymer backbone the moreanchor points are available to fix the polymer at the coppersurface [12, 15].
Compared to copper Zn sheets show a contrary ad-sorption behaviour. With increasing the amount of aminogroups, the polymer content on the Zn surface decreases(Table 4).
The adsorption experiments were repeated with ZnOparticles as substrate material. For these experimentsPVFA-co-PVAm samples with a wide range of hydrolyza-tion were employed. The results are summarized inTable 5.
According to the values in Table 5 there is not a clearrelationship between the amount of adsorbed polymerand the number of amino groups (degree of hydrolysis).It is assumed that the adsorption behaviour on ZnO iscontrolled by a number of structural parameters. In thecase of low and moderate degrees of hydrolysis the realnumber of free amino groups does not correspond with
Table 4 Adsorption of PVAm-co-PFA onto oxidic metal surfaces.The degree of hydrolysis corresponds with the content of aminogroups
Degree of hydrolysis [N]:[Zn] ratio [N]:[Cu] ratio
> 90% 1.49 3.2530% 2.32 0.86
0% 8.16 0.50

114 S. Spange et al.
Table 5 Adsorption of PVAm-co-PFA onto ZnO particle surfaces
Degree of hydrolysis [N]:[Zn] ratio
< 90%, desalted 0.87
< 90% 0.6650% 0.6030% 0.6210% 1.100% 0.04
the degree of hydrolyzation of PVFA because amidiniumions can be formed by reaction of amino with formamidegroups (Scheme 2). Formate ions compete with the dif-ferent functional groups of the PVFA-co-PVAm moleculefor free adsorption sites on the oxidic metal surface.Hence, the desalted PVFA-co-PVAm samples adsorb moreeffectively. Similar results were found for other oxidicmaterials [11, 16].
Figure 2 shows the DRIFT spectra of ZnO/PVFA-co-PVAm composites. According to Table 5, the degree ofhydrolyzation of the polymer was changed.
Advantageously, the DRIFT spectra significantly showthe following vibration bands resulting from the differentfunctional groups: The overtone amide-II band was found
Fig. 2 DRIFT spectra of PVFA-co-PVAm modified ZnO particleswhere the degree of the PVFA-co-PVAm hydrolysis was varied:a degree of hydrolysis = 0%; b degree of hydrolysis = 10%;c degree of hydrolysis = 30%; d degree of hydrolysis = 50%; ande degree of hydrolysis > 90%, desalted. The molar mass of the non-hydrolysed PVFA polymer was 340 000 g mol−1, during the adsorp-tion the pH was pH = 8. The spectra show the overtone amide-IIband at ν = 3053 cm−1 (A), the amide-I band at ν = 1675 cm−1
(B), the NH deformation vibration at ν = 1590 cm−1 (C), theamide-II band at ν = 1540 cm−1 (D). (ν = wave number, a.u. =arbitrary units according to Kubelka and Munk)
at ν = 3053 cm−1 (A), the amide-I band at ν = 1675 cm−1
(B), the NH-deformation vibration at ν = 1590 cm−1 (C)and the amide-II band at ν = 1540 cm−1 (D). Unfortu-nately, the amidinium ion is difficult to detect, because itsvibration band is expected at about 1600 cm−1 and thisregion is covered by the strong amid-I band and the NH-deformation vibration.
The lowest intensities of the amide-I (B) and amide-II(D) bands of non-hydrolysed PVFA confirm the results ofthe XPS investigations. It supplies that the smallest amountof adsorbed polymer on the ZnO surface is observed fornon-hydrolysed PVFA.
The strong adsorption of PVFA-co-PVAm onto ZnOcan be also evidenced by measuring the surface polarityof ZnO/PVFA-co-PVAm composites using co-adsorbedsolvatochromic dyes [18]. According to earlier studies ofsilica/PVFA-co-PVAm composites [21, 22], we applieda tert-butyl substituted Reichardt’s dye [19–21] as sur-face polarity indicator. Employing UV/Vis spectroscopythe absorption maxima λmax of the adsorbed Reichardt’sdye was measured (Fig. 4). Its position is strongly corre-lated with the surface polarity that can be expressed by theET(30) polarity parameters (Eq. 1) [21].
ET(30)[kcal ·mol−1] =30338.5 [nm ·kcal ·mol−1]λmax
(1)
−1.9185 [kcal ·mol−1]Figure 3 shows a series of UV/Vis spectra of tert-butylsubstituted Reichardt’s dye loaded ZnO particles coatedwith PVFA-co-PVAm of different degrees of hydrolyses.
Table 6 shows with increasing the amino content theET(30) polarity parameter of the ZnO/PVFA-co-PVAm
Fig. 3 UV/Vis spectra of the tert.-butyl-substituted Reichardt’s dye(shown inset) adsorbed onto PVFA-co-PVAm modified ZnO par-ticles: ZnO/Lupamine® 9000 (grey solid line), ZnO/Lupamine®
9030 (black dotted line) and ZnO/Lupamine® 9095 (black solidline)

Adsorption of Poly(vinyl formamide-co-vinyl amine) (PVFA-co-PVAm) onto Metal Surfaces 115
Fig. 4 [N]:[Mt]-ratio of modified Cu (•), Fe (), Fe2O3 () par-ticles and Zn sheets () as function of degree of hydrolysis of theadsorbed PVFA-co-PVAm
Table 6 Measured UV/Vis absorption maxima λmax of Reichardt’sdye adsorbed onto bare and PVFA-co-PVAm modified ZnO par-ticles and the corresponding ET(30) values [22] calculated accord-ing to Eq. 1
Sample λmax ET(30)
[nm] [kcal ·mol−1]
bare ZnO 488.9 60.1ZnO/Lupamine®9000 478.2 61.5ZnO/Lupamine®9030 513.6 57.2ZnO/Lupamine®9095 571.6 51.0
composites decreases. These results indicate that the sur-face acidity of ZnO is compensated by the adsorbed poly-mer layer, because the ET(30) parameter reflects the sur-face acidity as well as dipolarity/polarizability of the en-vironment [19].
Compared to the oxidic surfaces of copper and zinc, theadsorption process of PVFA-co-PVAm onto Fe and Fe2O3powders was weakly dependent on the composition of thepolymer. The results are given in Table 7.
Summarizing all results, Fig. 4 shows the content ofadsorbed polymer expressed by the [N]/[Mt] ratio as func-tion of degree of hydrolyses of PVFA-co-PVAm.
Table 7 Adsorption of PVAm-co-PVFA onto Fe and Fe2O3 particlesurfaces
Degree of hydrolysis [N]:[Fe] ratio [N]:[Fe] ratiofor Fe powders for Fe2O3 powders
> 90% 1.25 0.2130% 0.95 0.19
0% 0.95 0.88
Conclusion and Outlook
The results of these studies showed that PVFA-co-PVAmadsorb well onto various surface oxidized metals and theircorresponding oxides. The adsorbed polymer amount issignificantly higher for metal powders while oxides showa lower adsorption capacity. The oxide layer may act asthe mediating environment, but it decreases the high sur-face energy of the bare metal surface by lowering the Vander Waals interaction between the solid surface and the ad-sorbing polymer. This phenomenon corresponds with thewell known difference of the Hamaker constants, whichare usually higher for metals compared with the corres-ponding metal oxides [24–26]. Furthermore, the formationof an oxide layer prevents coordinative interactions be-tween metal atoms and the freely accessible amino groups.The origin of the driving force of the adsorption of PVFA-co-PVAm from its aqueous solution onto various metalsand metal oxides and the role of water requires still furtherstudies. For the adsorption of highly hydrolysed PVFA-co-PVAm onto silica (amorphous SiO2) we discussed anadsorption process driven by the adsorption enthalpy [23].In the case of transition metals or its metal oxides ad-ditional coordinative bonds can likely contribute to theenthalpic term. Functional surface groups of metal oxides(e.g. Mt−OH) can be involved in the adsorption mechan-ism by the formation of specific acid-base interactions tothe Brønsted-basic PVFA-co-PVAm polymer, but can alsobe an anchor for hydrogen bonded water layers which mustbe removed during the adsorption. The release of surfaceadsorbed water would contribute to the entropy term of theadsorption free energy.
Acknowledgement Financial support by the Deutsche Forschungs-gemeinschaft and the Fond der Chemischen Industrie is gratefullyacknowledged. We thank Dr. Schornick and Dr. Hähnle from theBASF AG, Ludwigshafen for providing the poly(vinyl formamide-co-vinyl amine)s and their helpful scientific correspondence.
References1. Jensen WB (1991) The Lewis
acid-base concepts: Recent results andprospects for the future. In: Mittal KL,Anderson HR (eds)
Acid-Base-Interactions. VSP Utrecht,p 3–23
2. Fowkes FM, Sun CY, Joslin ST (1980)Enhancing polymer adhesion to iron
surfaces by acid/base interaction.Corrosion Control by OrganicCoatings Symposium Lehigh Univ,Edited Proc NACE 1981, 1

116 S. Spange et al.
3. Barthes-Labrousse MG, Joud JC(2000) Acid-Base Characterization ofmetallic materials and the use ofmodel molecules in the study ofadhesion mechanism. Acid-BaseInteractions: Relevance to AdhesionScience and Technology, Mittal KL(ed) VSP Utrecht, 453
4. Cain SR (1991) Quantum-mechanicalapproach to understanding acid-baseinteractions at metal-polymerinterfaces Jensen. In: Mittal KL,Anderson HR (eds)Acid-Base-Interactions. VSP Utrecht,p 47
5. Berger EJ (1991) A method ofdetermining the surface acidity ofpolymeric and metallic materials andits application to lap shear adhesion.In: Mittal KL, Anderson HR (eds)Acid-Base-Interactions. VSP Utrecht,p 207
6. Huang YC, Fowkes FM, Loyd TB(1991) Acidic and basic nature offerric oxide surfaces. Adsorption,adhesion, zeta potential anddispersibility in magnetic inks for harddisks. In: Mittal KL, Anderson HR(eds) Acid-Base-Interactions. VSPUtrecht, p 363
7. Preuss M, Schmidt WG, Bechstedt F(2005) Physical Review Letters94:236102
8. Spencer MJS, Hung A, Snook IK,Yarovsky I (2002) Surface Science515:464
9. Spencer MJS, Hung A, Snook IK,Yarovsky I (2003) Surface Reviewsand Letters 10:169
10. Chen CW, Tano D, Akashi M (1999)Coll Polym Sci 277:488
11. Pinschmidt RK, Renz WL,Carroll WE, Yacoub K, Drescher J,Nordquist AF, Chen N (1997) JMacromolar Science 10:1885
12. Spange S, Meyer T, Voigt I,Eschner M, Estel K, Pleul D, Simon F(2003) Adv Polym Sci 165:43
13. Fleer GJ, Lyklema J (1983) In:Parfitt GD, Rochester CH (eds)Adsorption from Solution at theSolid/Liquid Interface. AcademicPress, London
14. Amjad Z (1998) Water solublePolymers: Solution Properties andApplication, Plenum Press 1998, ISBN0-306-45931-0
15. Raymond SF, Paul L (1999) ColloidPolymer Interactions: FromFundamentals to Practice, Wiley ISBN0-471-24316-7
16. Fleer GJ, Stuart MAC,Scheutjens JMHM, Cosgrove T,Vincent B (1998) Polymers atInterfaces. Chapman & Hall, London
17. Wolf S, Simon F, Spange S (2005) tobe publish
18. Horner MR, Boerio FJ, Clearfield HM(1992) An XPS investigation of theadsorption of aminosilanes onto metalsubstrates. In: Mittal KL (ed) Silanesand Other Coupling Agents. VSPUtrecht, p 241
19. Macquarrie DJ, Tavener SJ, Gray GW,Heath PA, Rafelt JS, Saulzet SI,Hardy JJE, Clark JH, Sutra P,Brunel D, di Renzo F, Fajula F (1999)New J Chem 23:725
20. Reichardt C, Harbusch-Görnert E(1983) Justus Liebigs Ann Chem 721
21. Reichardt C (1994) Chem Rev 94:231922. Voigt I, Simon F, Estel K, Spange S
(2001) Langmuir 17:30823. Spange S, Reuter A, Lubda D (1999)
Langmuir 15:210324. Bucatariu F, Simon F, Spange S,
Dragan ES (2005) Reactive nano-structured thin films on silica particles.Construction and characterization,Proceedings of the 21st AnnualMeeting of the Polymer ProcessingSociety, Leipzig, in print
25. Mahany J, Ninham BW (1976)Dispersion Forces. Academic Press,New York
26. Israelachvilli JN (1974) Quart RevBiophys 6:34
27. Bergström L (1997) Adv Coll InterfSci 70:125

Progr Colloid Polym Sci (2006) 132: 117–123DOI 10.1007/2882_022© Springer-Verlag Berlin Heidelberg 2006Published online: 10 March 2006
N. ElsnerF. DubreuilR. WeinkamerM. WasicekF.D. FischerA. Fery
Mechanical Properties of FreestandingPolyelectrolyte Capsules: a QuantitativeApproach Based on Shell Theory
N. Elsner · F. Dubreuil · A. Fery ()Abteilung Grenzflächen, Max PlanckInstitut für Kolloid- undGrenzflächenforschung, Am Mühlenberg,14424 Potsdam, Germanye-mail: [email protected]
R. WeinkamerAbteilung Biomaterialien, Max PlanckInstitut für Kolloid- undGrenzflächenforschung, Am Mühlenberg,14424 Potsdam, Germany
M. Wasicek · F.D. FischerInstitute of Mechanics, MontanuniversitätLeoben, and Erich Schmid Institute ofMaterial Science, Austrian Academy ofSciences, and Materials Center Leoben,GmbH, Austria
Abstract In this paper we report onAFM force spectroscopy measure-ments on hollow polymeric spheresof colloidal dimensions made frompolyelectrolyte multilayers of polyal-lylamine and polystyrenesulfonatein water. We find that the shellsshow a linear force-deformationcharacteristic for deformations of theorder of the shell wall thickness. Thisexperimental outcome is discussedin terms of analytical results of con-tinuum mechanics, in particular thescaling behaviour of the shell springconstant with wall thickness, shellradius and speed of the deformationis analysed. The experimental resultsagree well with the predictions ofReissner for thin shells and allow
us to rescale our stiffness data suchthat a master curve of shell stiffnessis obtained. The result of Reissneris strictly valid only for point likeloading situations, while in ourexperiments a more extended platelike load is applied. Experimentallywe find indeed little influence of theprobe geometry on the shell springconstant. This result agrees wellwith finite element (FE) calculationsthat show that the Reissner result isa good approximation also for nonpoint like loading situations, as longas small deformations are considered.
Keywords Polyelectrolytes ·Multilayers · Mechanical properties ·Deformation · Shells · Capsules
Introduction
Polymeric hollow spheres of colloidal dimensions are ofconsiderable interest for various applications like encapsu-lation of agents in medicine for targeting or for sustainedrelease (drug delivery), cosmetics or food design to men-tion a few examples only. At the same time, examplesof hollow capsules of colloidal dimensions are numer-ous in biology, like the shells of single cell organismsor virus capsids [1]. Thus, artificial polymeric shells canalso serve as (biomimetic) model systems for these morecomplex biological counterparts. The mechanical proper-ties of shells play an important role in many processesand an understanding, therefore, is indispensable for theirapplication. The mechanical properties govern the defor-mation behaviour under external loads or pressures and,thus, not only the stability of shells, but also the extent
of deformations that are induced by these external stim-uli and whether the deformations are reversible (elastic)or irreversible (plastic). The adhesion behaviour is alsoclosely linked to the deformation properties, since the sizeof adhesion areas that are developed as a result of adhe-sive interactions is given by the balance between energygain due to the work of adhesion and energy cost due to thedeformations involved in the process.
The development of novel methods that allow probingthe mechanics of colloidal scale shells is a prerequisite forgaining understanding of the physico-chemical mechan-isms that govern shell mechanics. This however requiresalso an in depth treatment of the shell deformation prob-lem under the specific circumstances of the experiment.Both aims are subject of this paper for the particular caseof polyelectrolyte multilayer shells investigated with thecolloidal probe AFM technique. While the experimental

118 N. Elsner et al.
results are specific for this system, the mechanical resultsconcerning the deformation process and the interpretationof the AFM force distance data are generally applicable forother shell systems like the examples mentioned above.
Within artificial polymeric capsules, polyelectrolytemultilayer capsules (PMCs) like we use them in this studyoffer several advantages as model systems, since theycan be produced with well defined wall thickness, ra-dius and low polydispersity. The shell production processis based on the layer-by-layer electrostatic self assem-bly (lbl-esa), which was first introduced by Decher andco-workers as a surface coating technique [2, 3]. Polyelec-trolyte multilayers can be built up on charged surfaces byalternating adsorption of positively and negatively chargedpolyelectrolytes from aqueous solution and for many poly-electrolyte combinations (in particular the one used here,polyallylamine (PAH)/polystyrenesulfonate (PSS)), thetotal thickness of the surface coating is linear in thenumber of deposition cycles, with a thickness increaseper polyelectrolyte layer pair on the order of nanome-tres. Furthermore, since the deposition process is basedon non-covalent interactions, restrictions on the type ofsubstrate and polyelectrolyte are few. Hollow capsulescan be produced by a two step process [4]: First col-loidal particles are coated using lbl-esa, than the particlesare dissolved under conditions that do not destroy themultilayer. During the core dissolution process, the corematerial has to permeate through the membrane, whichlimits the choice of the core particle. So far, the processhas been demonstrated for a number of colloidal particles,like melamin-formaldehyde [4], non-crosslinked polystyr-ene latices, silica or polylactic acid particles [5]. In thesecases, the composition and thickness of the shell wallscan be controlled with a precision that is comparable tothe case of solid supported lbl-esa films. Additionally, thecapsules have the same shape and monodispersity as thetemplate particles, which makes them one of the best de-fined capsule systems with respect to these parameters thatis currently available. A more complete overview on poly-electrolyte multilayers can be found in [6].
The mechanical properties of polyelectrolyte multi-layer capsules have been subject of several studies usingdifferent methods. Bäumler and co-workers [7] have usedthe micropipette technique and found that PMCs are notconserving their volume if pressure differences are appliedbetween inside and outside of the shell. This is expected,since the shells can only be formed in first place be-cause the membrane is permeable to low molecular weightspecies, the core dissolution products. They found no de-formation up to a critical pressure followed by an irre-versible collapse, showing that shells deform not elasti-cally but plastically for large deformations. First quantita-tive estimates of the Young’s modulus of the shell mate-rial were obtained by Gao and coworkers, using osmoticpressure differences between inside and outside of theshell [8, 9]. These authors monitored the onset of the buck-
ling instability as a function of shell radius and thicknessand found values around 1.5 GPa for the Young’s modulusof PAH/PSS multilayers. They concluded that the multi-layer material is in a glassy state. In contrast, Vinogradovaand coworkers found much lower elastic constants for thesame system using AFM force spectroscopy (1–150 MPa)and concluded that the wall material is in an elastomericstate [10] (see [11] for a complete overview). But someof the assumptions made in this work (volume conserva-tion during deformation, elasticity at large deformations)are not in line with previous findings of others, whichcan explain the underestimation as compared to Gao [12].We have independently applied colloidal probe AFM forcespectroscopy, but limited our analysis to deformations onthe order of the shell wall thickness only, to avoid prob-lems occurring at larger deformations and, additionally,no assumptions concerning the permeability are neces-sary [12–14]. Our results of the Young’s modulus are be-tween the values found by Vinogradova and those of Gaoand coworkers and are on the same order as those foundin recent experiments based on capsule swelling [15] of200–400 MPa.
In the present paper we extend our analysis of the ex-perimental results obtained from this small deformationregime and we show that the result found by Reissner forthe deformation of shallow spherical caps represents an ex-cellent analytical approximation for the interpretation ofthe measurements. This result is varified by finite elem-ent modelling (FEM) and by experimental variation of theforce probe geometry and radius as well as wall thicknessof the studied capsules. This result is also applicable forother capsule deformation measurements, since it is inde-pendent of the specific Young’s modulus. Furthermore, wereport on speed dependent measurements that indicate theglassy nature of PAH/PSS multilayers.
Experimental
Materials
Polyallylamine (Mw = 70 000 g/mol) and polystyrene sul-fonate (Mw = 70 000 g/mol) were obtained from Aldrich.PAH was used as received, while PSS was purified fromlow molecular weight impurities by dialysis (Polyether-sulfone membranes, MW cut off 10 000 g/mol, Millipore)against ultra pure water and freeze dried. All water usedfor preparing solutions or for dialysis was purified bya Purelab Plus UV/UF, Elga LabWater system and hada resistivity smaller than 0.055 µS/cm and a total organiccontent between 2 and 12 ppb (parts per billion).
Part of the PAH was fluorescently labelled using Rho-damin-B-isothiocyanate (RBITC, Fluka) and the proced-ure described in Richter et al. [16]. The labelled PAH(R-PAH) was dialyzed subsequently against ultra purewater (regenerated cellulose membrane, MW cut off =

Mechanical Properties of Freestanding Polyelectrolyte Capsules: a Quantitative Approach Based on Shell Theory 119
15 000 g/mol, Spectrum Laboratories). The labelling de-gree was not larger than 1% to avoid dye induced changesof the interactions. Polyethyleneimine (branched, Mw =25 000 g/mol, Aldrich), which was used in this work tocoat the glass substrates to promote adhesion of the micro-capsules, was obtained from Aldrich.
Capsule Preparation and Characterization
All capsules were produced by lbl-esa coating of non-crosslinked polystyrene latex particles (MicroparticlesGmbH, particle radii 7.8 and 9.6 microns). Adsorption wascarried out from aqueous solutions containing 0.5 molesNaCl (Merck) per litre added and a polyelectrolyte con-centration of 10 mM based on the monomer unit. Ad-sorption was allowed to take place for 20 minutes andwas followed by three washing steps to remove non ad-sorbed polyelectrolyte in which the particle solutions werecentrifuged and the supernatant was replaced with ultra-pure water. Dissolution was carried out in tetrahydrofurane(THF, stabilized with 2,6-Di-tert.-butyl-4-methylphenole,p.a., Aldrich). Again several washing steps with THF werecarried out before the capsules were re-transferred to wa-ter. In order to achieve labelling of the capsules, one of thePAH layers was formed from a 1 : 1 mixture of PAH andR-PAH. Capsules of different wall thickness were formedas described in the results part, but in each case, the termi-nating layer was PSS.
Shape and uniformity of the capsules as well as theirdiameter were controlled after dissolution and during thefollowing force spectroscopy measurements with fluores-cence microscopy. Capsules that showed indentations ordeformations were not used in the experiments. The cap-sule wall thickness was determined for each batch by AFMimaging of dried capsules on using a Nanoscope IIIAAFM (Veeco Instruments) in Tapping mode® using Sili-con cantilevers (Nanosensors NCH-W, kc = 31–50 N/m,fc = 302–350 kHz, NanoWorld Services). This methodwas also used to ensure that the core dissolution was com-plete and no residuals were found inside the capsules. Thedry thickness of the capsules was found to be between4.5–5 nm per layer pair for the different batches, which isin line with findings of others using the same preparationconditions [17].
Force spectroscopy measurements were carried out ona MFP 1D and a MFP 3D setup (Atomic Force, Germany)mounted onto an inverted optical microscope (OlympusIC71). We used tipless cantilevers (contact silicon can-tilevers CSC12/tipless/50, fc = 7 bis 95 kHz, kc = 0.01to 0.45 N/m, Mikromash) onto which glass-beads (diam-eter 30 to 50 µm, Polyscience Inc, USA) were glued usingepoxy glue (UHU plus 300) with the help of a microma-nipulator. All spring constants were determined by boththe method of Sader [18] before gluing and the thermalnoise method directly during the experiment [19] and can-
tilevers showing differences greater than 10 percent werediscarded.
For the capsule measurements, glass substrates coatedwith polyethyleneimine were used on which the PSS-terminated capsules showed adhesion. The capsule forcedeformation characteristics of individual capsules wereobtained by placing a capsule under the colloidal probeand pressing onto it. Special care was taken to press ontothe pole of the capsule as described in more detail in [13].Reference curves on hard substrates were obtained beforeand after the experiments to determine the inverse opticallever sensitivity (InvoLS) and to derive the absolute defor-mation of the capsules. In rare cases when the InvoLS wasfound to change during the measurement, the measureddata was discarded.
Results and Discussion
Figure 1 shows a representative force deformation char-acteristic as obtained from the measurements of a capsulemade from PAH/PSS in water. The dried thickness of thecapsule was 25 nm and the radius 7.9 microns. For defor-mations on the order of 1–3 times the shell wall thick-ness, a linear force deformation characteristic is found.For higher deformations discontinuities in the force defor-mation characteristic are observed, which are separatingquasi-linear sections. The position of these discontinuitiesas well as their shapes scattered a lot between differentshells and the shells showed plasticity in this deformationregime. We avoided this regime in the measurements andobtained the results exclusively from a detailed analysis ofthe linear regime. Based on classical thin shell theory [20],one would expect a linear force deformation characteris-tic for deformations up to a few times the wall thickness(fit indicated as dotted line). The onset of buckling shouldlead to a deviation from the linear dependency, like dis-
Fig. 1 Solid line: experimental force deformation characteristic ofa PAH/PSS capsule of 25 nm dry thickness and 7.9 µm radius inwater. Dotted line: Reissner’s result for thin, shallow shells (seeEq. 1). Dashed line: square root dependency between deformationand force as expected from Pogorelov’s work (see Eq. 2)
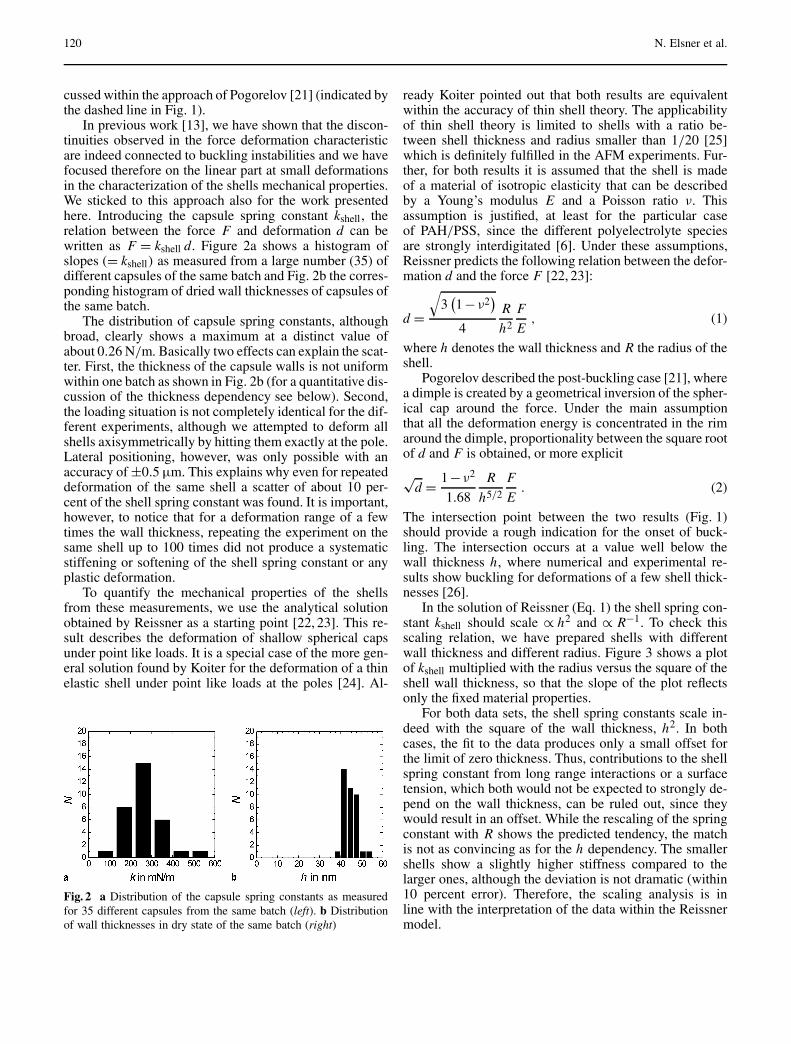
120 N. Elsner et al.
cussed within the approach of Pogorelov [21] (indicated bythe dashed line in Fig. 1).
In previous work [13], we have shown that the discon-tinuities observed in the force deformation characteristicare indeed connected to buckling instabilities and we havefocused therefore on the linear part at small deformationsin the characterization of the shells mechanical properties.We sticked to this approach also for the work presentedhere. Introducing the capsule spring constant kshell , therelation between the force F and deformation d can bewritten as F = kshell d. Figure 2a shows a histogram ofslopes (= kshell) as measured from a large number (35) ofdifferent capsules of the same batch and Fig. 2b the corres-ponding histogram of dried wall thicknesses of capsules ofthe same batch.
The distribution of capsule spring constants, althoughbroad, clearly shows a maximum at a distinct value ofabout 0.26 N/m. Basically two effects can explain the scat-ter. First, the thickness of the capsule walls is not uniformwithin one batch as shown in Fig. 2b (for a quantitative dis-cussion of the thickness dependency see below). Second,the loading situation is not completely identical for the dif-ferent experiments, although we attempted to deform allshells axisymmetrically by hitting them exactly at the pole.Lateral positioning, however, was only possible with anaccuracy of ±0.5 µm. This explains why even for repeateddeformation of the same shell a scatter of about 10 per-cent of the shell spring constant was found. It is important,however, to notice that for a deformation range of a fewtimes the wall thickness, repeating the experiment on thesame shell up to 100 times did not produce a systematicstiffening or softening of the shell spring constant or anyplastic deformation.
To quantify the mechanical properties of the shellsfrom these measurements, we use the analytical solutionobtained by Reissner as a starting point [22, 23]. This re-sult describes the deformation of shallow spherical capsunder point like loads. It is a special case of the more gen-eral solution found by Koiter for the deformation of a thinelastic shell under point like loads at the poles [24]. Al-
Fig. 2 a Distribution of the capsule spring constants as measuredfor 35 different capsules from the same batch (left). b Distributionof wall thicknesses in dry state of the same batch (right)
ready Koiter pointed out that both results are equivalentwithin the accuracy of thin shell theory. The applicabilityof thin shell theory is limited to shells with a ratio be-tween shell thickness and radius smaller than 1/20 [25]which is definitely fulfilled in the AFM experiments. Fur-ther, for both results it is assumed that the shell is madeof a material of isotropic elasticity that can be describedby a Young’s modulus E and a Poisson ratio ν. Thisassumption is justified, at least for the particular caseof PAH/PSS, since the different polyelectrolyte speciesare strongly interdigitated [6]. Under these assumptions,Reissner predicts the following relation between the defor-mation d and the force F [22, 23]:
d =√
3(1−ν2
)
4
R
h2
F
E, (1)
where h denotes the wall thickness and R the radius of theshell.
Pogorelov described the post-buckling case [21], wherea dimple is created by a geometrical inversion of the spher-ical cap around the force. Under the main assumptionthat all the deformation energy is concentrated in the rimaround the dimple, proportionality between the square rootof d and F is obtained, or more explicit
√d = 1−ν2
1.68
R
h5/2
F
E. (2)
The intersection point between the two results (Fig. 1)should provide a rough indication for the onset of buck-ling. The intersection occurs at a value well below thewall thickness h, where numerical and experimental re-sults show buckling for deformations of a few shell thick-nesses [26].
In the solution of Reissner (Eq. 1) the shell spring con-stant kshell should scale ∝ h2 and ∝ R−1. To check thisscaling relation, we have prepared shells with differentwall thickness and different radius. Figure 3 shows a plotof kshell multiplied with the radius versus the square of theshell wall thickness, so that the slope of the plot reflectsonly the fixed material properties.
For both data sets, the shell spring constants scale in-deed with the square of the wall thickness, h2. In bothcases, the fit to the data produces only a small offset forthe limit of zero thickness. Thus, contributions to the shellspring constant from long range interactions or a surfacetension, which both would not be expected to strongly de-pend on the wall thickness, can be ruled out, since theywould result in an offset. While the rescaling of the springconstant with R shows the predicted tendency, the matchis not as convincing as for the h dependency. The smallershells show a slightly higher stiffness compared to thelarger ones, although the deviation is not dramatic (within10 percent error). Therefore, the scaling analysis is inline with the interpretation of the data within the Reissnermodel.

Mechanical Properties of Freestanding Polyelectrolyte Capsules: a Quantitative Approach Based on Shell Theory 121
Fig. 3 Shell spring constant multiplied with the shell radius, whichmakes the data from shells of different radius collapse onto a mastercurve, and plotted against the square of the shell thickness. Blacktriangles: shells with 9.6 micrometer radius, grey squares: shellswith 7.85 micrometer radius. Full lines correspond to linear re-gressions performed on each data set separately. In both cases thepredicted scaling of the shell spring constant proportional to h2 isfound in the experiment
However, a question concerning the quantitative ap-plicability of Reissner’s solution is, how far the analyti-cal result is suited for the deformation situation that wehave in the present problem. The capsule is not com-pressed by a point like load but rather by a second spherewith a radius about four times larger than the shell ra-dius. The same assumption is made in the framework ofPogorelov’s approach, which is frequently used at higherdeformations [15]. In order to answer this question, wehave performed finite element (FE) calculations for theparticular situation under investigation (loading by a rigidsphere of radius four times the shell radius instead ofa point like force). A large deformation analysis has beenperformed using Abaqus (http://www.abaqus.com/) underthe assumption of a frictionless contact between the twospheres. Figure 4 shows the comparison of the FEM resultswith the analytical predictions from Reissner (dotted line)and Pogorelov (broken line). Note that these are predic-tions using the same material parameters and dimensionsof the shell in both analytical results and not simply fitsperformed to the FEM data.
Figure 4 allows several conclusions: First of all, theprediction of the Reissner result matches the FEM resultin the small deformation region well, which shows thatthe finite size of the contact area does not lead to strongdeviations from the analytical theory based on point likecontact. This justifies an application of this result to deriveelastic constants of the shell material from the measure-ments at small deformations.
Second, this is not the case concerning the result ofPogorelov, which should predict the deformation after theonset of buckling. Rather, similar to the situation observedin the experiment (Fig. 1), the force-deformation charac-
Fig. 4 Comparison of FEM results (filled circles connected by solidlines) for the deformation of a spherical shell with a ratio thick-ness to radius as in the experiment by a rigid spherical colloid.Dotted and broken lines are the analytical results from Reissner(Eq. 1) and Pogorelov (Eq. 2). In the FEM, R = 10 µm, h = 50 nm,E = 250 MPa und v = 1/3 were used which is close to the experi-mental situation
teristic follows closer to the Reissner deformation schemeeven at deformations of about more than three shell thick-nesses were buckling already occurred (which is foundboth in the experiment and in the FEM calculations forthose deformations). This surprising effect should be at-tributed to the finite contact area between probe and shell.After buckling has occurred, the contact between the twobodies is not point like, but a contact circle between thesphere and the rim like top of the buckled sphere. Thisincreased contact area results in an increase of the shellspring constant with the effect that the Reissner solutionstays a reasonable solution far beyond its actual range ofvalidity. It is noteworthy that this result depends only ongeometrical properties of the shell, i.e., the shell thicknessand the shell radius, and the assumption that the materialis deforming linear elastically. Thus, this result is quitegenerally applicable for deformation problems of spheri-cal shells in colloidal probe or other (even macroscopic)deformation problems.
This allows us to derive the elastic properties of thecapsules from the measured shell spring constants. Themost precise way to do so is to use the combination ofthe data in Fig. 3, since the slope of the rescaled data con-tains the Young’s modulus of the material and is an averageover all measurements. However, since the measurementswere carried out in water and not in dried state, like thethickness measurements, the thickness has to be modi-fied to account for the swelling of PAH/PSS. Kügler etal. showed that the thickness of the multilayers dependson the degree of humidity [27]. According to their study,PAH/PSS multilayers swell by 15% between multilayersdried under ambient conditions and immersed into wa-ter. Similar results were found by Lösche et al. [28], who

122 N. Elsner et al.
Fig. 5 Dependency of the measured shell spring constant on speed:the speed of the AFM probe deforming the surface is varied over3 orders of magnitude which results, within the accuracy of themeasurement, in no change of the elastic constants
measured an increase of 22% between fully dehydratedand rehydrated PAH/PSS multilayers. We verified this re-sult by AFM imaging of the scratch height of PAH/PSSmultilayers that were formed under the same conditions asthe capsules on silicon wafer substrates. Transfer from airinto water was found to lead to a multilayer thickness in-crease of the same order (30%). Therefore, we have used20 percent higher thicknesses for calculating the Young’smodulus. Assuming a Poisson ratio ν = 1
3 , this results ina Young’s modulus E of 294±32 MPa, which agrees withthe results of Heuvingh from capsule deformation [14] andVinogradova [15] from capsule swelling with the respec-tive errors. The value and the error of this value is derivedfrom the linear regression in Fig. 3. Our own estimate ina previous paper based on a simpler version of shell the-ory [13] as well as the estimate of Gao are higher and theestimate of Vinogradova based on large deformation AFMstudies is lower. In the case of Gao, we believe that thediscrepancy stems from the fact that larger deformationsare probed and that the material is probably showing strainhardening. In the case of Vinogradova, this is most likelydue to problems with handling the finite permeability ofthe shells in the proposed model, that would explain an un-derestimation of the stiffness. Apart from the magnitude ofthe Young’s modulus, the question whether the material isin a glassy or in a viscoelastic state is of importance. Toanswer this question, we have carried out speed dependentmeasurements, whose results that are shown in Fig. 5.
Figure 5 clearly shows that there is no speed depen-dency of the shells elasticity when the speed of deforma-tion is varied over 3 orders of magnitude. This clearly rulesout a viscoelastic material, which is also consistent withthe (high) order of magnitude of the derived Youngs mod-ulus.
Conclusions
In this paper we have reported on both experimental andtheoretical results on the deformation behaviour of poly-meric shells with microns diameter and membrane thick-ness on the order of 20–50 nanometers. AFM force spec-troscopy allowed to directly determining the force ver-sus deformation relation of individual capsules made frommultilayers of polyallylamine and polystyrenesulfonate.We found good agreement of the experimental results withthe analytical Reissner solution of the shell deformationproblem which predicts a linear force deformation relationfor deformations comparable to the capsule wall thick-ness. We compared these analytical findings with finiteelement modelling, in which a deformation of the shellby a plate can be modelled, which is closer to the ex-perimental situation, while the Reissner solution assumesa pointlike deformation. The FEM data shows that the ef-fect of using a non-pointlike probe to deform the capsule isto prolong the linear part of the force deformation, which isalso found in the experiment. The FEM data shows there-fore a better agreement with the data, but is identical tothe analytical theory in the regime of interest of small de-formations. This result is not depending on the particularsystem as long as the capsule wall material is reacting lin-ear elastically. Therefore, it can serve as a guide for themeasurement of other capsule like systems with similartechniques as the one used here.
Concerning the particular system, the Youngs modu-lus was determined with a higher accuracy then previ-ously possible to be 294 ±32 MPa, assuming a Poissonratio of ν = 1
3 . Together with the non detectable impact ofthe speed of deformation which was varied over 3 ordersof magnitude, this makes us believe that the system isin a glassy state. Temperature dependent measurementswhich will be published elsewhere show a pronouncedsoftening of the material upon temperature increase forsystems comparable to the one investigated here. There-fore we conclude that the strong ionic interactions areleading to the formation of a glassy material. An import-ant result is the finding that the capsule spring constantcan be adjusted by the radius and the wall thickness overa large range and that the analytical Reissner solution pre-dicts the scaling of the thickness correctly. This shows thatlbl-esa capsules can be precisely controlled in their com-pliance. This property is unique amongst shell systems andopens perspectives towards controlling deformability andadhesion in these systems via their mechanical properties.
Acknowledgement We would like to acknowledge financial sup-port from the German Science foundation (DFG) within the project“Adhäsion und Mechanik von Polyelektrolyt-Hohlkörpern” and theMax Planck Society. We are grateful for stimulating discussionswith Prof. Helmuth Möhwald.

Mechanical Properties of Freestanding Polyelectrolyte Capsules: a Quantitative Approach Based on Shell Theory 123
References1. Ivanovska IL, de Pablo PJ, Ibarra B,
Sgalari G, MacKintosh FC,Carrascosa JL, Schmidt CF, Wuite GJL(2004) Proc Natl Acad Sci 101:7600
2. Decher G, Hong JD, Schmitt J (1992)Thin Solid Films 210/211:831
3. Decher G (1997) Science 277:12324. Donath E, Sukhorukov GB, Caruso F,
Davis SA, Möhwald H (1998)Angewandte Chemie 110:2324
5. Shenoy DB, Antipov AA,Sukhorukov GB, Möhwald H (2003)Biomacromol 4:265
6. Decher G, Schlenoff JB (2003)Multilayer Thin Films. Wiley-VCH
7. Bäumler H, Artmann G, Voigt A,Mitlöhner R, Neu B, Kiesewetter H(2000) J Microencapsul 17:651
8. Gao CY, Leporatti S, Moya S,Donath E, Möhwald H (2001)Langmuir 17:3491
9. Gao C, Donath E, Moya S, Dudnik V,Möhwald H (2001) Eur Phys J E 5:21
10. Lulevich VV, Andrienko D,Vinogradova OI (2004) J Chem Phys120:3822
11. Vinogradova OI (2004) J Phys:Condensed Matter 16:R1105
12. Fery A, Dubreuil F, Möhwald H(2004) New J Phys 6:13
13. Dubreuil F, Elsner N, Fery A (2003)Eur Phys J E 12:215
14. Heuvingh J, Zappa M, Fery A (2005)Langmuir 21:3165
15. Vinogradova OI, Andrienko D,Lulevich VV, Nordschild S,Sukhorukov GB (2004) Macromol37:1113
16. Richter B, Kirstein S (1999) J ChemPhys 111:5191
17. Schwarz B, Schönhoff M (2002)Langmuir 18:2964
18. Sader JE, Chon JWM, Mulvaney P(1999) Rev Sci Instrum 70:3967
19. Hutter JL, Bechhoefer J (1993) RevSci Instrum 64:1868
20. Niordson FI (1985) Shell Theory,North-Holland Series in AppliedMathematics and Mechanics, Vol. 29,North-Holland
21. Pogorelov AV (1988) Bendings ofsurfaces and stability of shells. AmChem Soc, Providence
22. Reissner E (1946) J Math Phys 25:8023. Reissner E (1946) J Math Phys 25:27924. Koiter WT (1963) in Progress in
Applied Mechanics Macmillan: NewYork 1963 Vol. Prager Anniversary, p155
25. Gregory RD, Milac TI, Wan FYM(1999) SIAM J Appl Math 59:1080
26. Pauchard L, Rica S (1998) Phil Mag B78:225
27. Kügler R, Schmitt J, Knoll W (2002)Macromol Chem Phys 203:413
28. Lösche M, Schmitt J, Decher G,Bouwman WG, Kjaer K (1998)Macromolecules 31:8893

Progr Colloid Polym Sci (2006) 132: 124–130DOI 10.1007/2882_027© Springer-Verlag Berlin Heidelberg 2006Published online: 10 March 2006
Andra DedinaiteJoseph IruthayarajNatalija GorochovcevaRicardas MakuskaPer M. Claesson
Interfacial Propertiesof Chitosan-PEO Graft Oligomers:Surface Competitionwith Unmodified Chitosan Oligomers
Andra Dedinaite · Joseph Iruthayaraj ·Per M. Claesson ()Department of Chemistry, SurfaceChemistry, Royal Institute of Technology,100 44 Stockholm, Swedene-mail: [email protected]
Natalija Gorochovceva · Ricardas MakuskaDepartment of Polymer Chemistry, VilniusUniversity, Naugarduko 24, 03225 Vilnius,Lithuania
Abstract Oligomers of chitosancarrying 45 units long poly(ethyleneoxide), PEO, chains grafted to theC-6 position of the sugar units wereprepared using a novel synthesisroute. The graft density was high,close to one poly(ethylene oxide)chain grafted to each sugar unit of thechitosan oligomer but a small fractionof unreacted chitosan remained in thesample. The molecular weight distri-bution of the sample was determinedusing GPC. The interfacial propertiesof the chitosan-PEO graft oligomerswere evaluated using X-ray photo-electron spectroscopy and surfaceforce measurements. It was foundthat the small fraction of unreactedchitosan was significantly enriched
at the solid-solution interface onnegatively charged muscovite micasurfaces. The interactions betweenchitosan-PEO oligomer coatedsurfaces were found to be dominatedby the extended PEO chains, and athigh coverage the measured forceswere consistent with those expectedfor polymer brushes. Addition of saltup to 10 mM did not result in anysignificant desorption of preadsorbedoligomer layers.
Keywords Chitosan · Graftcopolymers · Poly(ethylene oxide) ·Polymer brushes · Surface forces
Introduction
Block copolymers in selective solvents can be designedto be efficient steric stabilizers provided one block, theanchor block, adsorbs strongly to the adsorbent whereasthe other block, the buoy block, experiences good sol-vency conditions and thus extends into solution forminga steric barrier against flocculation [1]. Comb copolymerswith adsorbing backbone can to some extent be seen asblock copolymers covalently bound together via their an-chor group. The general formula can be written as A(B)nwhere a number of n buoy blocks are grafted to one an-choring chain. The density of grafted side-chains is deter-mined by the distance between grafting points along themain chain. Surprisingly little is know about the interfacialbehaviour of comb copolymers, and nearly all of the ex-perimental and theoretical work reported in the literature is
concerned with comb copolymers of rather low graft dens-ity (see e.g. [2–4]). Theoretical work indicates that combhomopolymers for entropic reasons adsorb preferentiallywith the backbone towards the surface [3]. It has also beenshown that the thickness of an adsorbed comb homopoly-mer layer is thinner than that of a linear homopolymer ofthe same molecular weight and at the same surface cover-age. This is due to the fact that even though the numberof tails in the comb homopolymer is large, their length isshort compared to those formed by adsorbing linear ho-mopolymers [3]. The structure of an adsorbed layer ofa comb copolymer with an adsorbing backbone is similarto that of a comb homopolymer. On the other hand, forthe case when the grafted chains are adsorbing whereas thebackbone is not, the backbone will form many loops ex-tending from the surface, the length of which will dependon the graft density.

Interfacial Properties of Chitosan-PEO Graft Oligomers 125
When comb copolymers with a high graft density ad-sorb with the main chain closely packed on the adsorbent,the grafted chains will form a tight brush layer that isexpected to give rise to strong steric stabilization, goodlubricating properties and, by proper choice of graftedchains, protein and particle repellency. In fact, in a ratherrecent article excellent protein repellent properties werereported for a comb copolymer consisting of a polylysinebackbone and poly(ethylene oxide), PEO, grafts [5]. Simi-lar results have previously been obtained by using PEOgrafted to poly(ethylene imine), PEI [6]. The use of combcopolymers as stabilizers and flocculation aids for particledispersions has also been explored. For instance, it hasbeen shown that titanium dioxide particles can be stabi-lized by comb copolymers of methacrylic acid (backbone)and PEO (side-chains) [7]. However, the polymer sam-ples used in that study was not well defined and thus itwas not possible to draw any conclusions about the rela-tion between the polymer architecture and the stabilizingpower of the polymer. Another area of interest is to usecomb copolymers as lubricants. The need for thin, firmlyanchored molecular lubricants for construction of micro-and nanodevices has recently been stressed [8].
In this report we address interfacial properties ofcationic oligomeric chitosan, having close to one grafted45 units long EO-chain on each sugar unit, by study-ing its adsorption to negatively charged surfaces and theforces generated by the adsorbed layers. We have previ-ously investigated the interfacial properties of chitosan onnegatively charged surfaces [9, 10], and found that it ad-sorbs in a very flat conformation when the ionic strengthis low. We have also investigated interfacial properties ofpoly(ethylene imine) with grafted PEO chains [11]. How-ever, this study is different from the previous ones sincenow a very short molecular backbone is used, and the ad-sorption competition between chitosan with grafted PEOchains and unmodified chitosan oligomers is in focus. Onemotivation for this choice of oiligomer is that the chi-tosan backbone is obtained from a naturally occurringpolysaccharide, chitin, and show good biodegradabilityand low toxicity. The grafted side-chains of PEO are mo-tivated by the low affinity of proteins and soils to thiscompound, which makes PEO interesting in applicationsranging from biomedical to household care. The use ofoligomers rather than polymers is sometimes advanta-geous due to their more rapid diffusion to interfaces, anddue to that long-range attractive bridging forces, whichmay cause unwanted flocculation or adhesion between soilparticles and surfaces, are avoided. When preparing highgraft density copolymers, or oligomers, some unreactedbackbone segments are often present in the final product.Since, excessive purification procedures are both time con-suming and expensive it is of interest to know if a lowconcentration of unreacted and adsorbing backbone ma-terial has a significant effect on the composition of theadsorbed layer.
Materials and Methods
Synthesis of Chitosan-EO45
The chitosan sample with 45 units long grafted poly(ethylene oxide) side-chains, henceforth referred to aschitosan-EO45 oligomers, were prepared according to thefollowing scheme in Fig. 1.
Chitosan (Mr 400 000 g/mol, degree of deacetyla-tion (DD) 72%) and poly(ethylene glycol) monomethylether (MPEG) (Mr 2000 g/mol) were obtained fromFLUKA. Synthesis of methoxypoly(ethylene glycol) io-dide (MPEGI) was done as described in our recent pa-per [12]. 2-N-phthaloyl chitosan (2 in Scheme 1), 2-N-phthaloyl-6-O-triphenylmethyl chitosan (3 in Scheme 1),2-N-phthaloyl-3-O-acetyl-6-O-triphenylme-thyl chitosan (4 in Scheme 1) and 2-N-phthaloyl-3-O-acetyl chitosan (5 in Scheme 1) were synthesized frominitial chitosan by a method described earlier [13]. Ag2Owas synthesized from AgNO3 and KOH just before use.
The last step in the synthesis is novel and herea mixture of 2-N-phthaloyl-3-O-acetyl chitosan (1.0 g,3.01 mmol), MPEGI (6.4 g, 3.01 mmol) and Ag2O(0.73 g, 3.01 mmol) in 50 ml DMF was heated at 60 Cwith magnetic stirring for 16 hours. Then hydrazine mono-hydrate (40 ml) and water (80 ml) were added to thereaction vessel and the mixture was heated under mag-netic stirring for 15 hours at 90 C. To remove hydrazinemonohydrate the mixture was evaporated using rotaryevaporator until a viscous solution was obtained. The so-lution was diluted with water and evaporated again untila solid residue was formed. This procedure was repeatedthree times. Then the residue was washed several times byacetone and the obtained product was dried in a vacuumoven to give 5.8 g of chitosan-6-O-MPEG graft oligomers.Intermediate and final derivatives of chitosan were charac-terized by FTIR and 1H-NMR spectroscopy.
The product obtained was analyzed by gel permeationchromatography, GPC, using a Viscotek TDA 302 TripleDetection System with Light Scattering, Viscosity and RIDetection. The columns used were 2x ViscoGel GMPWxl(Mixed Bed), and the eluent was aqueous 0.8 M NaNO3at pH ∼ 7. The eluent flow rate was 0.6 ml/min. and theoligomer concentration approximately 1 mg/ml. The tem-perature was 35 C.
Other Materials
The potassium bromide and sodium chloride, with >99.5%purity, were obtained from Merck and used as received.The water used in the experiments was first pre-treatedwith a Milli-RO 10 Plus system and further purified witha Milli-Q PLUS 185 system. When used in the surfaceforce apparatus it was deaerated for at least one hour usinga water jet pump. All glassware was cleaned by Hellmanex

126 A. Dedinaite et al.
Fig. 1 A scheme of the synthesis of chitosan-EO45 oligomers of regular structure
solutions for 24 hours. It was then rinsed with purified wa-ter and finally blow-dried with nitrogen gas.
X-ray Photoelectron Spectroscopy
The adsorbed amount of the oligomer on mica surfaceswas determined by means of a Kratos AXIS-HS X-ray photoelectron spectrometer (XPS also called ESCA)equipped with a hemispherical analyzer. Photoelectronemission was induced by non-monochromatic X-rays (AlKα, 1486.6 eV) that were emitted from a dual anode. Elec-trostatic lenses were used to collect the photoelectrons thatwere emitted normal to the surface plane. The quantifica-tion was carried out using the sensitivity factors for K2p,C1s and N1s provided by Kratos. The samples used forXPS analysis were prepared in the following way. Freshlycleaved mica pieces were immersed in 10 mL beakers con-taining 0.1 mM NaCl and the appropriate amount of thechitosan-EO45 oligomer for 40 minutes. Next, the beakerswith the surfaces were immersed in 2.5 liters of 0.1 mMNaCl and withdrawn from this solution. The surfaces werethen dried by a nitrogen jet. All surface preparation stepswere carried out inside a dust-free laminar flow cabinet.Desorption of the oligomer from surfaces precoated withchitosan-EO45 was also investigated in NaCl solutions ofdifferent ionic strengths. The surfaces were left in these so-lutions for up to 12 hours, and then withdrawn and dried asdescribed above.
Surface Force Aparatus
The forces acting between muscovite mica surfaces coatedwith chitosan-EO45 were studied with a surface force appa-ratus, SFA, using the Mark IV [14] model. The techniqueis described in detail in [15]. The results of the surfaceforce measurements are plotted as force normalized by thegeometric mean radius, F/R, as a function of surface sep-aration, D. The distance resolution is about 2 A, and theF/R detection limit is about 1×10⁻⁵ N/m. We note thatthe force normalized by radius for the crossed cylindergeometry used in the experiments is related to the free en-ergy of interaction per unit area (Gf) between flat surfaces(F/R = 2πGf). This relation is valid when the radius ofthe surfaces (≈ 2 cm in our experimental set-up) is muchlarger than the range of the measured forces, and when thesurfaces remain undeformed. The force measuring systemis unstable once the slope of the force, dF/dD, exceedsthe spring constant. When this occurs a “jump” to the nextmechanically stable region of the force curve takes place.
Results and Discussion
The average structure of the chitosan-EO45 oligomers isdepicted in Fig. 2.
The degree of O-substitution of MPEG to the monosac-charide residues of chitosan (DS, %) was calculated by two

Interfacial Properties of Chitosan-PEO Graft Oligomers 127
Fig. 2 The structure of the chitosan-EO45 oligomers
independent methods, according to the content of primaryamino groups and according to the content of PEO (PEG)units in the oligomers determined experimentally [12].The data characterizing the composition of the chitosan-EO45 oligomers are: content of primary amino groups0.55%, content of PEO units 92%, DS 96%. Thus, 72% ofthe monosaccharide residues are deacetylated and the ob-tained product carries one grafted PEO chain on close toeach C-6 position of the sugar units present in chitosan.The oligomers have well defined regular structure becauseof regioselective modification of chitosan through C-6position only. This was achieved by the use of effectiveprotection of both amino and C-6 hydroxyl groups in thecourse of the multistep synthesis (see Fig. 1, Scheme 1).The amino groups of the initial chitosan remained un-changed during the modification process thus providingcertain cationicity to the chitosan-EO45 oligomers.
The GPC chromatogram of the chitosan-EO45 oligo-mers is illustrated in Fig. 3. Analysis of the graft oligo-mers by contemporary GPC technique revealed that theaverage molecular weight of the sample is very low. Theoligomers consist mainly of conjugates of glucoseamineand MPEO as well as of dimers and trimers of these con-jugates, but some larger species with up to 15 chitosanmonosaccharide residues with grafted MPEG are present
Fig. 3 The molecular weight distribution of chitosan-EO45 as deter-mined by GPC. The peak corresponding to unmodified chitosan aswell as the peaks corresponding to monomers, dimers, and trimersand 15-mers of conjugates of glukosamine and MPEO of chitosan-EO45 are indicated
in the sample. A small peak corresponding to unmodifiedchitosan oligomers is also noticeable.
The main parameters from GPC with triple detec-tion characterizing the chitosan-EO45 are as follows:the average molecular weights Mn = 2770 g/mol andMw = 3790 g/mol, the hydrodynamic radius of the graftoligomers is 1.8 nm, and the intrinsic viscosity is0.105 dl/g. The breakdown of the chitosan backbone isconsistent with earlier findings [16], and thought to occurdue to the amine group protection – deprotection proced-ure. We suspect that residual Ag2O has an additional effecton the degradation of the chitosan backbone explainingwhy oligomers only are received in this case.
X-ray Photoelectron Spectroscopy, XPS
The cationic chitosan-EO45 oligomers are expected to ad-sorb by electrostatic attraction to the negatively chargedmica surface. Thus, the chitosan unit will be orientedtowards the mica surface with the PEO chains facingoutwards. Mica surfaces coated with adsorbed layers ofchitosan-EO45 were analyzed by XPS as a function ofthe chitosan-EO45 concentration used during the adsorp-tion step. The nitrogen N1s peak emanating from theaminosugar groups was used for quantifying the amountof such groups adsorbed to the mica surface, and the car-bon C1s peak was used for quantifying the amount ofpoly(ethylene oxide) chains associated with the surface.The method used for quantifying the adsorbed amount isbased on using the lattice potassium ions within the micacrystal as an internal standard as described in detail byRojas et al. [17]. We note that in the analysis the carboncontent of the sugar units was considered.
The results obtained from the XPS analysis are il-lustrated in Fig. 4. The results clearly demonstrate that
Fig. 4 The number of nitrogen atoms, which equals the num-ber of sugar units, per cm2 (filled squares) and the number ofpoly(ethylene oxide) chains per cm2 (unfilled circles)

128 A. Dedinaite et al.
the number of sugar units per unit surface area signifi-cantly exceeds the number of PEO chains. This resultdemonstrates a strong preference for adsorption of the un-modified chitosan fraction over that of the chitosan-EO45oligomers. Further, this preference increases as the sur-face coverage increases even though also the number ofchitosan-EO45 oligomers increases with the concentrationof oligomers in the adsorbing solution. This strongly in-dicates that repulsion between the adsorbed PEO chainsdisfavors the adsorption of the grafted cooligomer overthat of the unmodified chitosan.
We note that XPS measurements may result in somedegradation of the adsorbed layer due to the X-ray bom-bardment. However, repeated measurements at the sameposition provided the same results, indicating that this ef-fect is unimportant and cannot explain that significantlymore sugar groups than PEO chains are detected on thesurface.
The radius of gyration of the PEO chain in bulk solu-tion can be calculated from [18]:
Rg = 0.0215M0.583w (nm) . (1)
This gives a radius of gyration of the PEO chain ofabout 1.8 nm, meaning that an undistrurbed coild wouldcover a surface area of πR2
g ≈ 10 nm2. The ratio betweenthe area of the undisturbed PEO coil and the area per PEOchain adsorbed on the surface is a measure of the extensionof the chain away from the surface, where a value largerthan one indicates that the interaction between neighboringadsorbed PEO chains forces the chain to adopt a stretchedconformation away from the surface. The results of thiscalculation are illustrated in Fig. 5.
Clearly, the repulsion between the adsorbed PEOchains is significant which forces them to adopt stronglystretched conformations, a brush structure. The degree of
Fig. 5 The area for an undisturbed PEO coil divided by the area peradsorbed PEO chain as a function of the concentration of the poly-mer sample in the solution. The unfilled circle illustrates the resultafter allowing a preadsorbed layer to desorb in 100 mM NaCl for 12hours
Fig. 6 A schematic illustration of the adsorbed layer. The circlesrepresent sugar units and the thick lines the stretched PEO chains
stretching increases with increasing polymer concentra-tion in solution. These results support the hypothesis thatit is the steric intralayer repulsion between the PEO chainsthat causes the strong preferential adsorption of the un-modified chitosan. However, we note that the adsorption ofchitosan-EO45 oligomers is sufficiently large to give rise toa brush structure, as schematically shown in Fig. 6.
Desorption Experiments
Desorption of the adsorbed layer in salt solutions werealso quantified by XPS. It was found that no measurableamount of oligomer was desorbed by immersing a pread-sorbed layer in NaCl solutions up to a concentration of10 mM, whereas immersion in 100 mM NaCl for 12 hoursresulted in removal of about 23% of the polymer. Hence,the chitosan-EO45 oligomer is surprisingly strongly at-tached to the mica surface, which indicates a significantnon-electrostatic surface affinity between the sugar groupand the mica surface, as also observed for other sugarsgroups [19]. One would expect that such an adsorbed layerwould act as an efficient steric stabilizer. This aspect canbe further investigated by surface force measurements.
Surface Force Measurements
The forces acting between two mica surfaces acrossa 0.1 mM KBr solution before and after addition of 20 ppmof chitosan-EO45 oligomers are illustrated in Fig. 7. Be-fore addition of the EO45 oligomers a long-range repulsiveforce is dominating the interactions. The decay length ofthis force is consistent with that of a double-layer force andit is thus due to overlap of the diffuse ionic clouds outsidethe negatively charged mica surfaces. At shorter separa-tions, from about 5 nm, the attractive van der Waals forcebecomes dominant and the this force causes the surfacesto jump into contact, which is due to a mechanical insta-bility of the force measuring system. These results are inagreement with those reported for similar systems before,see e.g. [20, 21].
The forces experienced after adding 20 ppm of chito-san-EO45 oligomers are quite different. Firstly, the repul-sive double-layer force is significantly weaker, which isdue to adsorption of cationic groups on the negativelycharged surface. Secondly, at distances below 10 nm, the

Interfacial Properties of Chitosan-PEO Graft Oligomers 129
Fig. 7 Force normalized by radius as a function of surface separa-tion. The forces were measured between muscovite mica surfacesacross a 0.1 mM KBr solution (unfilled circles) and in the same so-lution after addition of 20 ppm chitosan-EO45 oligomers. The arrowrepresents the jump into contact to D = 0 due to the action of theattractive van der Waals force
forces are dominated by a steric repulsion due to com-pression of the extended PEO chains. The final separationobtained under a high compressive force is about 4 nm,corresponding to a 2 nm thick layer on each surface.
An increase in the chitosan-EO45 oligomer concentra-tion to 50 ppm results in a decrease in the repulsive double-layer force, and the surfaces now appears to be close touncharged, see Fig. 8.
The suppression of the repulsive double layer forcemakes a weak attractive force component measurable. Thisforce causes the surfaces to jump from a separation ofabout 30 nm to about 8 nm. The origin of this attractionis at present unclear, but it may be suggestive of a weakpositive charge on one surface and a weak negative chargeon the other. The force encountered on further compres-sion is very steep. On separation a weak adhesive min-imum is observed at a separation of 10 nm, i.e. the un-compressed layer thickness on each surface is about 5 nm.For comparison, the forces measured between mica sur-faces coated with a chitosan polymer (Mw 150.000 g/mol)are shown. The strong electrostatic affinity between thepolymer and the surface results in a very thin adsorbedlayer, significantly thinner than that obtained in presenceof the chitosan-EO45 oligomer, demonstrating that thesteric barrier in the latter case is due to the adsorbedPEO-chains.
A further increase in the chitosan-EO45 oligomer con-centration to 200 ppm, results in a further increase in theshort-range repulsion, as illustrated in Fig. 9.
The repulsion commences at a separation of just be-low 25 nm, and the compressed layer thickness is about
Fig. 8 Force normalized by radius as a function of surface separa-tion. The forces were measured between muscovite mica surfacesacross a 0.1 mM KBr solution containing 50 ppm chitosan-EO45oligomers. Filled and unfilled symbols represent forces measured onapproach and on separation, respectively. The forces measured be-tween mica surfaces coated with polymeric chitosan are representedby crosses. The arrows represent inward jumps due to the action ofan attractive force
Fig. 9 Force normalized by radius as a function of surface separa-tion. The forces were measured between muscovite mica surfacesacross a 0.1 mM KBr solution containing 200 ppm chitosan-EO45oligomer. The lines are theoretically calculated force curves, fordetails see text
7–8 nm. No attraction is observed upon separation. Theresults obtained with XPS indicates that the PEO chainsanchored to the surface should be quite extended at thisbulk polymer concentration and it is therefore of interestto compare the measured forces with those expected forpolymer brushes interacting in a good solvent.

130 A. Dedinaite et al.
One way is to use scaling theory that predicts that thepressure P(D) between two flat surfaces coated with poly-mer brushes in a good solvent as given by [22]:
P(D) ∝ kT
s3
[(D∗
D
)9/4
−(
D
D∗
)3/4]
, (2)
where Eq. 2 is valid provided the separation, D, is lessthan D∗ (where D∗ is twice the length of the polymer tail),and s is the linear distance between the anchored chains onthe surface. The scaling theory does not provide the valueof the prefactor, but it is expected to be of the order ofunity. For the interactions between two crossed cylinders,which is the experimental geometry, this relation is, ac-cording to the Derjaguin approximation [23, 24], modifiedto:
F(D)
R= −2π
D∫
D∗P(D′)dD′ . (3)
When calculating the theoretical force curves shownin Fig. 9 we used the XPS results to obtain the value ofs and twice the length of the polymer brush was set to23 nm. The anchoring points for the grafted PEO-chainswere set at a distance 1.5 nm away from the mica sur-face. This value was chosen to be equal to the undisturbedlayer thickness of the adsorbed chitosan polymer withoutgrafted side-chains. When the prefactor is set equal to 1,the lower curve in Fig. 9 is obtained, and when a pref-actor equal to two is used the upper curve is obtained.
Clearly, the agreement between theory and experiment issatisfactory.
The interactions between surfaces coated with a highdensity of chitosan-EO45 oligomers, as illustrated inFig. 9, are similar to those obtained in previous studiesusing lysine end-capped PEO chains with similar chainlength adsorbed to mica [25], and for the (butylenesoxide)8–(ethylene oxide)41 copolymer adsorbed to non-polar surfaces [26].
Conclusions
Positively charged chitosan-EO45 oligomers have beenprepared using a novel synthesis route. These oligomersadsorb readily to negatively charged surfaces. XPS analy-sis have shown that the small fraction of unreacted chi-tosan is strongly enriched in the surface layer, which isdue to the strong steric intralayer repulsion between thePEO chains of the chitosan-EO45 oligomers. Nevertheless,the surface density of PEO chains are sufficiently high tocreate a brush structure that generates strong steric repul-sive forces, similar to those observed for tightly packedcopolymers on non-polar surfaces. Thus, the chitosan-EO45 oligomers can be used for modifying the surfaceproperties of negatively charged surfaces and as a stericstabilizer.
Acknowledgement This work was carried out as a part the MarieCurie Network “Self-assembly” under confinement, “SOCON” andtravel support for Natalija Gorochovceva is acknowledged from theSwedish Royal Academy of Sciences. PC and AD acknowledgefinancial support from the Swedish Research Council, VR.
References1. Fleer GJ, Cohen Stuart MA,
Scheutjens JMHM, Cosgrove T,Vincent B (1993) Polymers atInterfaces. Chapman & Hall, London
2. Bijsterbosch HD, Cohen Stuart MA,Fleer GJ (1998) Macromolecules31:8981
3. van der Linden CC, Leermakers FAM,Fleer GJ (1996) Macromolecules29:1000
4. De Sousa Delgado A, Léonard M,Dellacherie E (2001) Langmuir17:4386
5. Huang N-P, Michel R, Voros J,Textor M, Hofer R, Rossi A, Elbert D,Hubbel JA, Spencer ND (2001)Langmuir 17:489
6. Brink C, Österberg E, Holmberg K,Tiberg F (1992) Colloids Surf 66:149
7. Liang W, Bognolo G, Tadros TF(2000) Langmuir 16:1306
8. Tsukruk VV (2001) Adv Mater 13:959. Claesson PM, Ninham B (1992)
Langmuir 8:140610. Dedinaite A, Ernstsson M (2003)
J Phys Chem B 107:818111. Claesson PM, Blomberg E, Paul-
son O, Malmsten M (1996) ColloidsSurf A 112:131
12. Gorochovceva N, Makuska R (2004)European Polymer J 40:685
13. Nishimura S, Kohgo O, Kurita K(1991) Macromolecules 24:4745
14. Parker JL, Christenson HK,Ninham BW (1989) Rev Sci Instrum60:3135
15. Israelachvili JN, Adams GE (1978)J Chem Soc Faraday Trans 1 74:975
16. Holappa J, Nevalainen T,Savolainen J, Soininen P, Elomaa M,Safin R, Suvanto S, Pakkanen T,Masson M, Loftsson T, Järvinen T(2004) Macromolecules 37:2784
17. Rojas O, Ernstsson M, Neuman RD,Claesson PM (2000) J Phys Chem B104:10032
18. Devanand K, Selser JC (1991)Macromolecules 24:5943
19. Claesson PM, Christenson HK,Berg JM, Neuman RD (1995)J Colloid Interface Sci 172:415
20. Pashley RM (1981) J Colloid InterfaceSci 83:531
21. Pashley RM (1981) J Colloid InterfaceSci 80:153
22. de Gennes PG (1987) Adv ColloidInterface Sci 27:189
23. Derjaguin B (1934) 69:15524. Israelachvili JN (1991) Intermolecular
and Surface Forces. Academic Press,London
25. Claesson PM, Gölander CG (1987)J Colloid Interface Sci 117:366
26. Schillén K, Claesson PM,Malmsten M, Linse P, Booth C (1997)J Phys Chem 101:4238

Progr Colloid Polym Sci (2006) 132: 131–137DOI 10.1007/2882_036© Springer-Verlag Berlin Heidelberg 2006Published online: 8 March 2006
Anetta WalawskaEdward RybickiBarbara Filipowska
Physicochemical Changes on Wool Surfaceafter an Enzymatic Treatment
Anetta Walawska () · Barbara FilipowskaInstitute of Textile Architecture,276 Piotrkowska St., 90-950 Lodz, Polande-mail: [email protected],[email protected]
Edward RybickiDepartment of Textile Finishing, TechnicalUniversity of Lodz, 116 Zeromski St.,90-924 Lodz, Poland
Abstract A new ecological methodhas been proposed for the shrink-proof finishing of wool, based on anenzymatic pre-treatment and chitosandeposition, ensuring dimensionalstability after multiple washingprocesses. It was demonstratedthat an enzymatic treatment usinghighly selected proteolitic enzymescauses a distinct decrease in theshrinkage of wool fabric. The presentwork is aimed at analyzing thephysicochemical changes in thewool surface following an enzymatictreatment. In order to characterisethese changes measurements ofthe electrokinetic potential of woolsamples and the enzymatic bathwere performed. An increase in theelectronegative PCD potential ofwool samples and the enzymatic bathduring the process was observed.Also, the enzymatic treatment causesa change in the isoelectric point(IEP) value of wool, as obtained bythe electrokinetic measurements.
The amount of the individual aminoacids released during the enzymatictreatment of wool was monitored bythe HPLC method. Moreover, an XPSanalysis of enzymatic-modified woolfabric samples and contact anglemeasurements were performed. Thedata obtained by the XPS methodallowed comparison of the changesin the elemental concentration onthe wool surface after enzymatictreatment. The results of the contactangle measurements demonstratedan increase in the wettability of themodified wool surfaces.
The results obtained proved thatvery good correlations exist betweenthe value of electrokinetic potential,HPLC results, XPS measurements,contact angle values and changes inthe isoelectric point (IEP).
Keywords Chitosan ·Electrokinetic measurements ·Enzymatic treatment ·Surface properties · Wool
Introduction
Wool is a natural protein fiber characterized by the scalystructure of its external surface-cuticle (Fig. 1). This struc-ture, i.e. the stiffness of cuticle and smoothness of theepicuticle as well as the ability of wool to contract, causesthe shrinking of wool fabric during mechanical washingprocesses.
The oxidative plasma treatment of wool, at low tem-perature and pressure, modifies to a large extent the cuti-
cle surface of the fibres, improving its surface wettability,dyeability, fibre cohesion and shrink-resistance [3–8]. Theuse of plasma treatment in wool finishing is an environ-mentally acceptable alternative to the conventional chlo-rination finishing process. However, the shrink-resistantproperties obtained by plasma treatment do not imparta machine-washable finish – one of the end-users’ de-mands.
The use of enzymes to achieve wool shrink resistance,better whiteness, and improved handle is of considerable

132 A. Walawska et al.
Fig. 1 The schemata of wool fibre cuticle; thickness 0.3–1 µm [1,2]
interest [9–12]. However, if enzymes are applied at levelsthat provide the required shrink resistance, wool fibres areoften unacceptably damaged [13–15].
Hence, a new ecological method for the shrink-prooffinishing of wool based on an enzymatic pre-treatmentand chitosan deposition has been proposed. It has beendemonstrated that an enzymatic treatment of highly se-lected proteolytic enzymes causes a distinct decrease inthe shrinkage of wool fabric. Chitosan, deposited on thewool fabric surface, stabilises the obtained shrink-resistanteffect and restores the “full handle” typical of standardfinished wool fabrics [16–21]. Moreover, the depositionof chitosan, a cationic polymer, causes a change in thewool surface charge from electronegative to electroposi-tive. This phenomenon affects the changes in the mechan-ism of wool dyeing using anionic dyestuffs, soiling, anddirt removal [20, 21].
The existing knowledge concerning the character ofphysicochemical changes on wool surface as a result of anenzymatic action is still insufficient.
In this paper, studies of enzyme-modified wool fabricsurfaces using the PCD potential, XPS analysis, HPLC an-alysis of amino acids, and contact angle measurements arepresented.
Materials and Methods
Raw wool fabric samples of a plain-weave (155 g/m2),supplied by the Wool Company “9 May” S.A., Lodz,Poland, were used in this research. These wool sampleswere thoroughly extracted with a mixture of ethanol/ben-zene (32.4/67.6 wt %) for 8 hours using Soxhlet appara-tus. The extracted wool fabrics were washed twice with96% ethanol and rinsed twice with deionised water. Fi-nally, the wool fabrics were dried in an oven at 50 C for1 hour and were then air dried.
For the enzymatic treatment, a selected mixture of pro-teolytic enzymes was used – Perizym LAN (Dr Petry,GmbH, Germany). Its optimum activity was at pH 8–8.5and a temperature of 50–55 C. The optimum treatmenttime was in the range of 30–40 min, as advised by themanufacturer. The mean proteolytic activity determinedby the Anson method [22] was 2.676 units/cm3. A liquor
ratio of 10 : 1 was applied. To deactivate the enzymes,a bath with wool samples was heated to 85 C and kept atthis temperature for 20 min. The concentration of enzymesin the bath is given in weight per cent related to the weightof fabric – e.g. 4% of weight of fabric (o.w.f.) of PerizymLAN.
Chitosan (CHITON Co. Ltd., Gdynia, Poland), havinga deacetylation degree of 83% and viscosity (1% water so-lution of acetic acid, pH 3.5–4) of 20 mPas, was depositedon wool fabric pre-treated with enzymes using the pad-dry-fix method [19].
The shrink-resistance testing was carried out in a do-mestic washing-drying machine, using a non-ionic wash-ing agent solution (LAVAN JET, Textilcolor AG) at 60 C,pH 5.3. The changes in dimensions of wool samples aftermultiple washing were assessed in warp – the longitudinaldirection of the fabric, and weft – the transverse directionof fabric, in accordance with the standard procedure de-scribed elsewhere [23, 24].
Scanning electron micrographs (SEM) were obtainedusing a JSM 5500 LV (Jeol, Japan) electron microscope.The observations were performed in a secondary electron(SE) and in a backscattering electron (BSE) mode at a lowvacuum pressure of 12 kPa.
The most commonly used approach to determine thecontact angle of a liquid drop to a solid surface is the ses-sile drop method, in which a goniometer is used to measurethe angle given by the line appearing from the solid surfaceand the tangent arising from the three-phase point. The ac-curacy of the method, however, is limited [25]. Practically,all the contact angle measurement methods proposed in thepresence of fibrous materials should be used with cautionand the results regarded as an approximation rather than asabsolute values. Nevertheless, the sessile drop method wasoften applied to determine the contact angles of keratin fi-bres [26–29]. The water contact angle (Θ) of shrink-prooffinished wool fabric surface was measured on a sessiledrop. 1 µl of distilled water was dropped on the surface ofmodified wool fabric samples. The contact angle value ofone sample was calculated as the arithmetic mean of 10measuring results.
The streaming potential (proportional to the zeta po-tential) of wool fibres was determined using the Par-ticle Charge Detector (PCD), a product of Mütek GmbH,Germany. The induced streaming potential was meas-ured using two gold electrodes connected with an elec-tronic analyser. The potential was recorded by a meas-uring millivoltmeter. Powdered fabric samples (woolyarn placed in the microtome and then cut into portionsof about 40–60 µm) were suspended in distilled water(100 mg/100 ml). Following careful stirring, the sampleswere placed in a cylindrical vessel of the apparatus inorder to determine the value of the streaming potential.The determination of an isoelectric point (IEP) of modi-fied wool surface was also carried out using the ParticleCharge Detector (Mütek GmbH, Germany). The changes

Physicochemical Changes on Wool Surface after an Enzymatic Treatment 133
in the PCD potential values were determined in the pHrange from 2.30 to 8.00. In order to adjust the pH values,water solutions of 0.1 M HCl and 0.1 M NaOH wereused.
The studies of the composition and state of chem-ical elements on enzyme-modified wool surfaces (car-bon, nitrogen, oxygen, sulphur) as compared to un-treated ones were performed by means of XPS analysis(Vacuum System Workshop Ltd., England) using non-monochromatized AlKα radiation with energy 1486.6 eV,10 kV and 200 W. The base pressure in the analysis cham-ber was 3×10⁻⁶ Pa [30]. XPS spectra were acquired inthe constant analyser transmission mode with energy ofelectron transmission 22 eV.
The HPLC (High Performance Liquid Chromatogra-phy) analysis of enzymatic bath was performed usinga chromatographic column C18 DABS (Beckman, USA)modified to amino acid analysis.
Results and Discussion
As can be seen from Fig. 2, the finishing of wool fab-rics based on an enzymatic pre-treatment and chitosandeposition causes a decreased tendency in the wool sam-ples to shrink during the mechanical washing process.The enzymatic pre-treatment greatly improves the shrink-proof properties of wool fabric. The treated fabric be-comes more pleasant to the touch, but at the same timeit is too flabby. The amount of chitosan deposited onwool fabric pre-treated with enzymes is practically ofno essential consequence to its shrink-resistance proper-ties, as it is also the case for fabric without enzymaticpre-treatment, but a slight decrease in shrinkage was ob-served. Chitosan deposited on wool fabric preliminarilypre-treated with enzymes restores its “full handle” andimproves the appearance of the wool fabric surface afterwashing [16, 18].
Figure 3 presents SEM pictures of untreated, enzyme-treated, and wool fibres after enzymatic treatment and chi-tosan deposition. The characteristic scaly structure of the
Fig. 3 SEM micrographs: a blank wool fibre – magnification 3000×; b wool fibre after enzymatic treatment – 4% o.w.f. of Perizym LAN,30 min – magnification 3000×; c wool fibre after enzymatic treatment – 4% o.w.f. of Perizym LAN, 30 min and 1.7% o.w.f. of chitosandeposition – magnification 2000×
Fig. 2 Changes in the linear dimensions of wool fabrics after threewashings at 60 C versus chitosan deposition
wool fibre surface is evident in the SEM micrographs ofblank wool fibre samples (Fig. 3a). Enzymatic treatmentof wool leads to a rougher surface, with a reduced scales’height. Chitosan application seems to lower the roughness;however SEM observations did not show visible chitosanon the fibre surface even when high chitosan amountshad been applied (up to 1.7%). This implies that chitosanforms a very thin film on wool fibres which is sufficient
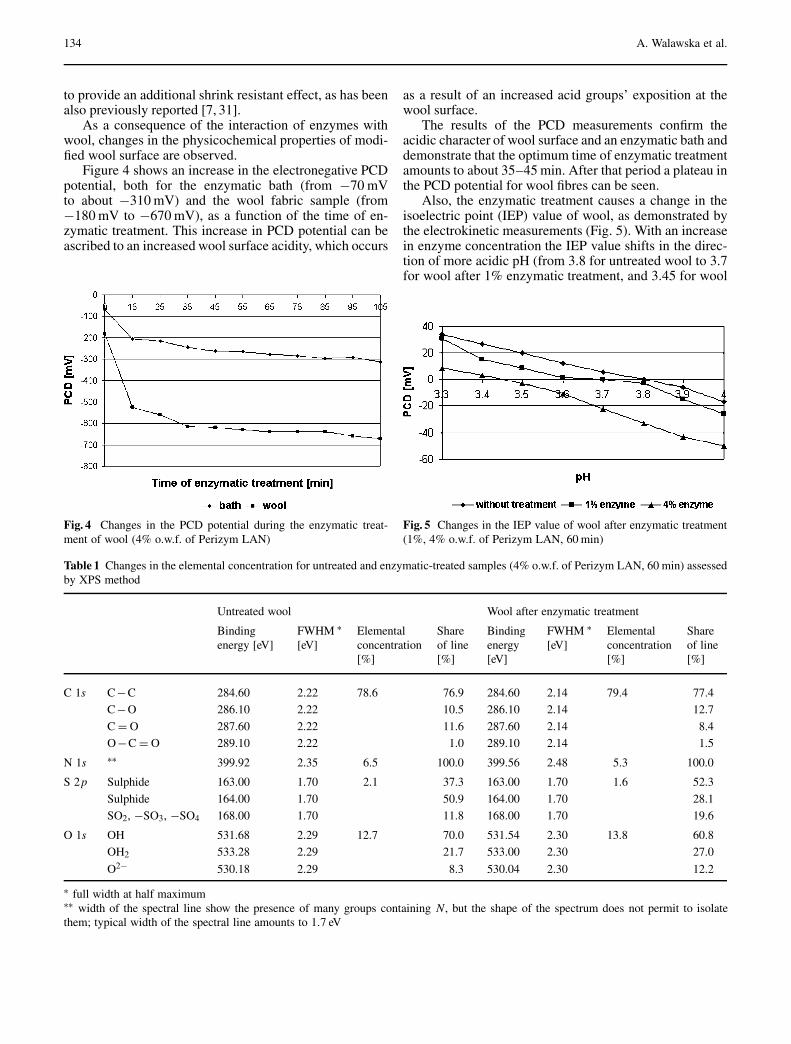
134 A. Walawska et al.
to provide an additional shrink resistant effect, as has beenalso previously reported [7, 31].
As a consequence of the interaction of enzymes withwool, changes in the physicochemical properties of modi-fied wool surface are observed.
Figure 4 shows an increase in the electronegative PCDpotential, both for the enzymatic bath (from −70 mVto about −310 mV) and the wool fabric sample (from−180 mV to −670 mV), as a function of the time of en-zymatic treatment. This increase in PCD potential can beascribed to an increased wool surface acidity, which occurs
Fig. 4 Changes in the PCD potential during the enzymatic treat-ment of wool (4% o.w.f. of Perizym LAN)
Table 1 Changes in the elemental concentration for untreated and enzymatic-treated samples (4% o.w.f. of Perizym LAN, 60 min) assessedby XPS method
Untreated wool Wool after enzymatic treatment
Binding FWHM ∗ Elemental Share Binding FWHM ∗ Elemental Shareenergy [eV] [eV] concentration of line energy [eV] concentration of line
[%] [%] [eV] [%] [%]
C 1s C−C 284.60 2.22 78.6 76.9 284.60 2.14 79.4 77.4
C−O 286.10 2.22 10.5 286.10 2.14 12.7
C = O 287.60 2.22 11.6 287.60 2.14 8.4
O−C = O 289.10 2.22 1.0 289.10 2.14 1.5
N 1s ∗∗ 399.92 2.35 6.5 100.0 399.56 2.48 5.3 100.0
S 2p Sulphide 163.00 1.70 2.1 37.3 163.00 1.70 1.6 52.3
Sulphide 164.00 1.70 50.9 164.00 1.70 28.1
SO2, −SO3, −SO4 168.00 1.70 11.8 168.00 1.70 19.6
O 1s OH 531.68 2.29 12.7 70.0 531.54 2.30 13.8 60.8
OH2 533.28 2.29 21.7 533.00 2.30 27.0
O2− 530.18 2.29 8.3 530.04 2.30 12.2
∗ full width at half maximum∗∗ width of the spectral line show the presence of many groups containing N, but the shape of the spectrum does not permit to isolatethem; typical width of the spectral line amounts to 1.7 eV
as a result of an increased acid groups’ exposition at thewool surface.
The results of the PCD measurements confirm theacidic character of wool surface and an enzymatic bath anddemonstrate that the optimum time of enzymatic treatmentamounts to about 35–45 min. After that period a plateau inthe PCD potential for wool fibres can be seen.
Also, the enzymatic treatment causes a change in theisoelectric point (IEP) value of wool, as demonstrated bythe electrokinetic measurements (Fig. 5). With an increasein enzyme concentration the IEP value shifts in the direc-tion of more acidic pH (from 3.8 for untreated wool to 3.7for wool after 1% enzymatic treatment, and 3.45 for wool
Fig. 5 Changes in the IEP value of wool after enzymatic treatment(1%, 4% o.w.f. of Perizym LAN, 60 min)

Physicochemical Changes on Wool Surface after an Enzymatic Treatment 135
after 4% enzymatic treatment). This can be attributed tothe better exposition of acid groups at the wool surfaceafter enzymatic treatment.
A similar IEP value for untreated wool (3.6) was re-cently obtained by Jocic et al. [32], using EKA streamingcurrent measurements.
Most likely the changes in IEP value, as well as inPCD potential, during the enzymatic treatment of wool arethe result of enzyme-initiated oxidation reactions. As canbe seen from the XPS results specified below (Table 1),a slight increase in SO2, SO3, SO4 groups’ concentra-tion, from 0.248% (0.248% = 11.8% of 2.1% of totalelemental concentration) for untreated sample to 0.314%(0.314% = 19.6% of 1.6% of total elemental concentra-tion) can be observed.
The changes in PCD potential for enzymatic bath,shown in Fig. 4, correspond well with the results obtainedby the HPLC method (Fig. 6). In the enzymatic bath 18amino acids were analysed. Aspartic acid, as well as me-thionine and cysteine, two sulphur containing amino acidsshowed increased concentrations (Fig. 6).
The increase in the electronegative PCD potential canbe explained by the increase in the aspartic acid concentra-tion in the enzymatic bath released during the interactionof wool with enzymes. However, the changes in the me-thionine and cysteine concentration may suggest changesin the structure of the cuticle cells.
The data obtained by the XPS method (Table 1, Fig. 7)show the changes in the elemental concentration of C,N, S, and O on the wool surface after enzymatic treat-ment, as compared to untreated wool. The increase in theatomic concentration of carbon, from 78.6% for untreatedwool to 79.4% for wool after enzymatic treatment, andthe decrease in the atomic concentration of nitrogen from6.5% for untreated wool to 5.3% for wool after enzymatic
Fig. 6 Changes in amino acid concentration during the enzymatictreatment of wool (4% o.w.f. of Perizym LAN)
Fig. 7 The review spectrum of untreated wool fabric samples (S)and samples after enzymatic treatment (E) (4% o.w.f. of PerizymLAN, 60 min) obtained by XPS-method
treatment, suggest an enrichment of acid groups on thewool surface, which may be confirmed by the C/N ratio,which increased from 12.1 for untreated to 15.0 for en-zyme treated wool. The reduction in the sulphur content(from 2.1% to 1.6%) on the wool surface following enzy-matic treatment corresponds well with the increase in theconcentration of amino acids (containing sulphur) in theenzymatic bath (Fig. 6).
The increase in the atomic concentration of oxygen(Table 1) suggests an increased amount of hydrophilicgroups on the wool surface. This fact can be confirmed bythe results of the contact angle measurements (Table 2).Following enzymatic treatment the contact angle is dis-tinctly decreased, from 122.5 for untreated wool to 108and even 102, but the wool fabric surface is still hy-drophobic (Θ > 90). The contact angle value obtainedfor wool after an intensive treatment (4% o.w.f. of en-zyme) equals the one for wool samples with chitosan de-posited.

136 A. Walawska et al.
Table 2 Changes in the contact angle (with water) of wool modifiedby enzymatic treatment (1%; 4% o.w.f. of Perizym LAN, 40 min)and chitosan (deposition 1.7% o.w.f.)
Wool samples Contact angle Θ [deg]
Untreated 122.5±4
After 1% enzymatic treatment 108±2
After 4% enzymatic treatment 102±2
After 1% enzymatic treatment 101.5±2and 1.7% chitosan deposition
The hydrophobic nature of wool is known to be dueto the specific properties of its exocuticles and epicuticles.The exocuticle is hydrophobic because it contains a highdegree (∼ 35%) of disulphite crosslinkage in the A-layer.The epicuticle surrounds each cuticle cell of the wool fibre,and it consists of fatty acid (∼ 25% by mass), the maincomponent of which is 18-methyleicosanoic acid. Fattyacid chains of 18-methyleicosanoic acid are covalentlybound to the wool fibre as a thioester to cysteine and areoriented away from the fibre to produce a “polyethylene-like” layer at the fibre surface, thus making the epicuti-cle hydrophobic [7, 33]. Even after the removal of greaseby aqueous scouring or solvent extraction, wool main-tains its hydrophobic character. The change in the contactangle for the enzyme-modified wool and chitosan deposi-tion (101.5 ±2) corresponds well with the data obtainedby Jocic et al. (100 ±2) [7] using the Wilhelmy balancemethod.
Summary and Conclusions
Based on the experimental results obtained during thiswork, the following conclusions can be drawn.
1. Changes in the topography of wool fibres, confirmed bySEM micrographs, can be observed as a result of theenzymatic treatment of wool fabric.
2. An enzymatic treatment causes the release of a signifi-cant amount of amino acids containing sulphur (me-thionine and cysteine) as well as an aspartic acid fromthe wool surface.
3. As a consequence of enzymatic treatment, an increasecan be observed in the acidity of the wool surface,which is demonstrated by a distinct increase in the elec-tronegative PCD potential of wool fabric, the reductionof IEP value, and by XPS results.
4. Moreover, an enzymatic treatment of wool causes anincrease in the amount of hydrophilic groups at the sur-face. This is proved by the increase in the elementalconcentration of oxygen, as obtained by XPS, and theincrease in the wettability of enzyme-modified woolsurfaces.
5. The results obtained prove that the PCD potentialmeasurement is a very sensitive method for determin-ation of the charge on a wool surface. In connectionwith other methods (XPS, HPLC), it allows the ex-planation of the phenomena which occur on modifiedwool fibre surfaces.
Acknowledgement This work was financially supported by thePolish State Committee for Scientific Research (research projectNo 7 T09B 035 20).
References1. Virnich A, Thomas H,
Blankenburg G, Hoecker H (1990)Melliand Textilberichte 11:887
2. Przygocki W, Wlochowicz A (1983)Textile Review (PrzegladWlokienniczy) 7–8–9:279
3. Gregorski KS, Pavlath AE (1980)Textile Res Journal 50:42–46
4. Rakowski W (1989) MelliandTextilberichte 70:780–785
5. Ryu J, Wakida T, Takagishi T (1991)Textile Res Journal 61:595–601
6. Byrne KM, Godau J (1995)Proceedings of the 9th Int Wool TextRes Conf, vol IV, p 415–421
7. Jocic D, Jovancic P, Petrovic ZL,Bertran E, Navarro A, Julia MR,Erra P (2002) Proceedings of 2ndAUTEX Conference, p 299–312
8. Chi-wai K, Kwong Ch, Chun-wan Y(2003) AUTEX Research J3(4):194–205
9. Haefely HR (1989) Textilveredlung24:271
10. Fornelli S (1994) MelliandTextilberichte 74:120
11. Heine E, Hoecker H (1995) Rev ProgColour 112:57
12. Cegarra J (1996) J Soc Dyers Colour112:326
13. Riva A, Cegarra J, Prieto R (1993) JSoc Dyers Colour 109:210
14. Jovancic P, Jocic D, Dumic J (1998) JText Inst, Part 1, Text Sci Techn89(2):390
15. Jovancic P, Jocic D, Erra P, Molina R,Julia MR (1998) EuropeanMicroscopy and Analysis 51:15
16. Rybicki E, Filipowska B,Walawska A, Wlochowicz A (1999)Polish Pat Appl No. P-33 23 27
17. Rybicki E, Filipowska B, Walawska A(1999) International Seminar TextileScience for 21st Century. June 8–9,Guimaraes, Portugal
18. Filipowska B, Walawska A, Rybicki E(2000) L’Industrie Textile 1317:21–22
19. Rybicki E, Filipowska B, Walawska A(2000) Fibres & Textiles in EasternEurope 2–3:62–65
20. Filipowska B, Rybicki E, Walawska A(2002) In: Chitosan in Pharmacy andChemistry, Muzzarelli RAA,Muzzarelli C (eds) ATEC Italy,p 263–270

Physicochemical Changes on Wool Surface after an Enzymatic Treatment 137
21. Rybicki E, Filipowska B, Walawska A(2001) Proceedings of the 40thInternational Detergency Conference,April 30th–May 3rd, Strasbourg,France
22. Anson ML (1938) J Gen Physiol22:79–82
23. Polish-European Standard PN-EN25077:1998
24. Polish – European Standard PN-ENISO 3759:1008
25. Allen JS (2003) J Colloid InterfaceSci 261(2):281
26. Hoecker H (2002) Pure Appl Chem74(3):423–427
27. McCord M (2001) National TextileCenter Annual Report: NovemberC99–S09:1–12
28. Smith JR, Eaton PJ, Waddington K,Alexander C, Tsibouklis J, Swift JA(2000) The Proceedings of The 10thInt Wool Tex Res Conf HH-2, p 1–9
29. Dupres V, Camesano T, Langevin D,Checco A, Guenoun P (2004) JColloid Interface Sci 269:329–335
30. Scofield JH, Hartree-Slater (1976)J Electron Spectroscopy and RelatedPhenomena 8:129–137
31. Davidson RS, Xue Y (1994) JSDC110:24–29
32. Radetic M, Jocic D, Jovancic P,Petrovic ZL, Thomas H (2003) TheProceedings of The 3rd AUTEXConference Book I, p 309–314
33. Kalkbrenner K, Koerner A,Hoecker H, Rivett DE (1990) TheProceedings of the 8th Int Wool TexRes Conf Christchurch

Progr Colloid Polym Sci (2006) 132: 138–144DOI 10.1007/2882_026© Springer-Verlag Berlin Heidelberg 2006Published online: 9 March 2006
Astrid RoosjenWillem NordeHenny C. van der MeiHenk J. Busscher
The Use of Positively Chargedor Low Surface Free Energy Coatingsversus Polymer Brushesin Controlling Biofilm Formation
Astrid Roosjen · Henny C. van der Mei ·Henk J. Busscher ()Department of Biomedical Engineering,University Medical Center Gronin-gen and University of Groningen,Antonius Deusinglaan 1,9713 AV Groningen, The Netherlandse-mail: [email protected]
Willem NordeLaboratory of Physical Chemistry andColloid Science,Wageningen University, Dreijenplein 6,6703 HB Wageningen, The Netherlands
Abstract Biofilm formation onbiomaterials implant surfaces andsubsequent infectious complicationsare a frequent reason for failure ofmany biomedical devices, such astotal hip arthroplasties, vascularcatheters and urinary catheters. Thedevelopment of a biofilm is initiatedby the formation of a conditioningfilm of adsorbed macromolecules,such as proteins, followed by ad-hesion of microorganisms, whereafter they grow and anchor throughsecretion of extracellular poly-meric substances. Adhesion ofmicroorganisms is influenced bythe physico-chemical properties ofthe biomaterial surface. Positivelycharged materials stimulate bacterialadhesion, but prevent growth ofadhering bacteria. The use of lowsurface free energy materials did
not always reduce in vitro adhesionof bacteria, but has been foundbeneficial in in vivo applicationswhere fluctuating shear forces pre-vail, like on intra-oral devices andurine catheters. Polymer brusheshave shown a very high reduction inin vitro adhesion of a great variety ofmicroorganisms. However, for clini-cal application, the long term stabilityof polymer brushes is still a limitingfactor. Further effort is thereforerequired to enhance the stabilityof polymer brushes on biomaterialimplant surfaces to facilitate clinicaluse of these promising coatings.
Keywords Biofilm ·Biomaterial centered infection ·Microbial adhesion ·Polymer brushes · Surface free energy
Introduction
Biomaterials are materials foreign to the human body thatare used in medicine to replace, support or restore bodyfunction. Applications range from central venous and uri-nary catheters to more complex devices such as prostheticjoints and heart valves. The risk of biomaterial centeredinfection (BCI) is a key factor limiting their use [1]. Theincidence of this type of infections varies for each appli-cation for instance 4% for hip prostheses [2] and 10–20%for urinary catheters (see Table 1). In BCI microorgan-isms are present in close association with the biomaterialsurface forming a so-called biofilm. Different species ofmicroorganisms are found in BCI that are often commen-
sals of the skin or the intestines, for instance Staphylococ-cus epidermidis, often found in hip prosthesis infectionsand Escherichia coli in urinary catheter infections [2] (seeTable 1). BCI can cause severe problems, from disfunction-ing of the implanted device to lethal sepsis of the patient.Furthermore, treatment of BCI is complicated, as microor-ganisms in a biofilm are more resistant to antibiotics [3]than their planktonic counterparts [4]. As a consequence,the only remedy for a BCI is removal of the infected im-plant at the expense of considerable costs and patientssuffering. A more convenient way to deal with this prob-lem is to prevent the development of an infectious biofilmon the biomaterial surface. To achieve this, a thorough un-derstanding of the development of biofilms is necessary.
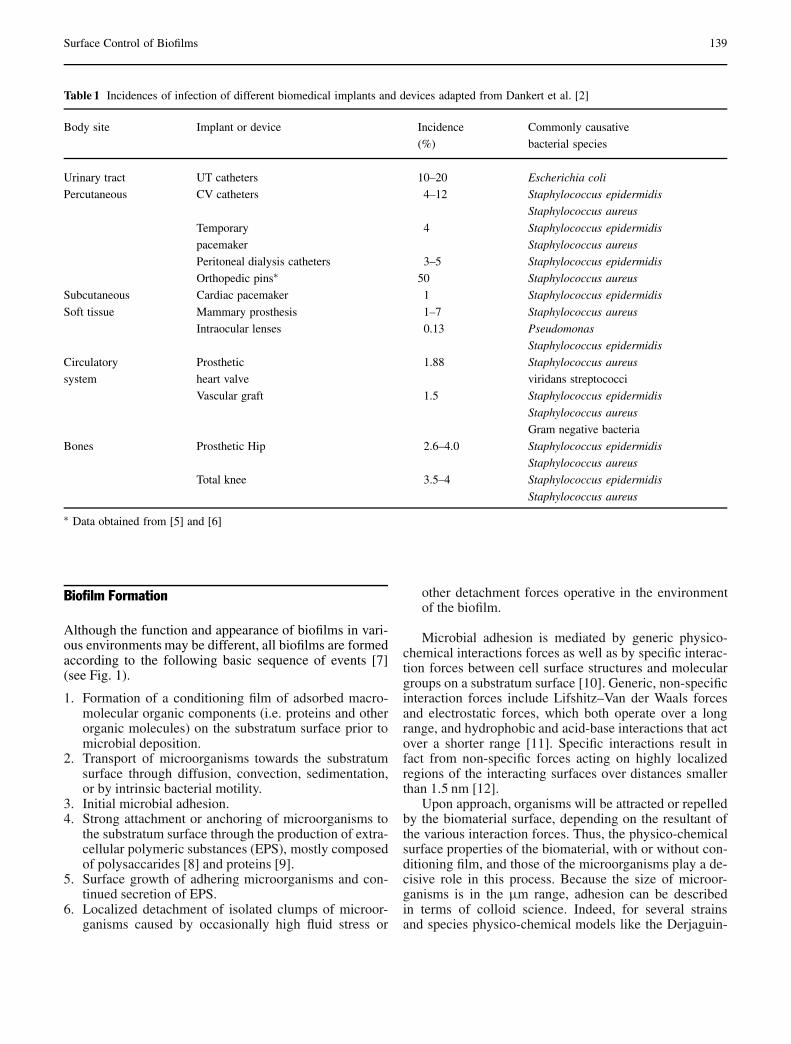
Surface Control of Biofilms 139
Table 1 Incidences of infection of different biomedical implants and devices adapted from Dankert et al. [2]
Body site Implant or device Incidence Commonly causative
(%) bacterial species
Urinary tract UT catheters 10–20 Escherichia coli
Percutaneous CV catheters 4–12 Staphylococcus epidermidis
Staphylococcus aureus
Temporary 4 Staphylococcus epidermidis
pacemaker Staphylococcus aureus
Peritoneal dialysis catheters 3–5 Staphylococcus epidermidis
Orthopedic pins∗ 50 Staphylococcus aureus
Subcutaneous Cardiac pacemaker 1 Staphylococcus epidermidis
Soft tissue Mammary prosthesis 1–7 Staphylococcus aureus
Intraocular lenses 0.13 Pseudomonas
Staphylococcus epidermidis
Circulatory Prosthetic 1.88 Staphylococcus aureus
system heart valve viridans streptococci
Vascular graft 1.5 Staphylococcus epidermidis
Staphylococcus aureus
Gram negative bacteria
Bones Prosthetic Hip 2.6–4.0 Staphylococcus epidermidis
Staphylococcus aureus
Total knee 3.5–4 Staphylococcus epidermidis
Staphylococcus aureus
∗ Data obtained from [5] and [6]
Biofilm Formation
Although the function and appearance of biofilms in vari-ous environments may be different, all biofilms are formedaccording to the following basic sequence of events [7](see Fig. 1).
1. Formation of a conditioning film of adsorbed macro-molecular organic components (i.e. proteins and otherorganic molecules) on the substratum surface prior tomicrobial deposition.
2. Transport of microorganisms towards the substratumsurface through diffusion, convection, sedimentation,or by intrinsic bacterial motility.
3. Initial microbial adhesion.4. Strong attachment or anchoring of microorganisms to
the substratum surface through the production of extra-cellular polymeric substances (EPS), mostly composedof polysaccarides [8] and proteins [9].
5. Surface growth of adhering microorganisms and con-tinued secretion of EPS.
6. Localized detachment of isolated clumps of microor-ganisms caused by occasionally high fluid stress or
other detachment forces operative in the environmentof the biofilm.
Microbial adhesion is mediated by generic physico-chemical interactions forces as well as by specific interac-tion forces between cell surface structures and moleculargroups on a substratum surface [10]. Generic, non-specificinteraction forces include Lifshitz–Van der Waals forcesand electrostatic forces, which both operate over a longrange, and hydrophobic and acid-base interactions that actover a shorter range [11]. Specific interactions result infact from non-specific forces acting on highly localizedregions of the interacting surfaces over distances smallerthan 1.5 nm [12].
Upon approach, organisms will be attracted or repelledby the biomaterial surface, depending on the resultant ofthe various interaction forces. Thus, the physico-chemicalsurface properties of the biomaterial, with or without con-ditioning film, and those of the microorganisms play a de-cisive role in this process. Because the size of microor-ganisms is in the µm range, adhesion can be describedin terms of colloid science. Indeed, for several strainsand species physico-chemical models like the Derjaguin-

140 A. Roosjen et al.
Fig. 1 Schematic, sequential presentation of the steps involved inbiofilm formation. Reprinted from Meth. Enzymol. 310, Modelsfor studying initial adhesion and surface growth in biofilm forma-tion on surface, 523–533, Copyright 1999, with permission fromElsevier
Landau-Verwey-Overbeek (DLVO) theory of colloidal sta-bility have been successful in qualitatively explaining mi-crobial adhesion to solid substrata [8, 13].
Prevention of Biofilm Formation
Surgeons take considerable effort in preventing the con-tamination of implants with microorganisms during im-plantation. Although application of prophylactic antibi-otics and better operation hygiene have reduced the inci-dence of BCI over the last four decades, still a significantnumber of patients suffer from such infections [2, 14].
Different strategies may prevent biofilm formation andthus BCI. In general, it is aimed to reduce the attractiveforce between microorganisms and a biomaterial surfaceby optimizing the physico-chemical surface properties ofthe biomaterial. For instance more negatively charged bio-materials [15], biomaterials coated with albumin [16], hep-arin [17, 18] or polysaccharide [19, 20] have shown to at-tract less bacteria. However, the most promising and most
extensively studied methods to prevent biofilm formationare positively charged coatings, low surface free energycoatings and surfaces covered with a polymer brush. Thesethree types of surfaces will be evaluated and compared inthis review.
Positively Charged Coatings
Despite the fact that bacteria adhere more readily topositively charged surfaces than to negatively chargedones [21, 22], there are some aspects of biofilm formationon positively charged surfaces that deserve their furtherconsideration. E. coli and P. aeruginosa hardly showedany growth after their adhesion to positively chargedpoly(methacrylate) surfaces [21], although S. aureus andS. epidermidis were able to grow on these surfaces. How-ever, on negatively charged poly(methacrylate) surfaces,growth was found for all four species.
These observations may be explained by the strongbinding of the negatively charged bacteria [23] to posi-tively charged surfaces through attractive electrostatic in-teractions, impeding elongation and division needed forbacterial growth. It has indeed been demonstrated that asthe binding strength of P. aeruginosa AK1 to substrata in-creases, their surface growth reduces [24].
Also in vivo, positively charged surfaces have appearedpromising in certain applications. Differently chargedpoly(methacrylate) coated discs have been seeded withE. coli or P. aeruginosa and implanted in rats [25]. After48 h, only 50% of the positively charged disks containedviable E. coli, while on all negatively charged disks vi-able bacteria were found. P. aeruginosa, however, wasisolated from both positively and negatively charged sur-faces, probably because this bacterium can circumvent theeffect of the positive charge through production of extra-cellular polymeric substances.
Low Surface Free Energy Coatings
The surface free energy (s.f.e.) of a material is a measurefor the work required to enlarge its surface (mJ m−2). Atconstant pressure, constant temperature and if the surfacecomposition remains constant, the s.f.e. equals the surfacetension (γSV) of the material against its vapor [26]. To de-termine the value of γSV and hence of the s.f.e. of a solid,contact angles with several liquids with known s.f.e. (γLV)are required. Thomas Young’s equation relates the surfacefree energies and the contact angle (θ) based on the forcebalance at the three-phase boundary [27]:
γSV = γSL +γLV cos θ (1)
Equation 1 can only be solved using different methods forwhich additional assumptions are required. These methodsare subject to serious controversy in surface science [26]

Surface Control of Biofilms 141
and lead to different γSV values for one and the same sur-face.
Therefore, literature values of γSV are mainly used asa relative measure for the s.f.e.
The type of forces determining the s.f.e. are Lifshitz–Van der Waals interactions and non-dispersive interactionslike hydrogen bonding, stacking between π-electrons andion pairing [26]. The value of γSV is determined mainlyby the chemical nature and structure of the surface. Valuesfor some constituent groups decrease in the order CH2(36 mJ m−2) > CH3 (30 mJ m−2) > CF2 (23 mJ m−2) >CF3 (15 mJ m−2) [29]. The low s.f.e. of materials contain-ing the CF2 of CF3 group may be explained by the highlyelectron-negative F atom that is able to withdraw electronsfrom the carbon backbone leading to a very inert, noblegas like configuration [30]. In water minimal interactionpossibilities between this inert surface and a bacterium areexpected, which should lead to minimal bacterial adhesionand easy removal of attached bacteria. From a thermody-namic viewpoint, it has also been predicted that bacteriawith a s.f.e. higher than water, which constitute the ma-jority of the bacterial population, in for instance dentalplaque [31], have the lowest interaction energy with lows.f.e. surfaces [32].
Indeed fouling resistant gorgonian corals were foundto have low s.f.e. (23–27 mJ m−2) [33]. Also, the firstbacterial adhesion tests on materials with different s.f.e.showed lowest bacterial adhesion on materials with thelowest surface free energies [34]. In in vitro experiments,Everaert et al. [35] showed that fluoro-alkylsiloxane layerschemisorbed to silicone rubber surfaces reduced bothyeast (Candida albicans and Candida tropicalis) andbacterial (Streptococcus salivarius, S. epidermidis) ad-hesion by 50 to 77% as compared to original siliconerubber. Furthermore, microorganisms were more easilydetached when passing an air-liquid interface. Tsiboukliset al. [36] developed films of poly(perfluoroacrylate) andpoly(methylpropenoxyfluoroalkylsiloxane) with surfacefree energies as low as 12.2 and 5.6 mJ m−2 respectively.Retention of Pseudomonas and S. aureus after a wash-ing step showed more than 95% reduction after 6 weeksof incubation as compared to glass controls. Adhesionin a stationary state of one of the initial colonizers ofhuman teeth, Streptococcus sanguis, was determined onlow s.f.e. fluoroethylenepropylene (FEP) and high s.f.e.glass [37]. On FEP adhesion was 0 to 94% lower than onglass depending on the buffer concentration and shear rate.Furthermore bacteria were more easily detached from theFEP surface through shear forces.
On the other hand, for low s.f.e. bacteria, a preferencefor low s.f.e. surfaces is predicted by the thermodynamic ap-proach of Absolom et al. [32]. This effect may be explainedmechanistically by hydrophobic interaction between thelow s.f.e. surface and the low s.f.e. bacterium. Adhesion isdriven by release of water from both the surface and thebacterium thus leading to an increase in entropy [38].
Indeed a bacterial preference for low s.f.e. surfaces hasbeen shown by several authors [31, 32, 39]. However, inan in vitro study, low density poly(ethylene) films weretreated with tetrafluoromethane plasma, which resulted ina dramatic reduction in s.f.e., but which did not show a sig-nificant reduction in bacterial adhesion [40].
In vivo studies mostly showed a beneficial effect ofa low s.f.e. material. For instance in a study by Quirynenet al. [41], four surfaces with surface free energies rang-ing from 20 to 88 mJ m−2 were attached to the teeth ofhealthy humans. The low s.f.e. surfaces attracted signifi-cantly less microorganisms after 9 days and those attachedwere less tightly associated with the surface as comparedto bacteria adhering on high s.f.e. surfaces. Treatment ofenamel surfaces with silicone oil, which lowered its s.f.e.,resulted in a significant reduction in plaque formation [42].Another study indicated, that after three months the ex-posed areas of low s.f.e. FEP coated abutments (trans-mucosal dental implants) displayed lower bacterial colo-nization and a lower plaque maturation as compared tobare titanium [43]. However, in the areas covered by thegingiva, where less mechanical shear forces are present,this effect was not apparent. Finally, modification of a sili-cone rubber voice prosthesis with perfluoroalkylsiloxaneof 8 fluorocarbon units resulted in reduced biofilm forma-tion in vivo [44].
In the in vivo examples mentioned above, low adhesionnumbers were obtained when low s.f.e. surfaces were ap-plied in combination with high shear forces, induced byhigh flow or passage of an air-liquid interface. Thus, inmedical applications where high shear forces are opera-tive, like oral devices, urine catheters and voice prostheses,low s.f.e. surfaces are promising. Fluoropolymers are es-pecially suitable for use as coatings on biomaterials as theyare known for their chemical and thermal stability [30].However, applications that are completely internal like ar-tificial hips, artificial veins and intraocular lenses are stillprone to biofilm buildup and thus need a more general anti-adhesive coating, like e.g. a polymer brush.
Polymer Brushes
Polymer brushes are polymer chains that are attached toa surface and stretch out into the surrounding medium.Brushes that are designed to prevent biofilm buildup areusually made from poly(ethylene oxide) (PEO), whichare highly water soluble and non-toxic [45]. As the PEOchains are highly mobile [46] and attain extremely largeexclusion volumes [47], they make the surface difficultto approach by incoming proteins or bacteria. Penetra-tion or compression would lead to an increase in thelocal concentration of PEO, which, in turn, would leadto a repulsive osmotic interaction. Therewith, a PEO-brush forms a steric barrier preventing close approach,thus keeping the protein or bacterium at a distance where

142 A. Roosjen et al.
the attractive Lifshitz–Van der Waals interaction is rela-tively low. The weak residual attraction generally leadsto low adsorption and adhesion, if occurring at all, andto easy removal of biological matter from a brushedsurface.
Protein adsorption on PEO brushes has been ex-tensively studied and has recently been reviewed [48].In general, PEO brushes greatly reduce and sometimeseven completely prevent protein adsorption. Easy re-moval of proteins from PEO coatings has also been de-scribed [49, 50].
One of the first to study bacterial adhesion to PEOgrafted surfaces were Bridgett et al. [51], who usedcopolymers of PEO and polypropylene oxide (PPO) of dif-ferent lengths, where the PPO block anchored the PEOchains to the surface. All copolymers induced significantadhesion reductions (up to 97%) of three clinical isolatesof S. epidermidis. Also another strain of S. epidermidis andthe skin borne bacteria Serratia marcescens were reducedby about 90% applying a coating of this copolymer with99 ethylene oxide (EO) units [52]. Coating with a copoly-mer of poly(L-lysine) and PEO with 47 EO units reducedadhesion of Staphylococcus aureus by 89 to 93% on ti-tanium surfaces [53]. Self-assembled monolayers of only6 EO units even showed more than 99.5% reduction ofboth a medical S. epidermidis strain and a marine Delayamarina strain [54]. Covalent attachment of PEO with 66EO units to polyurethane resulted in 90 and 95% reductionof adhesion of S. epidermidis and E. coli, respectively [55].Adhesion of Pseudomonas sp. was reduced by more than99% by covalently attaching PEO chains with 110 PEOunits to PET surfaces [56]. Reductions obtained in abovementioned studies are much higher than obtained with lowsurface energy coatings. In nearly all papers cited, the ad-hesion methodology employed some kind of washing step,which may cause detachment and contribute to the lowadhesion numbers [57]. However, in a study by Razatoset al. [58], adhesion of E. coli was determined in situ with-out washing steps and still a reduction of more than 99%was found.
In our studies on well characterized covalently at-tached PEO brushes, adhesion of S. epidermidis, S. au-reus, S. salivaris and E. coli [59] was reduced by morethan 94%. Reductions of Pseudomonas aeruginosa andthe yeast strains Candida albicans and Candida tropicalisamounted about 80%, thus indicating that different micro-bial species can adhere in different numbers to the samePEO brush. More hydrophobic microorganisms showedmore adhesion and stronger adhesion of the yeast strainscould be attributed to stronger Lifshitz–Van der Waalsforces, due to their larger size. We have also shown thata PEO brush is effective at both 20 C and 37 C and thatthose microorganisms that do adhere can very easily be re-moved [60]. As for protein adsorption [61–64], the longestPEO chains were found to be most effective in preventingadhesion of bacteria and yeast [60]. This confirms the the-
ory of attenuation of particle-substratum interaction forcesby a brush [65–68].
Despite these excellent in vitro results, little progresshas been made in vivo. For instance, under clinical con-ditions, blood proteins have been demonstrated to adsorbextensively to a PEO coated polymer, in contrast to in vitroresults [69]. Also, in vivo research on PEO coatings inthe oral cavity showed poor results [70], despite excellentin vitro reductions in salivary protein adsorption and oralbacterial adhesion to PEO coatings on glass and hydrox-yapatite [70, 71]. Possibly, the durability of the thin layerof grafted PEO chains in the oral cavity was not sufficientover a clinically relevant time scale.
Recently we have developed a method to easily assessthe stability of a PEO coating, by using a marker bacteriumto directly determine the effectivity of a PEO coating [72].We showed that our coating was only stable for at most48 hours depending on the biological fluid it was exposedto. In another study, a PEO coating remained stable forless than a month [73]. In both cases, degradation mostprobably does not occur at the alkyl or ether bonds of thePEO polymer itself, as these can only be degraded by ag-gressive chemicals [74], high temperatures [75] or specificbacteria [76]. The grafting of the PEO chain to the surfaceis, in general, the weak point of a PEO coating. For in-stance, the often used organosilane linkage is susceptibleto hydrolytic cleavage [77]. In our study, the PEO chainswere coupled by a Si−O−C linkage to the glass substra-tum, which may readily hydrolyze as well [78]. In casethe polymer chains are grafted at the surface by physi-cal adsorption, they can be expected to desorb over time,therewith losing their effectiveness.
Conclusions
This review has shown that positively charged materials,low s.f.e. materials and polymer brushes show potential inpreventing BCI. Positively charged materials have shownto be effective in preventing growth of certain strains andspecies, while other stains readily adhere and grow onthem. Possibly, positively charged surfaces can only beapplied in situations where there is little supply of new or-ganisms, such as for totally implanted surfaces, becausea large supply of new organisms will cause adhesion ofviable organisms on the organisms killed or hampered intheir growth by the positive charge. Also low s.f.e. mate-rials are not generally applicable as some bacterial strainsare able to adhere to them or even show preference forthese materials. However, for applications where fluctu-ating shear forces are operative, excellent in vivo resultshave been obtained. Theoretically, polymer brushes shouldbe able to reduce adhesion of any bacterium and, in-deed, have shown a very high effectiveness in preventingbacterial adhesion in vitro. Whether or not those bacte-ria that do successfully adhere to a polymer brush will

Surface Control of Biofilms 143
also grow and form a biofilm, has not yet been estab-lished. Problems concerning durable attachment of thepolymer chains to the surface preventing successful in vivo
applications with these coatings could be overcome bydeveloping a stable coupling between a surface and thebrush.
References1. Gristina AG (1987) Science 237:15882. Dankert J, Hogt AH, Feijen J (1986)
Crit Rev Biocompat 2:2193. Costerton JW, Stewart PS,
Greenberg EP (1999) Science284:1318
4. Gilbert P, Das J, Foley I (1997) AdvDent Res 11:160
5. Lee-Smith J, Santy J, Davis P,Jester R, Kneale J (2001) J OrthopNurs 5:37
6. Mahan J, Seligson D, Henry SL,Dobbins J (1991) Orthopedics 14:305
7. Escher A, Characklis WG (1990)Modeling the initial events in biofilmaccumulation. In: Characklis WG (ed)Biofilms. Wiley, New York,p 445–486
8. Azeredo J, Visser J, Oliveira R (1999)Colloids Surf B 14:141
9. Dufrene YF, Vermeiren H, Van derLeyden J, Rouxhet PG (1996)Microbiology 142:855
10. Christensen GD, Baddour LM,Hasty DL, Lowrance JH,Simpson WA (1989) Microbial andforeign body factors in thepathogenesis of medical deviceinfections. In: Bisno AL,Waldvogel FA (eds) InfectionsAssociated with Indwelling MedicalDevices. American Society ofMicrobiology, Washington, DC,p 27–59
11. van Oss CJ (1991) Biofouling 4:2512. Busscher HJ, Weerkamp AH (1987)
FEMS Microbiol Rev 46:16513. Lyklema J, Norde W, van
Loosdrecht MM, Zehnder AB (1989)Colloids Surf 39:175
14. Donlan RM (2001) Emerg Infect Dis7:277
15. Hogt AH, Dankert J, Feijen J (1986)J Biomed Mater Res 20:533
16. Keogh JR, Eaton JW (1994) J LabClin Med 121:537
17. Paulsson M, Gouda I, Larm O,Ljungh A (1994) J Biomed Mater Res28:311
18. Nomura S, Lundberg F,Stollenwerk M, Nakamura K,Ljungh A (1997) J Biomed Mater Res38:35
19. Morra M, Cassineli C (1999)J Biomater Sci Polym Ed 10:1107
20. Holland NB, Qiu YX, Ruegsegger M,Marchant RE (1998) Nature 392:799
21. Gottenbos B, Grijpma DW, Van derMei HC, Feijen J, Busscher HJ (2001)J Antimicro Chemother 48:7
22. Harkes G, Feijen J, Dankert J (1991)Biomaterials 12:853
23. Jucker BA, Harms H, Zehnder AB(1996) J Bacteriol 178,18:5472
24. Gottenbos B, Van der Mei HC,Busscher HJ (2000) J Biomed MaterRes 0:208
25. Gottenbos B, Van der Mei HC,Klatter F, Grijpma DW, Feijen J,Nieuwenhuis P et al. (2003)Biomaterials 24:2707
26. Norde W (2003) Interfacial tension.In: Norde W (ed) Colloid andinterfaces in life sciences. MarcelDekker Inc., New York, p 47–61
27. Young T (1805) Phil Trans Roy Soc95:65
28. Sharma PK, Rao KH (2002) AdvColloid Interface Sci 98:341
29. Tsibouklis J, Nevell TG (2003) AdvMater 15:647
30. Thomas RR (1999) Materialproperties of fluoropolymers andperfluoroalkyl-based polymers. In:Hougham G, Cassidy PE, Johns K,Davidson T (eds) Fluoropolymers 2:Properties. Plenum Press, New York,p 47–65
31. Weerkamp AH, Quirynen M,Marechal M, Van der Mei HC, VanSteenberghe D, Busscher HJ (1989)Microb Ecol Health Dis 2:11
32. Absolom DR, Lamberti FV,Policova Z, Zingg W, Van Oss CJ,Neumann AW (1983) Appl EnvironMicrobiol 46:90
33. Vrolijk NH, Targett NM, Baier RE,Baier AE (1990) Biofouling 2:39
34. Dexter SC, Sullivan JD, Williams IIJ,Watson SW (1975) Appl Microbiol30:298
35. Everaert EPJM, Van der Mei HC,Busscher HJ (1998) Coll SurfB:Biointerfaces 10:179
36. Tsibouklis J, Stone M, Thorpe AA,Graham P, Peters V, Heerlien R et al.(1999) Biomaterials 20:1229
37. Busscher HJ, Sjollema J, Van der MeiHC (1990) Relative importance ofsurface free energy as a measure ofhydrophobicity in bacterial adhesionto solid surfaces. In: Doyle RJ,Rosenberg M (eds) Microbial CellSurface Hydrophobicity. AmericanSociety for Microbiology,Washington DC, p 335–359
38. Norde W (2003) Water. In: Norde W(ed) Colloid and interfaces in lifesciences. Marcel Dekker Inc., NewYork, p 47–61
39. Bakker DP, Huijs FM, De Vries J,Klijnstra JW, Busscher HJ, van derMei HC (2003) Coll SurfB:Biointerfaces 32:179
40. Olde Riekerink MB, Engbers GHM,Van der Mei HC, Busscher HJ,Feijen J (2001) Microbial adhesiononto superhydrophobic fluorinated lowdensity poly(ethylene) films. In: OldeRiekerink MB (ed) Thesis: Structuraland Chemical Modification of PolymerSurfaces by Gas Plasma Etching.Printpartners Ipskamp, Enschede,p 65–82
41. Quirynen M, Marechal M,Busscher HJ, Weerkamp A, Arends J,Darius PL (1989) J Dent Res 68:796
42. Rolla G, Ellingsen JE, Herlofson B(1991) Biofouling 3:175
43. Quirynen M, Van der Mei HC,Bollen CML, Van den Bossche LH,Doornbusch GI, Van Steenberghe Det al. (1994) J Periodontology 65:162
44. Everaert EPJM, Mahieu HF, Van deBelt-Gritter B, Peeters AJGE,Verkerke GJ, Van der Mei HC et al.(1999) Arch Otolaryngol Head NeckSurg 125:1329
45. Harris JM (1992) Poly(ethyleneglycol)Chemistry: Biotechnical andBiomedical Aplications. Plenum Press,New York
46. Harris JM (1992) Introduction toBiotechnical and biomedicalapplications of poly(ethylene glycol).In: Harris JM (ed)Poly(ethyleneglycol) Chemistry:

144 A. Roosjen et al.
Biotechnical and BiomedicalAplications. Plenum Press, New York,p 1–13
47. Ryle AP (1965) Nature 206:125648. Currie EPK, Norde W, Cohen
Stuart MA (2003) Adv Coll Interf Sci100:205
49. Zhu B, Eurell T, Gunawan R,Leckband D (2001) J Biomed MaterRes 56:406
50. Huang NP, Michel R, Voros J,Textor M, Hofer R, Rossi A et al.(2001) Langmuir 17:489
51. Bridgett MJ, Davies MC, Denyer SP(1992) Biomaterials 13:411
52. Marsh LH, Coke M, Dettmar PW,Ewen RJ, Havler M, Nevell TG et al.(2002) J Biomed Mater Res 61:641
53. Harris LG, Tosatti S, Wieland M,Textor M, Richards RG (2004)Biomaterials 25:4135
54. Ista LK, Fan H, Baca O, Lopez GP(1996) FEMS Microbiol Lett 142:59
55. Ki DP, Young SK, Dong KH,Young HK, Eun HBL, Hwal S et al.(1998) Biomaterials 19:851
56. Kingshott P, Wei J, Bagge-Ravn D,Gadegaard N, Gram L (2003)Langmuir 19:6912
57. Gomez-Suárez C, Busscher HJ, Vander Mei HC (2001) Appl EnvironMicrobiol 67:2531
58. Razatos A, Ong YL, Boulay F,Elbert DL, Hubbell JA, Sharma MMet al. (2000) Langmuir 16:9155
59. Roosjen A, Kaper HJ, Van derMei HC, Norde W, Busscher HJ(2003) Microbiology 149:3239
60. Roosjen A, Van der Mei HC,Busscher HJ, Norde W (2004)Langmuir 20:10949
61. Golander C-G, Herron JN, Lim K,Cleasson P, Stenius P, Andrade JD(1992) Properties of immobilizedPEG films and the interaction withproteins. In: Harris JM (ed)Poly(ethylene glycol) chemistry,Biotechnological and BiomedicalApplications. Plenum Press, NewYork, p 221–245
62. Prime KL, Whitesides GM (1993)J Am Chem Soc 115:10714
63. Gombotz WR, Guanghui W,Horbett TA, Hoffman AS (1991)J Biomed Mater Res 25:1547
64. Lee J, Martic PA, Tan JS (1989)J Coll Interf Sci 131:252
65. Jeon SI, Lee JH, Andrade JD,Gennes PG (1991) J Coll Sci 142:149
66. Szleifer I (1997) Biophys J 72:59567. Halperin A (1999) Langmuir 15:252568. Leckband D, Sheth S, Halperin A
(1999) J Biomater Sci Polym Ed10:1125
69. Park KD, Kim SW (1992)PEO-modified surfaces – In vitro, exvivo andin vivo blood compatibility.In: Harris JM (ed)Poly(ethyleneglycol) chemistry:biotechnical and biomedicalaplications. Plenum Press, New York,p 283–301
70. Olsson J, Van der Heijde Y,Holmberg K (1992) Caries Res 26:428
71. Olsson J, Carlen A, Holmberg K(1990) J Dent Res 69:1586
72. Roosjen A, De Vries J, Van derMei HC, Norde W, Busscher HJ(2005) J Biomed Mater Res Part B:Appl Biomater 73:347
73. Branch DW, Wheeler BC, Brewer GJ,Leckband DE (2001) Biomaterials22:1035
74. Bhatt MV, Kulkarni SU (1983)Synthesis 4:249
75. Han S, Kim C, Kwon D (1997)Polymer 38:317
76. Kawai F (2002) Appl MicrobiolBiotechnol 58:30
77. Hong HG, Jiang M, Sligar SG,Bohn PW (1994) Langmuir 10:153
78. Maas JH, Cohen Stuart MA,Sieval AB, Zuilhof H, Sudholter EJR(2003) Thin Solid Films 426:135

Progr Colloid Polym Sci (2006) 132: 145–151DOI 10.1007/2882_025© Springer-Verlag Berlin Heidelberg 2006Published online: 10 March 2006
Pradeep PareekHans-Jürgen P. AdlerDirk Kuckling
Tuning the Swelling Behaviorof Chemisorbed Thin PNIPAAm Hydrogel Layersby N,N-Dimethyl Acrylamide Content
Pradeep Pareek · Hans-Jürgen P. Adler ·Dirk Kuckling ()Institut für Makromolekulare Chemie undTextilchemie, Technische UniversitätDresden, 01062 Dresden, Germanye-mail:[email protected]
Abstract The synthesis of a se-ries of photo cross-linkableterpolymers of poly(N-isopropyl-acrylamide) (PNIPAAm) withN,N-dimethylacrylamide(DMAAm) as a hydrophilicand 2-(Dimethylmaleimido)-N-ethylacrylamide (DMIAAm) asa chromophore is described fortailor-made swelling behavior ofthin hydrogel layers. The polymerswere spin coated on gold surfaceand swelling behavior thin hydrogellayers were investigated by thecombination of Surface PlasmonResonance and Optical Waveguidespectroscopy (SPR/OWS). It wasobserved that an increase in thehydrophilic monomer (DMAAm)content increases both transitiontemperature (Tc) and swelling of
the hydrogel layers. In addition thecollapsed hydrogel thickness wasalso dependent on the DMAAmmol-%. Adhesion promoter synthe-sized for the covalent attachment ofhydrogel to substrate has been furtherinvestigated to optimize dynamics ofadsorption and adhesion on the goldsurface. UV illumination (> 310 nm)results in simultaneous crosslinkingand chemical attachment of thehydrogel to the surface. Covalentattachment confines the swellingand deswelling in one dimension i.e.perpendicular to the substrate.
Keywords Hydrogel · Photocross-linking · Poly(N-isopropyl-acrylamide) · Surface plasmonresonance spectroscopy
Introduction
Stimuli sensitive hydrogels are studied extensively be-cause these gels demonstrate reversible volume phase tran-sitions in response to external stimuli such as changesin temperature, pH, ionic strength or light [1, 2]. Theseproperties make such hydrogels ideal for applications indrug delivery, in chemo-mechanical valves [3, 4], in sep-aration systems [5] etc. [6–10]. One of the most in-tensively studied polymers in this field is Poly(N-iso-propylacrylamide) (PNIPAAm), which exhibits a sharpphase transition in water upon heating above 32 C [7].It undergoes a temperature induced collapse from an ex-tended coil to a globular structure, a transition revealed onthe macroscopic scale by a sudden decrease in the degree
of swelling in its gels. The volume phase transition hasbeen described theoretically as resulting from a balancebetween free energy of mixing, rubber elasticity free en-ergy and the osmotic contribution of the counterions in thecase of ionizable comonomers [11–16]. The lower criticalsolution temperature (LCST) behavior of the PNIPAAm isstrongly influenced by the nature of the comonomers. Hy-drophobic comonomers decrease the transition tempera-ture (Tc) and hydrophilic comonomers increase it. It hasbeen generally observed that the LCST phenomenon dis-appears in the presence of a high content of hydrophobicor hydrophilic compounds.
The faster swelling/deswelling kinetics of thin hydro-gel films is of interest especially from the application pointof view. Recently there are some reports in the literature
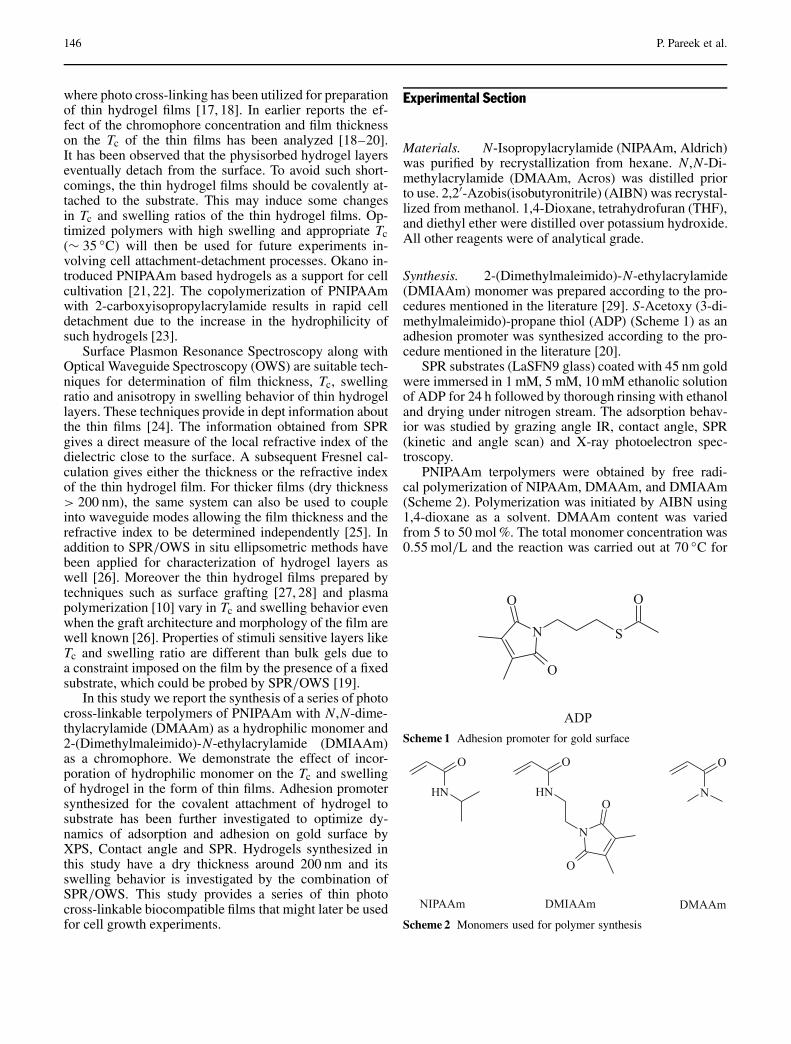
146 P. Pareek et al.
where photo cross-linking has been utilized for preparationof thin hydrogel films [17, 18]. In earlier reports the ef-fect of the chromophore concentration and film thicknesson the Tc of the thin films has been analyzed [18–20].It has been observed that the physisorbed hydrogel layerseventually detach from the surface. To avoid such short-comings, the thin hydrogel films should be covalently at-tached to the substrate. This may induce some changesin Tc and swelling ratios of the thin hydrogel films. Op-timized polymers with high swelling and appropriate Tc(∼ 35 C) will then be used for future experiments in-volving cell attachment-detachment processes. Okano in-troduced PNIPAAm based hydrogels as a support for cellcultivation [21, 22]. The copolymerization of PNIPAAmwith 2-carboxyisopropylacrylamide results in rapid celldetachment due to the increase in the hydrophilicity ofsuch hydrogels [23].
Surface Plasmon Resonance Spectroscopy along withOptical Waveguide Spectroscopy (OWS) are suitable tech-niques for determination of film thickness, Tc, swellingratio and anisotropy in swelling behavior of thin hydrogellayers. These techniques provide in dept information aboutthe thin films [24]. The information obtained from SPRgives a direct measure of the local refractive index of thedielectric close to the surface. A subsequent Fresnel cal-culation gives either the thickness or the refractive indexof the thin hydrogel film. For thicker films (dry thickness> 200 nm), the same system can also be used to coupleinto waveguide modes allowing the film thickness and therefractive index to be determined independently [25]. Inaddition to SPR/OWS in situ ellipsometric methods havebeen applied for characterization of hydrogel layers aswell [26]. Moreover the thin hydrogel films prepared bytechniques such as surface grafting [27, 28] and plasmapolymerization [10] vary in Tc and swelling behavior evenwhen the graft architecture and morphology of the film arewell known [26]. Properties of stimuli sensitive layers likeTc and swelling ratio are different than bulk gels due toa constraint imposed on the film by the presence of a fixedsubstrate, which could be probed by SPR/OWS [19].
In this study we report the synthesis of a series of photocross-linkable terpolymers of PNIPAAm with N,N-dime-thylacrylamide (DMAAm) as a hydrophilic monomer and2-(Dimethylmaleimido)-N-ethylacrylamide (DMIAAm)as a chromophore. We demonstrate the effect of incor-poration of hydrophilic monomer on the Tc and swellingof hydrogel in the form of thin films. Adhesion promotersynthesized for the covalent attachment of hydrogel tosubstrate has been further investigated to optimize dy-namics of adsorption and adhesion on gold surface byXPS, Contact angle and SPR. Hydrogels synthesized inthis study have a dry thickness around 200 nm and itsswelling behavior is investigated by the combination ofSPR/OWS. This study provides a series of thin photocross-linkable biocompatible films that might later be usedfor cell growth experiments.
Experimental Section
Materials. N-Isopropylacrylamide (NIPAAm, Aldrich)was purified by recrystallization from hexane. N,N-Di-methylacrylamide (DMAAm, Acros) was distilled priorto use. 2,2′-Azobis(isobutyronitrile) (AIBN) was recrystal-lized from methanol. 1,4-Dioxane, tetrahydrofuran (THF),and diethyl ether were distilled over potassium hydroxide.All other reagents were of analytical grade.
Synthesis. 2-(Dimethylmaleimido)-N-ethylacrylamide(DMIAAm) monomer was prepared according to the pro-cedures mentioned in the literature [29]. S-Acetoxy (3-di-methylmaleimido)-propane thiol (ADP) (Scheme 1) as anadhesion promoter was synthesized according to the pro-cedure mentioned in the literature [20].
SPR substrates (LaSFN9 glass) coated with 45 nm goldwere immersed in 1 mM, 5 mM, 10 mM ethanolic solutionof ADP for 24 h followed by thorough rinsing with ethanoland drying under nitrogen stream. The adsorption behav-ior was studied by grazing angle IR, contact angle, SPR(kinetic and angle scan) and X-ray photoelectron spec-troscopy.
PNIPAAm terpolymers were obtained by free radi-cal polymerization of NIPAAm, DMAAm, and DMIAAm(Scheme 2). Polymerization was initiated by AIBN using1,4-dioxane as a solvent. DMAAm content was variedfrom 5 to 50 mol %. The total monomer concentration was0.55 mol/L and the reaction was carried out at 70 C for
Scheme 1 Adhesion promoter for gold surface
Scheme 2 Monomers used for polymer synthesis
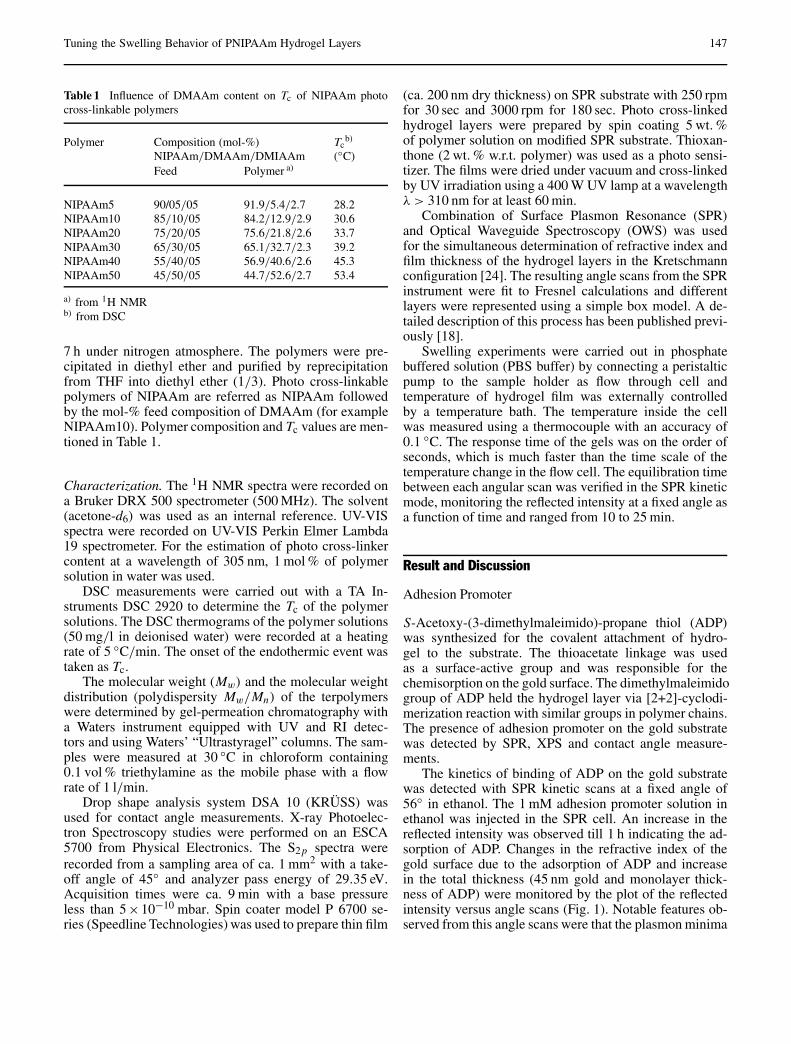
Tuning the Swelling Behavior of PNIPAAm Hydrogel Layers 147
Table 1 Influence of DMAAm content on Tc of NIPAAm photocross-linkable polymers
Polymer Composition (mol-%) Tcb)
NIPAAm/DMAAm/DMIAAm (C)Feed Polymer a)
NIPAAm5 90/05/05 91.9/5.4/2.7 28.2NIPAAm10 85/10/05 84.2/12.9/2.9 30.6NIPAAm20 75/20/05 75.6/21.8/2.6 33.7NIPAAm30 65/30/05 65.1/32.7/2.3 39.2NIPAAm40 55/40/05 56.9/40.6/2.6 45.3NIPAAm50 45/50/05 44.7/52.6/2.7 53.4
a) from 1H NMRb) from DSC
7 h under nitrogen atmosphere. The polymers were pre-cipitated in diethyl ether and purified by reprecipitationfrom THF into diethyl ether (1/3). Photo cross-linkablepolymers of NIPAAm are referred as NIPAAm followedby the mol-% feed composition of DMAAm (for exampleNIPAAm10). Polymer composition and Tc values are men-tioned in Table 1.
Characterization. The 1H NMR spectra were recorded ona Bruker DRX 500 spectrometer (500 MHz). The solvent(acetone-d6) was used as an internal reference. UV-VISspectra were recorded on UV-VIS Perkin Elmer Lambda19 spectrometer. For the estimation of photo cross-linkercontent at a wavelength of 305 nm, 1 mol % of polymersolution in water was used.
DSC measurements were carried out with a TA In-struments DSC 2920 to determine the Tc of the polymersolutions. The DSC thermograms of the polymer solutions(50 mg/l in deionised water) were recorded at a heatingrate of 5 C/min. The onset of the endothermic event wastaken as Tc.
The molecular weight (Mw) and the molecular weightdistribution (polydispersity Mw/Mn) of the terpolymerswere determined by gel-permeation chromatography witha Waters instrument equipped with UV and RI detec-tors and using Waters’ “Ultrastyragel” columns. The sam-ples were measured at 30 C in chloroform containing0.1 vol % triethylamine as the mobile phase with a flowrate of 1 l/min.
Drop shape analysis system DSA 10 (KRÜSS) wasused for contact angle measurements. X-ray Photoelec-tron Spectroscopy studies were performed on an ESCA5700 from Physical Electronics. The S2p spectra wererecorded from a sampling area of ca. 1 mm2 with a take-off angle of 45 and analyzer pass energy of 29.35 eV.Acquisition times were ca. 9 min with a base pressureless than 5×10⁻¹⁰ mbar. Spin coater model P 6700 se-ries (Speedline Technologies) was used to prepare thin film
(ca. 200 nm dry thickness) on SPR substrate with 250 rpmfor 30 sec and 3000 rpm for 180 sec. Photo cross-linkedhydrogel layers were prepared by spin coating 5 wt. %of polymer solution on modified SPR substrate. Thioxan-thone (2 wt. % w.r.t. polymer) was used as a photo sensi-tizer. The films were dried under vacuum and cross-linkedby UV irradiation using a 400 W UV lamp at a wavelengthλ > 310 nm for at least 60 min.
Combination of Surface Plasmon Resonance (SPR)and Optical Waveguide Spectroscopy (OWS) was usedfor the simultaneous determination of refractive index andfilm thickness of the hydrogel layers in the Kretschmannconfiguration [24]. The resulting angle scans from the SPRinstrument were fit to Fresnel calculations and differentlayers were represented using a simple box model. A de-tailed description of this process has been published previ-ously [18].
Swelling experiments were carried out in phosphatebuffered solution (PBS buffer) by connecting a peristalticpump to the sample holder as flow through cell andtemperature of hydrogel film was externally controlledby a temperature bath. The temperature inside the cellwas measured using a thermocouple with an accuracy of0.1 C. The response time of the gels was on the order ofseconds, which is much faster than the time scale of thetemperature change in the flow cell. The equilibration timebetween each angular scan was verified in the SPR kineticmode, monitoring the reflected intensity at a fixed angle asa function of time and ranged from 10 to 25 min.
Result and Discussion
Adhesion Promoter
S-Acetoxy-(3-dimethylmaleimido)-propane thiol (ADP)was synthesized for the covalent attachment of hydro-gel to the substrate. The thioacetate linkage was usedas a surface-active group and was responsible for thechemisorption on the gold surface. The dimethylmaleimidogroup of ADP held the hydrogel layer via [2+2]-cyclodi-merization reaction with similar groups in polymer chains.The presence of adhesion promoter on the gold substratewas detected by SPR, XPS and contact angle measure-ments.
The kinetics of binding of ADP on the gold substratewas detected with SPR kinetic scans at a fixed angle of56 in ethanol. The 1 mM adhesion promoter solution inethanol was injected in the SPR cell. An increase in thereflected intensity was observed till 1 h indicating the ad-sorption of ADP. Changes in the refractive index of thegold surface due to the adsorption of ADP and increasein the total thickness (45 nm gold and monolayer thick-ness of ADP) were monitored by the plot of the reflectedintensity versus angle scans (Fig. 1). Notable features ob-served from this angle scans were that the plasmon minima

148 P. Pareek et al.
Fig. 1 SPR angle scans: Bare gold (solid line), 1 mM ADP adhe-sion promoter solution in ethanol adsorbed for 24 h on gold surface(dotted line)
for a bare gold surface which appeared at 25.4, shifted to25.6 in presence of ADP adsorbed on its surface. Apartfrom this observation, the refractive index of ADP wasmeasured from a refractometer and its value was estimatedto be 1.523. Taking this value into account the layer thick-ness of ADP can be estimated 1.43 nm.
Contact angle measurements were carried out to furtherinvestigate the adsorption of ADP on gold. The contactangle of gold surface increased from 57 to 64 upon ad-sorption of ADP. Increase in the contact angle indicates thepresence of hydrophobic parts of ADP on the gold surface.It was observed that 1 mM solution of ADP was appropri-ate to obtain a monolayer of adhesion promoter.
To determine the electronic state of the sulphur atomin ADP on gold surface, the S2p binding energies weremeasured. The binding mechanism of ADP to gold shouldinvolve the cleavage of the acetoxy group. XPS spectrashowed the S2p binding energy for ADP (after rinsing withethanol) at 161.8 eV and this value matched with the valuereported in the literature for binding of thiols to gold [30].Thus, binding of ADP on gold results in the cleavage ofthe acetoxy moiety and formation of a surface bound thi-olate species. In addition the XPS results indicated the ab-sence of any surface adsorbed acetoxy moiety after ethanolwashing. This confirms the attachment of ADP on goldsurface through S−Au bond.
Photo Cross-linkable PNIPAAm Terpolymers
Synthesis and Characterization. The transition tempera-ture (Tc) of NIPAAm copolymers can be modified bya hydrophilic or hydrophobic comonomer. This phe-nomenon has already been explained on the basis of inter-molecular and intramolecular hydrogen bond formationbetween the solvent (water) and polymer chains [6, 7].
This study focuses on the synthesis and characteriza-tion of terpolymers of N-isopropylacrylamide (NIPAAm)with 2-(dimethylmaleimido)-N-ethylacrylamide (DMI-AAm) and N,N-dimethylacrylamide (DMAAm) in dif-ferent compositions. The polymers were synthesized byfree radical polymerization using AIBN as initiator and1,4-dioxane as solvent. The polymers were photo cross-linkable, biocompatible and exhibited a temperature sen-sitive behavior with wide range of phase transition tem-perature. DMIAAm in polymer chains resulted in photocross-linking ([2+2] cyclodimerization) under UV irradi-ation. Incorporation of DMIAAm decreased the Tc of theNIPAAm by 6–8 C, hence to counter this effect, hy-drophilic DMAAm was introduced as a third componentin various contents (5 to 50 mol %). The properties ofresulting polymers are summarized in Table 1. ConstantDMIAAm content of 5 mol % in feed mixture producedterpolymers with DMIAAm content in the range 2.3 to2.9 mol %. The molecular weights (Mw) were estimatedto be in the range of 37 000 with polydispersity indices(Mw/Mn) of 1.9.
Incorporation of DMAAm increases the Tc of NIPAAmcopolymers [18]. It has previously been shown that the Tcand swelling of NIPAAm hydrogel layers is largely affectedby varying the amount of chromophore [18, 31]. Terpoly-mers prepared from NIPAAm/DMAAm/DMIAAm wereinvestigated by DSC, which is a convenient method tostudy the phase transition temperature of polymers. Thephase transition temperature increases with the increase inthe mol-% of hydrophilic DMAAm in NIPAAm terpoly-mers (Table 1).
Swelling Measurements. DSC provides information onlyrelated to the Tc and gives no information about theswelling behavior of thermoresponsive polymer. In add-ition, it has been reported that there is a difference in theTc of NIPAAm copolymers measured by DSC and othertechniques. In order to investigate the swelling behavior,NIPAAm terpolymers with different content of DMAAmand constant DMIAAm (5 mol %) were used for hydrogelformation. The dry film thickness of all hydrogel layersfrom 5 mol % polymer solutions was around 200 nm. Suchsurface attached films confined the swelling in one dimen-sion. The swelling behavior of the cross-linked layer wasdetermined by SPR and OWS [24].
The effect of temperature on SPR external angle ofa photo cross-linked NIPAAm thin hydrogel layer in PBSbuffer is shown in Fig. 2. The scan showed two import-ant features: (a) SPR minima between 61 and 73 (b)waveguide mode between 46 and 48. The SPR minimachanged significantly around the transition temperature ofNIPAAm photo cross-linked hydrogel thin layers. In add-ition the waveguide mode disappeared at higher tempera-tures. This is due to the fact that at higher temperature thepolymer deswelled resulting in decrease in hydrogel thick-ness. The transition temperatures of PNIPAAm hydrogel

Tuning the Swelling Behavior of PNIPAAm Hydrogel Layers 149
Fig. 2 SPR angle scan of a photo cross-linked NIPAAm hydro-gel layer at various temperatures in PBS buffer ( – 16.8 C, –27.5 C, – 32.6 C, – 42.5 C, ♦ – 51.8 C, ∗ – 61.5 C)
layers can simply be determined by plotting the SPR min-ima with temperature. However, a better interpretation ofthe results was obtained by fitting the SPR angle scans toFresnel calculations to determine refractive index (η) andfilm thickness (d) of the hydrogel layers.
The film thickness of hydrogel layers from 5 wt % so-lutions was in the order of 1 µm in the swollen state.Thickness (d) and refractive index (η) were determinedwithout further assumptions, because these films could befitted using a single layer model [19]. The refractive in-dex (η) obtained from Fresnel calculation was convertedto polymer fraction and volume degree of swelling (1/φp).
Fig. 3 Volume degree of swelling of the photo cross-linked PNI-PAAm hydrogel layer with varying DMAAm content plotted asa function of temperature in PBS buffer ( – NIPAAm5, – NI-PAAm10, – NIPAAm20, – NIPAAm30, ♦ – NIPAAm40)
The volume degree of swelling of the PNIPAAm photocross-linked hydrogel layers plotted as a function of tem-perature in PBS buffer is shown in Fig. 3. It was observedthat the volume degree of swelling decreased rapidly nearTc and remained almost constant at temperatures aboveand below Tc. Sigmoidal fits of the data in the Fig. 3showed that Tc increases with the increase in the mol-% ofDMAAm in NIPAAm hydrogel layers. This is due to thehydrophilic nature of DMAAm. The results are in agree-ment with the values obtained from DSC for these poly-mers. However, NIPAAm50 layers did not show a transi-tion behavior in SPR experiments. The Tc values from theSPR measurements were found to be slightly higher thanthe DSC values (Fig. 4). The Tc of a similar system withoutphoto cross-linker has been reported by Barker et al. [32].Their results indicate that the Tc of a linear PNIPAAmcopolymer is lower than the corresponding cross-linkedcopolymer of the same composition quoted by Shibayamaet al. [33]. Clearly cross-linking of the polymer led toa more constrained structure increasing the critical tem-perature [19, 20].
As the mol-% of DMAAm increased in NIPAAm photocross-linked polymer, the value of η (collapsed) and η(swollen) of hydrogel layer decreased. For NIPAAm5 hy-drogel layer, η (collapsed) value of 1.451 above Tc andη (swollen) value of 1.378 below Tc was obtained. ForNIPAAm40 hydrogel layer, η (collapsed) value of 1.414above Tc and η (swollen) value of 1.354 below Tc wasobtained. The refractive index (η) obtained from Fresnelcalculation was converted to polymer fraction and vol-ume degree of swelling (1/φp). The resulting values fordifferent hydrogel layers are summarized in Fig. 5. ForNIPAAm40 hydrogel layer, 1/φp of 8.2 was observed be-
Fig. 4 Comparison of Tc of NIPAAm terpolymers in PBS bufferfrom () SPR and () DSC

150 P. Pareek et al.
Fig. 5 Change in volume degree of swelling in PBS buffer at con-stant temperatures with varying DMAAm content ( – 15 C, –55 C). Lines are drawn to guide the eyes
low Tc. Collapsed state of this hydrogel showed 1/φp of2.3. The hydrogel layer with 5.0 mol % DMAAm showed1/φp of 4.0 and its collapsed state showed 1/φp of 1.6.These results clearly indicated that not only the Tc butalso the volume degree of swelling in NIPAAm hydrogellayers was dependent on the mol-% of DMAAm. Higherthe mol-% of DMAAm, larger was Tc and volume degreeof swelling.
By raising the temperature above Tc, all hydrogellayers collapsed to different 1/φp values. The collapsedstate was also found to be dependent on the mol-% ofDMAAm in hydrogel layers. Higher the DMAAm mol-% in hydrogel layers, larger is the 1/φp in the collapsedstate. It could be interpreted from these results that theDMAAm, which increases the swelling (below Tc) also re-sults in a partially collapsed state at temperatures above Tc.This is due the hydrophilic nature of DMAAm, which re-tains water even after the PNIPAAm chains are collapsed.
SPR instrument was also used for the estimation offilm thickness and swelling ratio (d/do) of the hydrogellayers. For NIPAAm hydrogel layers with a dry thicknessof ∼ 200 nm, the collapsed film thickness at temperaturesabove Tc was found to be dependent on the DMAAmmol-% in the polymer. For NIPAAm40 hydrogel layer,a d/do of 6.5 and 1.5 was calculated below Tc and above
Tc, respectively. It was observed that the similar resultswere obtained from the swelling ratio and volume degreeof swelling. The absence of waveguide modes at highertemperatures gave a slight error in the measurements ofswelling ratios. Tc value was also determined by plot-ting d/do with temperature. NIPAAm hydrogel layer withhigher DMAAm mol-% shows a higher transition tem-perature and higher swelling ratio.
The thin NIPAAm hydrogel layers were covalentlyattached to the surface, therefore the swelling was con-fined to one direction perpendicular to the substrate. Thedegree of anisotropy was calculated from ratio of 1/φpand swelling ratio. This ratio was found to be between1.2–1.3. Such a study describing the effect of hydrophiliccomonomer on Tc of PNIPAAm provides an opportunity toformulate thermoresponsive hydrogel layers with desiredtransition temperature and swelling behavior for variousapplications.
Conclusion
PNIPAAm with different mol-% of DMAAm and a photocross-linkable moiety were synthesized by free radicalpolymerization. These polymers were used to prepare thinhydrogel layers with wide range of phase transition tem-perature. Swelling behavior of the thin hydrogel layers wasinvestigated by a combination of Surface Plasmon Reson-ance and Optical Waveguide Spectroscopy (SPR/OWS).Hydrogel layers were covalently attached to the gold sur-face by using ADP as an adhesion promoter. Adsorptionof ADP on gold surface was confirmed by using XPS,contact angle measurements and SPR. Thickness and re-fractive index of the dry and swollen hydrogel layers wasinvestigated. Volume degree of swelling in both swollenand collapsed hydrogel layer was dependent on the mol-% of DMAAm in PNIPAAm. These results provide vitalinformation on the swelling behavior of surface attachedhydrogel layer and showed the versatility of SPR instru-ment for studying thin hydrogel layer. In addition, such hy-drogels layers are under investigation for cell attachment-detachment processes.
Acknowledgement The authors wish to acknowledge DeutscheForschungsgemeinschaft (DFG) and European Graduate College(EGS 720) “Advanced Polymer Materials” for the financial support.The authors are also thankful to A. Rudolph for XPS measurements,M. Dziewiencki for contact angle measurements and K. Kretschmerfor help with SPR experiments.
References1. Tanaka T (1978) Phys Rev Lett
40:820–8232. Tanaka T, Fillmore D, Sun ST,
Nishio I, Swislow G, Shah A (1980)Phys Rev Lett 45:1636–1639
3. Osada Y, Gong JP (1998) Adv Mater10:827–837
4. Arndt KF, Kuckling D, Richter A(2000) Polym Adv Technol11:496–505
5. Galaev IY, Gupta MN, Mattiasson B(1996) Chemtech 26:19–25
6. Gehrke SH (1993) Adv Polym Sci110:81–114

Tuning the Swelling Behavior of PNIPAAm Hydrogel Layers 151
7. Schild HG (1992) Prog Polym Sci17:163–249
8. Dong LC, Hoffman AS (1990) J ContrRelease 13:21–31
9. Yakushiji T, Sakai K, Kikuchi A,Aoyagi T, Sakurai Y, Okano T (1998)Langmuir 14:4657–4662
10. Pan YV, Wesley RA, Luginbuhl R,Denton DD, Ratner BD (2001)Biomacromolecules 2:32–36
11. Shibayama M, Tanaka T (1993) AdvPolym Sci 109:1–62
12. Dusek K, Prins W (1969) Adv PolymSci 6:1–102
13. Hooper HH, Baker JP, Blanch HW,Prausnitz JM (1990) Macromolecules23:1096–1104
14. Ilavsky M (1982) Macromolecules15:782–788
15. Flory PJ (1953) Principles of PolymerChemistry. Cornell University Press,Ithaca, NY
16. Hirotsu S (1992) Macromolecules25:4445–4447
17. Harmon ME, Jakob TAM, Knoll W,Frank CW (2002) Macromolecules114:10471–10478
18. Kuckling D, Harmon ME, Frank CW(2002) Macromolecules 35:6377–6383
19. Harmon ME, Kuckling D, Frank CW(2003) Macromolecules 36:162–172
20. Harmon ME, Kuckling D, Pareek P,Frank CW (2003) Langmuir19:10947–10956
21. Yamato M, Konno C, Kushida A,Hirose M, Utsumi M, Kikuchi A,Okano T (2000) Biomaterials21:981–986
22. Okano T, Yamada N, Okuhara M,Sakai H, Sakurai Y (1995)Biomaterials 16:297–303
23. Ebara M, Yamato M, Hirose M,Aoyagi T, Kikuchi A, Sakai K,Okano T (2003) Biomacromolecules4:344–349
24. Knoll W (1998) Ann Rev Phys Chem49:569–638
25. Prucker O, Christian S, Beck H,Rühe J, Frank CW, Knoll W (1998)Macromol Chem Phys 199:1435–1444
26. Schmaljohann D, Nitschke M,Schulze R, Eing A, Werner C,Eichhorn KJ (2005) Langmuir21:2317–2322
27. Okano T, Kikushi A, Sakurai Y,Takei Y, Ogata N (1995) J ContrRelease 36:125–133
28. Liang L, Feng X, Liu J, Rieke PC(1999) J Appl Polym Sci 72:1–11
29. Ling L, Habicher WD, Kuckling D,Adler HJ (1999) Design MonomPolym 4:351–358
30. Skulason H, Frisbie D (2000) J AmChem Soc 122:9750–9760
31. Kuckling D, Hoffmann J, Plötner M,Ferse D, Kretschmer K, Adler HJP,Arndt KF, Reichelt R (2003) Polymer44:4455–5562
32. Barker IC, Cowie JMG, Huckerby TN,Shaw DA, Soutar I, Swanson L (2003)Macromolecules 36:7765–7770
33. Shibayama M, Mizutani S, Nomura S(1996) Macromolecules 29:2019–2024

Progr Colloid Polym Sci (2006) 132: 152–160DOI 10.1007/2882_033© Springer-Verlag Berlin Heidelberg 2006Published online: 8 March 2006
Gérald GuérinJose RaezXiao-Song WangIan MannersMitchell A. Winnik
Polyferrocenylsilane Block Copolymers:Nanotubes and Nanowires throughSelf-Assembly
Gérald Guérin · Jose Raez ·Xiao-Song Wang · Ian Manners ·Mitchell A. Winnik ()Department of Chemistry, Universityof Toronto, 80 St. George Street,Toronto, Ontario M5S 3H6, Canadae-mail: [email protected]
Jose RaezNational Institute for Nanotechnology(NINT), Edmonton, Alberta T6G 2V4,Canada
Abstract Polyferrocenyldimethyl-silane (PFS) diblock copolymerswith polyisoprene (PFS-PI) or withpolydimethylsiloxane (PFS-PDMS)self-assemble in simple alkanesolvents to form what appear byTEM to be dense flexible cylinders(nanowires) or “nanotube-like”structures. Typical widths are on theorder of 20 to 30 nm, with variablelengths often greater than 10 µm. Thestructures that form, and the dimen-sions of the “tube-like” structures orwires, depend upon the compositionof the polymers and the lengths ofthe blocks. Light scattering experi-ments show that the PFS-PDMS(block ratio 1:12) solutions aged
at 25 C contain long thin objects950 nm in length. These structuresprobably rearrange on the TEM gridas the solvent evaporates to formelongated structures. Establishinga mechanistic connection betweenthe objects present in solution andthose seen in the TEM images, aswell as understanding the factors thatlead to these unusual self-assembledstructures, remain a challenge.
Keywords Coil-crystalline blockcopolymers · Micelles in solution ·Light scattering · Transmissionelectron microscopy · Cross-linkablemicelles
Introduction
Block copolymers self-assemble to form nanoscale orga-nized structures in a selective solvent. The most com-mon structures are spheres, with the insoluble core sur-rounded by a solvent-swollen corona. In some instances,disk- or worm-like micelles form, and are of particular in-terest, since the control of their association can lead toa broad range of new applications [1, 2]. An important sub-set of block copolymer micelles are those which containmetal atoms, through covalent attachment or by complexa-tion [3]. These structures are interesting because they takeadvantage of the intrinsic properties of their components,such as the mechanical properties of the polymer micellesand the optical and magnetic characteristics of the metalatoms. Moreover, the assembly permits the control of theuniformity in size and shape of the nanoparticles, and itstabilizes them.
We have a specific interest in the self-assembledstructures formed by poly(ferrocenylsilane) block copoly-mers, such as poly(ferrocenyldimethylsilane-b-dimethyl-siloxane) (PFS-PDMS) and (ferrocenyldimethylsilane-b-isoprene) (PFS-PI). The PFS block contains an iron atomin the main chain repeat unit. These polymers are par-ticularly promising for novel applications, since they canbe used as charge-transport materials and, by pyrolysis,as precursors to ferromagnetic ceramics [4–6]. More-over, they can by synthesized with a very narrow molarmass distribution, with excellent control over chain lengthand composition [7]. An important feature of PFS is thatthe polymers bearing two methyl groups on the silaneunit are crystalline, whereas polymers with two differ-ent substituents on each silane (methyl, ethyl; methyl,phenyl) are atactic and remain amorphous. This featureof the polymer composition has a strong influence onthe type of self assembled structures that these poly-

Polyferrocenylsilane Block Copolymers: Nanotubes and Nanowires through Self-Assembly 153
mers can form in solvents selective for the PI or PDMSblock.
Both PFS-PI and PFS-PDMS are synthesized by two-step anionic polymerization. The synthetic approach forthe preparation of PFS-PDMS is shown in Scheme 1 [8, 9]:n-butyllithium was used to initiate the polymerization ofthe strained silicon-bridged ferrocenophane in THF solu-tion, while the second block was built by the subsequentaddition of hexamethyltrisiloxane (D3). The reaction wasterminated with chlorotrimethylsilane. To obtain PFS-PI,the PI block was initiated with butyllithium, followed bythe addition of the silicon-bridged ferrocenophane.
Morphology Observedby Transmission Electronic Microscopy (TEM)
One of the first samples we examined was PFS50-PDMS300(the subscript refers to the degree of polymerization ofeach block), in which the PDMS block was 6 times longerthan the PFS block. We discovered [10, 11] that this poly-mer self-assembled in hexane, a non-solvent for the PFS,to form elongated worm-like structures (Fig. 1a). Thetransmission electron microscopy (TEM) images in Fig. 1are not stained. The Fe atoms in the PFS block providesufficient contrast, and we infer that we see only the PFSdomains of the self-assembled structures. Other samples,such as PFS-b-PI having the same block ratio (1 : 6) alsoform long fiber-like micelles (Fig. 1b) [11] and one PFS-b-PI sample in which the PI was the shorter block (blockratio 2 : 1) formed platelet structures [12].
Since one of the issues raised in this paper is whetherthe objects seen in the TEM images are a proper rep-resentation of the structures present in solution, we willdescribe briefly sample preparation strategies. For solu-tions of micelles in hexane, a very volatile solvent, samplesfor TEM studies could be obtained by aspirating a dilutesolution directly onto a carbon-coated copper grid. Mostof the solvent likely evaporated as the sample was de-posited on the substrate. Alternatively, the TEM substratecould be dipped briefly into a dilute solution of the mi-celles and allowed to dry. This method also worked for lessvolatile solvents like decane. For decane, we could alsoplace a small drop (a few µl) of solution on the grid andthen touch the edge of the droplet with a Kimwipe to re-move excess solvent. For several samples these methodswere compared, and we observed the same morphology.
Scheme 1 PFS-b-PDMS
Fig. 1 Transmission electron micrograph of a PFS-b-PDMS andb PFS-b-PI micelles formed in hexane, prepared by direct disso-lution. The sample was not stained
TEM images were obtained with a Hitachi model 600electron microscope at 75 kV. Before every TEM ses-sion, the electron beam was aligned to minimize opticalartifacts.
Influence of the Crystallinity
A common characteristic of these elongated structures isthat the PFS block is crystalline. Crystallinity was de-tected by Wide Angle X-ray Scattering (WAXS) meas-urements on dry film samples prepared from micellesolutions. An example is shown in Fig. 2 for PI320-PFS53, where the WAXS pattern exhibits strong reflec-tion peaks. The strongest reflection peak is related toa period of 6.42 A and corresponds to the 6.3 A spac-ing found in single crystals of the PFS pentamer, whichis due to a Fe-Fe spacing in adjacent molecules [13].

154 G. Guérin et al.
Fig. 2 WAXS pattern of wormlike micelles of PI320-b-PFS53. Therelated period are given above each apparent peak
We inferred that the unusual structures of PFS-b-PDMSand PFS-b-PI were due to the crystalline nature of thePFS block [11, 12]. In order to verify this conclusion,we slightly modified the poly(ferrocenyldimethylsilane)block by replacing one methyl group linked to the sil-icon by an ethyl group, leading to a non-crystallizablepoly(ferrocenylethylmethylsilane) block (PFEMS) [11].We found that PI and PDMS diblock copolymers withthe non-crystallizable PFEMS block form only star-likemicelles in n-alkane solvents. Moreover, further studiesperformed on PI copolymerized with polyferrocenylphos-phine (PFP) which cannot crystallize [14] show only the
Fig. 3 Representative SFM height images of the cylindrical PFS50-b-PDMS300 a prior and b after O2 plasma etching
formation of star-like micelles, in agreement with our pre-vious observations.
Moreover, we observed by surface force microscopy(SFM) that, once deposed on a silicon substrate, the fiber-like micelles of PFS-PI and PFS-PDMS are much widerthan high. This effect is expected because the SFM shoulddetect both the PFS core and the surrounding PI or PDMScorona, and one expects the soft corona to spread alongthe substrate. More surprising is that the overall heightdetected by SFM is significantly smaller than the widthof the PFS core seen in corresponding TEM images. Forexample, PFS53-PI320 block copolymer micelles from hex-ane, in the SFM image are characterized by a height of9 nm and a width of 60 nm [6] (Fig. 3a). What is most sur-prising is that in the TEM images of the micelles PFS corehas a width of 20 nm. Thus it appears that the entire mi-celle including the PFS core is compressed on the surfaceof the substrate. In Fig. 3b we show that apparently con-tinuous ceramic nanolines are produced upon exposure ofthese structures to an oxygen plasma. The ceramic linesare much thinner (ca. 2 nm high) than the micelles becauseof a loss of organic material during exposure to the plasma.
Influence of the Block Ratio
Another intriguing feature emerged when we examinedPFS-PDMS diblock copolymers having a longer solu-ble block as well as an increased block ratio (1 : 12 and1 : 18). Samples of the two polymers were prepared bythe same protocol, i.e., subjected to the same thermal his-tory. Dilute solutions in decane were heated for 30 minat 61 C, cooled to room temperature over two hours andallowed to age for 24 hours. We have already shown,in Fig. 1a, that under these conditions, PFS50-PDMS300formed dense rod-like structures in hexane. However, as

Polyferrocenylsilane Block Copolymers: Nanotubes and Nanowires through Self-Assembly 155
Fig. 4 TEM micrographs of a PFS40-PDMS480 (1 : 12) and bPFS54-PDMS945 (1 : 18) assemblies in n-decane after being slowlycool down from 61 C to room temperature
we can see in Figs. 4a and b, PFS40-PDMS480 (1 : 12)and PFS54-PDMS945 (1 : 18) demonstrated an even morecomplex behavior. From the weakly contrasted images ofPFS40-PDMS480 and PFS54-PDMS945 samples, obtainedby TEM, one sees what appears to be extremely long“nanotube-like” structures (Figs. 4a and b), suggestinga hollow cylindrical PFS core surrounded by the PDMSchains.
Influence of the Sample History
We also noticed that the formation of these structures issensitive to the temperature history of the sample. For ex-ample, the sample shown in Fig. 4a, cooled from 61 Cto room temperature (ca. 23 C) over 2 h and then aged,exhibited long “nanotube-like” structures [8, 15]. In con-trast, a sample of the same solution of PFS40-PDMS480in n-decane heated at 61 C for 30 min and then rapidlyquenched on the TEM grid, exhibited a mixture of star-likeand short rod micelles (Fig. 5).
This high sensitivity to the temperature history en-couraged us to study the influence of temperature on themorphology of self-assembled structure. We used the so-lution slowly cooled from 61 C to 25 C (see Fig. 4a)showing “nanotube-like” structures as our starting point,
Fig. 5 TEM micrograph of PFS40-PDMS480 in n-decane heated at61 C for 30 min and then rapidly quenched to room temperature
Fig. 6 TEM micrograph of PFS40-b-PDMS480 assemblies formedin n-decane at 50 C. The inset shows “nanotube-like” structures at25 C
and then heated it to 50 C. After one day of annealing atthis temperature, we noticed that the structures had rear-ranged to form short dense rods (Fig. 6). The short denserods seen in the image in Fig. 6, are clearly different fromthe long structures obtained at 25 C shown in the inset ofFig. 6. Even more interesting, when the sample was slowlycooled again down to 25 C, these short rods evolved backto the “nanotube-like” structures. From this reversibility,we infer that these two structures likely represent the equi-librium state of the system at these two different tempera-tures.
In order to obtain a better understanding of the natureof the structures present in solution at these two tempera-tures, we began a study of these solutions by light scatter-ing. A classic problem in the field of self-assembly is toknow whether the structures seen in TEM images are truerepresentation of the structures present in solution, par-ticularly for samples in slowly evaporating solvents liken-decane. The system may have time to rearrange as thesolution becomes more concentrated while drying. Thelight scattering studies are not yet complete, and the fol-lowing section summarizes results obtained to date.
Light Scattering Measurements
Most of our preliminary light scattering experiments werecarried out on solutions of PFS40-b-PDMS480 in n-decane.The sample history being extremely important, we com-pared two different techniques to prepare the micelle so-lutions for light scattering studies. The first consistedof slowly injecting, through 0.2-µm pore filters, 0.1 mLaliquots of a PFS40-b-PDMS480 solution in tetrahydrofu-ran (THF, 10 mg/mL), which is a common good solventfor both blocks. No self assembly is expected, and thus nolarge self-assembled structures would be removed by thefilter. After the complete evaporation of the THF from thecells, filtered n-decane was added to obtain a given con-

156 G. Guérin et al.
centration. After the cells were capped, the samples wereplaced in the pre-heated vat (60 C) of the light scatteringinstrument to dissolve the polymer. The samples were thencooled to 25 C.
The second technique consisted of heating a PFS40 −b-PDMS480 sample in n-decane at 60 C for 30 min ina closed vial. The solution was allowed to cool relativelyquickly to room temperature and then injected into theAl-foil sealed cells through a 0.5-µm pore size filter. Thesolutions were allowed to equilibrate for 1 day at ambienttemperature prior to carrying our light scattering experi-ments. In both cases, we obtained the same results, insur-ing us that the sample preparation does not interfere on thelight scattering experiments. We also confirm that what-ever structures that form when the sample was injected intothe light scattering cell were small enough to pass throughthe filter.
Formation of Supramolecular Structures
Light scattering is a powerful tool to study the formationof supramolecular structures in solution, since, accordingto Eq. 1, the intensity scattered by a particle in a dilutesolution is directly proportional to its mass:
iu,θ = I04 π2 n2
0
r2 λ40 NA
(dn
dc
)2
M c (1)
Here iu,θ is the intensity of the scattered light at an angleθ to the incident beam; I0 is that of the polarized primarybeam; r, the distance between the scattering molecule andthe detector; λ0, the wavelength of the laser beam in vac-uum; n0, the solvent refractive index; dn/dc, the specificrefractive index increment of the solution, M, the molarmass of the scattering particle; and c, its concentration. Fora dilute solution, at a given concentration, the scattered in-tensity can be rewritten as:
iu,θ = K ′(
dn
dc
)2
M (2a)
where
K ′ = I04 π2 n2
0
r2 λ40 NA
c (2b)
K ′ is a constant at constant solute concentration. Whenboth single polymer chains and micelles are present in so-lution, populations A and B, respectively, Eq. 2a becomes:
iu,θ = K ′((
dn
dc
)2
AMA xA +
(dn
dc
)2
BMB xB
)(3)
where xA and xB are the mass fractions, respectively, ofthe single chains (population A) and the micelles (popula-tion B).
In order to verify that the intensity scattered by the sin-gle chains could be neglected in Eq. 3, we examined the
behavior of the sample PFS54-PDMS945 with the largestcontent of soluble block. Here the block ratio PFS/PDMSis 1 : 18, and this among all of our samples should have thegreatest tendency to exist with free chains present in solu-tion. For this sample, we studied the evolution of the scat-tered light in two different solvents: hexane and benzene.Whereas hexane is a selective solvent for the PDMS block,benzene is a good solvent for both blocks. As we will seebelow, association takes place in hexane and evolves overtime. No self-assembly to form micelles occurs in ben-zene [9]. Figure 7 shows the relative scattered intensityobtained as the function of time for two solutions of iden-tical concentration. The scattered intensity for the hexanesolution was normalized by dividing it by the scattered in-tensity obtained over the same time for a benzene solutionof the polymer at the same concentration. This analysispresumes that the difference in dn/dc values for the sin-gle chains in benzene compared to hexane is much smallerthan the increase in scattering contribution caused by themass and mass-fraction contributions of the aggregatedstructures.
The large increase of the normalized scattered inten-sity observed for the hexane solution can be explained bythe growth of the self-assembled structure as a function oftime. At short times the intensity scattered in both solu-tions (in benzene and hexane) are nearly equal, indicatingthat, for this sample (PFS54-PDMS945), the micelle forma-tion rate is slow. Moreover, from Eq. 3, it can be concludedthat once the final structure is formed, there is a negligiblecontribution to the scattering intensity from single chainsin solution. We can be confident that the scattering signalwe measure is due to self-assembled structures.
Fig. 7 Evolution of the light scattering intensity for PFS54-b-PDMS945 solutions at 1.0 mg/mL in n-hexane and in benzene (thedashed curve is used as a guide for the eyes). The measured in-tensity for each solution in hexane was divided by the measuredintensity of the solution in benzene aged for an identical time. Theinset shows the evolution of intensity over the first 60 min

Polyferrocenylsilane Block Copolymers: Nanotubes and Nanowires through Self-Assembly 157
Thermal Reversibility of the Morphology
In Figs. 5 and 6 we present evidence for a remarkablemorphology transition with a change in temperature forPFS40-PDMS480 in decane. The “nanotube-like” struc-tures that formed initially on cooling the solution to 25 C(Fig. 5) evolved to form much shorter dense rod-like struc-tures (Fig. 6) when the solution was heated to 50 C. Thisprocess was reversible, and the rearrangement in both di-rections appeared to be slow. In this section, we describehow a sudden change in temperature affects the light scat-tering signal as a measure of the kinetics of the structurerearrangement. A solution of PFS40-PDMS480 in decane,allowed to equilibrate for one day at 25 C, was suddenlyimmersed in the sample chamber vat of the light scatter-ing instrument maintained at 50 C. In Fig. 8 we plot theevolution of the normalized scattered light intensity (at anangle of 90) as a function of time for this solution. Atshort times (less than 3 min) the normalized scattered in-tensity decreased sharply to a minimum value less than10% of the initial value. At longer times, the intensitygrew, reaching a plateau value at ca. 25% of the initial nor-malized intensity.
From the sudden decrease of the normalized inten-sity, we can infer that the long structures present at 25 Crapidly dissociate or fragment at 50 C, to form muchsmaller particles with substantially weaker scattering andthen re-assemble as a function of time to form the rod-likestructures shown in Fig. 6. A representative TEM image ofthe intermediate assembly is shown in the inset of Fig. 8.The sample was prepared by dipping a carbon-coated cop-per grid into the warm solution, after a short heating time(165 s). The image shows a mixture of very short cylindri-cal particles (rods and “nanotube-like” structures). While it
Fig. 8 Evolution of the light scattering (LS) intensity of PFS40-b-PDMS480 assemblies in n-decane (0.33 mg/mL) at 50 C overa period of 24 h. The LS intensity was normalized to the LS inten-sity of the assemblies at 25 C, after they reached equilibrium. Eachopen symbol represents a 30-second scan, while each full symbolrepresents a 10-second scan. The inset shows a TEM micrograph ofthe structure after an annealing time of 165 s at 50 C
is possible that some further structure evolution took placeon the TEM grid as the decane evaporated, the presence ofsmaller objects in this image is in general agreement withthe results obtained by the light scattering experiment.
Static Light Scattering
In all experiments involving self assembly, it is import-ant to establish whether the structures seen by microscopycorrespond to those present in solution. Scattering experi-ments are powerful set of tools to examine the size, shapeand dynamic properties of species in solution. We have be-gun to carry out static and dynamic light scattering (SLSand DLS, respectively) in order to learn about the size(mass, length), size distribution, stiffness, and diffusionalproperties of the self-assembled structures present in solu-tion. We began our investigation with the study of dilutesolutions of PFS40-PDMS480 in decane at 25 C by SLS.From SLS, one obtains structural and dimensional infor-mation by measuring the angular dependence of the excessabsolute time-average scattered intensity (the Rayleighratio, Rθ ). For dilute solutions, Rθ is related to the sam-ple concentration c, the second viral coefficient A2, and theform factor P(q) through the expression:(
Kc
Rθ
)=
[1
Mw P(q)+2A2c
](4)
where K = 4π2n2D(dn/dc)2/(NAλ4), and NA, λ, dn/dc
and nD are Avogadro’s number, the incident wavelength(632.8 nm), the refractive index increment, and the re-fractive index of the solvent, respectively. We measureda dn/dc value of 0.0465 mL/g (λ0 = 620 nm) for thePFS40-b-PDMS480 micelles in n-decane at 25 C.
SLS studies were performed at four different copoly-mer concentrations c (0.33, 0.57, 0.75 and 0.85 mg/mL).Because we learned from the kinetics studies that the sam-ple equilibrium time was around 24 h, each solution wasallowed to age for 24 h before data collection. Figure 9shows the plot of Kc/Rθ as a function of q2, at those fourconcentrations and the values extrapolated to zero concen-tration (open circles).
An interesting feature of Fig. 9 appears in the evolu-tion of Kc/Rθ as a function of the polymer concentration.This value increases as the copolymer concentration de-creases, leading to an apparent negative second virial co-efficient, A2. This observation is intriguing since micellarsystems normally have positive values of A2. Moreover,the downward curvature at increasing scattering angle in-dicates the presence of extended or rod-like objects, andthe increasing downward curvature with increasing con-centration may indicate a growth in size of the objectpresent as the concentration is increased, in accordancewith the apparent negative value of A2. The relatively poorsolvent quality of n-decane for PDMS may also contributeto the negative value of A2.
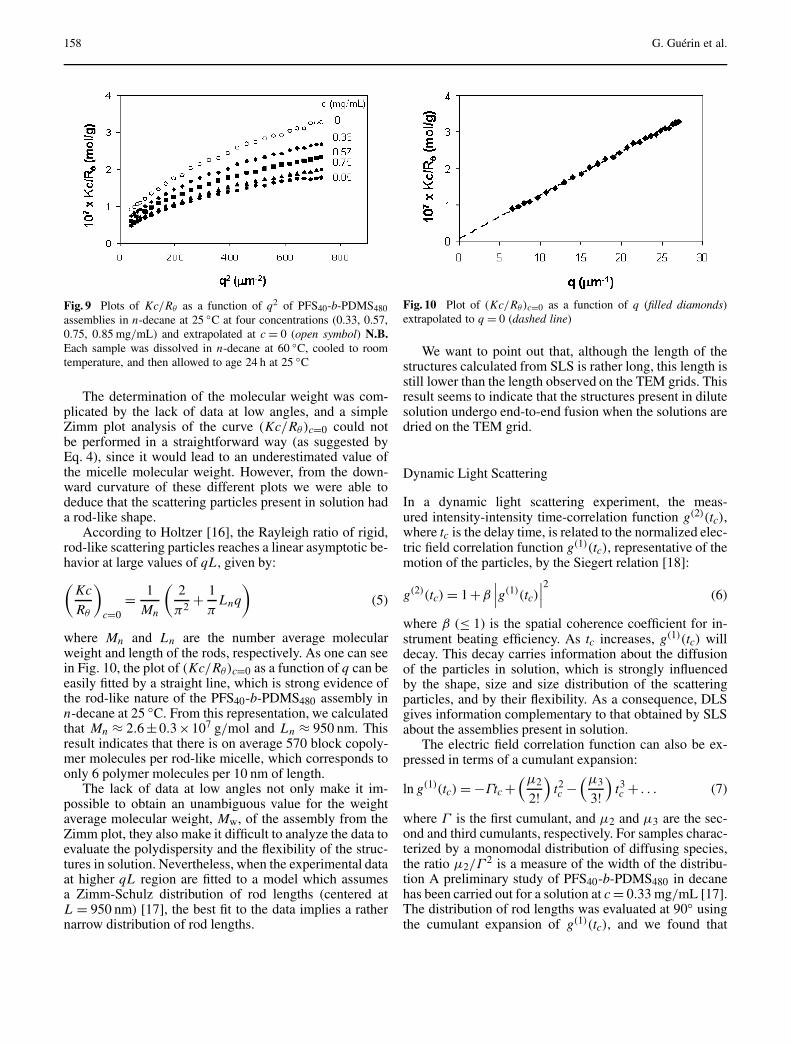
158 G. Guérin et al.
Fig. 9 Plots of Kc/Rθ as a function of q2 of PFS40-b-PDMS480assemblies in n-decane at 25 C at four concentrations (0.33, 0.57,0.75, 0.85 mg/mL) and extrapolated at c = 0 (open symbol) N.B.Each sample was dissolved in n-decane at 60 C, cooled to roomtemperature, and then allowed to age 24 h at 25 C
The determination of the molecular weight was com-plicated by the lack of data at low angles, and a simpleZimm plot analysis of the curve (Kc/Rθ )c=0 could notbe performed in a straightforward way (as suggested byEq. 4), since it would lead to an underestimated value ofthe micelle molecular weight. However, from the down-ward curvature of these different plots we were able todeduce that the scattering particles present in solution hada rod-like shape.
According to Holtzer [16], the Rayleigh ratio of rigid,rod-like scattering particles reaches a linear asymptotic be-havior at large values of qL, given by:(
Kc
Rθ
)
c=0= 1
Mn
(2
π2 + 1
πLnq
)(5)
where Mn and Ln are the number average molecularweight and length of the rods, respectively. As one can seein Fig. 10, the plot of (Kc/Rθ)c=0 as a function of q can beeasily fitted by a straight line, which is strong evidence ofthe rod-like nature of the PFS40-b-PDMS480 assembly inn-decane at 25 C. From this representation, we calculatedthat Mn ≈ 2.6 ±0.3×10⁷ g/mol and Ln ≈ 950 nm. Thisresult indicates that there is on average 570 block copoly-mer molecules per rod-like micelle, which corresponds toonly 6 polymer molecules per 10 nm of length.
The lack of data at low angles not only make it im-possible to obtain an unambiguous value for the weightaverage molecular weight, Mw, of the assembly from theZimm plot, they also make it difficult to analyze the data toevaluate the polydispersity and the flexibility of the struc-tures in solution. Nevertheless, when the experimental dataat higher qL region are fitted to a model which assumesa Zimm-Schulz distribution of rod lengths (centered atL = 950 nm) [17], the best fit to the data implies a rathernarrow distribution of rod lengths.
Fig. 10 Plot of (Kc/Rθ )c=0 as a function of q (filled diamonds)extrapolated to q = 0 (dashed line)
We want to point out that, although the length of thestructures calculated from SLS is rather long, this length isstill lower than the length observed on the TEM grids. Thisresult seems to indicate that the structures present in dilutesolution undergo end-to-end fusion when the solutions aredried on the TEM grid.
Dynamic Light Scattering
In a dynamic light scattering experiment, the meas-ured intensity-intensity time-correlation function g(2)(tc),where tc is the delay time, is related to the normalized elec-tric field correlation function g(1)(tc), representative of themotion of the particles, by the Siegert relation [18]:
g(2)(tc) = 1+β
∣∣∣g(1)(tc)∣∣∣2
(6)
where β (≤ 1) is the spatial coherence coefficient for in-strument beating efficiency. As tc increases, g(1)(tc) willdecay. This decay carries information about the diffusionof the particles in solution, which is strongly influencedby the shape, size and size distribution of the scatteringparticles, and by their flexibility. As a consequence, DLSgives information complementary to that obtained by SLSabout the assemblies present in solution.
The electric field correlation function can also be ex-pressed in terms of a cumulant expansion:
ln g(1)(tc) = −Γtc +(µ2
2!)
t2c −
(µ3
3!)
t3c + . . . (7)
where Γ is the first cumulant, and µ2 and µ3 are the sec-ond and third cumulants, respectively. For samples charac-terized by a monomodal distribution of diffusing species,the ratio µ2/Γ
2 is a measure of the width of the distribu-tion A preliminary study of PFS40-b-PDMS480 in decanehas been carried out for a solution at c = 0.33 mg/mL [17].The distribution of rod lengths was evaluated at 90 usingthe cumulant expansion of g(1)(tc), and we found that

Polyferrocenylsilane Block Copolymers: Nanotubes and Nanowires through Self-Assembly 159
µ2/Γ2 = 0.12, confirming that the polydispersity of the
rod lengths was rather narrow.We can obtain further information about the sample
from the angular dependence of the DLS signal, analyzedin conjunction with the rod length obtained from the SLSdata. Since this length is known, we can calculate thetranslational and rotational diffusion coefficients of the as-semblies in solution, by fitting the experimental DLS datawith the Maeda and Fujime expression for the apparentdiffusion coefficient [19]:
Γ/q2 = Dt + (L2/12)Dr f1(k) (8)− (D|| − D⊥)(1/3− f2(k))
where k = qL/2, D|| and D⊥ are the diffusion coeffi-cients for translation parallel and perpendicular to the rod’saxis, Dr is the rotational diffusion coefficient and Dt isthe overall translational diffusion coefficient of the rod.The functions f1(k) and (1/3 − f2(k)) are weighting fac-tors depending only on k. The term f1(k) accounts for thecontribution of rotation to Γ/q2. The term (1/3 − f2(k))accounts for the contribution of translational anisotropy.Moreover, the values of Dt, D||, D⊥ and Dr can be cal-culated via the Broersma equations [20–22], which givea relation between the diffusion coefficients and the hy-drodynamic dimensions of a cylinder (the length and thehydrodynamic diameter). The dependence of the apparentdiffusion coefficient, Dapp = Γ/q2, as a function of qL isshown in Fig. 11. From the fitting of the experimental dataand the use of the Broersma equations, we deduce that thecross-sectional hydrodynamic diameter of the structure isca. 20 nm for a concentration of 0.33 mg/mL in n-decane.
There are several ambiguities in the data analysis thatcan only be resolved with further experiments. Data atlower angles when added to those in Fig. 11 should pro-vide a better fit to the hydrodynamic diameter of the rod-like micelles. In addition, DLS experiments on solutionsof different concentrations are needed in order to be ableto extrapolate the dependence of Γ/q2 as a function of qLto zero concentration. In this way one can avoid any influ-ence of possible concentration dependence of micelle sizeon the DLS results.
Structure Conservation for TEM Experiments
There are many reasons to attempt the synthesis of mi-celles with a crosslinked corona [23, 24]. In the case ofPFS block copolymer micelles, crosslinking the coronamay enhance the thermal stability of the micellar struc-tures on a substrate. PFS can form a magnetic ceramicupon pyrolysis, but in the absence of crosslinking, theyield is low. Corona crosslinking may allow the structuresformed by the micelles to persist to high enough tem-perature that micelles such as those shown in Fig. 2 canbe converted to magnetic ceramic nanolines upon pyroly-sis. For PFS-PI, crosslinking was achieved by a platinum-catalyzed hydrosilylation reaction of the unsaturated sites
Fig. 11 Γ/q2 versus qL , data (full diamonds) obtained at a polymerconcentration of 0.33 mg/mL. The dashed line is a fit of Γ/q2 usingthe Maeda equation (Eq. 8) with L = 1050 nm and r = 9 nm. Wepresent the full curve to emphasize the change in curvature expectedat low angles
in the PI component with tetramethylsiloxane, and our firstexamination of these materials indicated that they could beconverted to continuous ceramic lines upon heating [4].
From the perspective of this paper, another reasonto crosslink the micelles in dilute solution is that net-work formation in the corona should lock in place thestructures present, and minimize the possibility of a struc-tural transformation when the solution is transferredto a TEM grid and allowed to dry. A clever way toobtain this result for the PFS diblock copolymer sys-tem would be to modify the PDMS block, in the hopethat the modified system also would self assemble into“nanotube-like” structures in n-alkane solvents. We syn-
Scheme 2 PFS-b-PMVS
Fig. 12 TEM micrograph of PFS48-PMVS300 assemblies aftershell-crosslinking. a from hexane and b fromTHF

160 G. Guérin et al.
thesized the polymer poly(ferrocenyldimethylsilane-b-methylvinylsiloxane) (PMVS, Scheme 2). This polymermeets our requirements, since it contains a reactive vinylgroup in the repeat unit, and its structure is close to that ofPDMS.
A TEM micrograph of a PFS48-PMVS300 is shown inFig. 12a. To our good fortune, this polymer also forms“nanotube-like” structures in hexane. Crosslinking thecorona can be achieved by Pt-catalyzed hydrosilylationwith tetramethylsiloxane (to form PFS-xPMVS). In prin-ciple, the degree of crosslinking of the assembly can alsobe controlled by adjusting the amount of tetramethylsilox-ane in the crosslinking reaction. As a test of the successof this reaction, we showed that the structure can be trans-ferred in THF without dissociating, as detected by DLSand by TEM. Figure 12b shows that when a THF solu-tion of the hydrosilylated micelles is dried on a TEMgrid, “nanotube-like” structures form that are differentin appearance from those obtained initially from hex-ane. THF is a good solvent for PFS. In THF, the PFSchains dissolve but remain attached to the xPMVS micro-gel network. Upon drying of the solution, the PFS chainsphase separate from the xPMVS and form what appearsto be a “connected-bead-like” structure in the interior ofthe xPMVS “tube.” Films formed from THF solutionsof PFS-xPMVS show no indication of any crystallinityof the PFS component, emphasizing that the PFS com-ponent of the structures formed in this way are ratherdifferent than those formed by self-assembly in alkanesolvents.
The versatility of the crosslinked structures opens a newbroad avenue for their application in several areas. As men-tioned above, corona-crosslinked PFS assemblies demon-strate excellent shape retention upon pyrolysis and permitthe formation of ceramic replicas. We have also recentlyshown that in a common good solvent, the PFS chains inthe microgel interior of xPMVS can serve as a microreactorfor the localized production of metal nanoparticles [25]. Weare also about to begin light scattering studies of PMVS mi-celles, before and after corona crosslinking, and hope to usethese experiments to learn more about the self-assembledstructures formed in dilute solution.
Summary
The first poly(ferrocenylsilane)-based block copolymerswere synthesized about 10 years ago. Experiments carriedout in the intervening time have revealed the unusual andhighly interesting structures formed by these polymers indifferent selective solvents that makes them still extremelyattractive to study. Their ability to form long nanowiresor “nanotube-like” structures has been confirmed both byTEM and light scattering experiments. Nevertheless, a lotof work needs to be done in order to fully understand thisintriguing series of polymers. These studies promise new,unexpected, and exciting results.
Acknowledgement The authors thank NSERC Canada and theProvince of Ontario under its EMK program for its support of thisresearch.
References1. Won Y-Y, Davis TH and Bates FS
(1999) Science 283:960–9632. Discher DE and Eisenberg A (2002)
Science 297:967–9733. Förster S and Antonietti M (1998)
Adv Mater 10:195–2164. Wang X-S, Arseneault A, Ozin GA,
Winnik MA and Manners I (2003)J Am Chem Soc 125:12686–12687
5. Massey JA, Winnik MA, Manners I,Chan VZ-H, Ostermann JM,Enchelmaier R, Spatz JP and MöllerM (2001) J Am Chem Soc123:3147–3148
6. Cao L, Massey JA, Winnik MA,Manners I, Riethmüller S, Banhart F,Spatz JP and Möller M (2003) AdvFunct Mater 13:271–276
7. Ni Y, Rulkens R and Manners I (1996)J Am Chem Soc 118:4102–4114
8. Raez J, Manners I and Winnik MA(2002) J Am Chem Soc124:10381–10395
9. Raez J, Manners I and Winnik MA(2002) Langmuir 18:7229–7239
10. Massey JA, Power KN, Manners I andWinnik MA (1998) J Am Chem Soc120:9533–9540
11. Massey JA, Temple K, Cao L, RharbiY, Raez J, Manners I and Winnik MA(2000) J Am Chem Soc122:11577–11584
12. Cao L, Manners I and Winnik MA(2002) Macromolecules 35:8258–8260
13. Rulkens R, Lough AJ, Manners I,Lovelace SR, Grant C and Geiger WE(1996) J Am Chem Soc118:12683–12695
14. Cao L, Manners I and Winnik MA(2001) Macromolecules 34:3353–3360
15. Raez J, Barjovanu R, Massey JA,Winnik MA and Manners I (2000)Angew Chem Int Ed 39:3862–3865
16. Holtzer A (1955) J Polym Sci 17:432
17. Guérin G, Raez J, Manners I andWinnik MA (2005) Macromolecules38:7819–7827
18. Siegert AJF (1943) MassachusettsInstitute of Technology, Rad Lab RepNo 465
19. Maeda T and Fujime S (1984)Macromolecules 17:1157
20. Broersma S (1960) J Chem Phys32:1626
21. Broersma S (1960) J Chem Phys32:1632
22. Broersma S (1981) J Chem Phys74:6989
23. Thurmond KB, Kowalewski T andWooley KL (1996) J Am Chem Soc118:7239–7240
24. Thurmond KB, Kowalewski T andWooley KL (1997) J Am Chem Soc119:6656–6665
25. Wang X-S, Wang H, Winnik MA andManners I (2005) J Am Chem Soc127:8924–8925

Progr Colloid Polym Sci (2006) 132: 161–167DOI 10.1007/2882_042© Springer-Verlag Berlin Heidelberg 2006Published online: 24 February 2006
Vera BocharovaGanna GorodyskaAnton KiriyManfred StammPaul SimonIngolf MönchDieter ElefantXudong LouFrancois StoffelbachChristophe DetrembleurRobert Jérôme
Synthesis and Depositionof Water-Dispersed Prussian Blue Nanocrystalson Polymers and CNTs
Vera Bocharova · Ganna Gorodyska ·Anton Kiriy () · Manfred StammLeibniz Institute of Polymer ResearchDresden, Hohe Str. 6, 01069 Dresden,Germanye-mail: [email protected]
Paul SimonMax-Planck-Institut for Chemical Physicsof Solids, Nöthnitzer Str. 40,01187 Dresden, Germany
Ingolf Mönch · Dieter ElefantLeibniz Institute for Solid State andMaterials Research Dresden, IFWDresden, Helmholtzstraße 20,01069 Dresden, Germany
Xudong Lou · Francois Stoffelbach ·Christophe Detrembleur · Robert JérômeCenter for Education and Research onMacromolecules (CERM), University ofLiege, Sart-Tilman, B6, 4000 Liege,Belgium
Abstract Nanoparticles can be usedfor decoration and functionalizationof single polymer molecules that havebeen adsorbed to a solid substrate.Initial attempts to prepare PrussianBlue nanoclusters by a layer-by-layerdeposition technique of hexacyano-ferrate anions and ferric cations ontoisolated polycation chains in waterfailed because of the desorption ofthe first layer upon deposition ofthe next one. A simple method forthe preparation of charge-stabilizedPrussian Blue nanoparticles of readilyadjustable size is reported. PrussianBlue nanoparticles have been purifiedby addition of non-solvents and redis-persed in water without aggregation.Thus formed Prussian Blue nanopar-ticles are crystalline and displaya long-range ferromagnetic orderingat 5.1 K. Prussian Blue nanoparticleswere selectively deposited along
single polycation molecules to forma one-dimensional array or wereattached to the surface of carbonnanotubes (CNTs) functionalizedwith poly2-vinylpyridine (P2VP).These nanoparticle-based nano-structures might be useful materialsfor manufacture of electroopticaldevices, or mechanically robustion-sieving membranes.
Keywords Prussian Blue ·Nanocrystal · Carbon nanotubes ·Magnetic properties
Introduction
Semiconductor and metallic nanoparticles have been ex-tensively studied as active components in wide variety ofbasic research and technological applications due to theirnew or improved optical, electric, and magnetic proper-ties compared to their bulk counterparts [1]. Therefore,exploitation of well-known materials in their new nano-sized forms is strongly motivated area of research. Prus-sian Blue [2], an old pigment, is a coordination polymerformed by reaction of either hexacyanoferrate(II) anionswith ferric (Fe(III)) cations, or hexacyanoferrate(III) an-ions with ferrous (Fe(II)) cations [3]. According to X-
ray diffraction analysis, PB is a three-dimensional crystalof ferric and ferrous ions, which alternate at the sites ofa cubic lattice [4]. The ferric ion is coordinated to the ni-trogen atoms, and the ferrous ion to the carbon atoms, ofthe bridging cyanide ligands. The remaining charge is bal-anced either by potassium ions in the so-called “soluble”PB, or by ferric ions in the “insoluble” PB. The term “solu-ble”, however, does not refer to the true solubility but onlyto the tendency of PB to form colloidal solutions [3].
A large family of cyano-bridged compounds witha cubic structure (PB analogues; PBs) is known for var-ious interesting physical properties [3]. Neff et al. re-ported that the oxidation state of the iron centers could

162 V. Bocharova et al.
be controlled electrochemically, making possible dramaticcolor changes [4] that could be used in electrochromicdevices (such as flat panel displays or switchable pic-tograms) [6, 7]. PB shows a long-range ferromagneticordering at 5.6 K, whereas few PBs undergo magnetizationat room temperature and even higher [8]. Hashimoto et al.showed that the magnetic properties of PBs could be mod-ulated not only by the chemical composition but also byan optical or electrical stimulation (photomagnetism andelectromagnetism, respectively) [9–11]. Finally, PBs ex-hibit remarkable ion-sieving properties as result of an openpore zeolite-like structure [12].
For the unique properties of PBs to be exploited,PBs must be deposited properly onto a solid support. Itis highly desirable to prepare mechanically robust PBsfilms with controlled thickness, chemical compositionand crystallinity, having ion-sieving membranes and elec-trochromic devices in mind [6], or to create regular pat-terns of PB-based single molecule magnets [13].
Classical methods of PB immobilization by cast-ing [14], dip-coating [5] or electrochemical deposition donot allow film thickness, composition and/or mechani-cal properties to be controlled accurately. This problemhas recently been overcome by the Langmuir-Blodget [15]and multiple sequential adsorption techniques [12, 16]based on the stepwise adsorption of hexacyanoferrate an-ions and ferric (or ferrous) cations. Unfortunately, thesemethods are relatively expensive and time-consuming pro-cedures. On the other hand, utilization of larger in size PBnanoparticles instead of small precursor ions would havea favorable effect on film assembly. However, only fewsynthetic methods of well-defined PB nanoparticles havebeen reported [10, 17–19]. As a rule, these nanoparticlesare protected by surfactants or embedded into matrixes,that is undesired for some applications. In our recent com-munication we reported on a straightforward approach tosurfactant-free water-dispersible negatively charged PBnanoparticles simply by the addition of ferric chlorideto an excess of potassium hexacyanoferrate(II) [17–19].Thus formed mixture of PB nanoparticles with excess ofunreacted hexacyanoferrate(II) salt were used to improvetopography and phase contrasts of single adsorbed poly-cation chains in case of atomic force microscopy (AFM)imaging [20, 21]. Nevertheless, several important issuessuch as stability, structural and magnetic properties of PBnanoparticles as well as their selective positioning still re-main unresolved and are among the tasks of the presentstudy.
Carbon nanotubes (CNTs) have shown exceptionalstiffness, strength and remarkable thermal and electri-cal properties, which make them ideal candidates for thedevelopment of multifunctional material systems [22].Nowadays, CNTs are dispersed within polymer in orderto improve their mechanical and electrical properties [23].Therefore, reinforcement of PB films by CNTs mightbe a strategy for manufacturing mechanically robust ion-
sieving membranes, and for creating electro-conductivepathways in a poorly conductive PB matrix. Recently,we reported on the covalent modification of multiwalledCNTs by poly2-vinylpyridine (P2VP) [24]. The P2VPshell provides an improved dispersibility of CNT-g-P2VPin water and organic solvents and is a versatile scaf-fold for deposition of nanoclusters. Such modificationswould be a method to modulate properties of CNTsnanotubes [25]. Furthermore, adsorption of CNT-g-P2VPonto oppositely charged surface results in transparentand highly conductive thin films, which can be used ashigh-surface area electrodes for fabrication of PB-basedsolid-state electrochromic devices with improved switch-ing time [6, 7].
This paper aims at reporting on the preparation, stabil-ity, structure, magnetic properties and positioning of PBnanoparticles.
Experimental Section
Materials
CNTs (MWNTs Thick purified from Nanocyl S.A., Bel-gium, 50 µm long, average inner diameter of 6 nm, outerdiameter of 25 nm, and purity higher than 95 wt %) weremodified by reaction of 0.3 wt % dispersion of CNTsin dry toluene (Aldrich) with a 100-fold wt excessof 2,2,6,6-tetramrthylpiperidinyl-1-oxyl (TEMPO) end-capped poly2-vinylpyridine (P2VP) [24, 25] in toluene at120 C for 24 h [26]. Synthesis of poly(methacryloyloxy-ethyl dimethylbenzyl) ammonium chloride (PMB) [27](MW = 6000 kg/mol, polydispersity index of 1.6) was re-ported elsewhere.
Layer-by-layer Assemblyon Isolated Polyelectrolyte Molecules
PMB molecules were deposited onto freshly cleanedSi-wafer in a stretched conformation by spin-coatingof a 0.005 g/l solution in acidified water (pH 2, HCl)at 10 000 rpm. The substrate with the PMB moleculeswas then immersed in solutions of K4Fe (CN)6 (orK3Fe(CN)6) solutions (0.5–15 g/l) and KCl (0–50 g/l) atthe same pH and for the same period of time as in the firstpart of the cycle. The substrate was analyzed by AFM aftereither half of cycle, a complete cycle or several cycles.
PB Clusters
Dispersion of PB clusters was prepared by mixing vig-orously a solution of K4Fe(CN)6 ·3H20 (1.18 mmol/l,Aldrich) in acidified water (HCl, pH 2.0) and an equalvolume of a solution of FeCl3 (Aldrich) at the samepH. Concentration of the FeCl3 solution was either0.148 mmol/l for the preparation of PB1 clusters (smaller

Synthesis and Deposition of Water-Dispersed Prussian Blue Nanocrystals on Polymers and CNTs 163
size), or 0.296 mmol/l for intermediate PB2 clusters, or0.444 mmol/l for larger PB3 clusters. A small amountof tetrahydrofuran (Aldrich) was added to the freshlyprepared dispersions of PB in order to separate the PBclusters from the unreacted K4Fe(CN)6 and KCl. PBclusters were collected by filtration, washed with a water-tetrahydrofuran solution (2 : 1), and redispersed in acidi-fied water (HCl, pH 2).
Deposition of the PB Nanoclusters
Si-wafers (Wacker-Chemitronics) were first cleaned withdichloromethane (Aldrich) in an ultrasonic bath for 5 min(3 times), followed by cleaning with a solution preparedby mixing of 4 volume parts of deionized water, 1 vol-ume part of 25% NH4OH (Aldrich), and 1 volume part of30% H2O2 (Aldrich) at 60 C for one hour. This NH4OH :H2O2 solution must be handled cautiously because of vi-olent reaction with organic compounds. Samples were fi-nally exposed to 50% sulfuric acid for 15 min and thenrinsed repeatedly with water purified through a Milli-pore (18 MQxcm) filter. Clean Si-wafers onto which ei-ther PMB molecules or CNT-g-P2VP nanotubes were de-posited (conc. of the CNT-g-P2VP dispersion was 0.1 g/l),were dipped in the freshly prepared dispersion of PB2(PB3) clusters for 3 min at 25 C, followed by washingwith water and drying under an argon flow. Samples forTEM investigations were prepared by depositing a drop ofthe PMB or CNT-g-P2VP solution onto a standard TEMgrid (Plano, Wetzlar, Germany) covered with a holey car-bon film. After drying, the PB2 dispersion in acidifiedwater (0.5 g/l) was added on the spot and removed witha filter paper one minute later. Finally, the grid was washedby adding a drop of water and removing it with a filterpaper.
AFM Measurements
A multimode AFM instrument and a NanoScope IV-D3100 (Digital Instruments, Santa Barbara) were oper-ated in the tapping mode. Silicon tips with a radius of10–20 nm, a spring constant of 30 N/m and a resonancefrequency of 250–300 kHz were used.
TEM Measurements
TEM images were recorded with a Philips CM 200 FEGat 200 kV. They were processed by the Digital Micrographprogram (Gatan, USA).
Magnetic Properties
Dry powder of the Prussian blue nanoparticles (PB3,∼ 15 nm) was compacted by epoxy glue. The magnetiza-tion measurements were performed in a SQUID magne-tometer (MPSM – Quantum Design).
Ellipsometry
The thickness of the polymer films was measured by anSE400 ellipsometer (SENTECH Instruments GmbH, Ger-many) with a 632.8 nm laser at a 70 incident angle.
Results and Discussion
Layer-by-layer Deposition of the Prussian BluePrecursors on Isolated Polyelectrolyte Molecules
Prussian Blue was tentatively deposited onto isolated poly-cations by the well-known layer-by-layer (or multiple se-quential adsorption) technique. The stepwise adsorptionof hexacyanoferrate anions and ferric (or ferrous) cationswas actually effective in fabricating PB films [12]. In thiswork, the first adsorption step of hexacyanoferrate anionsalong positively charged PMB chains were successful asconfirmed by the increase of the chain thickness by ap-proximately 0.7 nm (Fig. 1a).
However, whenever the hexacyanoferrate pre-adsorbedPMB chains on the Si-substrate were dipped into the ferricchloride solution, the hexacyanoferrate anions were com-pletely removed leaving bare PMB molecules undetectableat the rough Si-wafer surface. The complete removal ofthe previously deposited hexacyanoferrate layer was sys-tematically observed whatever the salt, e.g., FeCl2, NiCl2,CoCl2, CuCl2, PdCl2, and AuCl3, in a broad range of pHand ionic strength. When the deposition cycle of hexa-cyanoferrate and FeCl3 onto pre-adsorbed PMB moleculeswas repeated several times, local growth of relatively bigclusters was occasionally observed (Fig. 1b). The failureof the layer-by-layer deposition of PB clusters can beexplained as follows. The hexacyanoferrate anions inter-act expectedly with the positively charged units of the
Fig. 1 a AFM image of PMB molecules adsorbed onto Si-waferafter dipping into a 5 g/l solution of K4Fe(CN)6 in acidic waterand washing with water (the height of the worm-like structure isabout 0.6 nm). Further dipping into a FeCl3 solution removes thehexacyanoferrate anions and the PMB molecules are unobserved(image not shown). b AFM image of the sample shown in a afterthe fifth cycle of the sequential dipping into K4Fe(CN)6 and FeCl3solutions (FeCl3 being the outermost deposit layer): PB clusters(10 nm height) are randomly located and the PMB molecules areunobserved

164 V. Bocharova et al.
PMB molecules. In the next step, an excess of ferriccations interact with the pre-adsorbed hexacyanoferrateparticles and overcharge them. The accordingly formed PBnanoparticles are positively charged by a shell of ferriccations, which facilitate their detachment from the simi-larly charged PMB chains. The observations in this workare consistent with Tieke et al. who reported on the non-linear increase of the PB film thickness with the number ofdipping cycles [12]. This irregular growth was pronouncedup to the 6-th cycle and whenever the dipping time wasrelatively long. Thus, although the layer-by-layer methodis useful to prepare PB films onto polyelectrolyte multi-layers, it is ineffective in case of deposition onto isolatedpolycationic molecules.
Synthesis, Stability of Prussian Blue Nanoclustersand Deposition onto Polycations
In order to prepare clear dispersions of PB nanoparticlesdiluted acidic solutions (pH = 2) of FeCl3 and K4Fe(CN)6
Fig. 2 Representative three-dimensional (a) and two-dimensional(b,c ) topography a,b and phase c AFM images of PB clustersadsorbed along PMB chains deposited onto a Si-wafer: a PB1(∼ 4.8 nm); b–d PB3 (10–15 nm). c Cross-section is taken alongthe line in the image b, see the white arrow
(used in excess) were mixed [20]. Upon addition oftetrahydrofuran until a H2O-tetrahydrofuran volume ratioof 2, PB nanoparticles precipitated quantitatively and se-lectively. They were filtrated and washed with a water-tetrahydrofuran solution (2 : 1). Remarkably enough, theyare easily redispersed in water with a constant size. A dropof a PB dispersion in water (0.5 mg/l) was deposited onspin-stretched PMB chains onto a pre-adsorbed Si-wafer.After washing and drying, the sample was analyzed byAFM in the tapping mode. Figure 2 shows typical AFMimages of the beads-on-string morphology at the surface ofthe PMB chains. PB nanoparticles appear to be selectivelyand regularly attached along the polycation chains, whichindicates that this method should be successful anytimea substrate is covered by a tiny amount of polycations.
Range of PB dispersions were prepared by changingthe mixing ratios and the stirring time. The PB nanopar-ticles were analyzed by AFM and the images were sta-tistically treated. In most cases, a narrow size distribu-tion is observed (PDI = 1.1–1.2), which depends on theK4Fe(CN)6/FeCl3 mixing ratio. The average diameter ofthe PB nanoparticles is approximately 3.7 nm when theK4Fe(CN)6/FeCl3 molar ratio is 8/1, ∼ 4.8 nm for themolar ratio of 4/1, and 10–15 nm for the molar ratio of3/1. As a rule, the size of the PB nanoparticles remainsquasi constant with time. Obviously, the observed water-solubility of the clusters and stability of the dispersionsare due to excess of hexacyanoferrate-anions attached tothe surface of PB nanoparticles and caused their negativecharge.
Magnetic Properties
The magnetic properties of the dry powder of the PB hex-acyanoferrate (PB3, ∼ 15 nm) were investigated. Figure 3shows the field-cooled magnetization curve at externalmagnetic field of 10 G.
The critical temperature (Tc) where Prussian Bluenanoparticles turn to a ferromagnetic compound was foundto be ∼ 5.1 K that is slightly less then the value for thebulk PB (5.5 K). This result is qualitatively consistent with
Fig. 3 Field-cooled magnetization versus temperature curve for thePB3 clusters at an external magnetic field of 10 G

Synthesis and Deposition of Water-Dispersed Prussian Blue Nanocrystals on Polymers and CNTs 165
earlier reported observations of Zhou et al. [19] and Ue-mura et al. [18] for PB nanoclusters and PB nanowiresembedded into the polymer or alumina matrixes, respec-tively. It is believed that the decrease of Curie temperaturein PB nanoparticles comparably to the PB bulk comesfrom the diminution of the average number of nearest mag-netic interaction neighbors [19]. In our case the decreaseof the Tc is less pronounced, because the data representsthe magnetic properties of aggregated PB3 nanoclustersonly separated by rather thin hexacyanoferrate shell. In-vestigation of the magnetic properties of well-separatedPB nanoparticles (embedded into the polyelectrolyte ma-trix), as well as a dependence of magnetic propertieson the size of PB nanoparticles will be reported else-where.
Deposition of Prussian Blue Nanoclusterson Carbon Nanotubes
P2VP macroradicals were added to multi-walled carbonnanotubes (CNTs), which was proved to be an effective“grafting to” method [26]. In contrast to other methods ofCNTs modification, the macroradical addition does not re-quire any hard oxidative pre-treatment of the CNTs, whichpreserves their original size. Deposition of an amorphousshell at the surface of CNTs was confirmed by TEM obser-vations. Figure 4a shows modified nanotubes with closed
Fig. 4 a TEM images of CNT-g-P2VP; high-magnification images(insets) show the closed ends of the CNT-g-P2VP. b The HR TEMimage shows the multi-wall crystal lattice of the carbon nanotube(3.43 A); the arrow indicates a 2 nm thick amorphous layer, pre-sumably of P2VP
ends and a relatively smooth surface (see the insets ofFig. 4a). High-resolution images (Fig. 4b) reveal the multi-wall crystal lattice of the carbon nanotubes (3.43 A) thathave an average inner diameter of 6 nm, outer diameter of22 nm and a polymer shell of about 2 nm. On the assump-tion that density of the graphite and P2VP is 2.2 g/cm3
and 1 g/cm3, respectively, the 2 nm thick polymer shellamounts to approximately 13.6 wt % that nicely fits theTGA data (12 wt %).
CNT-g-P2VP forms a stable dispersion in acidified wa-ter (HCl, pH = 2) as result of the hydratation and expansionof the protonated P2VP chains. CNT-g-P2VP was dec-orated by water-dispersible Prussian Blue nanoparticlesafter previous deposition onto solid supports (Si-wafers orTEM-grids). Figure 5 shows an AFM image of CNT-g-P2VP before and after decoration by PB2. As expected,the roughness of the nanotube surface is significantly in-creased. Low-magnification TEM images (Fig. 6a) con-firm that the carbon nanotubes are covered by particles ofapproximately 10 nm.
This size is larger than the size of the pure PB2 esti-mated from the AFM observations (i.e., the height of theparticles because the width is systematically overestimatedby the tip-broadening effect). This difference is consistentwith the embedding of the PB2 in the P2VP layer. Thecore-shell morphology of these particles was confirmed byhigh resolution TEM (HR TEM). As seen from the Fig. 6,
Fig. 5 Representative AFM image (a) and cross-section (c) of CNT-g-P2VP; AFM image (b) and cross-section (d) of the CNT-g-P2VPafter PB deposition. The cross-sections c,d are repeated along thetubes shown in images a and b

166 V. Bocharova et al.
Prussian Blue nanoparticles are in the close contact withthe nanotube surface that would be helpful for efficientcharge injection from CNTs-based electrodes into the PB
Fig. 6 a TEM images of the CNT-g-P2VP after deposition of PB2clusters. b,c HR TEM images of the core-shell structure of the par-ticles consisting of a dense crystalline core (diameter of 3–5 nm)surrounded by a few nanometer-thick amorphous shell. HR TEMimage (d) and selected area diffraction pattern (e) confirm thecrystalline structure of the PB clusters (lattice distances of 2.09 A(Fe−N), 1.96 A and 1.83 A (Fe−C) that correspond to the (422),(333) and (404) reflections, respectively)
layer in electrochromic devices. A dense crystalline corewith 3–5 nm diameter is surrounded by a few nanometer-thick amorphous shell (Figs. 6b–d). The lattice of the PBnanodots is resolved with spacings of 2.09 A, 1.95 A and1.82 A that correspond to (422), (333) and (404) reflec-tions (Figs. 6d–e) [28]. The first reflection can be assignedto the Fe−N interatomic distance, and the last one to theFe−C distance.
In conclusions, water-dispersible, charge-stabilized,surfactant-free Prussian Blue nanocrystals were preparedby mixing solutions of ferric chloride and excess of potas-sium ferrocyanide. The average size was readily controlledby the molar ratio of the two reagents. Thus formed PBnanoparticles are crystalline and display long-range ferro-magnetic ordering at 5.1 K that is slightly lower than themagnetization temperature of the bulk PB. PB nanopar-ticles can be selectively attached to single polycationmolecules, or to the surface of CNTs pregrafted withP2VP. These Prussian Blue based nanostructures might beuseful materials for manufacture of electrooptical devicesor mechanically robust ion-sieving membranes.
Acknowledgement The authors are grateful for financial sup-port from the “Deutsche Forschungsgemeinschaft” (DFG) and the“Fonds National de la Recherche Scientifique (FNRS)”, Belgium,within the ESF EUROCORES/SONS program (02-PE-SONS-092-NEDSPE) and SFB 287 “Reactive Polymers” (B1 project). P.S.thanks Prof. H. Lichte and Dr. M. Lehmann for the opportunityto carry out TEM observations at the Triebenberg High-ResolutionLaboratory in Dresden.
References1. Klabunde KJ (2001) Nanoscale
materials in Chemistry. John Wiley &Sons
2. Miscellanea Berolinensia adincrementum scientiarum (1710)Berlin, p 377
3. Sharpe AG (1976) The chemistry ofCyano Complexes of the TransitionMetals. Academic Press, New York
4. Keggin JF, Miles FD (1936) Nature(London) 137:577
5. Neff VDJ (1978) Electrochem Soc125:886
6. DeLongchamp DM, Hammond PT(2004) Adv Funct Mater 3:224
7. DeLongchamp DM, Hammond PT(2004) Chem Mater 16:4799
8. Garde R, Villain F, Verdaguer M(2002) J Am Chem Soc 124:10531
9. Sato O, Iyoda T, Fujishima A,Hashimoto K (1996) Science 271:49
10. Moore GJ, Lochner EJ, Ramsey C,Dalal NS, Stiegman AE (2003) AngewChem 115:2847; Sato O, Kawakami T,Kimura M, Hishiya S, Kubo S, EinagaY (2004) J Am Chem Soc 126:13176
11. Ohkoshi S, Fujishima A, Hashimoto K(1998) J Am Chem Soc 120:5349
12. Pyrash M, Toutianoush A, Jin W,Schnepf J, Tieke B (2003) ChemMater 15:245
13. Sessoli R, Gatteschi, Caneschi A,Novak MA (1993) Nature 365:141
14. Tosshima N, Liu K, Kaneko M (1990)Chem Lett:485
15. Ravaine S, Lafuente C, Mingotaud C(1998) Langmuir 14:6347
16. Millward RC, Madden CE, SutherlandI, Mortimer RJ, Fletcher S, Marken F(2001) Chem Commun:1994
Synthesis and Deposition of Water-Dispersed Prussian Blue Nanocrystals on Polymers and CNTs 167
17. Vaucher S, Li M, Mann S (2000)Angew Chem 112:1863; Catala L,Gacoin JPB, Rivere E, Paulsen C,Lhotel E, Mallah T (2003) Adv Mater15:826
18. Uemura T, Kitagawa S (2003) J AmChem Soc 125:7814
19. Zhou P, Xue H, Luo H, Chen X (2002)Nano Lett 2:845
20. Kiriy A, Gorodyska G, Minko S,Tsitsilianis C, Jaeger W, Stamm M(2003) J Am Chem Soc 125:11202;Kiriy A, Gorodyska G, Kiriy N,Separovich R, Lupytsky R, Minko S,Stamm M (2005) Macromolecules38:501
21. Nearly at the same time, Hammondet al. have used a similar method toprepare PB particles, and they havepublished a comprehensive account ofthe use of PB-based films inelectrochromic devices [6, 7]
22. Baughmann RH, Zakhidov AA,de Heer WA (2002) Science 297:787
23. Dresselhaus MS, Dresselhaus G,Avouris P (2001) Carbon Nanotubes:synthesis, structure, properties andapplications. Springer, New York
24. Lou X, Detrembleur C, Sciannamea V,Pagnoulle C, Jérôme R (2004)Polymer 45:6097; Lou X, DetrembleurC, Pagnoulle C, Jérôme R, Bocharova
V, Kiriy A, Stamm M (2004) AdvMater 16:2123
25. Kong J, Franklin NR, Zhou CW,Chapline MG, Peng S, Cho KJ, DaiHJ (2000) Science 287:622
26. Chalari I, Pispas S, Hadjichristidis N(2001) J Polym Sci A: Polym Chem39:2889
27. Kiriy A, Gorodyska G, Minko S,Jaeger W, Stepánek P, Stamm M(2002) J Am Chem Soc 124:13454
28. Weiser HB, Milligan WO, Bates JB(1942) J Phys Chem 46:99; Buser HJ,Schwarzenbach D, Petter W, Ludi A(1977) Inorg Chem 16:2704; RobinMB (1962) Inorg Chem 1:337

Progr Colloid Polym Sci (2006) 132: 168–169© Springer-Verlag 2006 AUTHOR/TITLE INDEX
Adler H-JP→ Pareek PAlbrecht V, Janke A, Drechsler A,
Schubert G, Németh E, Simon F:Visualization of Charge Domainson Polymer Surfaces 48
Anuchkina AD→ Ermakova TB
Bellmann C→ Drechsler ABocharova V, Gorodyska G, Kiriy A,
Stamm M, Simon P, Mönch I,Elefant D, Lou X, Stoffelbach F,Detrembleur C, Jérôme R:Synthesis and Deposition ofWater-Dispersed Prussian BlueNanocrystals on Polymers andCNTs 161
Bratskaya S→ Schwarz SBraun H-G→ Salzer RBusche S, Kasper M, Mutschler T,
Leopold N, Gauglitz G: InteractionBehaviour of the UltramicroporousPolymer Makrolon® by OpticalSpectroscopic Methods 16
Busch P→ Drechsler ABusscher HJ→ Roosjen A
Chan KLA→ Kazarian SGChuraev NV→ Ermakova TBClaesson PM→ Dedinaite A
Dedinaite A, Joseph I,Gorochovceva N, Makuska R,Claesson PM: Interfacial Propertiesof Chitosan-PEO Graft Oligomers:Surface Competition withUnmodified Chitosan Oligomers124
Detrembleur C→ Bocharova VDrechsler A, Petong N, Bellmann C,
Busch P, Stamm M, Grundke K,Wunnicke O, Reichelt J: The Effectof Adsorbed Cationic Surfactant onthe Pattern Collapse of PhotoresistLines in PhotolithographicProcesses 82
Drechsler A→ Albrecht VDubreuil F→ Elsner NDutschk V→ Synytska A
Eichhorn K-J→ Synytska AElefant D→ Bocharova VElsner N, Dubreuil F, Weinkamer R,
Wasicek M, Fischer FD, Fery A:Mechanical Properties ofFreestanding PolyelectrolyteCapsules: a Quantitative ApproachBased on Shell Theory 117
Ermakova TB, Sergeeva IP,Anuchkina AD, Sobolev VD,Churaev NV: Electrokinetic Studyof Layer-by-Layer Polyelectrolyteand Surfactant Adsorbed Layers95
Fery A→ Elsner NFilipowska B→Walawska NFischer FD→ Elsner NFriedrich J, Kühn G, Mix R,
Hoffmann K, Resch-Genger U:Tailoring of Polymer Surfaces withMonotype Functional Groups ofVariable Density Using Chemicaland Plasma Chemical Processes62
Gauglitz G→ Busche SGorochovceva N→ Dedinaite AGorodyska G→ Bocharova VGrundke K→ Drechsler AGrundke K→ Synytska AGuérin G, Raez J, Wang X-S,
Manners I, Winnik MA:Polyferrocenylsilane BlockCopolymers: Nanotubes andNanowires through Self-Assembly152
Hoffmann K→ Friedrich J
Ionov L→ Synytska A
Jaeger W→ Schwarz SJanke A→ Albrecht VJanke A→ Schwarz SJoseph I→ Dedinaite AJérôme R→ Bocharova V
Kasper M→ Busche SKazarian SG, Chan KLA: Sampling
Approaches in Fourier TransformInfrared Imaging Applied toPolymers 1
Kern W→ Temmel SKiriy A→ Bocharova VKitsche M→ Salzer RKremer F→ Serghei AKuckling D→ Pareek PKühn G→ Friedrich J
Leopold N→ Busche SLou X→ Bocharova VLuxbacher T→ Temmel S
Makuska R→ Dedinaite A
Manners I→ Guérin Gvan der Mei HC→ Roosjen AMinko S→ Synytska AMix R→ Friedrich JMönch I→ Bocharova VMüller-Buschbaum P: High-resolution
Grazing Incidence Small AngleX-ray Scattering: Investigation ofMicrometer Sized StructuredPolymer Films 23
Mutschler T→ Busche S
Nagel J→ Schwarz SNémeth E→ Albrecht VNorde W→ Roosjen A
Osterhold M: Characterizing PhysicalProperties of Coating Surfaces –Mar Resistance and SurfaceStructure 41
Pareek P, Adler H-JP, Kuckling D:Tuning the Swelling Behavior ofChemisorbed Thin PNIPAAmHydrogel Layers by N,N-DimethylAcrylamide Content 145
Petong N→ Drechsler A
Raez J→ Guérin GReichelt J→ Drechsler AResch-Genger U→ Friedrich JRoosjen A, Norde W, van der Mei HC,
Busscher HJ: The Use of PositivelyCharged or Low Surface FreeEnergy Coatings versus PolymerBrushes in Controlling BiofilmFormation 138
Rybicki E→Walawska N
Salzer R, Zimmerer C, Kitsche M,Steiner G, Braun H-G: MolecularImaging of MicrostructuredPolymer Surfaces 7
Schubert G→ Albrecht VSchwarz S, Nagel J, Janke A,
Jaeger W, Bratskaya S: Adsorptionof Polyelectrolytes withHydrophobic Parts 102
Sergeeva IP→ Ermakova TBSerghei A, Kremer F: Unexpected
Preparative Effects on theProperties of Thin Polymer Films33
Simon F→ Albrecht VSimon F→ Spange SSimon P→ Bocharova VSobolev VD→ Ermakova TB

169
Spange S, Wolf S, Simon F:Adsorption of Poly(vinylformamide-co-vinyl amine)(PVFA-co-PVAm) onto MetalSurfaces 110
Stamm M→ Bocharova VStamm M→ Drechsler AStamm M→ Synytska ASteiner G→ Salzer RStoffelbach F→ Bocharova VSynytska A, Ionov L, Dutschk V,
Minko S, Eichhorn K-J, Stamm M,Grundke K: Regular PatternedSurfaces from Core-Shell Particles.Preparation and Characterization72
Temmel S, Kern W, Luxbacher T: ZetaPotential of PhotochemicallyModified Polymer Surfaces 54
Walawska N, Rybicki E, Fili-powska B: Physicochemical
Changes on Wool Surfaceafter an Enzymatic Treatment131
Wang X-S→ Guérin GWasicek M→ Elsner NWeinkamer R→ Elsner NWinnik MA→ Guérin GWolf S→ Spange SWunnicke O→ Drechsler A
Zimmerer C→ Salzer R

Progr Colloid Polym Sci (2006) 132: 170–171© Springer-Verlag 2006 KEY WORD INDEX
Adhesion, microbes 138Adhesion joints 110Adhesion promoter 146Adsorption 95– cationic surfactant 82AFM 23, 48, 117Aging 95Amidine formation 111Appearance 41Atomic force microscopy 23, 48, 117Attenuated total reflection (ATR) 1
Biofilm 138Biomaterial centered infection 138Blends 1Block copolymers 152Born approximation, distorted-wave
25Brushes 124, 138
Capillary forces 82Capsules 117Carbon nanotubes 161Catheters 138Cationic surfactant 82Charge dissipation/domains 48Chemosensors/chemical sensor 16Chitosan 131Chitosan-PEO 124Clearcoats 41Coatings 41– free energy 138Coil-crystalline block 152Confined polymers 33Contact angle 54Core-shell particles 72Cross-linkable micelles 152CSDAPM 95
Data fusion 7Deformation 95, 117Diamond ATR 1Diborane 66N,N -Dimethylacrylamide (DMAAm)
145Dimethylaminopropylmaleimide 952-(Dimethylmaleimido)-N−ethylacryl-
amide (DMIAAm)145
DRIFT 111
Electric charges 48Electric field imaging mode 48Electrokinetic measurements 131Enzymatic treatment, wool 131Escherichia coli 138
Finite element modelling (FEM) 118Flocculation 102Focal plane array 1Fracture resistance (critical load) 43Free energy coatings 138FTIR 1, 7Functional groups, introduction 62
GISAXS 23Glow discharge plasmas, low-pressure
62Glycolate spacer 65Graft copolymers 124Grazing incidence 23
Hexacyanoferrate 161Hip arthroplasties 138Hollow polymeric spheres, AFM 117Hydrogel 145Hydrophobizing 82
Imaging 1Infection, biomaterial centered 138Infrared spectroscopy 1Interference spectroscopy 16Isoelectric point (IEP) 131N -Isopropylacrylamide 146
Landau-Verwey-Overbeek 140Layer thickness 102LDPE 2– cross-linked 54LiAlH4 66Light scattering 152
Magnetic properties 161Mar resistance 41Metal surface 110Metal/polymer joints 110Micelles, cross-linkable 152– solution 152Microbial adhesion 138Microchip productionMicro-scratch 41Microstructured polymer 7Monotype functional groups 62Multilayers 117
Nanocrystal 161Nanoparticles 103NIPAAm 146
Optical microscopy 23Oxygen plasma treatment 62
P2VP 161PAH/PSS 118
Pattern collapse 82Patterned surfaces 72PBT 44PDMS 152PEI 125Pentafluoropolystyrene brush-FPS 72PEO, brushes 141PFS-PDMS 152PFS-PI 152Photo cross-linking 145Photoacid generator molecules 82Photolithographic process 82Photoresist lines 82Photoresist patterns, collapse 82Photosulfonation 54Plasma modification 62Plasmon resonance 7Plastic resistance 43PMBQ 102PMMA 8PNIPAAm 145Poly(butylterephthalate) (PBT) 44Poly(diallyldimethylammonium
chloride) (PDADMAC) 95Poly(ethylene imine) 125Poly(ethylene oxide), brushes 124,
141Poly(N -isopropylacrylamide) 145Poly(methacryloyloxyethyl
dimethylbenzyl-ammoniumchloride) 102
Poly(methyl)methacrylate (PMMA) 8Poly(vinyl amine) copolymers 110Poly(vinyl formamide) 110Poly(2-vinylpyridine) (P2VP) 161Polyallylamine (PAH) 118Polycarbonate, ultramicroporous
structure 16Polydimethylsiloxane (PDMS) 152Polyelectrolyte multilayer capsules
(PMCs) 118Polyelectrolytes 102, 117– adsorption 110– multilayer 95Polyethylene 54Polyferrocenyldimethylsilane (PFS)
152Polyisoprene 152Polymer blends 1Polymer brushes 138Polymer mobility, confinement effects
33Polymer surfaces, reactions 62Polypropylene (PP) foils 63Polypropylene oxide, brushes 142Polystyrene brush-PS 72

171
Polystyrene films, confinement effects33
Polystyrenesulfonate (PSS) 102, 118PPO, brushes 142Profilometry 41Prussian Blue 161PSS 102, 118PVFA-co-PVAm 110
ReflectometricRoughness, regularly patterned 72
SAXS 23Scratch 41– resistance 43SDS 95Semiconductor 161SF6 glass prisms 8Shell spring constant 121Shells 117Shrink resistance, wool 131Single-scratch tests 41
Small-angle scattering 23Sodium dodecyl sulfate (SDS) 95Solvatochromic measurements 110Spectral ellipsometry 16SPR 7, 102Staphylococcus epidermidis 138Streaming potential 95, 102Styrene 95Sulfochlorination 55Sulfonation 54Sulfoxidation 55Surface forces 124Surface free energy 138Surface modification 54Surface plasmon resonance
spectroscopy 16, 145Surface potential imaging mode 48Surface properties, wool 131Surface scattering 23Surfaces, patterned 72Surfactant, cationic 82Synchrotron radiation 23
Thin films, confinement effects 33– –, geometry 23Tribo-electric charging 48Tridecafluoro-1,1,2,2-tetrahydrooctyl
dimethylchlorosilane-FSI 72
Ultramicroporous polymer 16Ultra-small angle X-ray scattering
(USAXS) 23
Wave-scan DOI 41Wettability 72– wool 131Wool, enzymatic treatment 131– shrink resistance 131– wettability 131
X-ray photoelectron spectroscopy110
Zeta potential 54