progress chart - department of health
TRANSCRIPT
August 2007
Progress ChartYour Health and Human Services
Department of Health and Human Services

Your Health and Human Services: Progress Chart August 2007 �
Published by Shared Services, Department of Health and Human Services, Tasmania.
© Copyright State of Tasmania, Department of Health and Human Services, 2007.
This publication is copyright. No part may be reproduced by any process except in accordance with the provisions of the Copyright Act 1968.
Published on www.dhhs.tas.gov.auAugust 2007 ISSN 1823-3015

Your Health and Human Services: Progress Chart August 2007 �
Progress ChartSince the release of the first Progress Chart in October 2006 the Tasmanian
Government has progressed significant reforms across our health and human services.
We have implemented wide ranging reforms of our mental health system, which is
seeing people get improved access to services in the community. A number of mental
health service indicators are now being reported in the Progress Chart to provide the
community with information about the performance of this vital service. The Mental
Health Act 1996 is currently being reviewed and I recently released a discussion paper to
further progress reform and improve services to some of our most vulnerable citizens.
The Government has also put significant additional resources into Oral Health Services
Tasmania and the data indicates that this is having a positive impact in the community.
We have undertaken major reforms of our child protection system, which have resulted
in a halving of the unallocated cases list.
I also recently announced a review and reform process in Disability Services which
will start soon, and for this Progress Chart we have added information on these
important services.
Following the release of Future Health – Tasmania’s Health Plan in May, we are now
consulting with clinicians on the implementation plan and would expect this to be
available soon.
This month’s Progress Chart continues to reflect the need for the reforms outlined in
Tasmania’s Health Plan. While our hospitals continue to treat more people than ever, we
continue to face skills shortages, are challenged by an ageing population and increasing
levels of chronic diseases. These are all core issues that are addressed through Tasmania’s
Health Plan.
It is important that we keep the community informed about how our services are going,
the pressures that exist and the opportunities for improvement. I commend to you the
information presented in the Your Health and Human Services: Progress Chart for the June
2007 quarter.
Lara Giddings, MHAMinister for Health and Human Services
Your Health and Human Services
Lara Giddings, MHA

Your Health and Human Services: Progress Chart August 2007 �
What is the overall level of activity in our hospitals?
A separation refers to an episode of admitted patient care. Raw separations are not adjusted for the complexity of the episode of care and represent each individual episode of care in a given period.
Overall, the number of raw separations continues to increase at a steady rate. For the twelve months ending 30 June 2007, the total number of raw separations for our state’s public hospitals increased by 3.4 per cent when compared with the same period in 2006. Both the RHH and LGH increased their activity levels over this period. However, the extended closure of an operating theatre for maintenance at the Mersey Campus of the NWRH resulted in a decrease in activity during January and February 2007.
Weighted separations show the level and complexity of the work done in public hospitals, by combining two measures: the number of times people come into hospital and how sick people are when they come into hospital.
The number of weighted separations in our hospitals has continued to increase in recent years. However, for the twelve months to 30 June 2007, the increase was only 1.0 per cent statewide. This is primarily due to the decreased activity at the Mersey Campus for the reasons outlined above. The number of weighted separations at the RHH remained steady and increased at the LGH by 4.7 per cent over the same period.

Your Health and Human Services: Progress Chart August 2007 �
How busy are our emergency departments?
Emergency department services are provided at each of the state’s major hospitals. Emergency departments provide care for a range of illnesses and injuries, particularly those of a life-threatening nature.
This information shows the number of times that people presented at our emergency departments across the state. In the twelve months to 30 June 2007 there were 119 544 presentations in the state’s emergency departments. This represents an increase of 2.3 per cent over the same period in the previous year.
How many times have Tasmanians been treated in our outpatient clinics?
An outpatient is a person who receives medical services in a hospital or clinical setting, but does not require a stay in a hospital.
The number of occasions of service in each of our public hospitals’ outpatient clinics has continued to increase over the past four years, with over 823 000 occasions of service for the twelve months ending 30 June 2007. This represents a 5 per cent increase over the same period in 2006.
2004 2005 2006 2007
2004 2005 2006 2007

Your Health and Human Services: Progress Chart August 2007 �
What is the rate of hospital readmissions?
This shows the percentage of people whose readmission to hospital within 28 days of discharge was unplanned and unexpected. This could be due to a relapse or a complication resulting from the illness for which the patient was initially admitted.
Tasmania’s unplanned readmission rate of 0.6 per cent remains well below the Australian average (2004) of 2.8 per cent for public hospitals (Source: ACHS Clinical Indicators Report for Australia and New Zealand 1998-2004).
What percentage of patients is seen within recommended timeframes in our emergency departments?
2004 2005 2006 2007
Figure 6: Unplanned Readmissions Within 28 Days (for the 12 months ending 30 June)
0.2
1.3
1.9
0.80.8
0.8
0.4
1.2
0.4
0.4
0.8
0.5
0.0
0.4
0.8
1.2
1.6
2.0
RHH LGH NWRH
(%)
2004 2005 2006 2007
Australian Triage Scale Category 2 patients are those who require emergency treatment for very severe pain or imminently life-threatening or time-critical treatment. The Australian College for Emergency Medicine has set a target of 80 per cent of Category 2 patients to be seen within 10 minutes. The most recent Australian average is 75 per cent (Source: Australian Hospital Statistics 2005-06).
For the twelve months ending 30 June 2007, the percentage of Category 2 patients statewide seen within the recommended time frames was 70.3 per cent. At 81.3 per cent, the NWRH exceeded the national average while the LGH increased its figure by 10.6 per cent to 73.3 per cent, which is marginally below the national average.
With the move to the new DEM facility the RHH is implementing a number of strategies to improve emergency department performance, including:
• improvements in the emergency model of care, such as “streaming” patients based on patient acuity and complexity. This also includes the opening of the Short Stay Unit from late June 2007;
• improved bed management within the hospital; and• streamlined discharge processes to free up bed capacity.

Your Health and Human Services: Progress Chart August 2007 �
What is the usual time to wait for elective surgery?
A priority for Tasmanian hospitals over the past twelve months was to treat patients who had extended waiting periods. This contributed to increases in median waiting times for elective patients admitted from the waiting list at the LGH and NWRH, which concentrated on operating on patients who had been waiting the longest.
Over the past twelve months, the statewide median waiting times for elective surgery increased from 34 days to 38 days. All three hospitals have had extended periods of ward and theatre closures for important maintenance issues during 2006-07 which has impacted on operating theatre utilisation.
What is the waiting list for elective surgery?
This information shows the number of patients waiting for elective surgery who are ready to accept an offer of admission to hospital. The number of people on the waiting lists in all of our public hospitals has increased by 11 per cent from 30 June 2006 to 7 919 as at 30 June 2007.
Although the waiting lists have increased, the proportion of urgent patients seen within 30 days has also increased on a statewide basis. This is particularly evident at the LGH, where the proportion of urgent patients has increased from 69 per cent in 2003-04 to 97 per cent as at 30 June 2007.
2004 2005 2006 2007

Your Health and Human Services: Progress Chart August 2007 �
How many call outs has our Ambulance Service responded to?
An ambulance response occurs when a vehicle or vehicles are sent to a pre-hospital incident or accident. In the twelve months to June 2007, the total number of ambulance responses, which include emergency, urgent and non-urgent responses, increased by 1.6 per cent when compared to the same period in 2006.
The increase in total ambulance responses is largely due to the ageing of the population and an increase in the number of people with chronic conditions who are cared for at home and who require transport to hospital for acute episodes.
The capacity of the ambulance service has been increased in recent years through the provision of additional staff and ambulance stations to meet the growth in demand, with 30 new staff to be appointed this financial year.
How many people were admitted from the elective surgery waiting list?
The number of patients admitted from the elective surgery waiting list at the RHH remained stable for the twelve months to 30 June 2007, when compared to the same period in the previous year. Both the LGH and the NWRH experienced decreases over this same period. The significant decrease in figures for the NWRH resulted from the extended closure of an operating theatre for maintenance at the Mersey Campus in January and February 2007.
It should be noted that elective surgery represents only a small part of activity in our hospitals – about 15 per cent of overall activity.

Your Health and Human Services: Progress Chart August 2007 �
How many people access community palliative care services?
This indicator provides a measure of the overall level of activity, which includes clients assessed and admitted to the community (non-inpatient) Palliative Care Service.
In 2006-07, the introduction of a new service delivery model required the counting rules for this indicator to be adjusted, resulting in a decrease in the data for this period.
It should be noted that the decrease in data does not mean that service delivery demands have lessened. The Palliative Care Service continues to have a role in the direct care of clients with complex needs and an expert advisory role supporting primary care providers in the ongoing management of other clients’ needs.
For further information about the new palliative care service delivery model, please refer to the Explanatory Notes at the end of this document.
How quickly does our Ambulance Service respond to calls?
Emergency response time is the period from when the 000 call is received until the vehicle arrives at the scene. The median response time is the time within which 50 per cent of emergency cases are responded to. While data is not strictly comparable between state jurisdictions due to the diverse combinations of urban and rural settings, Tasmania has a longer response time than other states. This is primarily because Tasmania has the largest proportion of its population dispersed throughout small rural areas (almost twice the national average).
Median response times for the more populated areas of Tasmania such as Hobart (9 minutes), Launceston (10 minutes), Devonport (7 minutes) and Burnie (8 minutes) are similar to many urban areas of other states and territories.
Emergency response times have remained consistent over the past few years and extra crewing allocated by government has been aimed at ensuring response performance is maintained.

Your Health and Human Services: Progress Chart August 2007 �
How many dental appointments have adults accessed?
This information shows the number of appointments for all dental services (episodic care, general care and dentures) provided by Oral Health Services around the state. Over recent years, the total number of people using dental services has remained relatively constant, but in the past twelve months, there have been increases in all three service areas.
This can be attributed to an increase in the number of dental officers, to a level not seen since the abolition of the Commonwealth Dental Scheme, which has enabled an increased level of care to be provided. This is evident in the 31.4 per cent increase in general care occasions of service in the twelve months to 30 June 2007 and a 39.3 per cent increase in dentures occasions of service, compared to the same period in the previous year.
How many women are screened for breast cancer?
This indicator provides a measure of the number of eligible women screened for breast cancer, with the target population being all women in Tasmania aged between 50 and 69 years (but all women aged over 40 years are eligible for screening services). Screening for breast cancer amongst the eligible population occurs biennially. Service performance is therefore best measured by monitoring both the annual absolute screening numbers and the biennial change in screening numbers.
2004 2005 2006 2007

Your Health and Human Services: Progress Chart August 2007 �
What are the waiting lists for oral health services?
This indicator provides a measure of the number of people waiting for full (upper and/or lower) dentures. This does not include people who are waiting for partial dentures, as these are included in the general care waiting list. Oral Health Services Tasmania uses private providers to help address denture demand.
Between June 2004 and June 2007, the number of people on the dentures waiting list has decreased by 438, or 52.9 per cent, and is continuing to decrease.
This indicator provides a measure of the number of adults waiting for general care oral health services. The number of adults waiting for general care has remained relatively constant.
Oral Health Services Tasmania has received funding to purchase care in the private sector for those on the waiting list. Services to these clients commenced in the north west in April 2007 with a positive effect on the waiting list in that region. Oral Health Services Tasmania continues to negotiate regarding the purchase of services in the north and south of the state and it is anticipated that these will commence in 2007–08.
How many dental appointments have children accessed?
There has been an increase of 1.7 per cent in the number of times children accessed dental care for the twelve months ending 30 June 2007 over the same period in the previous year.
A growing national shortage of dental therapists is likely to continue to affect Oral Health Services’ capacity to see children. Seven new dentists have been recruited in 2006-07, and Oral Health Services is working in partnership with the University of Tasmania to address this issue through the development of training for oral health professionals within Tasmania.
Your Health and Human Services: Progress Chart August 2007 �0
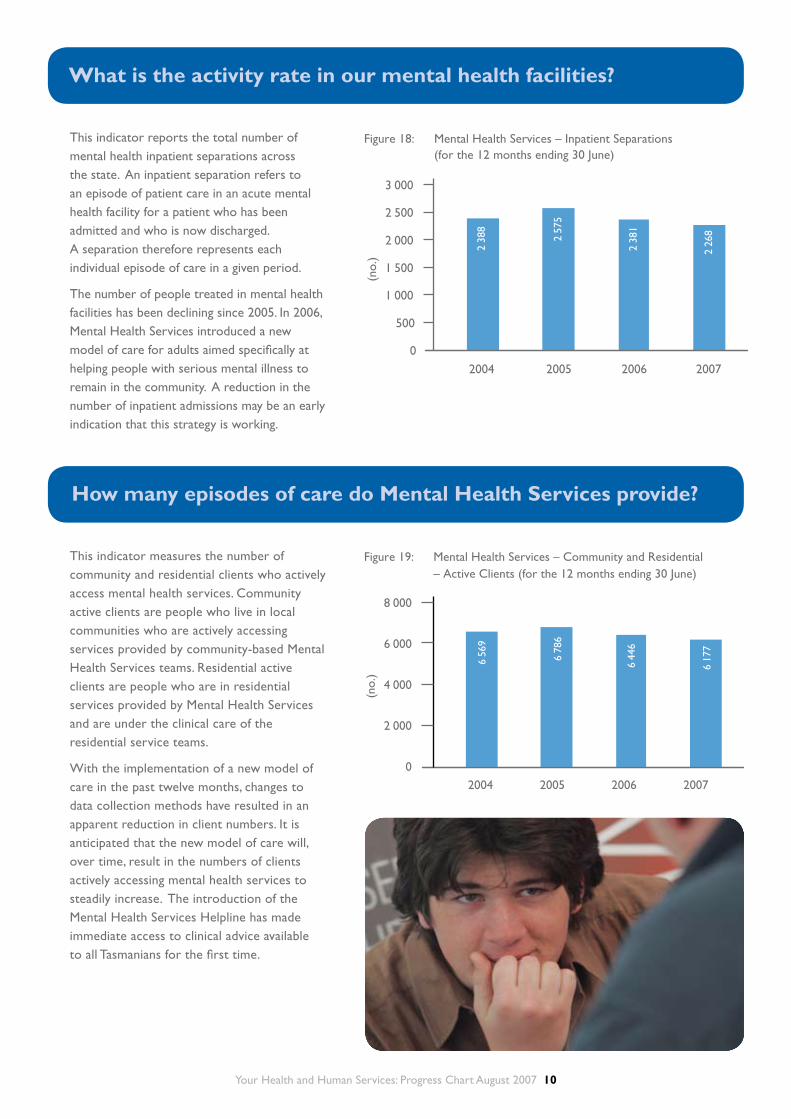
What is the activity rate in our mental health facilities?
This indicator reports the total number of mental health inpatient separations across the state. An inpatient separation refers to an episode of patient care in an acute mental health facility for a patient who has been admitted and who is now discharged. A separation therefore represents each individual episode of care in a given period.
The number of people treated in mental health facilities has been declining since 2005. In 2006, Mental Health Services introduced a new model of care for adults aimed specifically at helping people with serious mental illness to remain in the community. A reduction in the number of inpatient admissions may be an early indication that this strategy is working.
How many episodes of care do Mental Health Services provide?
This indicator measures the number of community and residential clients who actively access mental health services. Community active clients are people who live in local communities who are actively accessing services provided by community-based Mental Health Services teams. Residential active clients are people who are in residential services provided by Mental Health Services and are under the clinical care of the residential service teams.
With the implementation of a new model of care in the past twelve months, changes to data collection methods have resulted in an apparent reduction in client numbers. It is anticipated that the new model of care will, over time, result in the numbers of clients actively accessing mental health services to steadily increase. The introduction of the Mental Health Services Helpline has made immediate access to clinical advice available to all Tasmanians for the first time.
Your Health and Human Services: Progress Chart August 2007 ��
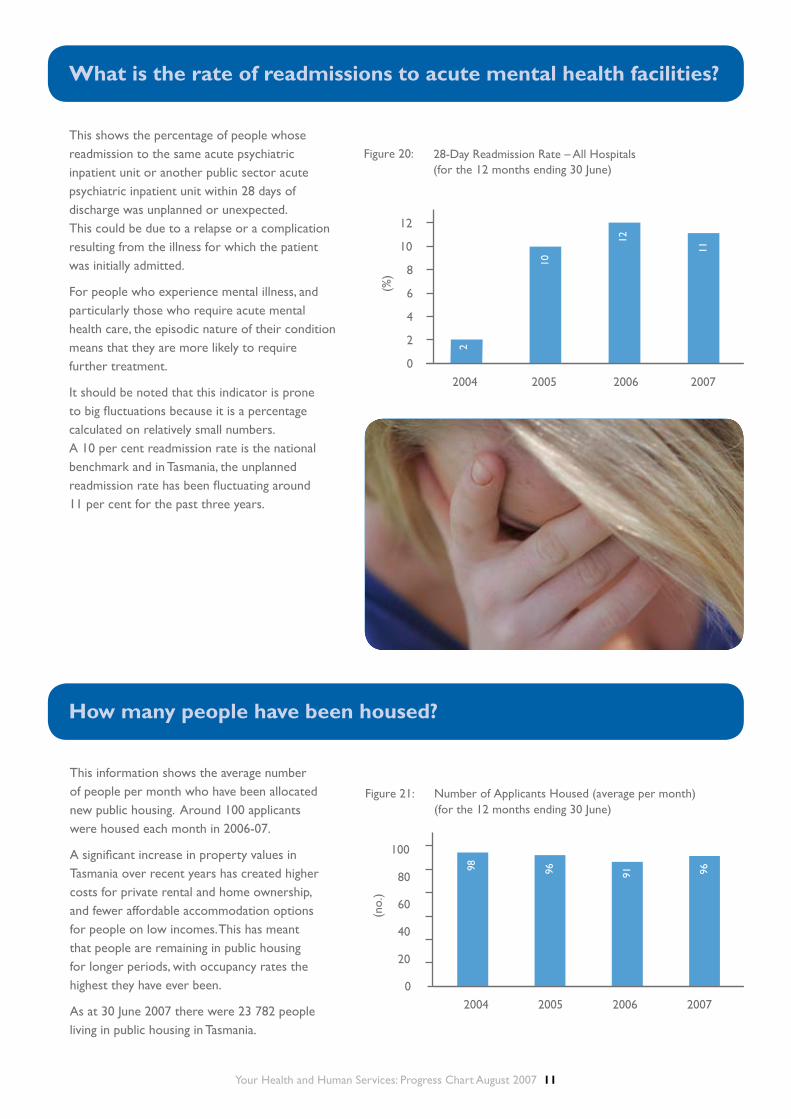
What is the rate of readmissions to acute mental health facilities?
This shows the percentage of people whose readmission to the same acute psychiatric inpatient unit or another public sector acute psychiatric inpatient unit within 28 days of discharge was unplanned or unexpected. This could be due to a relapse or a complication resulting from the illness for which the patient was initially admitted.
For people who experience mental illness, and particularly those who require acute mental health care, the episodic nature of their condition means that they are more likely to require further treatment.
It should be noted that this indicator is prone to big fluctuations because it is a percentage calculated on relatively small numbers. A 10 per cent readmission rate is the national benchmark and in Tasmania, the unplanned readmission rate has been fluctuating around 11 per cent for the past three years.
How many people have been housed?
This information shows the average number of people per month who have been allocated new public housing. Around 100 applicants were housed each month in 2006-07.
A significant increase in property values in Tasmania over recent years has created higher costs for private rental and home ownership, and fewer affordable accommodation options for people on low incomes. This has meant that people are remaining in public housing for longer periods, with occupancy rates the highest they have ever been.
As at 30 June 2007 there were 23 782 people living in public housing in Tasmania.
Your Health and Human Services: Progress Chart August 2007 ��
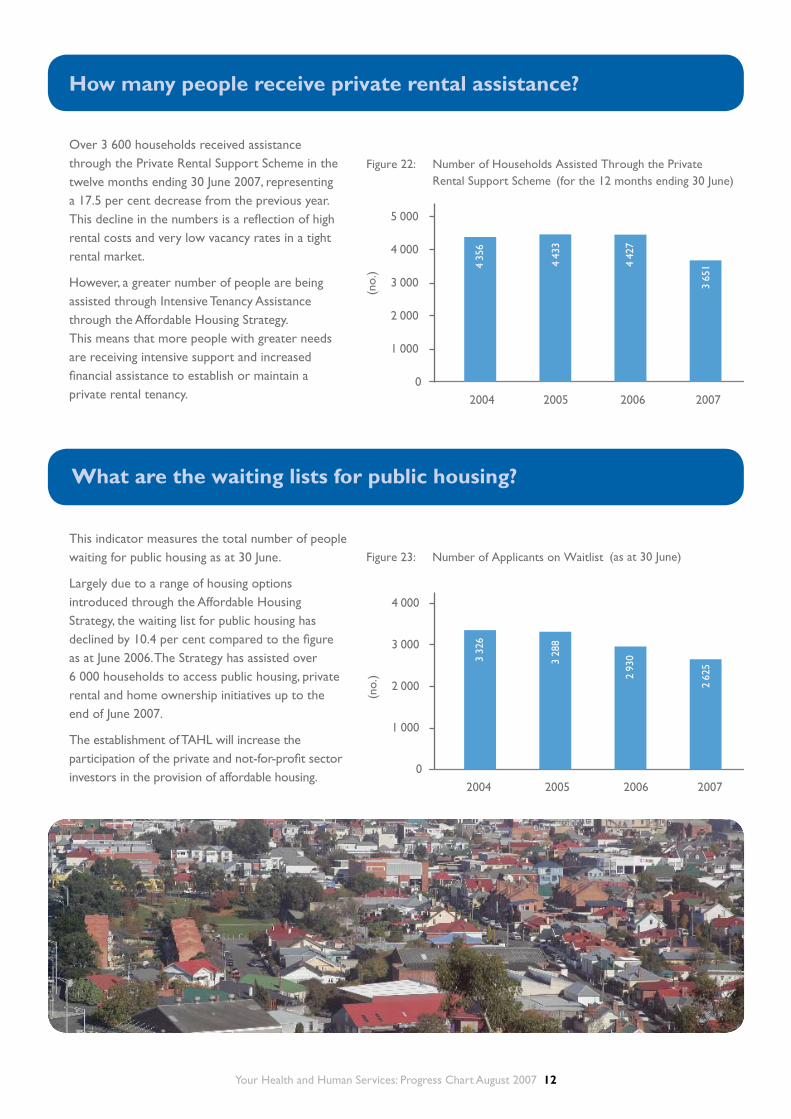
What are the waiting lists for public housing?
This indicator measures the total number of people waiting for public housing as at 30 June.
Largely due to a range of housing options introduced through the Affordable Housing Strategy, the waiting list for public housing has declined by 10.4 per cent compared to the figure as at June 2006. The Strategy has assisted over 6 000 households to access public housing, private rental and home ownership initiatives up to the end of June 2007.
The establishment of TAHL will increase the participation of the private and not-for-profit sector investors in the provision of affordable housing.
How many people receive private rental assistance?
Over 3 600 households received assistance through the Private Rental Support Scheme in the twelve months ending 30 June 2007, representing a 17.5 per cent decrease from the previous year. This decline in the numbers is a reflection of high rental costs and very low vacancy rates in a tight rental market.
However, a greater number of people are being assisted through Intensive Tenancy Assistance through the Affordable Housing Strategy. This means that more people with greater needs are receiving intensive support and increased financial assistance to establish or maintain a private rental tenancy.

Your Health and Human Services: Progress Chart August 2007 ��
How many cases (child protection) are referred for investigation?
The number of notifications of child abuse and neglect that were referred for further investigation has continued to increase significantly over the past 12 months. This increase is due, in part, to the introduction of the Family Violence Act 2004. This legislation included an amendment to the Children, Young Persons and Their Families Act 1997 which extended the definition of abuse and neglect to include a child affected by family violence. This in turn has resulted in a significant increase in the number of notifications from the Department of Police and Emergency Management about children affected by family violence.
A working group of officers from DHHS and the Department of Police and Emergency Management is also developing protocols and processes for the referral of children to the child protection system by police, especially as a result of family violence.
In response to a wide-ranging review of Tasmania’s child protection system released in November 2006, the Tasmanian Government has commenced a reform of the child protection system, including the implementation of a new structure for Child Protection Services and consideration of amendments to the Children, Young Persons and Their Families Act 1997 as recommended in the 2006 Review of Child Protection.
What is the usual wait for people with priority housing needs?
This shows how long it takes to house applicants with priority housing needs. The identification of priority applicants involves an assessment of need, based on adequacy, affordability and appropriateness of housing, with Category 1 being the highest level of need.
The reduction over the past two years in the average time to house Category 1 applicants has been mainly driven by the general decline in turnaround time for properties. There is no national comparison available for time to house Category 1 applicants (as jurisdictions determine priority allocations according to their own policies).

Your Health and Human Services: Progress Chart August 2007 ��
How many children are placed in out-of-home care?
There are six categories of ‘children in out-of-home care’: extended family; family group homes; approved children’s homes; foster care; kinship care; and ‘other placements’.
The steady increase in the number of children in out-of-home care reflects the commitment by the Department to provide safe placements for children affected by abuse and neglect.
The greatest proportion of children in out-of-home care is placed in foster care and the second greatest proportion are placed in extended family/kinship care arrangements. The current KPMG consultancy to restructure child protection services and enhance family support services is expected to reduce the number of children in out-of-home-care in the future by improving early intervention and support.
How many notifications (child protection) are not allocated?
This refers to the number of notifications of child abuse and neglect received by the Department that are not allocated for investigation within established time frames.
The significant increase in numbers over the past few years is attributed to an increase in notifications due to the Safe at Home initiative and a corresponding increase in the number of Priority 1 notifications, which take more time to investigate than notifications of a lower priority.
A reform of the child protection system is currently underway in Tasmania. As part of this, a central team of five staff members was created to work on the unallocated list on a time limited basis and an additional 20 staff were also recruited until 30 June 2007 to increase the capacity of the system to decrease this list. This resulted in a significant improvement in the situation in recent months. Between 31 December 2006 and 30 June 2007, the number of unallocated cases decreased from 1 793 to 894, representing a decrease of 50 per cent.

Your Health and Human Services: Progress Chart August 2007 ��
What is the waiting list for day options clients?
Day options are also referred to as community access services, and provide activities which promote learning and skill development and enable access, participation and integration in the local community.
The indicator shows the number of people with a disability who are waiting for a full-time or part-time day options placement. Some of the people on this waiting list may already be receiving a part-time day options placement but may have requested additional hours. Day options waiting list numbers provide a broad indication of unmet demand for a range of community access services among people with a disability in Tasmania.
While the waiting list has increased from 23 people in June 2004 to 107 people in June 2007, the number of people receiving community access services has also increased over a similar period, from 1 166 in 2003-04 to 1 552 in 2005-06.
What are the waiting lists for people requiring supported accomodation?
Supported accommodation services provide assistance for people with a disability within a range of accommodation options, including smaller and larger residential care settings, hostels and group homes.
As well as providing support for daily living these services promote access, participation and integration into the local community. The majority of supported accommodation is provided by community-based organisations that are funded by Disability Services. As at 30 June 2006 there were 1 100 people receiving supported accommodation and this figure is not expected to alter significantly when the figures for 2006-07 become available.
This indicator shows the number of people waiting for a supported accommodation placement. To assist in addressing unmet demand for supported accommodation, a project to examine future accommodation options for Tasmanians with a disability is about to commence. The project will make recommendations on the effective use of current resources and will focus on the needs of ageing clients.
In July 2007, the Minister for Health and Human Services announced a review and reform program for disability services in Tasmania. This process will consider the impact of increased demand for services, and will provide advice on the directions and best practice service models needed in order to use available funding in an equitable, cost effective and sustainable way to provide high quality disability services.

Your Health and Human Services: Progress Chart August 2007 ��
EXPLANATORY NOTES
1. This edition of Your Health and Human Services: Progress Chart presents data for the twelve months to June 2007.
2. It should be noted that from December 2004, patient activity at the Mersey Campus has been included in the figures for the North West Regional Hospital, as the Government assumed management of the facility from that date. Consequently, direct comparisons with previous years are not possible for the North West Regional Hospital. Over time, directly comparable information will become available.
3. A priority for palliative care has been to develop integrated networks between primary health care providers and specialist palliative care services. From 1 July 2006, a new palliative care service delivery model has been implemented and integrated networks developed. The new service delivery model recognises that not all people with a life-limiting illness need the same level of access to specialist palliative care during the course of their illness. Even when patient or family needs are such that specialist care is needed, it is likely to be episodic rather than sustained care that is required.
The service delivery model ensures that patients and their families receive palliative care and support in such a way that ensures that they have access to an appropriate level of care when and where it is required. This can be in the home with support from GPs and other primary care providers such as community nurses, in rural health facilities and regional hospitals or in the major acute hospitals.
Prior to introducing the new service delivery model, all clients who were referred and assessed remained as clients of the specialist service for the course of their illness. The new model recognises that some people (level 2 clients) needing palliative care will have reasonably predicted needs that can be met mainly by primary care providers. Palliative care continues to deliver specialist assessment for all referrals but level 2 clients are no longer recorded as clients requiring ongoing involvement from the specialist service. The service continues to have an expert role in care planning and/or advice to the primary care provider regarding the ongoing management of these clients’ needs.
4. From 1 January 2007, the activity measure for dental “Emergency Occasions of Service” has been renamed “Episodic Occasions of Service” to better reflect the new service model and the nature of care provided. “General Occasions of Service” has also been redefined to only relate to a full course of treatment provided to a client from the waiting list. The historical data reported for these indicators remains unchanged, although future trend comparisons between the number of general and episodic occasions of service will not be comparable with previous data.
5. The following acronyms are used in this report:
• ACHS Australian Council of Healthcare Standards • CSHA Commonwealth State Housing Agreement • DEM Department of Emergency Medicine • DHHS Department of Health and Human Services • LGH Launceston General Hospital • NWRH North West Regional Hospital • RHH Royal Hobart Hospital • TAHL Tasmanian Affordable Housing Limited
Explanatory notes

Your Health and Human Services: Progress Chart August 2007 ��
Department of Health and Human ServicesGPO Box 125Hobart TAS 7001
1300 135 513
www.dhhs.tas.gov.au