program of development studies william …pdf.usaid.gov/pdf_docs/pnaaa348.pdf · program of...
TRANSCRIPT

PROGRAM OF DEVELOPMENT STUDIES
121 Sewall Hall WILLIAM MARSH RICE UNIVERSITY
Houston, Texas 77001
Paper No. 43
INCOME DISTRIBUTION CONSEQUENCES OF AGRICULTURAL PRICE SUPPORTS IN COLOMBIA
By
Wayne R. Thirsk
Fall, 1973
The author is Assistant Professor of Economics at Rice University. This paper reports research related to AID contract no. csd-3302, on Distribution of Gains, Wealth and Income from Development. Program Discussion Papers .re preliminary materials circulated to stimulate discussion and critical comment.
References in publications to Discussion Papers should be cleared with the author to protect the tentative character of these papers.


Income Distribution Consequences of Agricultural Price Supports
in Colombia
1. Introduction
Colombia is not alone in pursuing agricultural policies that ambiguously em
brace the concept of market competition. In many countries, internal domestic pol
icies typically strive to create and preserve the relatively small scale, family
farm unit of production and the competitive market structure implied by the pre
servation of that unit. On the other h2nd, there are few countries which do not
attempt to shield their agricultural producers from the rigors of competition at
the international level. Most developed countries have adopted a protective
scheme of either tariffs of deficiency payments as a means of insulating domestic
producer prices and incomes from the vagaries and hazards of world price changes.
Common Market countries, for example, rely on a common exteinal tariff to elevate
the prices of domestic cereals above the import price of a comparable item bought
on the world market. The United Kingdom, Canada and the United States have all
to some extent depended on a system of deficiency payments and production con
trols to raise farm incomes beyond the level that would be determined by the mar
ket for farm commodities. A number of less developed countries, including Colombia,
have introduced policies seeking to inhibit the influence of international on do
mestic prices.
Although sometimes disguised as an aid to price stabilization, measures for
supporting domestic agricultural prices have been more frequently proposed on the
fncome distribution basis of improving inter-sectoral equity by raising relatively
low average agricultural incomes. Making poor farmers less poor has been the most
consistently voiced objective of these programs. Economic analysis of these pro
grams initially focused on their efficiency implications and either ignored, or

- 2
was less concerned with, the ability of these programs to meet their distributional
objectives. Without exception these studies indicate a loss in economic ef
ficiency will result from the imposition of price support programs. The nature
of the loss varies with the specific type of program implemented but in general
the loss arises from the fact that at the margin the cost of an extra unit of
output is worth either more or less than the value to the consumer. Recently,
however, there has been a reawakening of interest in the distributional issue and
new efforts have been made to determine the extent of income redistribution for
which price support programs are responsible. A raft of recent research exam
ining the experience of the United States provides the best example of this re
newed interest. Bonnen concluded that for a wide range of commodity programs it
required from twenty to one hundred dollars of program benefit to provide one
2 dollar to the bottom 20 per cent of farmers. The distr,,ssing capacity of farm
3 programs to enrich the nonpoor has been also emphasized by Schultze. Schultze
questions the desirability of a program whose subsidies accrue in the main to
those whose incomes exceed the nonfarm average and which apparently do little for
the low income farmer whose plight provided the original motivation for the pro
grams. Lidman takes issue with these results in that they are not achieved within
the framework of a model that incorporates supply adjustments as one of its main
1Two of the best attempts to ascertain the output losses or efficiency cost of these programs might be mentioned. These are T. D. Wallace, "Measures of Social Cost of Agricultural Programs," Journal of Farm Economics, May 1962, pp. 580-594 and Rachel Dardis and E. W. Learn, Measures of the Degree and Cost of Economic Protection of Agriculture in Selected Countries, U.S. Department of Agriculture, Economic Research Service, Technical Bulletin 1384, November 1967.
2James T. Bonnen, "The Distribution of Benefits from Selected U.S. Farm Programs," Rural Poverty in the United States: A Report of the President's National Advisory Commission on Rural Poverty, Washington, D.C., 1968, pp. 461-505.
3Chazles L. Schultze, The Distribution of Farm Subsidies, A Staff Paper, The Brookings Institution, Washington, D.C., 1971.

features. Instead they implicitly assume supply elasticities (and demand elast
icities, as well) for all crops are zero. Using a spatial linear programming
model of the agricultural sector, Lidman estimates the price and output changes
that would follow from the abandonment of the farm programs. His calculations
suggest that current farm programs augment the net incomes of farmers in different
sales classes almost proportionately. Despite the tendency of farm programs to in
significantly alter the dispersion of farm incomes, Lidman scores the undesirable
"trickling up" of benefits to the higher income groups.
Almost all of the previous work in the United States and elsewhere has ne
glected to deal with the effect of price supports on the uses of income. That is,
when relative prices change, people in any income group can become comparatively
worse or better off either because their nominal income is altered or because their
consumption pattern is more or less skewed than the average toward commodities with
relatively higher values. In its concentration on changes in the sources of income,
and failure to treat changes in the uses of income,previous research has been un
able to say much about how the real income of different income groups is modified
by price supports. This paper intends to breach this analytical gap by taking ac
count of the manner in which price supports in Colombia have operated on both the
earning and expenditure sides of the income statements of different income clapres.
This paper is divided into four remaining sections. The next section dis
cusses the history of agricultural price supports in Colombia and furnishes some
details on the methods used to achieve the goals of the price support program.
Then the model that is relied upon to measure the income redistribution due to
price supports is described. Its limitations and maintained hypotheses are also
IR.*M. Lidman, The Distribution of Benefits of Major Agricultural Pro
grams, unpublished University of Wisconsin Ph.D. thesis, January 1972.
-4
mentioned. Introduced in the same section are the data and data sources that
were meeded to answer the counterfactual question of which income groups would ben
efit or lose if domestic crop prices were brought into line with adjusted inter
national values. Since the hypothetical experiment of abandoning the price support
programs (though not necessarily its stabilization aspects) involves an efficiency
change in the allocation of resources, these aspects of current price supports are
analyzed in a subsequent section. A final section draws the results of various sec
tions together and points out some indirect effects of price supports which must be
considered in reaching an overall evaluation of the wisdom of price support programs.
2. The Development of Colombian Price Supports
Protection of Colombian agriculture dates from the depression of the 1930's
when tariff legislation was introduced which sharply raleed import duties on all
agricultural products. Subsequently, rigid import quotas were applied to basic food
stuffs both during and after World War II. In 1944 a semi-official marketing agency,
INA (Instituto Naaional de Abastecimiento), was established for the purpose of set
ting minimum prices for rice, corn, beans and wheat. As part of an overall import
substitution strategy of economic development, the avowed goal of INA was self
sufficiency in agricultural production. Support prices for other crops were left
in the hands of the various commodity organizations that were formed after World
War II with government encouragement. Thus the coffee growers federation supported
coffee prices, the tobacco institute maintained tobacco prices and the cotton de
velopment organization became concerned with the setting of sesame, cotton, cot
tonseed and other oil seed prices.
,much of the factual material in this and succeeding paragraphs borrows heavily from T. Goering, "Colombian Agricultural Price and Trade Policies," Facultad de Agronomia, Palmira, Valle, Colombia, 1961.

- 5 -
INA became the national instrument for importing crop goods and used its
import position to establish desired differentials between support prices and
domestic market prices. Usually the latter prices were kept above the former
prices to prevent an overloading of INA's limited storage capacity. In effect
INA's almost exclusive ability to import under a regime of foreign exchange li
censing was used to validate its system of price supports. The level of support
was based on the average cost, including a normal rate of return, of producing
the crop in Colombia. This process of establishing support prices prompted an
observation in the early 1960s that "the difference between domestic and world
prices has often been substantial, reflecting in part the strong motivation for
saving foreign exchange through import substitution."
INA's cost of intervention in the market, i.e., the costs of storage, oper
ating, etc., was entirely underwritten by the sizeable profits achieved from
importing commodities at world pzices and reselling them at higher domestic
prices and from the arbitraging of domestically produced crops over time and
space. In terms of its import replacement goal, INA was successful in reducing
dependence on foreign sources of supply for e large number of crops, the only not
able exception being wheat. In some instances producers were able to pressure INA
into restricting imports whenever they felt price movements threatened the profit
ability of their activities. 2 With a limited storage capacity that in the early
1960s permitted the purchase of only about 5 per cent of the total production
of supported crops INA never accumulated unsold surpluses that could only be sold
abroad at a substantial loss. In fact cotton represents a case in which an im
port substitution phase was folloed by an export phase that required only a small
iDale Adams et al, Public Law 480 and Colombia's Economic Development, Michigan State University, 1964, p. 39.
21n the book by Adams et al, ibid., p. 212, a case in which the cereal

-6
and temporary subsidy before the crop was able to compete in world markets with
out assistance.
From 1951 to 1958 INA was known as the Corporacion de Defensa de Productos
Agricolas. In 1968 INA was superseded by a new government controlled body called
IDEMA (Instituto de Mercadeo Agropecuario). In most important respects IDEMA
closely resembles its predecessor except that its range of functions and powers is
wider than before. Inventories of domestic crops and imports provide the supply
side control of domestic prices and constitute the source of the budget for IDEMA
as in the past. At planting time IDEMA announces floor prices for a wider crop
assortment including rice, sesame, barley, edible beans, corn, sorghum, soybeans, 1
wheat, potatoes and anis. IDEMA attempts to buy all that is offered at these
prices but uses its import power to insure floor prices are less than open market
prices and the bulk of the crop is therefore handled by p'ivate interests. Flor
prices are still pegged to average production costs inclusive of normal profit, are
uniform for all parts of the country, and are based on delivery to purchase or stor
age points owned and operated by IDEMA (or more precisely by the storage affiliate
known as INAGRARIO). IDEMA is also empowered to offer especially attractive in
centive prices (preclos de fomento) to stimulate the supply of particular products.
It may also purchase on-farm crop supplies at an intervention price somewhat less
than the market price in order to restrain short run price increases. Farmers are
enticed to sell at these prices because IDEMA will lower its quality standards (ac
cept a higher moisture and trash content) and absorb a portion of the farmers'
growers organization (FENALCE) brought about the reversal of INA plans to import P.L. 480 foodgrains is documented.
1Another government agency, the Superintendencia Nacional de Precios, controls the price and absorption of agricultural products used as an input in manufacturing processes and also distribution margins in the case of milk and meats.

- 7
transport costs. Normally most farmers must accept a higher transport charge be
cause of the limited number of IDEMA purchase points. However, in both the land
reform and colonization projects sponsored by the government land reform agency
there are no deductions to the farmer for transport costs.
In 1969 IDEMA purchases constituted approximately 11 per cent of the value
of the total output of those commodities enjoying price support. Ho~lever, 87 per
cent of the total purchases made by IDEMA during the 1968-70 period were concen
trated on the three products, corn, rice, and wheaL, which are most important in
terms of acreage, value, and foreign exchange use, respectively. With the assist
ance of loans from the Inter-American Development and U.S. Export-Import Banks
IDFMA embarked on a program in 1969 of expanding its storage capacity by 50 per
cent. By the end of 1973 IDEMA would be in a position to purchase about 20 per
cent of the annual output of major grain crops. According to FAO estimates this
capacity would be sufficient to guarantee price stabilization.1
This is not the place to attempt a detailed evaluation of the success of
IDEMA in meeting its own goals. There are, however, some crude indicators of
the appropriateness of IDEMA policies. Prices for any crop may be judged too
high if they induce import deficits in other crops and export losses for that
crop. There have been instances in which support prices have either distorted
production choices or resulted in losses on export sales. For example, in Valle
the policy of higher cotton prices in the middle 1950s led to a growth in cotton
acreage and a consequent glut in cottonseed cake at the same time there was a
IThis is a case in which success breeds on itself. If market partici
pants expect IDEMA to secure price stability their behavior will help to realize those expectations. Thus the existence of larger IDEMA capacity may mean it is never fully utilized in achieving stabilization.

-8
reduction in corn-bean acreage and a shortage of corn.1 In 1969 rice and maize
exports required a sizeable budgetary subsidy of 32.5 million pesos (about 1.8156
million U.S.) which was granted in response to the growing accumulation of stocks
in these two groups. It is not possible to say whether instances of this kind re
flect an inevitable lack of foresight about the strength of internal and external
demand or instead represent correctable defects of the price support policy. They
are worth noting in any case. A second criterion for judging the impact of IDEMA
policies is the ability of IDEMA to reduce the seasonal variance in agricultural
prices. One study of this matter concluded that government intervention through
IDEMA had achieved little effect in reducing the variance of either farm prices or 2
farm incomes. A before-and-after comparison of the kind in this study is not con
clusive, however, for it fails to indicate whether the instability in prices'with
out intervention would have been greater, the same, or less in the later period
when the government actually intervened. Perhaps the fairest judgment is that from
the perspective of achieving self-sufficiency and reducing price instability there
is no evidence of either dismal failure or unquestionable success.
3. An Income Distribution Model of Price Supports
A number of alternative approaches are available in quantifying the distri
butional impact of a price support program. For example, one could compare bene
fits as a fraction of gross income for different income groups. Another possibil
ity is a comparison of the percentage distribution of income in the absence of
1This situation is described in greater length by Goering, op. cit.,
pp. 9-10. 2Nestor Gutierrez Aleman, Costos Sociales de los Precios de Sustenacion
en Arroz, Instituto Colombiano Agropecuario, Bogota, Colombia, August 1972, p. 87.

-9
supports with the percentage distribution of program benefits.1 This approach
would lend itself to easy interpretation since Gini coefficients could be cal
culated to determine the changes in income distribution attributable to price
supports. While these methods of evaluation are of some interest they are not
used here because they focus exclusively on changes in nominal income.
A more complete analysis of the problem is to consider changes in real in
come and to recognize that the real gains won by any income group must be real
ized at the expense of other, less fortunate, income groups. This goal is simple
to achieve if an income size class is treated as the unit of analysis and redis
tribution within any class is ignored so that only the net position of the group
is allowed to count in assessing gains and losses.
The analysis begins with the straightforward proposition that the sum of the
purchases of domestic output for all income classes, valued at producer prices,
is equal to the income earned by all income classes. When certain behavioral as
sumptions are introduced,this accounting identity is converted into a useful ve
hicle for examining income redistribution.
To facilitate exposition, the following notation will be used:
Cij = amount of crop.j consumed by the ith income class, j = l...m; i -... n
P = producer price for crop J, j = l...m
Qij = amount of crop j produced by farmers who belong to the ith income class.
Mij = amount of imports of crrp j consumed by the ihincome class. Imports
are sold to consumers at price Pj, the same as domestic output. Total purchases
of crop goods by all income classes are distributed between domestic output and 1Methodologies of this kind have been adopted in the work of Bonnen and
Schultze, op. cit., for the United States. Bonnen concluded that the bulk of the expenditure on commodity programs eluded the pockets of the marginal farmer. The recent U.S. wheat sale to Russia illustrates the inadequacy of this approach to income distribution. The hue and cry raised by higher consumer prices for food was not considered at the time of the sale by the USDA which was concerned only with improving nominal farm incomes.

- 10
imports: nnm n m(1) CijPj = E Z Q +F Z M P
jiii j iiij
Ignoring the subscripts on the summation signs for the moment and taking first dif
ferences of equation (1) yields
(2) . E C.. LP + E E AC. P. + E E AP.AC.. = E2 Q 'P.+ F 2 LQijP j + 2 AQiPL
+ Z E M IjP + 2 Z MijP j + E Z AM ijAP.
This last expression provides the basic accounting framework for the study
of price supports. A number of assumptions need to be made and then discussed
in order to empirically implement this framework for Colombia. Since a major al
ternative to price supports is no support at all, the change in crop prices AP
that is envisioned involves allowing domestic crop prices to be ruled by world
price levels adjusted for overvaluation of the peso. That is, the income dis
tribution experiment looks at the real income gains and losses of different groups
when domestic crop prices are adjusted to world prices that take into account the
distortion in the current exchange rate. It is assumed that world prices of the
various crops would be unaffected by the abandonment of the support program. The
nature of the exc.hange rate adjustment is considered later on. Distribution mar
gins between the prices paid by consumers and the prices received by producers are
ignored throughout and assumed to be unchanging when domestic price supports are
removed. Thus the full extent of any change in producer prices is assumed to be
passed on to the consumer. Since most crops compete at the margin with imported sup
plies it is also assumed that pQ. = -4Mj or that changes in domestic output are exactly
offset by more or fewer imports. Where initial imports are a negligible fractio- of
total output it is alternatively assumed that AQj = 0 or that there is a zero supply

TABLE I: Market, Support and World Prices by Crop (Pesos), 1954-1970
Rice (Paddy) Wheat Barley Soybeans
Year Support Price
Market Price
World Price
Support Price
Market Price
World Price
Suppor. Price
Market Price
World Price
Support Price
Markst Price
World Price
1954 -- 470 400 571 710 -- 385 380 395
1955 400 475 542 642 650 197 415 400 271
1956 440 485 520 642 680 190 470 425 .. .... ..
1957 512 615 -- 725 760 402 498 480 .. .. 825 -
1958 840 750 -- 856 870 509 620 580 690 550 850 -
1959 840 770 845 921 940 494 684 630 608 650 1.050 653
1960 840 883 -- 921 880 505 684 624 800 800 559
1961 1,006 954 843 921 975 598 760 637 567 c00 850 635
1962 1,006 919 -- 921 957 651 -- 642 575 C50 900 631
1963 1,260 1,046 -- 1,098 1,052 807 -- 828 .. .. 1,200 1,039
1964 1,260 1,347 -- 1,428 1,394 732 -- 898 720 -- 1,600 1,042
1965 1.260 1,703 1,650 1,428 1,525 806 "" 999 739 1,460 1,700 1.044
1966 1,720 1,884 -- 1,714 1,755 1,020 -- 1,284 1,162 1,460 1,850 1,446
1967 2,050 1,914 1,896 1,714 1,756 1,052 -- 1,274 1,262 1,680 1,930 1,818
1968 2,050 2,106 -- 2,100 1,956 1,100 -- 1,490 1,148 1,620 ....
1969 2,000 1,866 1,450 2,100 2,059 1,150 2,000 1,600 1,260 2,000 1,600 1,260
1970 2,250 1,850 1,785 2,100 1,933 1,265 2,000 1,592 1,415 2,000 1,592 1,415
Notes: (1) Information on support p:ices came primarily from the government marketin, agency IDZHA but was supplemented in earlier years by the published material of other government organizations. Market prices for each crop are published regularly by the Banco de la Republica. Numerous sources accounted for the data on world
(CIF, Atlantic port of Colombia) prices including special reports on Colombia of the World Bank (IBRD), the Anuario de comercio Exterior of the National Statistical Agency DANE, unpublished IDEX& data, annual reports of FAO and
scattered bits of individual research on Colombian agriculture. Breaks in any price series indicate in most instances the unreliability of the data rather than its nonavailability.
- 12

elasticity for that crop. Because all crop prices would be adjusted at the same
time the structure of relative crop prices will not experience as much change as
when only a single price is altered and so the assumption of no quantity response
may not be extreme. It could in any event be removed if estimates of supply
elasticities were available. Similarly, it assumed that the response of con
sumers is imperceptible by invoking the same rationale as in the case of supply.
In addition to the dearth of demand elasticity estimates, the fact that a large
number of crop prices are permitted to vary together makes the assumption that
ACj = 0 not unreasonable.
When these restrictions are imposed on equation (2) the result is
(3) EC iiAPj - E E MijAPj = E E QijAPj orE E (Cij - Mij) AP. = E E QPijAP
Equation (3) is a first-order approximation of the income redistribution resulting
from a change in crop prices. There are two features of this equation worth noting.
For any income group the term E(Cij - Mij)APij measures the changes in income on the
uses side while the term EQ iAP measures the income change on the sources side. i j
The difference between these two measures indicates how the real income of the
particular group is altered. Moreover, the sum of the real gains and losses spread
over all groups is zero and the hypothesized price change therefore generates a
pure or zero-sum redistribution of income among the various income groups.
The data needed to implement this approach are contained in Tables 1, 2, and 3.
Price information on the eight crops that were considered is presented in Table 1.
Obtaining a consistent set of price data over time for any crop is difficult in
view of the uncertainties and potential distortions that result from variability in
the composition of crop grades, from different time intervals for the availability
of particular prices, and from conflict among various sources which often originates

TABLE 1 (cont.)
Corn Potatoes Beans Sesame Support Market World Support Market World Support Market World Support Market World
Year Price Price Price Price Price Price Price Price Price Pr!ce Price Price
1954 280 330 279 318 319 192 -- 1,140 621 -- 588 -
1955 280 300 -- 311 211 159 -- 1,070 566 -- 686 -
1956 319 350 -- 311 312 575 -- 1,360 559 -- 833 -
1957 319 430 347 311 311 -- 1,440 1,837 -- 1,323 -
1958 440 385 -- 360 370 621 1,280 1,440 1,490 1,350 1,323 -
1959 440 450 384 360 304 371 1,280 1,400 -- 1,350 1,323 1,250
1960 440 474 300 360 350 555 1,260 2,000 -- 1,550 1,519 1,280
1961 560 629 511 -- 504 699 1,760 2,277 1,640 1,550 1,617 1,319
1962 750 526 600 -- 291 -- -- 2,066 1,873 1,5i0 2,250 1,562
1963 850 794 -- 730 863 -- 2,419 2,555 2,100 2,450 2,309
1964 925 1,040 790 -- 1,050 1,047 -- 2,987 2,342 2,100 3,283 -
1965 925 903 -- 612 -- 3,200 3,477 2,764 2,100 3,283 -
1966 1,020 1,104 901 -- 983 -- 3,200 3,662 2,630 2,900 3,682 2,052
1967 1,250 1,203 -- 876 -- 3,200 3,393 -- 3,500 3,934 -
1968 1,020 1,294 942 -- 822 -- 6,800 5,230 4,697 3,700 3,817 3,670
1969 1,300 1,319 994 .- 1,260 -- 4,500 4,995 4,596 3,700 4,371 -
1970 1,350 1,490 1,000 -- 1,040 -- 4,500 4,774 -- 3,700 4,799 --
Notes: (2)The following grade classifications were meant to apply to the support prices: Type I, Category A for paddy rice, high grades for wheat (hard wheat) and barley, average grades for soybeans, yellow and white high grade corn, and Type II, Category A (Calima, Nima varieties) for beans. Market and Wor!a prices were impossible to control on a consistent quality or grade basis and much of the apparent unreliability of the data could be related to this problem.
- 13

- 14
when the same data is reported for different geographic locations. An attempt
has been made to secure comparability of the price series by excluoing data which
could conceivably introduce significant quality variations. Gaps in any year for
support prices, CIF import prices or for market prices received by producers re
flect either the absence of any information or a vote of nonconfidence in it.
The reliability of the CIF values is most worrisome since that series de
rives from a number of diverse sources, quality was difficult to standardize and
the crop definitions and classifications used by any single source often underwent
bewildering revisions.
An important issue is the appropriate basis for the comparison of domestic with
international prices. Since announced support prices were intended to act only
as a floor or minimum return and market prices are a reflection of the import pol
icy of the price support agency, it is clear that current markec prices would no
longer be received by producers if international prices ruled. From the point of
view of a buyer of the crop (a miller or wholesaler) his options consist of pur
chasing the crop at its landed CIF price or relying on the sales of domestic farm
ers. If the average distance beLween the port of entry and the buyer Is roughly
the same as that between the domestic farmer and buyer, the relevant price compar
ison is CIF vis-a-vis ex-farm or market prices. There is no need to adjust either
the CIF or the market prices for transport margins in determining the alternative
prices that would be received by producers with the price support program and with
out it. 1
Another matter that requires some consideration is the choice of using either
'Where the assumption of offsetting transport costs is obviously incorrect the market price should be compared to the CIF price plus transport costs to the point of use less transport costs from a Colombian farm to the same destination.

- 15
the actual exchange rate or an estimated shadow rate to make value conversions.
In most Latin American countries the adoption of import substituting industrial
ization strategies of economic development has led to the erection of high bar
riers to trade in industrial goods. The result of these policies is a decline
in the nominal exchange rate with respect to domestic price levels and the creation
of an artificial inducement to import food products which discourages domestic agri
cultural production. Colombia is no exception to this pattern. This initial
trade situation suggests two iiportant reasons for adjusting the nominal exchange
rate in order to make appropriate price comparisons for a situation with price sup
ports and one without supports. In the first place, it is clear that elimination of
price supports would elicit large scale imports of products in which there is cur
rently a close balance between domestic demand and supply (rice, corn, beans, soy
beans, and barley) and also those presently being imported (mainly wheat). Larger
imports of food products would eventually generate pressure for depreciation of the
Colombian peso. In the absence of a fully specified model of the economy it is
highly desirable to account for as many relative price changes as possible in com
paring actual and hypothetical income distributions. Otherwise, the situation ex
pected to occur under the hypothesis may not be realized and the comparison would
not be meaningful. Secondly, there is some interest in determining the income dis
tribution implications of moving to a more efficient allocation of resources. A
particular resource allocation can be deemed efficient if the domestic'resource
cost of earning or saving a unit of foreign exchange is the same for every activity.
In Colombia this criterion implies that price supports should avoid surpluses that
can be sold only at a subsidy larger than the 15 per cent CAT subvention a-,ailable
to minor exports and also should avoid import replacement if the required degree

- 16
of protection exceeds the 30-35 per cent average tariff on industrial goods.1
Since abandoning a system of price supports would result in larger purchases of
imports rather than the loss of export sales, the domestic resource cost of saving
a unit of foreign exchange would be equal, on average, in all parts of the economy
if the nominal CIF price of crops was increased by about one-third. Assuming that
the policy of tariff protection is a permanent feature of the economy the appro
priate shadow rate of exchange is also about one-third higher than the level of the 2
nominal exchange rate. In the calculation of the income redistribution arising
from the price support program market prices were compared with nominal CIF prices
that were augmented by 30 per cent. Because this relative price relationship fluc
tuated from one year to the next, the most typical differential nearest to the year
1968 was chosen for the income redistribution calculation. The year 1968 was
singled out for special attention since the price data on the sources and uses of
income refer to that year.
Table 2, which presents the data on the sources and uses of income by crop and
income class, relies on data that was extracted from a recently constructed input3
output table for Colombia. This data in turn is drawn primarily from the 1970
1This degree of protection 1- mentioned in the Colombian Ministry of Agri
culture document OPSA-016, December 1969 entitled, "Financing Considerations for the Agricultural Exports of IDEMA." It agrees with other estimates. Note that this average tariff conceals a great deal of dispersion in the tariff rates for different industrial goods and that the average tax on imports is still substantially larger than the average subsidy on exports so that it costs more resources to save a dollar of foreign exchange than to earn a dollar.
2This consumer surplus or second-best measurement of shadow exchange rates
is discussed in more detail by A. C. Harberger, "Survey of Literature on Cost-Benefit Analysis for Industrial Project Evaluation," United Nations Inter-Regional Symposium on Industrial Project Evaluation, Prague, 1965, and by D. Schydlowsky, "On the Choice of a Shadow Price for Foreign Exchange," Harvard University Economic Development Report No. 108, Development Advisory Service, Cambridge, Mass., 1968.
3Input/Output Matrices Condensed for Analysis of Prirary Agricultural Sectors--116 Principal Product Sectors at Producer Prices, S. Daines, J. Ricardo, C.

TABLE 2: Sources and Uses of Income by Crop and Income Class
(Thousands of 1968 Colombian pesos)
Uses Sources
Income Class: I II III IV V I II III IV V
crop
Potatoes 272,891 243,788 112,268 33,207 86,223 255,575 173,952 107,371 69,931 141,348
Beans 78,373 69,949 28,202 8,008 20,908 65,614 47,267 31,727 20,441 40,391
Corn 387,103 346,787 174,236 60,813 196,450 335,472 275,423 197,762 122,691 214,041
Rice 502,688 453,624 211,281 77,323 144,042 363,833 299,384 242,466 156,240 327,035
Wheat 452,060 405,510 185,148 71,347 127,517 37,282 30,227 24,146 15,726 33,482
Barley 37,193 33,589 19,285 6,575 25,954 28,341 22,872 18,449 11,560 41,374
Sesame 44,517 39,933 14,293 4,906 8,236 36,758 25,633 16,374 10,592 22,528
Soybeans 88,549 79,431 28,430 9,760 16,399 58,930 48,445 37,588 24,424 53,182
Notes: (1) This table is based on data contained in Input/Output Matrices Condensed for Analysis of Primary Agricultural Sectors--116 Principal Product Sectors at Producer Prices, S. Daines, J. Ricardo, C. Gleason, G. Poynor, Statistical Working Document #2, Agency for International Development, March 1972.
(2) Intervals for the five income groups in pesos per month are defined in the following manner: Group I - less than 500 pesos, Group II - 501 to 1,000 pesos, Group III - 1,001 to 1,500 pesos, Group IV - 1,501 to 3,000 pesos, and Group V - more than 3,001 pesos.
(3) Total uses give a sum which closely approximates gross output value and total sources have been adjusted to agree with total uses for purposes of analysis. The gross output figures contained in the input-output table are in close agreement with independent estimates made by J. Atkinson, Changes in Agricultural Production and Technology in Colombia, Washington, D.C., U.S. Department of Agriculture, Economic Research Service, Foreign Agricultural Economic Report No. 52, June 1962.
- 17

- 18
survey of urban households which disaggregated all families into five income classes.
Having only five income size categories is somewhat confining for economic analysis
since the income variation within each broad income class is neglected and there
fore the total variance of income earned is understated. However, there is pres
ently no substitute for the information containeA in the input-output table which
is so far unique in linking uses and sources of income by income size and type of
production activity. Another shortcoming of this data is that the aggregate dis
tribution of income suggests more equality than is in fact likely to exist. In
the input-output table the two bottom income groups, which together comprise 72
per cent of total income earners, receive about 46 per cent of total income while
the DANE (National Statistics Agency) data on which the table is based, indicated
that the income share of these two groups was only 32 per cent. Nonetheless, after
certain adjustments are made to the raw data in the table the Fattern of sources
and uses by income class is highly plausible. For all of the crops considered an
extra dollar added to the price of the crop would result in greater increases in
expenditures than in earnings for the low income groups and larger increments to
earnings than to expenuitures for the higher income groups.
The adjustments to the raw data in the input-output table used in deriving
Table 2 were twofold. The uses data in Table 2 represent the sum of direct and in
direct uses in the input-output table. Potatoes, beans and soybeans were the only
crops with no indirect uses. Wheat and rice were used indirectly in milling.
Sesame was used entirely in oils and in other foods. Corn and barley were used
as inputs in the livestock activities of eggs, milk, pork, cattle and cattle rais
ing. Because the consumer purchases gross output while the producer on the sources
Gleason and G. Poynor, Statistical Working Document #2, Agency for International Development, March 1972.
- 19
side receives that amount less intermediate input purchases, total uses of any
crop always exceeded the amount of total sources. In Table 2 the sources have
been adjusted proportionately so that total sources equal total uses. This ad
justment is in keeping with the earlier assumption of a zero supply elasticity
when all crop prices are changed and presumes that purchases of intermediate
goods would remain unchanged as the consumer pays an extra dollar more or less
for crops whenever price supports are introduced or abandoned. A similar type
of reasoning is employed in the effective protection literature where the influ
ence of tariff changes on an activity's value-added is examined. In the case at
hand the adjusted sources permit measurement of income changes accruing to the
on-farm resources of land and labor in response to changes in price supports.
For potatoes, beans, corn, rice and barley, the foregoing procedures were
felt to lead to reasonable adjustments in the data since the sum of direct and 1
indirect uses closely approximated the value of gross output in each crop.
However, this was less true for sesame and soybeans whose relatively large as
signment to the inventories category could not be directly traced to any income
class. In the case of these two crops, both the uses (in oils and other foods)
and sources of income were adjusted proportionately to match the level of gross
output. The remaining difficulty concerns the disposition of wheat. Wheat poses
special problems for the analysis of price supports because, unlike the other 2
crops, it is a significant import commodity. By the end of 1971 domestic wheat
production was only two-thirds its level in 1962 and accounted for only about 15
per cent of domestic consumption. It was explained earlier how IDEMA finances
ITotal uses did not exactly equal gross output value due to the omission of some small indirect uses of the crop.
2Small and sporadic imports of corn, rice and barley have occurred but there has been no consistent tendency to import any of these crops. Recently, barley has been a more frequent entry on the side of imports but the amounts involved have been a negl4.gible fraction of domestic output.

- 20
its operations through its ability to import wheat at world prices, or even lower
prices in the case of United States P.L. 480 wheat, and sell these products at
higher domestic prices. In effect the budgetary funds for IDEMA are raised from
a regressive sales tax on food consumption. If this peculiar tax were removed a
substitute source of finance would have to be found, presumably from the regular
tax system. In Table 2 the uses of wheat far exceed the sources of income from
wheat to reflect the importance of initial wheat imports. If wheat prices fell
to adjusted international values consumers in all income classes would experience
real income gains due to the repeal of this regressive consumption tax. However,
since the budget of IDEMA would be met by increases in other forms of taxation the
gain in real income through lower prices would be offset by lower disposable in
comes. This offset is not taken into account in subsequent calculations because
there is no reliable way of telling which taxes would be compensatorily raised.
Nonetheless, it is unlikely the government would replace one regressive sales tax
with another so the price-cum-tax change would be expected to result in a redis
tribution of income from rich to poor. As it will be seen, this redistributive
effect would be similar to those realized for the other crop price changes.
In Table 3 is presented alternative estimates of consumption patterns by crop
and by income position. Each estimate, including the one which utilizes the same
data found in Table 2 on sources and uses of income, suggests the expected pattern
in which the fraction of income spent on each crop declines monotonically as in
come increases. For the combined expenditure on all crops the data derived from
AID sources indicate that the ratio of expenditure to income is 4.17 times greater
in the highest income bracket than in the lowest income bracket. If it is recog
nized that the definitions of highest and lowest income bracket differ, the

TABLE 3: Alternative Estimates of Consumption Ratios by
Crop and Income Class (per cent)
Income Class: a) I II III IV V
b) I' II' III' IV' crop
Potatoes 1.27 1.17 .91 .55 .28
4.0 2.27 1.11 .46
Beans .37 .33 .23 .13 .07
2.74 1.73 .98 .37
Corn 1.81 1.66 1.41 1.01 .64
1.34 .77 .42 .07
Rice 2;35 2.17 1.71 1.29 .47
9.2 6.84 4.08 1.3
Wheat 2.11 1.94 1.49 1.19 .42 (bread) 3.9 2.4 2.38 .98
Sesame 2.91 2.67 1.62 1.14 .38
Soybeans .41 .38 .23 .16 .05 (oil) .74 1.55 1.50 .83
Total Crops 11 10 7.5 4.4 2.64
19.4 14 9.38 3.5
Notes: (1) The columns representing the income classes I through V use the data described in Table 2. Columns I' through IV' represent data contained in the
Final Report of the Rural-Urban Intermarket Project (PIMUR) based on a consumer survey in 1968 of people in Cali and the department of Valle and published by Michigan State University in 1970. The income intervals in this study differ significantly from those in the first study making the comparison of consumption ratios across the studies impossible. Differences in crop definition also add an element of noncomparability.
(2) Only one other attemDt to measure food consumption patterns by income class has been made. This is the CEDE study by R. Prieto entitled Estructura del Gasto y Distribucion del Ingreso Familiar en Cuatro Ciudades Colombianas 1967-1968, Parte Tercero, University of Los Andes, Bogota, May 1971. Unfortunately this study treats crops at only an aggregate level and cannot be decomposed for the study of particular crops. However, for the aggregate entity cereals and derivatives the pat
tern of expenditures is similar to that in Table 3 for total crops as the lowest income group spend 15.3 per cent of its income on cereals and derivatives compared to 4.7 per cent for the richest income group.
(3) Each entry refers to the per cent of total income spent on a particular crop for any income group.
- 21

- 22
comparable ratio for the PIMUR data is 5.5 while that for the CEDE data is about
3.3. The overall consistency of the AID data with other sources of information
means that some degree of confidence in the distributions of Table 2 would not be
entirely misplaced.
Table 4 summarizes the income distribution calculations using the data in the
preceding tables. Price relationships prevailing in 1969 were used for rice,
barley, corn and beans while the price changes for wheat and soybeans refer to the
years 1968 and 1970 respectively. No satisfactory price data were felt to exist
for potatoes and sesame so these crops are excluded in Table 4. A glance at Table
1 confirms that had other years been chosen instead--assuming that data on sources
and uses were available for these years--the estimates of income redistribution
would have displayed considerable variation. Despite the annual variability il
relative prices the calculations shown in Table 1 are probably of the right order
of magnitude. Four types of price comparisons were admitted in Table 1. The
first estimate compares market prices with unadjusted CIF values while the second
estimate allows for 30 per cent overvaluation of the exchange rate. The final two
estimates compare support price levels with adjusted and unadjusted CIF values.
With these two calculations the hypothetical situation is explored in which IDEMA
is able to guarantee its floor price to all producers. It is assumed that if IDEMA
had possessed more storage capacity in those years it would have been successful in
preventing market prices from falling beneath the level at which prices were to be
supported.
Because low income groups invariably spend more on a crop than they earn in
producing it,and the opposite is true for higher income groups,abandoning the price
support program would, with few exceptions, result in clear-cut equity gains. Only

TABLE 4: ?rices Supports wid Tncome Iedistribution (Thousaads of 1968 pesos)
rrice Chasuo and Associated Tncome Change
Crop and
Incom Class
Rice %P: 22.3X 27.5% 5.75
1 $ 30.965 $38,185 $ 7,984
11 34.390 -0 42.416 8,869
I11 -6,950 -- -8,570 -1.792
IV -17,598 -21,702 -4,538
V -40,807 "" -50,323 -10,522
0heat AP: 43.7 26j.9 47.6% 31.9_
I $181,258 $111,575 $197,434 $132,314
I1 163,999 100.951 178,635 119,715
III 70,358 43.310 76,637 51,360
IV 24,306 14,962 26,476 17,743
V 41.093 25,294 44,760 29,997
Barley &P: 21.25% 0%377. 22.17,
I $ 1,881 -- $ 3,275 $ 1,956
II 2,277 o- 3,965 2,368
1II 178 -- 309 185
IV -1,059 -- -1,844 -1,102
V -3,277 -- -5,705 -3,407
Soybeans AP: 16.71 4-...
1 9 4,946 $ 1,184
II 5,175 1,239
I11 -1,529 .366
IV -2.449 -587
V -6,142 .1,471
Corn AP: 25% 2.4% 23.8% 1%
1 $ 7,908 $ 759 $ 7,528 $ 316
II 17,841 1,713 16,985 714
11I -5,882 -565 -5,599 -235
IV -15,470 -1,485 -14,727 -619
V -4,398 .422 -4,187 -176
Bean. AV: 11.31 -14.3% 44...7/ 11.3%
x 5 8,768 $-11,095 $ 34.737 $ 8,768
II 16,159 -20,449 64,021 16,159
111 -2,352 2,976 -9,317 -2,352
IV -6,425 8,131 -25,456 -6,425
V -16,150 20,437 -63,985 -16,150
Notes: (1)For each crop the percentage price change reflects the following price comparisons: Market prices with unadjusted world prices in the first column; market prices with adjusted world prices in the second column; support prices with unadjusted world prices in column three and, finally, support prices with adjusted world prices in the last column.
(2)The third and fourth columns for soybeans are missing because support prices were substantially below market prices in that year and itwas felt that this outcome was an accident rather than A design of policy.
(3)Percentage price changes rely on data inTable I. The product of the percentage price change and the difference between sources and uses for each income class in Table 2 live the income changes for each crop.
. 23

in the case in which market prices for rice and barley coincide with adjusted
international values would no change occur if price supports were dismantled.
Beans provided the only instance in which income transfers would move the other
way because adjusted international values for this crop exceeded actual market
prices. Generally speaking, the main feature of the current price support program
is a transfer of real income from groups with below average incomes to groups
which enjoy incomes above the mean. Taking account of the position of both pro
ducers and consumers at each level of income, most of the burden of price sup
ports is borne by low income consumers while most of the benefits flow to high
income producers.
If the monetary gains of the two bottom income groups I and II are summed
for the various price alternatives it can be seen that a total gain of 476,113
thousand pesos would be sustained if market prices fell to current world prices,
185,877 thousand pesos if market prices fell to adjusted world prices, 577,683
thousand pesos if ruling support prices were reduced to existing world price
levels and 310,726 thousand pesos if ruling support prices were brought into line
with adjusted world prices. The last estimate is probably most representative
of the magnitude of income redistribution towards the rich under the current price
support program since, except for corn and soybeans, it assumes that levels of
price supports were actually realized in the market.
An important policy question is the relative size of these income transfers.
While it is impossible to objectively determine at what point a transfer becomes
significant for policy purposes, Table 4 offers some notion of the relative mag1The last two estimates use market rather than support prices for corn
and soybeans because the fact that the former price was substantially below the latter most likely represents an unintentional aspect of price policy which would be corrected in other years.

- 25
nitude of the income transfers. For rice about 21 to 22 per cent of the change
in the amount of expenditure that would occur with no price support would be
transferred to low income groups from cne higher income classes. Corresponding
percentages are roughly 10% :for corn and for beans (with a single exception) and
about 16 to 17 per cent for barley. In the case where the market price of beans
would rise by about 14 per cent in the absence of price supports, about 10 per
cent of the extra expenditure on this crop would represent a transfer from low
to high incone groups. There is no reason to believe that income redistribution
on the scale just mentioned is an inconsequential concern for economic policy.
Before turning to an examination of the efficiency aspects of price sup
ports some discussion of the functional income distribution changes associated
with supports would seem desirable. This topic has been explored elsewhere by
Floyd and others and the conclusions reached in their analysis are directly ap
plicable to Colombia. Because the demand for agricultural products is inelastic
the imposition of above-equilibrium prices through price supports will raise total
expenditure on the supported commodities. The distribution of this extra expend
iture between land and nonland factors will depend on the configuration of supply
elasticities for these factors and the size of the elasticity of factor substi
tution. Those factors least elastic in supply will experience the largest price
increase provided it is not easy to technically substitute other factors for this
IThe seminal article is by John E. Floyd, "The Effects of Farm rrice Supports on the Returns to Land and Labor in Agriculture," Journal of Political Econom, April 1965, pp. 148-158. Floyd relied on a two-factor neoclassical framework to investigate how factor returns and employment respond to various price support schemes. His work has been extended by Finis Welch to consider technological change. See Finis Welch, "Some Aspects of Structural Change and the Distributional Effects of Technical Change and Farm Programs," in Benefits and Burdens of Rural Development, Iowa State University Press, Ames, Iowa, 1970, chapter 9.

- 26
these. Since in the long run (and perhaps in the short run as well) the supply of
labor and capital is apt to be perfectly elastic to agriculture and the substi
tution elasticity between land and other factors is likely less than one, the impact
of higher product prices will probably raise the return and the income share of in
elastically supplied land. Aggregate data for Colombia tends to confirm this
descr.'ption of the economy. Over the period 1950-1968 average per capita incomes
in agriculture were rising at an annual rate of about two per cent while the real 1
wage stayed virtually constant. Data stretching over a slightly longer interval
also indicate that the income shares of land and capital have risen at the expense
of labor. A higher land share in income would be a predictable outcome of price
supports in Colombia. Because the ownership of land is much more highly con
centrated than the ownership of nonland factors, the higher land share would be*
translated into a larger dispersion of nominal incomes. Another way of illustrat
ing this result is to note that the least labor intensive farms would gain the
most from a program of price supports. Farms with low labor intensity tend to be
larger farms so these farms with higher initial incomes would tend to be the prim
ary benefic-iries of price supports. This brief excursion into functional income
analysis reinforces the previous results for the size distribution of incomes.
The conclusion is inescapable that the operation of price supports contributes to
income inequality in Colombia.
4. Price Supports and Economic Efficiency
The efficiency problem of price supports has received far greater attention
1These income trends and other evidence pointing to an elastic supply of rural labor are discussed in R. Albert Berry, "Land Distribution, Income Distribution and the Productive Efficiency of Colombian Agriculture," Yale University, Economic Growth Center, Discussion Paper No. 108, March 20, 1971.

- 27
in Colombia than the question of income distribution. Henning was among the first
to propose that for efficiency reasons support prices should be pegged to inter
1 national prices adjusted for a shadow rate of foreign exchange. He correctly em
phasized that the alternative of tying price supports to average production costs
fails to encourage efficient production practices for any crop and also fails to
stimulate the mix of crop commodities in which Colombia enjoys a comparative ad
vantage in world markets. Gutierrez undertook the measurement of the social costs 2
of price supports in rice production. Using a cobweb model of production in
which the rice market does not clear either with or without government inter
vention, he estimates the value of the lost consumer and producer surplus that
results from IDEMA price supports. For different years this cost fluctuates be
tween .06 per cent and 16.5 per cent of the value of rice output. Dudley made a 3
careful examination of price support policy in the case of wheat. Invoking the
principle that to minimize the total cost of obtaining wheat the marginal social
costs of domestic production and importation must be the same, Dudley adjusts CIF
prices of wheat for distribution costs, a 30 per cent overvaluation of the peso,
and a 25 per cent deduction from private domestic production costs to allow for
zero opportunity costs of unskilled labor and land used in wheat growing. The
determination of the optimum support price is most easily seen in the diagram
below. PMC and SMC refer to private and social marginal costs, respectively, of
IRobin G. Henning, "A Suggested Agricultural Price Policy for Colombia," IDEMA, Bogota, October 1971.
2Nestor Gutierrez Aleman, Costos Sociales de los Precios de Sustenacion en Arroz, Instituto Colombiano Agropecuario (ICA), Bogota, August 1972.
3Leonard Dudley, "An Analysis of Alternative Policies for the Wheat Market in Colombia," National Planning Department of Colombia (Planeacion), Bogota, July 25, 1972.
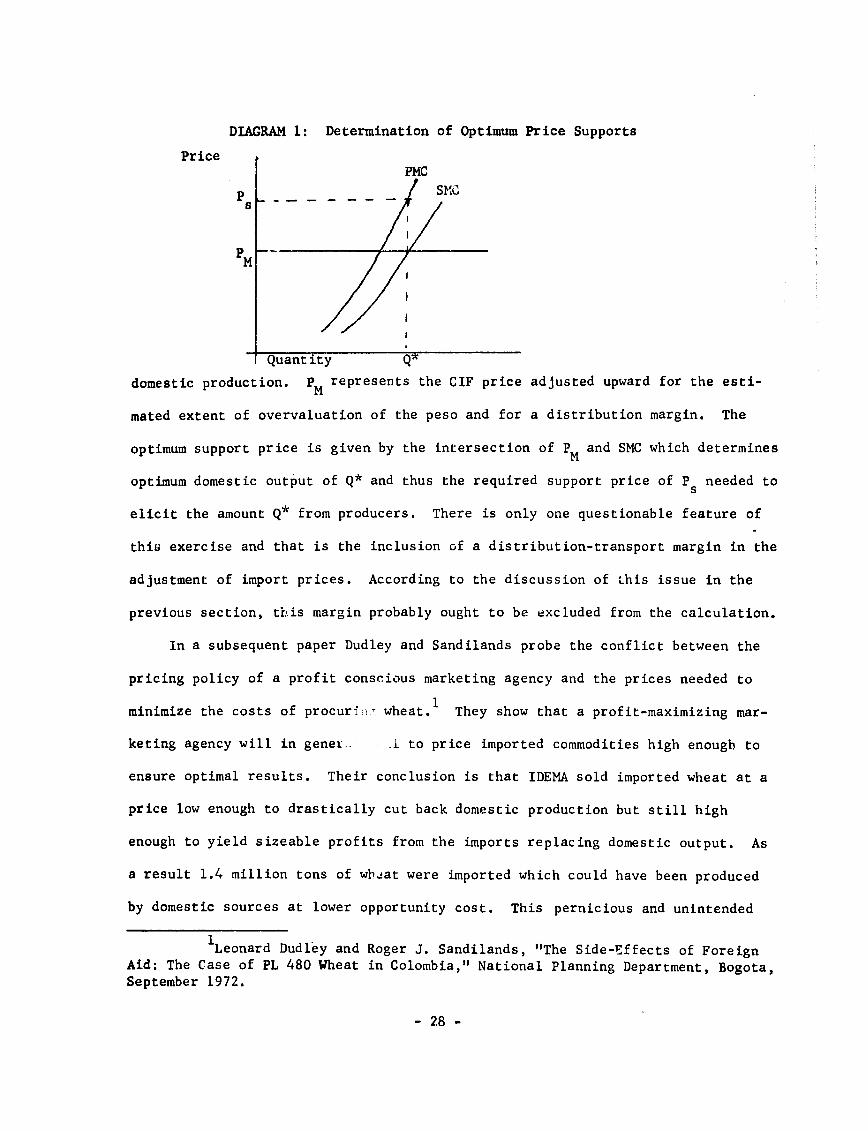
DIAGRAM 1: Determination of Optimum Price Supports
Price
Ps PMC
S11
M
Quantity Q
domestic production. pM represents the CIF price adjusted upward for the esti
mated extent of overvaluation of the peso and for a distribution margin. The
optimum support price is given by the intersection of PM and SMC which determines
optimum domestic output of Q* and thus the required support price of Ps needed to
elicit the amount Q* from producers. There is only one questionable feature of
this exercise and that is the inclusion of a distribution-transport margin in the
adjustment of import prices. According to the discussion of this issue in the
previous section, this margin probably ought to be excluded from the calculation.
In a subsequent paper Dudley and Sandilands probe the conflict between the
pricing policy of a profit conscious marketing agency and the prices needed to
1 minimize the costs of procurlnr wheat. They show that a profit-maximizing mar
keting agency will in genet i to price imported commodities high enough to
ensure optimal results. Their conclusion is that IDEMA sold imported wheat at a
price low enough to drastically cut back domestic production but still high
enough to yield sizeable profits from the imports replacing domestic output. As
a result 1.4 million tons of wbat were imported which could have been produced
by domestic sources at lower opportunity cost. This pernicious and unintended
1Leonard Dudley and Roger J. Sandilands, "The Side-Effects of Foreign
Aid: The Case of PL 480 Wheat in Colombia," National Planning Department, Bogota, September 1972.
- 28

- 29
byproduct of PL 480 imports made the value of this component of foreign economic
aid barely positive.
In the remainder of this section, an attempt is made to assess the efficiency
implications of price supports using a slightly different approach suggested by
1 Johnson and Krueger. Their framework hinges on the concept of the domestic re
source cost (DRC) of saving a unit of foreign exchange through import substitution
versus the DRC of earning a unit of exchange via more exports. An economy has
achieved an efficient allocation of resources when the cost is the same for each
alternative method of obtaining a unit of foreign exchange. Wilh a shadow rate
of foreign exchange this condition implies that no foreign exchange generating
activity would have a DRC ratio in excess of unity. Inefficiency then is defined
by the extent of the dispersion in DRC's for different activities contributing to
the supply of foreign exchange.
If the following conventional, but somewhat restrictive, set of assumptions
is made the efficiency loss attributable to price supports can be measured ac
cording to the formula P = ' ( Pd )i Vi where Pd is the price (cost) of do
mestic crop output, Pf is the import price adjusted by the extent of overvaluation
(30 per cent) and V. is the value of donestic crop output at domestic prices. For
this measure to have some validity it is necessary to assume that private factor
costs adequately reflect opportunity costs, international terms of trade are fixed,
costs of production are independent of output levels, each crop employs the same
amount of direct and indirect imported inputs, and that home production would be
IH. Johnson, "The CGst of Protection and the Scientific Tariff," Journal of Political Economy, August 1960, pp. 327-45; A. Krueger, "Some Economic Costs of Exchange Control: The Turkish Case," Journal of Political Economy, October 1966, pp. 466-80. DRC is defined as the ratio of value-added per unit of output at domestic opportunity costs plus the accounting value of nontraded inputs to the difference between foreign exchange earned (or saved) and the amount of foreign exchange used.

- 30
entirely replaced by imports if Pd exceeded P If these assumptions are met
the formula for P corresponds to Johnson's concept of production cost in which
the Rize of P measures the value of domestic resources at domestic prices which
could be extracted from the economy through resource reallocation and trade with
out affecting final consumption of all goods and services. This measure of ex
tractable surplus would be zero if every domestic crop price equalled the ad
justed import price. As a measure of welfare loss it understates the true cost
of price supports Since it ignores costs resulting from substitution in consump
tion. However, this omission may be counterbalanced by the presence of rent
elements in domestic costs and, if this were the case, P would provide a measure
of the total and not just the production cost of price supports.
Using the data on uses of income in Table 2 and the percentage price differ
ences in Table 4 for the excess of domestic over adjusted world prices the pro
duction cost of Colombian price supports is estimated to be 74,812 thousand pesos
or about 4.85% of the total value of output for wheat, soybeans and corn. Only
these three crops had domestic prices in excess of adjusted world prices. The
domestic prices of rice and barley equalled adjusted world prices while the do
mestic price of beans fell short of the adjusted world price. It seems to be a
safe conclusion on the basis of this somewhat crude calculation that the efficienzy
cost of the price support program in Colombia is not high.
5. Conclusions
The main findings of this study are twofold. First, the operation of Col
ombia's price support program appears to have exacerbated the inequality of income
distribution in that country. The costs of the program have been borne by low

- 31
income earners as a group while most of the benefits have been obtained by higher
income groups. Second, the structure of relative prices generated by the price
support program imposes an efficiency cost on the economy that results from an
inappropriate allocation of the economy's resources. However, both the size of
the income redistribution effect and the size of the efficiency cost are likely
to be small in relative terms.
In weighing the desirability of the present price support program it should
be recognized that some indirect effects of the program have been neglected.
These effects would need some consideration for a complete evaluation of the pro
gram. In the likely event that the benefits of price supports are capitalized
into land values,higher land values, by adding to the wealth of large landowners,
may make it easier for this group to gain access to rationed credit while at the
same time savings incentives for this group are diminished. Higher land prices
also reduce the purchasing power of the budget for the land reform agency INCORA
and make it more difficult for that organization to redistribute land to smaller
farmers. Moreover, the windfall loss of wealth that would result from terminating
the program may hurt those who paid the capitalized land price and raise complaints
of capricious income redistribution. Another indirect effect is the redistribution
of income among agricultural producers arising from the position of cereal growcrs
as input suppliers to the livestock sector (cattle, pork, poultry and eggs). Be
cause of this input-output linkage there is little doubt that higher support prices
would harm livestock producers by raising input costs.
Alternative ways of measuring equity might give a somewhat different picture
of the distributive effects of price supports. For example, if producers who re
ceive price supports are located in only a few areas regional income disparity may

- 32
be increased. Moreover, dismantling the system of price supports should reduce
average farm income and, as this average is below that for the whole economy,
overall income distribution on the sources side could worsen as the distribution
of farm incomes improved. Nonetheless, on the fairly crude methods employed in
this study the disappearance of the price support program appears to offer the
chance of simultaneous improvement in both the level of total output and its dis
tribution.

PROGRAM OF DEVELOPMENT STUDIES Discussion Papers
No. 23 "Disguised Unemployment in a Subsistence Economy" (1972) ............... 0 0.......................................... Jose Hamilton Gondim Silva
No. 24 "A Proposal for Research on 'Distribution of Gains, Wealth and Income from Economic and Political Development'" (1972) .......... James W. Land
No. 25 "Optimal Wage and Education Policies with International Migration" (1972) .................o.......... R. Albert Berry and Ronald Soligo
No. 26 "Marketing and Economic Development: A Brazilian Case Study, 1930-70" (1972) ..................... ........... ................ Gordon W. Smith
No. 27 "Indigenisaticn of Industry and Progress of the Second Nigerian National Development Plan" (1972)..................Gaston V. Rimlinger
No. 28 "The Distribution of Incomes and the Short-Run Burden of Taxes in Turkey, 1968" (1972)............. Marian Krzyzaniak and SUleyman Ozmucur
No. 29 "The Proper Use of Indirect Taxation in Latin America: The Practice of Economic Marksmanship" (1972)...................Charles E. McLure, Jr.
No. 30 "Distributional Equity, Inflation, and Efficiency in the Brazilian Fluctuating Exchange Rate System" (1972) ............. Donald L. Huddle
No. 31 "A Diagrammatic Exposition of General Equilibrium Tax and Expenditure Incidence Analysis with One Immobile Factor"(1972) Charles E. McLure Jr.
No. 32 "Social and Economic Conditions and Political Violence" (1972)........ ............. ...... .... Fred R. vonder Mehaen with Kim Q. Hill
No. 33 "Income Distribution, Efficiency and the Experience of Colombian Farm
Mechanization" (1972) ........................ Wayne R. Thirsk
No. 34 "Ease of Factor Substitution in Agriculture" (1972) .... Wayne R. Thirsk
No. 35 "The Contribution of Traditional and Small Scale Culture Goods in International Trade and in Employment" (1972)Yhi-Min Ho and Donald Huddle
No. 36 "The Distribution of Income and Tax Incidence in Panama, 1969" (1972) ............................ .. . ............. Charles E. McLure, Jr.
No. 37 "General Equilibrium Incidence Analysis: The Harberger Model after Ten Years" (1972) ............................. Charles E. McLure, Jr.
No. 38 "On the General Equilibrium Analysis of Tax Incidence" (1973)......... ...............................J. Gregory Ballentine and Ibrahim Eris
No. 39 "The Impact of Demand on Labor Absorption and the Distribution of Earnings: The Case of Brazil" (1973)Samuel A. Morley & Jeffrey G. Williamson
No. 40 "A Note on Z Goods, Marketed Surplus and the Labor Intensity of Small Farm Agriculture" (1973) ............................ Wayne R. Thirsk
No. 41 "The Incidence of Colombian Taxes, 1970" (1973)..Charles E. McLure, Jr.
No. 42 "What to Do Aboit Foreign Direct Investment: A Host Country Per
spective" (1973) ...... ........................ . Samuel A. Morley
No. 43 "Income Distribution Consequences of Agricultural Price Supports in Colombia" (1973)....... ....... ....... ... ... Wayne R. Thirsk
Note: Discussion Papers are available upon request to individual scholars and researchers and libraries of educational institutions.