program and abstract volume - lunar and planetary institute · virgilio correcher (co-chair),...
TRANSCRIPT
Program and Abstract Volume
LPI Contribution No. 1616
CONFERENCE ON MICRO-RAMAN AND
LUMINESCENCE STUDIES IN THE EARTH AND PLANETARY SCIENCES (CORALS II)
May 18–20, 2011 • Madrid, Spain
Sponsors
Spanish National Research Council Lunar and Planetary Institute
Scientific Organizing Committee Javier Garcia-Guinea (Chair),
Museo Nacional de Ciencias Naturales (MMCN) Virgilio Correcher (Co-Chair), CIEMAT Sergio Sanchez-Moral, MNCN, CSIC
Soledad Cuezva, MNCN, CSIC Angel Fernandez-Cortes, MNCN, CSIC
Elena Garcia Anton, MNCN, CSIC Laura Tormo, MNCN, CSIC Marta Furio, MNCN, CSIC
Alberto Jorge, MNCN, CSIC Sagrario Martinez-Ramirez, IEM, CSIC Santiago Sanchez Cortes, IEM, CSIC
Ana Cremades, Univ. Complutense Javier Ruiz, Univ. Complutense
Elena Crespo-Feo, Univ. Complutense Susana Jorge-Villar, Univ. Burgos
Miguel De la Guardia, Univ. Valencia
Lunar and Planetary Institute 3600 Bay Area Boulevard Houston TX 77058-1113
LPI Contribution No. 1616

Compiled in 2011 by
Meeting and Publication Services Lunar and Planetary Institute
USRA–Houston 3600 Bay Area Boulevard, Houston TX 77058-1113
The Lunar and Planetary Institute is operated by the Universities Space Research Association under a cooperative agreement with the Science Mission Directorate of the National Aeronautics and Space Administration. Any opinions, findings, and conclusions or recommendations expressed in this volume are those of the author(s) and do not necessarily reflect the views of the National Aeronautics and Space Administration. Material in this volume may be copied without restraint for library, abstract service, education, or personal research purposes; however, republication of any paper or portion thereof requires the written permission of the authors as well as the appropriate acknowledgment of this publication.
Abstracts in this volume may be cited as Author A. B. (2011) Title of abstract. In Conference on Micro-Raman and Luminescence Studies in the Earth and Planetary Sciences (CORALS II), p. XX. LPI Contribution No. 1616, Lunar and Planetary Institute, Houston.
ISSN No. 0161-5297

Preface This volume contains abstracts that have been accepted for presentation at the Conference on Micro-Raman and Luminescence Studies in the Earth and Planetary Sciences, May 18–20, 2011, Madrid, Spain. Administration and publications support for this meeting were provided by the staff of the Meeting and Publication Services Department at USRA’s Lunar and Planetary Institute.


Contents
Program.........................................................................................................................................................xi Cathodoluminescence and Raman Spectroscopic Characterization of Phosphates in Mexican Chondrites
L. A. Alba-Aldave, J. García-Guinea, M. Furio, and A. Jorge-García .............................................. 1
On the Reliable Structural Characterization of Polished Carbons in Meteorites by Raman Microspectroscopy
M. R. Ammar, J.-N. Rouzaud, E. Charon, J. Aleon, G. Guimbretière, and P. Simon ........................................................................................................ 2
CL-Spectral Characteristics of Quartz and Feldspars in Fresh and Hydrothermal Altered Volcanic Rocks (Cabo de Gata, Almeria, Spain)
A. Aparicio and M. A. Bustillo........................................................................................................... 3
The Consequences of the Presence of Urban Atmospheric Particles and Airbornes in CorTen® Steel Surfaces
J. Aramendia, L. Gómez-Nubla, K. Castro, I. Martínez-Arkarazo, G. Arana, and J. M. Madariaga ........................................................................................................ 4
New Findings by Raman Microespectroscopy of Inclusions Inside a Libyan Desert Glass J. Aramendia, L. Gómez-Nubla, S. Fdez-Ortiz de Vallejuelo, K. Castro, and J. M. Madariaga ....................................................................................................... 5
Spectroscopic Characterization of Ferruginous Cements in a Temperate Beachrock Formation Close to Nerbioi-Ibaizabal Estuary (Tunelboka Cove, Bay of Biscay)
N. Arrieta, A. Iturregi, I. Martinez-Arkarazo, X. Murelaga, J. I. Baceta, and J. M. Madariaga .................................................................................................... 6
Madrid L6 Chondrite (Fall 1896): ESEM-Cathodoluminescence Survey O. Azumendi, L. Tormo, J. Ruiz, and J. Garcia-Guinea .................................................................. 7
Raman Spectroscopy in Corals and Pearls L. Bergamonti, D. Bersani, and P. P. Lottici..................................................................................... 8
Raman Investigation on Pigeonite in Ureilite D. Bersani, L. Mantovani, M. Tribaudino, and P. P. Lottici .............................................................. 9
In Situ Planetary Mineralogy Using Simultaneous Time Resolved Fluorescence and Raman Spectroscopy
J. Blacksberg and G. R. Rossman................................................................................................. 10
Quantitative Raman Spectroscopy (QRS), a Potential Tool to Study the Formation Mechanism of Carbonates of Early Earth and Mars
L. J. Bonales, M. V. Muñoz-Iglesias, M. Sanchez-Román, D. Fernandez-Remolar, and O. Prieto-Ballesteros ........................................................................ 11
Shock-Induced Phase Transformations in Melt Pockets Within Martian Meteorite NWA 4468
S. Boonsue and J. Spray ............................................................................................................... 12
CORALS II Conference v

Raman Microscopy of Samples of Martian Analogue Material with Cyanobacteria U. Böttger, J.-P. de Vera, J. Fritz, I. Weber, and H.-W. Hübers .................................................... 13
Micro Raman Spectroscopic Investigations of the Nature and Provenance of Carbonaceous Material in Micro-Fossil Bearing Rocks: Redefining D and G Carbon Band Parameters for the Detection of Biosignatures
D. M. Bower, A. Steele, M. D. Fries, and L. Kater ......................................................................... 14
Trapped High Density Fluids and Melts in Superdeep Diamonds F. E. Brenker, S. Schmitz, L. Vincze, B. Vekemans, M. Krebs, W. de Nolf, K. Janssens, T. Stachel, and J. Harris........................................................................................... 15
Moganite in the Chalcedony Varieties of Continental Cherts (Miocene, Madrid Basin, Spain)
M. A. Bustillo, J. L. Pérez-Jiménez, A. M. Alonso-Zarza, and M. Furio ......................................... 16
Luminescence Behaviour and Raman Characterization of Rhodonite from Turkey N. Can, J. Garcia Guinea, M. Hatipoglu, R. Kibar, and A. Cetin ................................................... 17
Adenine Adsorbed on a Martian Meteorite as a Test Case for SERS Investigation of Extraterrestrial Life Traces
S. Caporali, V. Moggi-Cecchi, M. Muniz-Miranda, M. Pagliai, G. Pratesi, and V. Schettino........................................................................................................... 18
Luminescence Spectra of Plagioclase (Labradorite) from South Greenland A. Cetin, R. Kibar, and N. Can ....................................................................................................... 19
Thermal Effect on the Cathodo- and Thermoluminescence Emission of Natural Topaz (Al2SiO4(F,OH)2)
V. Correcher, J. Garcia-Guinea, C. Martin-Fernandez, and N. Can .............................................. 20
Preliminary Studies on the Spectra Luminescence of Brenkite Ca2F2CO3 E. Crespo-Feo, J. Garcia-Guinea, V. Correcher, and A. Nieto-Codina ......................................... 21
Effects of the Tectonic Stress on Luminescence of Cerussite PbCO3 E. Crespo-Feo, P. Hernandez-Ferreiros, J. Garcia-Guinea, and V. Correcher ............................. 22
Vaterite Stability in the Presence of Cr (VI) J. A. Cruz, N. Sánchez-Pastor, A. M. Gigler, and L. Fernández-Díaz ........................................... 23
Raman Micro-Spectroscopy Performed on Extraterrestrial Particles S. De Angelis, V. Della Corte, G. A. Baratta, R. Brunetto, P. Palumbo, A. Ciucci, and A. Rotundi ............................................................................................................... 24
Thermoluminescence Studies of Dergaon Meteorite P. Dutta and K. Duorah .................................................................................................................. 25
Raman Spectroscopic Characterisation of Green-Blue Stalactites in Lantz Cave (Navarra, North of Spain)
S. Fdez-Ortiz de Vallejuelo, K. Castro, I. Martínez-Arkarazo, and J. M. Madariaga ..................... 26
Content of Rare Earth Elements in a Speleothem Analyzed by ICP-MS and CL-Spectroscopy
A. Fernandez-Cortes, S. Cuezva, J. C. Cañaveras, J. Garcia-Guinea, and S. Sanchez-Moral.................................................................................................................... 27
LPI Contribution No. 1616vi

Old and Modern Pigments Identification from a 14th Century Sculpture by Micro-Raman M. L. Franquelo, A. Duran, D. Arquillo, and J. L. Perez-Rodriguez ............................................... 28
Francevillite [(Ba,Pb)(UO2)2(V2O8)5H2O] on the Hydroxyapatite Bond Fossils of Loranca (Cuenca, Spain): Spectrum Cathodoluminescence of Uranyl-Vanadates
M. Furió, L. Merino, L. Tormo, A. Jorge, and J. Garcia-Guinea..................................................... 29
Mineral Variations Study of Canelobre Cave Phosphate Stalactite by Raman and Luminescence Methods
E. García-Antón, S. Cuezva, A. Fernández-Cortes, J. Cuevas-González, M. C. Muñoz-Cervera, D. Benavente, S. Sanchez-Moral, and J. C. Cañaveras ........................... 30
Luminescent Detection of Active Stress in Melilite-Anorthite CAI Grains of Allende CV3 Chondrite (Mexico)
J. Garcia-Guinea, L. Tormo, O. Azumendi, and J. Ruiz ................................................................ 31
Natural Earth Pigments from Roman and Arabic Wall Paintings Revealed by Spectroscopic Techniques
I. Garofano, A. Duran, J. L. Perez-Rodriguez, and M. D. Robador ............................................... 32
Raman Spectroscopy and Microprobe Investigation of the Incorporation of Cr(VI) in CaCO3
A. M. Gigler, N. Sánchez-Pastor, J. A. Cruz, and L. Fernández-Díaz ........................................... 33
Raman Microscopy of Shocked and Unshocked Basalts from Lonar Crater, India T. D. Glotch and M. J. Ferrari ........................................................................................................ 34
Analysis of Health and Environmental Risk Assessment of an Abandoned Zn-Pb Mine Through the Weathering Processes of the Local Minerals
N. Goienaga, J. A. Carrero, I. Arrizabalaga, J. Bustamante, L. A. Fernández, and J. M. Madariaga........................................................................................... 35
Relations Between Leachated Compounds and Raman Spectrum of Black Slags from EAF in Order to Characterize Them
L. Gómez-Nubla, J. Aramendia, S. Fdez-Ortiz de Vallejuelo, K. Castro, and J. M. Madariaga ..................................................................................................... 36
Trace Element and REE Leaching During Diagenetic Albitization and Its Relationship to the Cathodoluminescence Colour of Feldspars: The Tera Group, Cameros Basin (NE Spain)
L. González-Acebrón, D. Barca, J. Arribas, and J. R. Mas............................................................ 37
A Combined Cathodoluminescence and Micro-Raman Study of Planar Deformation Features in Quartz
A. Gucsik, T. Okumura, M. Kayama, H. Nishido, and K. Ninagawa .............................................. 38
In Situ Micro-Raman Observation of Uranium Dioxide Weathering in Contact with Water and Under Ion Beam Irradiation
G. Guimbretière, A. Canizares, P. Simon, Y. A. Tobon-Correa, M. R. Ammar, C. Corbel, and M. F. Barthe ........................................................................................................... 39
The Suitable Carotene and Xanthophyll Identification in Lecanora Lichens: Resonance Raman Spectroscopic Study
I. Ibarrondo, N. Prieto-Taboada, I. Martínez-Arkarazo, and J. M. Madariaga ...................................................................................................................... 40
CORALS II Conference vii
Cystine-Apatite Renal Calculi: EPMA, Raman and ESEM-CL Study A. Iordanidis, J. Garcia-Guinea, and V. Correcher ........................................................................ 41
Molecular Characterization of a Temperate Beachrock Formation in the Nerbioi-Ibaizabal Estuary (Arrigunaga Beach, Bay of Biscay)
A. Iturregi, N. Arrieta, I. Martinez-Arkarazo, X. Murelaga, J. I. Baceta, A. Sarmiento, and J. M. Madariaga ............................................................................................... 42
Thermoluminescence and Shock Metamorphism of Ordinary Chondrites A. I. Ivliev, V. A. Alexeev, and N. S. Kuyunko................................................................................ 43
Spectra Cathodoluminescence and Crystal Lattice: Cerite Versus Whitlockite A. Jorge, J. Garcia-Guinea, L. Tormo, M. Furio, A. Fernandez-Cortes, S. Cuezva, and S. Sanchez-Moral................................................................................................. 44
New Raman Spectroscopic Data of Almahata Sitta Meteorite M. Kaliwoda, R. Hochleitner, V. H. Hoffmann, T. Mikouchi, A. M. Gigler, and W. W. Schmahl .................................................................................................. 45
Thermoluminescence as One of the Methods for Determination of the Crystal Lattice Structure of Quartz
L. L. Kashkarov, G. V. Kalinina, and S. N. Shilobreeva ................................................................. 46
Optical Absorption, Cathodo- and Radioluminescence in Diaspore M. I. Kati, M. Turemis, I. C. Keskin, B. Tastekin, M. Hatipoglu, R. Kibar, A. Cetin, and N. Can ...................................................................................................................... 47
In Situ Study of a Collection of 20 Meteorites Using Raman Spectroscopy Th. Katsaros and Th. Ganetsos ..................................................................................................... 48
Clarification of Shock-Induced Effect on Cathodoluminescence of Alkali Feldspar M. Kayama, H. Nishido, T. Sekine, T. Nakazato, A. Gucsik, and K. Ninagawa .......................................................................................................... 49
Characterization of Radiation Effects in Albite by Cathodoluminescence M. Kayama, H. Nishido, S. Toyoda, K. Komuro, and K. Ninagawa ............................................... 50
Thermoluminescence of the Blue and White Chalcedony from Turkey I. C. Keskin, M. I. Kati, M. Turemis, B. Tastekin, R. Kibar, A. Cetin, and N. Can ...................................................................................................................... 51
Structure and Luminescence Characteristics of Aquamarine from Turkey R. Kibar, M. I. Kati, A. Cetin, M. Turemis, I. C. Keskin, B. Tastekin, M. Hatipoglu, and N. Can............................................................................................................... 52
Compositional Analyses of F, Cl and OH by Raman Spectroscopy in Apatite from Mafic-Ultramafic Pipes of the Ivrea Verbano Zone (NW Italy)
P. Kollegger, F. Zaccarini, R. J. Bakker, G. Garuti, and O. A. R. Thalhammer ............................. 53
Manganese-Activated Cathodoluminescence of Selected Carbonate Minerals C. Lenz and J. Götze ..................................................................................................................... 54
LPI Contribution No. 1616viii

Evaluation of Portable Raman for the Characterization of Salt Efflorescences at Petra, Jordan
P. López-Arce, A. Zornoza-Indart, C. Vázquez-Calvo, M. Gomez-Heras, M. Álvarez de Buergo, and R. Fort ................................................................................................ 55
Laser Induced Artificial Fulgurites Formation: Preliminary Results S. Martinez-Ramirez, J. J. Camacho, and L. Diaz ......................................................................... 56
Raman Spectroscopic Study of Allende (CV3) and Saratov (L4) Chemical Residues and Its Implication to Phase Q
J. Matsuda, K. Morishita, M. Nara, and S. Amari........................................................................... 57
Optically Stimulated Luminescence Response of Modern Flash-Flood Deposits in Small Mountain Catchments
A. Medialdea, N. Porat, and G. Benito........................................................................................... 58
Characterization of the Differentiation Process by Clathration in Europa Satellite Using Raman Spectroscopy
M. V. Muñoz-Iglesias, L. J. Bonales, and O. Prieto-Ballesteros .................................................... 59
Events in the Life of the Oldest Zircon on the Moon: A Combined SIMS, CL, EBSD and Raman Study
R. T. Pidgeon, A. A. Nemchin, M. Grange, and N. Timms ............................................................ 60
Spectra Luminescence of Uranyl Groups Associated to Silica Phases in Hydrothermal and Sedimentary Opals from Madrid (Spain)
M. Pozo, J. Garcia-Guinea, M. Furio, A. Fernandez-Cortés, and V. Correcher ........................................................................................ 61
Analysis of the Residual in Grave Goods from the Vaccaea Era at the Necropolis of “Las Ruedas” in Pintia
A. C. Prieto, M. Avella, M. A. González, J. Jiménez, F. Romero, R. De Pablo, C. Górriz, and C. Sanz ................................................................................................................... 62
Raman Spectroscopy Analysis of a Playing Card from the XVII Century A. C. Prieto, M. Avella, O. Martínez, J. Jiménez, J. L. Alonso, I. Sánchez, R. Martín, and M. Barrera .............................................................................................................. 63
Detection of Carbonaceous Material in Fossil Marine Microbialites by Raman Spectroscopy (Láncara Formation, Lower Cambrian, Cantabrian Mountains, Spain)
A. C. Prieto, M. Avella, O. Martínez, E. Moreno-Eiris, S. Menéndez, M. Rodríguez-Martínez, and A. Perejón ........................................................................................ 64
Quantitative Determination of Gaseous Phases in Fluid Inclusions by Raman Microscopy A. C. Prieto, A. Guedes, A. Dória, F. Noronha, and J. Jiménez .................................................... 65
Cross-Section Analysis to Establish the Penetration Level of Atmospheric Pollution in Mortars
N. Prieto-Taboada, O. Gómez-Laserna, I. Ibarrondo, I. Martinez-Arkarazo, M. A. Olazabal, and J. M. Madariaga............................................................................................. 66
BSE, CL and Raman Spectroscopy Study of Phospates and Maskelenyte in the H6 Cangas de Onis Regolith Breccia
A. Rubio-Ordóñez, V. Cárdenes, L. Rodríguez-Terente, L. Tormo, and J. García-Guinea .................................................................................................... 67
CORALS II Conference ix

Uranyl Groups Coupled to Evansite Granite Vein Infills in the Porto Undergrounds (NW Portugal)
S. Sanchez-Moral, A. Fernandez-Cortes, S. Cuezva, J. C. Cañaveras, V. Correcher, A. Z. Miller, A. Dionisio, J. M. Marques, C. Saiz-JImenez, M. J. Afonso, H. I. Chamine, M. Furio, and J. Garcia-Guinea...................................................................................................... 68
Raman Study of Synthetic BaCO3–SrCO3 Solid Solutions N. Sánchez-Pastor, A. M. Gigler, and L. Fernández-Díaz............................................................. 69
Luminescence Dating of Mortars from Ancient Architectural Elements J. Sanjurjo-Sánchez and R. Blanco Rotea..................................................................................... 70
Luminescence Dating of Pseudokarst Speleothems: A First Approach J. Sanjurjo-Sánchez and J. R. Vidal Romaní................................................................................. 71
Raman Spectra on Fluid Inclusions in Glauberite from Miocene Saline Lakes of the Madrid Basin: Evidence for Microbial Activity
M. E. Sanz, L. González-Acebrón, J. P. Rodríguez-Aranda, and C. P. Marshall .......................... 72
Iron Oxids on Ag(111) — Reversible Switching Between Hematite and Magnetite C. F. Schlueter, A. M. Gigler, and W. Moritz.................................................................................. 73
Raman and Luminescence Spectroscopy of Meteoritic Nanodiamonds A. A. Shiryaev, A. V. Fisenko, I. I. Vlasov, and L. F. Semjonova................................................... 74
Differentiation of Natural and Irradiated Blue Topaz by Cathodoluminescence (CL) Properties
Y. Song and Y. Qi .......................................................................................................................... 75
Effects of Thermal Annealing on the Thermoluminescence Properties of Ion-Implanted SrTiO3
B. Tastekin, M. Turemis, M. I. Kati, I. C. Keskin, R. Kibar, A. Cetin, and N. Can ...................................................................................................................... 76
Luminescence and Raman Scattering of Stabilized Zirconia Crystals D. I. Torres and J. Llopis ................................................................................................................ 77
The Influence of Annealing on Thermoluminescence Behaviour in ZnO M. Turemis, B. Tastekin, M. I. Kati, I. C. Keskin, R. Kibar, A. Cetin, and N. Can .......................... 78
Spectral Decomposition Methods for Coherent Raman Spectroscopy L. Ujj, R. Hemasinha, and C. Prayaga ........................................................................................... 79
Preliminary Studies for the Use of Portable Raman in the Identification of Conservation Treatments Applied in the Architectural Heritage
C. Vazquez-Calvo, S. Martinez-Ramirez, M. Álvarez de Buergo, and R. Fort .............................. 80
Raman Spectroscopy Study of Tektites M. V. Volovetsky, A. A. Averin, and A. A. Shiryaev ....................................................................... 81
Raman Spectroscopy Applied to Rare and Tiny Phases: Example from the Study of Platinum Group Minerals (PGM)
F. Zaccarini, R. J. Bakker, G. Garuti, O. A. R. Thalhammer, J. A. Proenza, and T. Aiglsperger .................................................................................................. 82
LPI Contribution No. 1616x

Program
Wednesday, May 18, 2011 WELCOME AND OPENING CEREMONIES
9:30 a.m. Rocasolano Hall
9:30 a.m. Dr. Jose Vicente Garcia Ramos (Vice-President CSIC, Spain) and Javier Garcia Guinea (CORALS II Chair) Welcome
LUMINESCENCE AND MICRO-RAMAN OF METEORITES
AND SHOCK METAMORPHISM 9:45 a.m. Rocasolano Hall
Chairs: Javier Garcia-Guinea Arnold Gucsik 9:45 a.m. Gucsik A. * Okumura T. Kayama M. Nishido H. Ninagawa K. [INVITED OVERVIEW TALK]
A Combined Cathodoluminescence and Micro-Raman Study of Planar Deformation Features in Quartz [#4003]
10:15 a.m. Boonsue S. * Spray J. Shock-Induced Phase Transformations in Melt Pockets Within Martian Meteorite NWA 4468 [#4007]
10:30 a.m. Kayama M. * Nishido H. Sekine T. Nakazato T. Gucsik A. Ninagawa K. Clarification of Shock-Induced Effect on Cathodoluminescence of Alkali Feldspar [#4021]
10:45 a.m. COFFEE BREAK
11:30 a.m. 11:00 a.m. Katsaros Th. * Ganetsos Th. In Situ Study of a Collection of 20 Meteorites Using Raman Spectroscopy [#4057]
11:45 p.m. Kaliwoda M. * Hochleitner R. Hoffmann V. H. Mikouchi T. Gigler A. M. Schmahl W. W. New Raman Spectroscopic Data of Almahata Sitta Meteorite [#4037]
12:00 p.m. Rubio-Ordóñez A. * Cárdenes V. Rodríguez-Terente L. Tormo L. García-Guinea J. BSE, CL and Raman Spectroscopy Study of Phospates and Maskelenyte in the H6 Cangas de Onis Regolith Breccia [#4024]
12:15 p.m. Dutta P. * Duorah K. Thermoluminescence Studies of Dergaon Meteorite [#4011]
12:30 p.m. Shiryaev A. A. * Fisenko A. V. Vlasov I. I. Semjonova L. F. Raman and Luminescence Spectroscopy of Meteoritic Nanodiamonds [#4025]
12:45 p.m. LUNCH
CORALS II Conference xi

Wednesday, May 18, 2011 PLANETARY IN SITU APPLICATIONS OF LUMINESCENCE
AND RAMAN TECHNIQUES 2:30 p.m. Rocasolano Hall
Chairs: Emilio Nogales Marc Fries 2:30 p.m. Marc Fries * [INVITED OVERVIEW TALK] Raman in a Combined Instrument Package: Co-Registered and “Smart Raman” Techniques
3:00 p.m. Pidgeon R. T. * Nemchin A. A. Grange M. Timms N.
Events in the Life of the Oldest Zircon on the Moon: A Combined SIMS, CL, EBSD and Raman Study [#4002]
3:15 p.m. Muñoz-Iglesias M. V. * Bonales L. J. Prieto-Ballesteros O. Characterization of the Differentiation Process by Clathration in Europa Satellite Using Raman Spectroscopy [#4032]
3:30 p.m. De Angelis S. * Della Corte V. Baratta G. A. Brunetto R. Palumbo P. Ciucci A. Rotundi A. Raman Micro-Spectroscopy Performed on Extraterrestrial Particles [#4059]
3:45 p.m. Kollegger P. * Zaccarini F. Bakker R. J. Garuti G. Thalhammer O. A. R. Compositional Analyses of F, Cl and OH by Raman Spectroscopy in Apatite from Mafic-Ultramafic Pipes of the Ivrea Verbano Zone (NW Italy) [#4018]
4:00 p.m. COFFEE BREAK
4:45 p.m. Garcia-Guinea J. Tormo L. Azumendi O. Ruiz J. Luminescent Detection of Active Stress in Melilite-Anorthite CAI Grains of Allende CV3 Chondrite (Mexico) [#4053]
5:00 p.m. Caporali S. * Moggi-Cecchi V. Muniz-Miranda M. Pagliai M. Pratesi G. Schettino V. Adenine Adsorbed on a Martian Meteorite as a Test Case for SERS Investigation of Extraterrestrial Life Traces [#4041]
5:15 p.m. Blacksberg J. * Rossman G. R. In Situ Planetary Mineralogy Using Simultaneous Time Resolved Fluorescence and Raman Spectroscopy [#4048]
5:30 p.m. Böttger U. * de Vera J.-P. Fritz J. Weber I. Hübers H.-W. Raman Microscopy of Samples of Martian Analogue Material with Cyanobacteria [#4071]
LPI Contribution No. 1616xii

Wednesday, May 18, 2011 SOCIAL EVENT
6:00 p.m. Rocasolano Hall
Cocktail party in the Meteorite Exhibit Hall of the Museo Nacional of Ciencias Naturales. Attendees will also have access to the historical collections and the geological analytical facilities
(including the Raman and spectra cathodoluminescence microscopes).
6:00 p.m. Group photo at the CSIC main building stairs (meet by the granite columns)
6:30 p.m. Group meets in CSIC gardens to walk to the Museo Nacional Ciencias Naturales
7:00 p.m. Cocktails in the Geology Exhibition Hall
CORALS II Conference xiii

Thursday, May 19, 2011 NEW TRENDS AND DEVELOPMENTS IN OPTICAL SPECTROSCOPY
AND LUMINESCENCE TECHNIQUES I 9:30 a.m. Rocasolano Hall
Chairs: Emilio Nogales Ana Cremades 9:30 a.m. Emilio Nogales * [INVITED OVERVIEW TALK]
Confocal Raman and Luminescence Spectromicroscopy Studies of Nano- and Microscale Inorganic Materials
10:00 a.m. Guimbretière G. * Canizares A. Simon P. Tobon-Correa Y. A. Ammar M. R. Corbel C. Barthe M. F. In Situ Micro-Raman Observation of Uranium Dioxide Weathering in Contact with Water and Under Ion Beam Irradiation [#4013]
10:15 a.m. Ammar M. R. * Rouzaud J.-N. Charon E. Aleon J. Guimbretière G. Simon P. On the Reliable Structural Characterization of Polished Carbons in Meteorites by Raman Microspectroscopy [#4015]
10:30 a.m. Bonales L. J. * Muñoz-Iglesias M. V. Sanchez-Román M. Fernandez-Remolar D. Prieto-Ballesteros O. Quantitative Raman Spectroscopy (QRS), a Potential Tool to Study the Formation Mechanism of Carbonates of Early Earth and Mars [#4031]
10:45 a.m. Ujj L. * Hemasinha R. Prayaga C. Spectral Decomposition Methods for Coherent Raman Spectroscopy [#4080]
11:00 a.m. COFFEE BREAK
LPI Contribution No. 1616xiv

Thursday, May 19, 2011 NEW TRENDS AND DEVELOPMENTS IN OPTICAL SPECTROSCOPY
AND LUMINESCENCE TECHNIQUES II 11:30 a.m. Rocasolano Hall
Moderators: Emilio Nogales Ana Cremades Panel Members:
Rafael Sanchez (Thermofisher Scientific Spain) Compact Micro-Raman Microscopes Vicent Larat (Horiba Scientific Spain) Raman Equipment Sebastien Maussang (Renishaw Iberica) Latest Developments in Raman Spectroscopy Pedro Toribio (Microbeam S. A.) Portable Raman Devices
CORALS II Conference xv

Thursday, May 19, 2011 LUMINESCENCE AND RAMAN SPECTROSCOPY APPLIED TO EARTH SCIENCES
2:30 p.m. Rocasolano Hall
Luminescence and Raman Spectroscopy Applied to Minerals, Gemstones, Rocks, Fossils, and Natural Glasses
Chairs: Elena Crespo-Feo Lutz Nasdala 2:30 p.m. Lutz Nasdala * [INVITED OVERVIEW TALK]
Raman and Luminescence Images Applied to Study Internal Textures of Minerals and Geological Samples
3:00 p.m. Can N. * Garcia Guinea J. Hatipoglu M. Kibar R. Cetin A. Luminescence Behaviour and Raman Characterization of Rhodonite from Turkey [#4001]
3:15 p.m. Zaccarini F. * Bakker R. J. Garuti G. Thalhammer O. A. R. Proenza J. A. Aiglsperger T. Raman Spectroscopy Applied to Rare and Tiny Phases: Example from the Study of Platinum Group Minerals (PGM) [#4019]
3:30 p.m. Gigler A. M. * Sánchez-Pastor N. Cruz J. A. Fernández-Díaz L. Raman Spectroscopy and Microprobe Investigation of the Incorporation of Cr(VI) in CaCO3 [#4034]
3:45 p.m. Volovetsky M. V. * Averin A. A. Shiryaev A. A. Raman Spectroscopy Study of Tektites [#4010]
4:00 p.m. COFFEE BREAK
4:30 p.m. Brenker F. E. * Schmitz S. Vincze L. Vekemans B. Krebs M. de Nolf W. Janssens K. Stachel T. Harris J. Trapped High Density Fluids and Melts in Superdeep Diamonds [#4054]
4:45 p.m. Cetin A. * Kibar R. Can N. Luminescence Spectra of Plagioclase (Labradorite) from South Greenland [#4060]
5:00 p.m. Kibar R. * Kati M. I. Cetin A. Turemis M. Keskin I. C. Tastekin B. Hatipoglu M. Can N. Structure and Luminescence Characteristics of Aquamarine from Turkey [#4061]
5:15 p.m. Crespo-Feo E. * Hernandez-Ferreiros P. Garcia-Guinea J. Correcher V. Effects of the Tectonic Stress on Luminescence of Cerussite PbCO3 [#4081]
5:30 p.m. Schlueter C. F. * Gigler A. M. Moritz W. Iron Oxids on Ag(111) — Reversible Switching Between Hematite and Magnetite [#4076]
GALA DINNER
8:00 p.m. Rocasolano Hall
LPI Contribution No. 1616xvi

Friday, May 20, 2011 LUMINESCENCE AND RAMAN TECHNIQUES FOR GEOSCIENCE-RELATED USES
9:00 a.m. Rocasolano Hall
Luminescence and Raman Techniques for Geoscience-Related Uses Such as Dating and Radiation Dosimetry, Building Heritage, Pigment Preservation, Mortars, and Archaeological Artifacts
Chairs: Virgilio Correcher Chris Burbidge Angel Fernandez Cortes 9:00 a.m. Chris Burbidge * [INVITED OVERVIEW TALK]
Facets of Luminescence for Dating
9:30 a.m. Fernandez-Cortes A. Cuezva S. Cañaveras J. C. Garcia-Guinea J. Sanchez-Moral S. Content of Rare Earth Elements in a Speleothem Analyzed by ICP-MS and CL-Spectroscopy [#4066]
9:45 a.m. Sanjurjo-Sánchez J. * Vidal Romaní J. R. Luminescence Dating of Pseudokarst Speleothems: A First Approach [#4029]
10:00 a.m. Sanchez-Moral S. Fernandez-Cortes A. Cuezva S. Cañaveras J. C. Correcher V. Miller A. Z. Dionisio A. Marques J. M. Saiz-JImenez C. Afonso M. J. Chamine H. I. Furio M. Garcia-Guinea J. Uranyl Groups Coupled to Evansite Granite Vein Infills in the Porto Undergrounds (NW Portugal) [#4023]
10:15 a.m. López-Arce P. * Zornoza-Indart A. Vázquez-Calvo C. Gomez-Heras M. Álvarez de Buergo M. Fort R. Evaluation of Portable Raman for the Characterization of Salt Efflorescences at Petra, Jordan [#4038]
10:30 a.m. González-Acebrón L. * Barca D. Arribas J. Mas J. R. Trace Element and REE Leaching During Diagenetic Albitization and Its Relationship to the Cathodoluminescence Colour of Feldspars: The Tera Group, Cameros Basin (NE Spain) [#4045]
10:45 a.m. COFFEE BREAK 11:15 a.m. Henner Busemann * [INVITED OVERVIEW TALK]
Spectroscopy Results on Stardust, Interplanetary Dust Particles, and Meteorites
11:45 a.m. Arnold Gucsik * Proposal of Creation of the European Society of Luminescence
12:15 p.m. Javier Garcia-Guinea * Proposals for the Next CORALS III Conference 2013
12:30 p.m. LUNCH
CORALS II Conference xvii

Friday, May 20, 2011 POSTER SESSION
3:00 p.m. Church Cloister
Posters may be prepared in vertical format, and are limited to no more than 75 cm (29 inches) wide and 120 cm (47 inches) high
Bersani D. Mantovani L. Tribaudino M. Lottici P. P. Raman Investigation on Pigeonite in Ureilite [#4077] Matsuda J. Morishita K. Nara M. Amari S. Raman Spectroscopic Study of Allende (CV3) and Saratov (L4) Chemical Residues and Its Implication to Phase Q [#4017] Azumendi O. Tormo L. Ruiz J. Garcia-Guinea J. Madrid L6 Chondrite (Fall 1896): ESEM-Cathodoluminescence Survey [#4020] Ivliev A. I. Alexeev V. A. Kuyunko N. S. Thermoluminescence and Shock Metamorphism of Ordinary Chondrites [#4040] Glotch T. D. Ferrari M. J. Raman Microscopy of Shocked and Unshocked Basalts from Lonar Crater, India [#4049] Alba-Aldave L. A. García-Guinea J. Furio M. Jorge-García A. Cathodoluminescence and Raman Spectroscopic Characterization of Phosphates in Mexican Chondrites [#4052] Aparicio A. Bustillo M. A. CL-Spectral Characteristics of Quartz and Feldspars in Fresh and Hydrothermal Altered Volcanic Rocks (Cabo de Gata, Almeria, Spain) [#4008] Prieto A. C. Guedes A. Dória A. Noronha F. Jiménez J. Quantitative Determination of Gaseous Phases in Fluid Inclusions by Raman Microscopy [#4039] Torres D. I. Llopis J. Luminescence and Raman Scattering of Stabilized Zirconia Crystals [#4051] Prieto-Taboada N. Gómez-Laserna O. Ibarrondo I. Martinez-Arkarazo I. Olazabal M. A. Madariaga J. M. Cross-Section Analysis to Establish the Penetration Level of Atmospheric Pollution in Mortars [#4058] Kashkarov L. L. Kalinina G. V. Shilobreeva S. N. Thermoluminescence as One of the Methods for Determination of the Crystal Lattice Structure of Quartz [#4070] Aramendia J. Gómez-Nubla L. Fdez-Ortiz de Vallejuelo S. Castro K. Madariaga J. M. New Findings by Raman Microspectroscopy of Inclusions Inside a Libyan Desert Glass [#4075] Sánchez-Pastor N. Gigler A. M. Fernández-Díaz L. Raman Study of Synthetic BaCO3–SrCO3 Solid Solutions [#4036] Bustillo M. A. Pérez-Jiménez J. L. Alonso-Zarza A. M. Furio M. Moganite in the Chalcedony Varieties of Continental Cherts (Miocene, Madrid Basin, Spain) [#4009]
LPI Contribution No. 1616xviii

Pozo M. Garcia-Guinea J. Furio M. Fernandez-Cortés A. Correcher V. Spectra Luminescence of Uranyl Groups Associated to Silica Phases in Hydrothermal and Sedimentary Opals from Madrid (Spain) [#4012] Kayama M. Nishido H. Toyoda S. Komuro K. Ninagawa K. Characterization of Radiation Effects in Albite by Cathodoluminescence [#4022] Furió M. Merino L. Tormo L. Jorge A. Garcia-Guinea J. Francevillite [(Ba,Pb)(UO2)2(V2O8)5H2O] on the Hydroxyapatite Bond Fossils of Loranca (Cuenca, Spain): Spectrum Cathodoluminescence of Uranyl-Vanadates [#4026] Jorge A. Garcia-Guinea J. Tormo L. Furio M. Fernandez-Cortes A. Cuezva S. Sanchez-Moral S. Spectra Cathodoluminescence and Crystal Lattice: Cerite Versus Whitlockite [#4027] Cruz J. A. Sánchez-Pastor N. Gigler A. M. Fernández-Díaz L. Vaterite Stability in the Presence of Cr (VI) [#4035] Martinez-Ramirez S. Camacho J. J. Diaz L. Laser Induced Artificial Fulgurites Formation: Preliminary Results [#4028] Correcher V. Garcia-Guinea J. Martin-Fernandez C. Can N. Thermal Effect on the Cathodo- and Thermoluminescence Emission of Natural Topaz (Al2SiO4(F,OH)2) [#4042] Lenz C. Götze J. Manganese-Activated Cathodoluminescence of Selected Carbonate Minerals [#4043] Song Y. Qi Y. Differentiation of Natural and Irradiated Blue Topaz by Cathodoluminescence (CL) Properties [#4050] Keskin I. C. Kati M. I. Turemis M. Tastekin B. Kibar R. Cetin A. Can N. Thermoluminescence of the Blue and White Chalcedony from Turkey [#4064] Kati M. I. Turemis M. Keskin I. C. Tastekin B. Hatipoglu M. Kibar R. Cetin A. Can N. Optical Absorption, Cathodo- and Radioluminescence in Diaspore [#4065] Goienaga N. Carrero J. A. Arrizabalaga I. Bustamante J. Fernández L. A. Madariaga J. M. Analysis of Health and Environmental Risk Assessment of an Abandoned Zn-Pb Mine Through the Weathering Processes of the Local Minerals [#4072] Crespo-Feo E. Garcia-Guinea J. Correcher V. Nieto-Codina A. Preliminary Studies on the Spectra Luminescence of Brenkite Ca2F2CO3 [#4074] Iturregi A. Arrieta N. Martinez-Arkarazo I. Murelaga X. Baceta J. I. Sarmiento A. Madariaga J. M. Molecular Characterization of a Temperate Beachrock Formation in the Nerbioi-Ibaizabal Estuary (Arrigunaga Beach, Bay of Biscay) [#4079] Franquelo M. L. Duran A. Arquillo D. Perez-Rodriguez J. L. Old and Modern Pigments Identification from a 14th Century Sculpture by Micro-Raman [#4004] Garofano I. Duran A. Perez-Rodriguez J. L. Robador M. D. Natural Earth Pigments from Roman and Arabic Wall Paintings Revealed by Spectroscopic Techniques [#4006]
CORALS II Conference xix

Vazquez-Calvo C. Martinez-Ramirez S. Álvarez de Buergo M. Fort R. Preliminary Studies for the Use of Portable Raman in the Identification of Conservation Treatments Applied in the Architectural Heritage [#4014] Sanjurjo-Sánchez J. Blanco Rotea R. Luminescence Dating of Mortars from Ancient Architectural Elements [#4030] Medialdea A. Porat N. Benito G. Optically Stimulated Luminescence Response of Modern Flash-Flood Deposits in Small Mountain Catchments [#4033] Prieto A. C. Avella M. Martínez O. Jiménez J. Alonso J. L. Sánchez I. Martín R. Barrera M. Raman Spectroscopy Analysis of a Playing Card from the XVII Century [#4046] Prieto A. C. Avella M. González M. A. Jiménez J. Romero F. De Pablo R. Górriz C. Sanz C. Analysis of the Residual in Grave Goods from the Vaccaea Era at the Necropolis of “Las Ruedas” in Pintia [#4047] García-Antón E. Cuezva S. Fernández-Cortes A. Cuevas-González J. Muñoz-Cervera M. C. Benavente D. Sanchez-Moral S. Cañaveras J. C. Mineral Variations Study of Canelobre Cave Phosphate Stalactite by Raman and Luminescence Methods [#4056] Turemis M. Tastekin B. Kati M. I. Keskin I. C. Kibar R. Cetin A. Can N. The Influence of Annealing on Thermoluminescence Behaviour in ZnO [#4062] Fdez-Ortiz de Vallejuelo S. Castro K. Martínez-Arkarazo I. Madariaga J. M. Raman Spectroscopic Characterisation of Green-Blue Stalactites in Lantz Cave (Navarra, North of Spain) [#4063] Gómez-Nubla L. Aramendia J. Fdez-Ortiz de Vallejuelo S. Castro K. Madariaga J. M. Relations Between Leachated Compounds and Raman Spectrum of Black Slags from EAF in Order to Characterize Them [#4067] Aramendia J. Gómez-Nubla L. Castro K. Martínez-Arkarazo I. Arana G. Madariaga J. M. The Consequences of the Presence of Urban Atmospherica Particles and Airbornes in CorTen® Steel Surfaces [#4069] Tastekin B. Turemis M. Kati M. I. Keskin I. C. Kibar R. Cetin A. Can N. Effects of Thermal Annealing on the Thermoluminescence Properties of Ion-Implanted SrTiO3 [#4082] Iordanidis A. Garcia-Guinea J. Correcher V. Cystine-Apatite Renal Calculi: EPMA, Raman and ESEM-CL Study [#4005] Bower D. M. Steele A. Fries M. D. Kater L. Micro Raman Spectroscopic Investigations of the Nature and Provenance of Carbonaceous Material in Micro-Fossil Bearing Rocks: Redefining D and G Carbon Band Parameters for the Detection of Biosignatures [#4016] Sanz M. E. González-Acebrón L. Rodríguez-Aranda J. P. Marshall C. P. Raman Spectra on Fluid Inclusions in Glauberite from Miocene Saline Lakes of the Madrid Basin: Evidence for Microbial Activity [#4044]
LPI Contribution No. 1616xx

Prieto A. C. Avella M. Martínez O. Moreno-Eiris E. Menéndez S. Rodríguez-Martínez M. Perejón A. Detection of Carbonaceous Material in Fossil Marine Microbialites by Raman Spectroscopy (Láncara Formation, Lower Cambrian, Cantabrian Mountains, Spain) [#4055] Bergamonti L. Bersani D. Lottici P. P. Raman Spectroscopy in Corals and Pearls [#4068] Ibarrondo I. Prieto-Taboada N. Martínez-Arkarazo I. Madariaga J. M. The Suitable Carotene and Xanthophyll Identification in Lecanora Lichens: Resonance Raman Spectroscopic Study [#4073] Arrieta N. Iturregi A. Martinez-Arkarazo I. Murelaga X. Baceta J. I. Madariaga J. M. Spectroscopic Characterization of Ferruginous Cements in a Temperate Beachrock Formation Close to Nerbioi-Ibaizabal Estuary (Tunelboka Cove, Bay of Biscay) [#4078]
CORALS II Conference xxi

Saturday, May 21, 2011 FIELD TRIP ACROSS GUADARRAMA MOUNTAINS AND EL ESCORIAL
9:30 a.m. Rocasolano Hall
Field Trip Across Guadarrama Mountains and El Escorial
Guide: Javier Garcia Guinea 9:30 a.m. Bus departs from CSIC Central Campus (Serrano St., 117) 10:30 a.m. Visit at Madrid Deep Space Communications Complex (www.mdscc.org)
12:00 p.m. Snacks and drinks in the Silla de Felipe II Area (El Escorial, Madrid)
1:00 p.m. Free time in the El Escorial City Center and Monastery
5:00 p.m. Bus departs for evening trip to Guadarrama Mountains—Manzanares—Colmenar Viejo
(Geological Park of Rock Monolites)
8:00 p.m. Estimated time of return to Madrid
LPI Contribution No. 1616xxii

Cathodoluminesce and Raman Spectroscopic Characterization of Phosphates in Mexican Chondrites
L. A. Alba-Aldave, J. García-Guinea, M. Furio, and A. Jorge-García
Four chondrite meteorites fallen in Mexico (Nuevo Mercurio, Nuevo Mercurio (c), Cuarta Parte, and Cosina)were studied in polished thin sections, using a secondary electron microscope catodoluminesce system (SEM-CL), and Raman spectroscopy (RS). We analyzed and compared the spectra obtained by CL and RS of merrillite and apatite. These meteorites belong to the collection of Institute of Geology of the University of México.
Meteorite descriptiona) Nuevo Mercurio meteorite, classified as an olivine and bronzite chondrite H5, fell down in december of 1978 near the locality of Nuevo Mecurio, Zacatecas (24° 18’ N 102° 08’ W).b) Nuevo Mercurio (c) is a genomict breccia H5/6, with the presence of some H6 clasts, a dark inclusion, and a large grain of metal-troilite. The minerals are olivine, pyroxene and feldspars, while the opaque mineral phases are troilite, kamacite, taenite and chromite.c) Cosina meteorite, classified as a chondrite of olivine and bronzite H5, fell down near Dolores Hidalgo city, Guanajuato (21° 10’ N 100° 52’ W) in january of 1844. It is an unusual ordinary chondrite with a highly porous lithology.d) Cuarta Parte (also known as Silao) meteorite, classified as an ordinary chondrite L4, fell down in april of 1995 in Silao municipality, Guanajuato (20° 56’ N 101° 21’ W).Merrilite and apatite are present as accessory minerals in all meteorites.
a) b) c) d)
Experimental methodThe luminescent images showed the occurrence of plagioclases and phosphates. The phosphates CL spectra show the presence of two different profiles which could be assigned to merrillite and apatite, and this assignment was then confirmed by EDS and Raman spectroscopy studies. The CL spectra of merrillites of the four meteorites were very similar, even though they fell very separated in time and place.
Fig. 1 CL spectra of merrillites Fig. 2 Raman spectra of the merrillites
Conclusions:Despite of the differences in mineral composition and texture of the four meteorites, it is remarkable that the merrillite CL spectra are so much alike, indicating the presence of the same RE elements, with similar relative proportions, in all the cases.
200 300 400 500 600 700 800 9000
10000
20000
30000
40000
50000
60000
70000
MERRILLITES
Nuevo Mercurio (c)
Cuarta ParteCosinaNuevo Mercurio
Inte
nsity
(a.u
.)
Wavelength nm
200 400 600 800 1000 1200-20
-10
0
10
20
30
40
50
60
70
80
Nuevo Mertcurio (c)Cuarta ParteCosinaNuevo Mercurio
Inte
nsity
Raman shift (cm-1)
MERRILLITES
1CORALS II Conference

On the reliable structural characterization of polished carbons in meteorites by Raman microspectroscopy M. R. Ammar1,2,3*, J.-N. Rouzaud3, E. Charon3, J. Aleon4, G. Guimbretière1,2, P. Simon1,2
1UPR CNRS 3079, 1D, Avenue de la Recherche Scientifique, 45071 Orléans cedex 2, France. 2Université d’Orléans, Polytech’Orléans, 8 rue
Léonard de Vinci 45072 Orléans, France. 3Laboratoire de Géologie de l'Ecole Normale Supérieure, UMR CNRS 8538, 24 rue Lhomond, F-
75231 Paris cedex 5, France. 4Centre de Spectrométrie de Masse, CNRS/IN2P3, Univ. Paris Sud, Bât 104, 91405 Orsay Campus France.
Whatever its anthropogenic or natural origin (terre-strial and extra-terrestrial), the carbon multiscale or-ganization (structure, nanostructure) is a fingerprint allowing to reconstruct their formation and to better constraint the parameters such as precursor nature,temperature, pressure .... Raman microspectroscopy becomes nowadays a method of choice to characterizethe carbon matter and is sensitive to the full range of the structural states present in this class of materials, from perfectly crystalline to amorphous. In the case of graphitic natural carbons materials, the intensity ratio ID/IG has frequently been used as a reliable quantitative parameter of the structural order such as the determina-tion of the mean ‘crystallites' diameter [1]. As far as the meteorites are concerned, the information can be obtained on the precursor origin, the metamorphism degree [2-3]...
Fig.1: Optical microscopy observation of Acapulco meteorite
In order to characterize various carbons in meteor-ites and also to discriminate them from opaque compo-nents such as metallic phases, the optical observation has to be performed by the reflexion mode on carefully polished sections prior to performing the Raman analy-sis (Fig. 1). However, the reliability of such ID/IG ratio fails when the carbons were polished (Fig.2). This mode of preparation is known to be responsible for a remarkable growth of the D band intensity [4-5] and consequently induces prohibitory errors in the structur-al characterization and the estimation of the intrinsic and original degree of ordering in the meteorite cabons.
Fig.2: Raman spectra of polished (spectrum on the top) and unpolished (spectrum on the bottom) graphitizedcarbon obtained after 2900°C heat treatment.
In this presentation, the applicability of Raman mi-crospectroscopy on polished graphitized carbons willbe discussed in details. A new and reliable manner to obtain the intrinsic structural order from Raman spectra will be then given. An example of such application will be shown on the graphitized carbons found in the Aca-pulco primitive achondrite.
[1] Tuinstra F. and Koenig J.L. (1970) J Chem Phys. 53, 1126. [2] Le Guillou C. et al. (2010) Geochim. Cosmochim Acta. 74, 4167-4185. [3] Quirico E. et al. (2009) Earth. Planet. Sci. Lett. 287, 185−193. [4] Mostefaoui S. et al. (2000) Geochim. Cosmochim. Acta. 64,1945. [5] Pasteris J.D. (1989), Appl. Spec-trosc. 43,567.
2 LPI Contribution No. 1616

CL-SEM SPECTRAL CHARACTERISTICS OF QUARTZ AND FELDSPARS IN FRESH AND HYDROTHERMAL ALTERED VOLCANIC ROCKS (CABO DE GATA, ALMERIA, SPAIN). A. Aparicio1
and M. A. Bustillo2
1Depto. de Dinámica Terrestre. Instituto de Geociencias. UCM-CSIC, c/ José Gutiérrez Abascal, nº2, 28006-Madrid, Spain, [email protected] ,2Dpto. de Geología. Museo Nacional de Ciencias Naturales. CSIC, c/ José Gutiérrez Abascal, nº2, 28006-Madrid, Spain, [email protected]
Introduction: The volcanic rocks of the Cabo de Gata are lava flows and domes formed underwater or by air emissions, being sometimes piroclastics hydromagmatic deposits. In some areas, the volcanic rocks are transformed by hydrothermal alterationforming highly silicified and feldspatized rocks, or clay- rich rocks of economic interest. In this study,different samples from outcrops of fresh and altered volcanic rocks have been studied by optical microscopy and scanning electron microscope cathodoluminescence (CL-SEM), with the aim of knowing how the spectral characteristics of quartz and feldspar are modified by the hydrothermal alteration,and characterizing the spectral features of the neoformed minerals.
Metodology: Conventional transmitted-light microscopy data together with a study in scanning electron microscope cathodoluminescence (CL-SEM)was carried out on quartz and feldspar of both fresh and hydrothermal altered volcanic rocks. In the alterated rocks, inherited and neoformed minerals weredefined by optical microscopy and were separatelystudied.
Scanning electron observations were made using a FEI QUANTA 200 microscope (SEM) equipped with an Analytical-Inca (Oxford Instruments) analysis system incorporating an energy dispersive [EDS] X-ray detector. The SEM-CL images and spectra were obtained with a MONOCL3 Gatan instrument to record CL spectra and panchromatic and monochromatic plots. The excitation for CL measurements was provided at 25-kV electron beam.The capability of combining CL with back-scattered electron (BSE) or secondary electron (SE) mode, or energy dispersive spectroscopy (EDS) microanalysis allows us to correlate important features as spectral patterns, growth textures, structural defects,incorporation of trace element…i.e.
Results:Quartz. The quartz magmatic crystals, from
volcanic rocks without alteration, show CL-spectrum with four emission bands at around 400, 430-440, and 480nm. Sometimes, in the hydrothermal alteredvolcanic rocks, the inherited quartz crystals are differentiated of primary magmatic quartz because they show numerous cracks and small fractures. The inherited quartz crystals show the same bands as the
primary magmatic crystals (at 400, 430- 440 and 480 nm), and others at 640 and 775 nm, that are absent or are less intense in the magmatic quartz of the fresh volcanic rock. The inherited quartz crystals from Rodalquilar outcrop have emission bands at 390, 430-440, 475, 630 and 780 nm., showing slight differences and lower intensity, in relation to inherited quartz crystals of other outcrops. In this case, both magmatic and inherited quartz contain small amounts of Al, K and Na, under EDS.
Neoformed quartz shows two types of spectrum: 1)a emission band at 560-580 nm and others with less intensity at 400 and 460nm. Under EDS, these crystals also contain small amounts of Al and K, and 2) emission bands around 589, 400 and 460 , with a new band at 310nm. In this case the amount of trace elements is higher (Al, K, Ti, Na) than the other types of quartz.
Feldspars. Magmatic plagioclase shows quite uniform CL spectra with intense bands at 570, 340-350 nm., and others of lower intensity at 430, 480, 675-710 nm. In the altered volcanic rocks, the inherited plagioclase spectra are similar. The composition of the plagioclase from the fresh volcanic rock (bitownite,labrador) and from the altered volcanic rock (oligoclase, andesine) have no influence in the CL-spectrum, only the intensity of the bands is changing .
Neoformed anorthoclase is scarce founded in some samples of altered volcanic rocks, and their spectra have the same characteristics as those of the magmatic plagioclase with maxima peaks at 570 and 345 -360 nm.
Sanidine show differences in the CL spectra between magmatic and neoformed. The spectra of magmatic sanidine has intense bands at 425, 440 and 490 nm, while the low temperature sanidine has the intense bands at 310 and 570, and others smaller at 370 and 440-460 nm.
Conclusions: The studies by CL-SEM of the minerals that constitute fresh and hydrothermal altered calc-alkaline volcanic rocks show that the CL spectra denote the provenance and origin of the minerals. A magmatic, inherited or neoformed origin could beinterpretable through their respective CL spectra. Financial support: Project CGL2008-05584-CO2-01 from the Spanish Ministry of Science and Innovation.
3CORALS II Conference

THE CONSECUENCES OF THE PRESENCE OF URBAN ATMOSPHERICAL PARTICLES AND AIRBORNES IN CorTen® STEEL SURFACES. J. Aramendia*, L.Gomez-Nubla, K. Castro, I. Martínez-Arkarazo, G. Arana and J. M. Madariaga University of the Basque Country, Department of Analytical Chemistry, P.O.Box 644, 48080 Bilbao, Spain, +34 946018297, *[email protected]
CorTen steel is known because it develops a layer
composed by iron oxides which protects the surface against the corrosion. The presence of different atmos-pherical particles and urban-marine airborne in that surface can affect the normal development of the pro-tective rust layer that generates this kind of steel. In an urban-marine atmosphere there are many different par-ticles such as silicates and carbonates and airborne such as NaCl, nitrates, etc. These compounds can change the nature and the composition of the rust layer affecting to the protective properties of this surface. As a consequence, unusual iron oxide phases are formed.
In the present work, several CorTen steel surfaces
have been analyzed. These surfaces are exposed in Bilbao (North of Spain) to the same urban–marine at-mosphere. For this study, non-destructives techniques like Raman spectroscopy and SEM-EDS (Scanning Electron Microscope coupled to Energy-Dispersive X-ray spectroscopy) have been used. With these tech-niques, we have been able to observe the changes of the evolution in the rust layer due to the presence of particles and airborne.
It has been detected the presence of akaganeite (β-
FeOOH). Akaganeite appears in those environments with high amount of salt airborne [1]. This iron oxy-hidroxide has a very porous structure and facilitates the entrance of ions and contaminants in the internal side of the structure [2]. It has been checked also that the massive presence of silicates in the steel surface can delay the passivation of the rust layer. In fact, the pres-ence of this kind of compounds avoids the transforma-tion of the lepidocrocite (γ-FeOOH, active phase) into goethite (α-FeOOH, stable phase) [3]. In addition, the acid gases present in the urban atmosphere affect the steel surface. For example, it has been detected gypsum in all sculptures. This gypsum can be formed by the reaction of calcite particles with SO2 present in the atmosphere [4]. This reaction can also provide the enough SO4
2- ions to generate iron sulphates with the iron present in the steel. Furthermore, iron nitrates were also identified. Iron nitrates can be formed due to the massive presence of NOx gases that attack the steel surface.
Figure 1. Raman spectra of a) gypsum and b) calcite particles found in the same CorTen steel surface. References
[1] Kamimura T. et al. (2006) Corros. Sci., 48, 2799-2812.
[2] Millan A. et al. (2009) Polymer, 50, 5, 1088-1094. [3] Schwertmann U. and Taylor R.M. (1972) Clays
Clay Miner., 20, 159-164. [4] Sarmiento A. et al. (2008) J.Raman Spectrosc., 39, 1042-1049.
Acknowledgments
This work has been financially supported by Spanish Government through IMDICOGU project (BIA2008-06592). J.aramendia and L.Gomez-Nubla are grateful to the Basque Government and to the University of the Basque Country (UPV-EHU) respectively, for their pre-doctoral fellowship.
a)
b)
4 LPI Contribution No. 1616

���� ������� ��� ����� ��� ����� ������ � �� ��������� ������ �� �������
��� ������ ����������� �������������� ������������������������� ������� ��� ��!��"����#�$�������"��"������#� � � %�&� ��'� �(� �)� *� +�� �����'�� ,-���� ���'��.��� �)�� ��'�� /���*�0� 122�� 23434� *������� �-���� 5�6� 782�9214 3$9:� �;����6���������44$<)�� �$�%�&� ��'��(��)�*� +�������'��,-���������#��-)'����/�������#'��/����*�0�122 ��23434��*��������-���
�
������, ������ � =�,�>�)� ������� ��'�(��� .��� �� �.� �� ��� .�&�'� �� 98$���,��� ����������#�� � �)���� � .������ ���)�? ���, ����(�;#'-������ �)����'���������@��� � ������������$3�A���������'�� ������5)��� ���.����&� '��������)�#� � ��(� �) �#�� ���--����'�� �)'�.�������.������'� �� ��-�.�� -��. � ��� �'� �� ������ �� B C�� 5)� ���#�&������(��)�#�� ������ �&�'�)�#)� ���.��.���������� �)� � ��-���� �)��� ��� (����� �'� )�.D�����#��(�+������ ��� ��E��� �� ��� ����#� �� ������� ���-�.�� B$C�� 5)� � )�-��) � � F����� �� ��#��� �.�� � �(��)�.������� .������ .�.� ���((�����)����-� ��� �)� .)��.��� .��-� ����� �(� �)� �,�� ��� .����� ��D�F��)����#���(��)�#�� �B8C���&����F��D � ������� �)� .��-� ����� �(� �,��� ���� ��'� �� (F� �(� �)��F�� .������ ���� � �#� G���� -.������'�� 5)� �F��D� )�F � F� �(�������� ������ �)� ������ .���-� ������(��)��.�� �� �-� �����,���
@� �)� � F��D� �F�� ��-� � �(� �,�� F�� ���'����5)����' � ��(��)� ��-� �F��.����������F��)��F��G���� -.������ 6� @�G��� �����������*H?5;��.�� ��� G� )�F� @���� G���� -.��������.��-��������,"�"���.����.�� .�-��5)��� ��+��-��� )� � �� A 2� �� ��� �� :3A� �� 0.��������� ��� @� ����� ��� .��-���� �)� �(�������� �������� (���� G���� -.���� ��� F� � � �� �� -����������5�0� !���'���.���(���� ..�+��-��� =I�!G�>��'�*��.D���
�..����#� ���G���������� ���)� ���-� �����)����������� �(� �,�� �����0�� �--� ��'� �� #�� '������0� =J 8:4� .�� �� J 144� .�� >�� 5)� � � ���� ��((� �(���� �)� ����� (���� �� ��)�� ���� � �)��� �((���� �)����)����D��������� � � (������(� #�� '������0�����F��)������� G���� ��� � ������ 234� .� � � ��� 3$4� .�� ��?��)� �)� � �.)�+�� ��((��� �.�� �� � F�� �����(���� �.)� � 6� +������ =���$�>�� ���� � =5��$>�� .��.���=����8>�� ��$��8� ��� .�����.� ������� =��#� >�� @��)�.� ��(� �) � ��-� ��(��,���)����F� )��.��� �� ����.��-� ���(�-���+�������F��)�G������� �$42=�>�� $18= >�� 8A2= >�� 24 =& >�� 218=& >�� 19A=& >��341= >�� 43 =& >�� A3=& >� .�� �� ?��)� �#���� ��� �)�.��.��������F� ��������(�������)���,�� ���� �����)� � .��-���� .����� �� ������ F��)� �)� �)'�����(��������)��-����.���� �B2C����)��.��-����)� ���(�����'�G���� -.��� .�-'��F��)���� ����A 8���� A$9� .�� �� �..����#� ��� ��������� ��� .����� �� ��
��.��.��� (�� -���� 5)� ������ .��-� ����� �(��,����������'�� �#��)�!G���F)���)��������� �-� �����)� ��-� ���6���������������5�������� F����� �� .� � ��� F��)� �)� ���.����� .��-� ��������������'�G���� -.��� .�-'��
���#��� ��G���� -.�����(�.��.���=��>��K�����=K>���� ������.���
�����=��>�(�������,����������� �� ����
������������������������� ����� �����������������
��������� � ������������������������ � �������������������������
� ��!���"��� �����������#���$��#������%#�&�����%�������#����$��%#��
����#����$����
'(�������)"��� ������� ����%�������%#���*$�%#�&�$�$�%#��
����#��+� �����+�+"��� �$��#����*��������#�����$�%��� ,-��.- (/�
�-/ �����-(�����,��+"���
�*$�%#�������#�� ,-��.- (/�
'(0�/����+��"��� 1-#�%��,-��.- (/�� ����%#�������%��������#��
'�-20- �����-(� ������������������ ������������������3�-� (��4� /�2�� $������$�*���� +��-�� ��&�����
����������
B C����������=$4 >����������� ���.��L:��B$C��� )�D� ��� �� ���� =$4 4>� �� ������ �� �������
����������1��9:8�939���B8C� ������ ��� � �� ���� =$442>� �� ������ �� �������
����������3�� $:8� $3A����B2C� �F�� "�� �� ���� =$4 4>������� ��������� ������
�����$1A9�$11A�������� �!"#��$��
���������� ��� ������������� ��� #���(��� ��� �)�*� +����&������� ��� �)�%�&� ��'��(� �)�*� �+�� �����'� =%/��;M%>� � -.��&�'�� (��� �)�� -����.������ (���F )�-�� 5)� � F��D� )� � �� (��.����'� �--������'��)�*� +����&�����)���#)��)�;�&�������� ���'��.��� �)�� ��'� /���.�� $44:N$4 $�=G(��@5�$2A�4:>��
5CORALS II Conference

SPECTROSCOPIC CHARACTERIZATION OF FERRUGINOUS CEMENTS IN A TEMPERATEBEACHROCK FORMATION CLOSE TO NERBIOI-IBAIZABAL ESTUARY (TUNELBOKA COVE, BAYOF BISCAY). N. Arrieta1*, A. Iturregi1, I. Martinez-Arkarazo1, X. Murelaga2, J.I. Baceta2 and J.M. Madariaga1. 1 Department of Analytical
Chemistry, University of the Basque Country (EHU/UPV), P.O. Box 644, E-48080 Bilbao, Spain. 2 Department of Stratigraphy and Palaeontol-
ogy, University of the Basque Country (EHU/UPV), P.O. Box 644, E-48080 Bilbao, Spain. *Tel.: +34 94 60182 98, [email protected]
Beachrocks are coastal sedimentary formations mainly occurring along equatorial-tropical coasts that result from a relative rapid cementation of beach sedi-ments by the precipitation of carbonate cements. Aseries of physico-chemical and biologically-induced processes have been invoked to explain such rapid ce-mentation [1-4]. Beachrock cements are usually domi-nated by CaCO3 polymorphs which rarely are overlied by non continuous iron-rich dark layers [5].
The present work is focused on the occurrence of an unusual temperate setting (43ºN latitude) beachrock located in Tunelboka cove, close to the Nerbioi-Ibaizabal estuary (Bay of Biscay, North of Spain).
A previous research work carried out on the area and in some adjacent beaches which present these lithi-fied structures, revealed the existence of different ce-ment generations (CG) by means of Raman micro-spectroscopy, SEM-EDX analyses and petrographic descriptions: CG 1 (aragonite, high-magnesium calciteand silicates), CG 2 (aragonite) and CG 3 (CaCO3 po-lymorphs and iron oxides) [6].
Besides the CaCO3 cements, some iron containing cements enclosing the beach grains were also observed in several lithified outcrops of the Tunelboka cove. Theferruginous cements appeared in two forms: (i) acom-paining carbonate cements as discontinuous an non-homogeneous layers and as (ii) uniform an continuous cements between the beach grains. To our knowledge, the second cementing form has not been described pre-viously in beachrock formations in contrast to the (i) cements.
The characterization of the ferruginous cements have been carried out by means of Raman spectrosco-py. For that purpose, an InnoRaman® (B&WTEKINC)ultramobile spectrometer, equipped with 20x and 50x focusing lens, an excitation wavelength of 785 nm, aCCD detector (Peltier cooled) and BWSpec 3.26_38 software for the data acquisition was used.
First of all, the effect of laser power was studied in order to avoid decomposition/transformation processes of oxides and hydroxyoxides during measurements [7].
The Raman spectra taken in the (i) cements,showed limonite (FeO(OH)·nH2O, with Raman bands at 241w, 298s, 393vs, 478w, 548m), aragonite (CaCO3,146w, 205m, 705m, 1085vs) and silicates mixtures(1159br, 1258vs, 1365br, 1837br, 1939br). Exporadi-cally mixtures of limonite and quartz (SiO2, 205m and 465vs) or hematite ( -Fe2O3, 225vs, 292vs, 410s,
496m, 611m) and aragonite mixtures were observed as well.
The Raman spectra got in the continuous ferrugin-ous cements (ii), revealed limonite as the main cement-ing mineral phase. Frecuently, hematite remains were also identified into the limonite cement (Fig. 1). More-over, traces of other mineral phases such as wüstite (FeO, 459br, 653br), anatase (TiO2, 147vs, 199w, 398s, 510m, 638s), magnetite (308m and 668vs) and lepidocrocite ( -FeO(OH), 213m, 246vs, 304m, 344m, 373vs, 523m, 645m) were also identified. It is remark-able that lepidocrocite appeared as a thin layer cover-ing hematite grains, which suggest the superficial trans-formation of hematite. Indead, hematite is thought to be the main original iron containing mineral comingfrom a submarine disposal area located 4 miles north of the mouth of the estuary where old steel factories dumped rubble derived from blast furnace during the first half of the XX century.
Fig. 1. Raman spectra obtained from the continuous ferruginous cement, (ii). (a) hematite, (b) and (c) different hematite proportions in limonite based cement; (d) limonite.
Taken into account the mineral phases identified by Raman, our hypothesis is that the iron mineral wastes arrived to the beach, cemented and part of them dis-olved by different mechanisms (including acid aerosols attack) to reprecipitate as limonite.
References
[1] Díez B. et al. (2007) Appl. Environ. Microbiol, 73, 3656-3668. [2] Grischler E. et all. (2007) Geochemical Sedi-ments&Landscapes, Wiley-Blackwel, UK, 365-390. [3] Vousdoukas M.I. et al. (2007) Earth Sci. Rev., 85, 23-46. [4] Vieira M.M., Ros L.F.D (2007) Sediment. Geol., 192, 207-230. [5] Strasser A. et al.(1989) Sediment. Geol., 62, 89-100. [6] Arrieta N. et al. (2011) Spectrochim. Acta A, doi:10.1016/j.saa.2011.01.031. [7] de Faria D.L.A. et al. (1997) J. Raman Spectrosc., 28, 873-878.
Acknowledgements
This work has been financially supported by the Basque Gov-ernment through the Environmental Analytical Chemistry Project (ref. IT-245-07). N. Arrieta is grateful to the University of the Bas-que Country (UPV/EHU) for her pre-doctoral fellowship.
6 LPI Contribution No. 1616
MADRID L6 CHONDRITE (FALL 1896): ESEM-CATHODOLUMINESCENCE SURVEY. O. Azumendi1,L. Tormo2, J. Ruiz1, J. Garcia-Guinea2, 1Departamento de Geodinamica, Universidad Complutense de Madrid. Ma-drid 28040 Spain. [email protected], 2Museo Nacional Ciencias Naturales. CSIC. 28006 Madrid. Spain. [email protected]
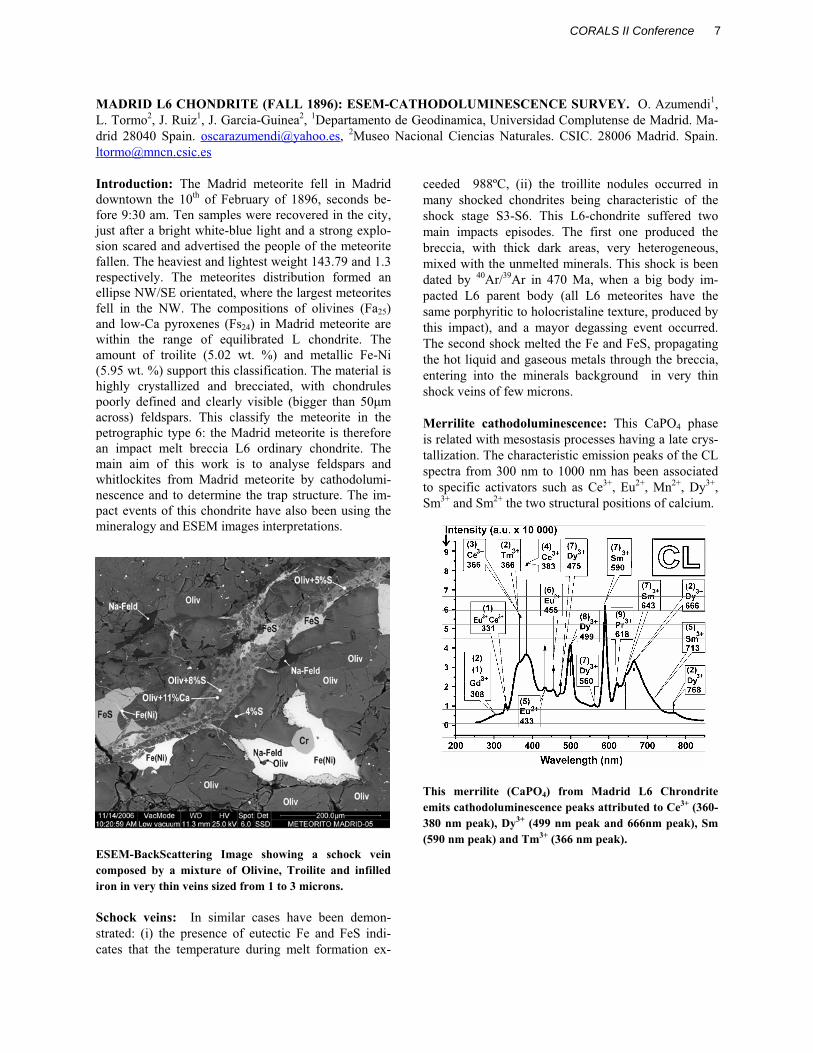
Introduction: The Madrid meteorite fell in Madrid downtown the 10th of February of 1896, seconds be-fore 9:30 am. Ten samples were recovered in the city, just after a bright white-blue light and a strong explo-sion scared and advertised the people of the meteorite fallen. The heaviest and lightest weight 143.79 and 1.3 respectively. The meteorites distribution formed an ellipse NW/SE orientated, where the largest meteorites fell in the NW. The compositions of olivines (Fa25)and low-Ca pyroxenes (Fs24) in Madrid meteorite are within the range of equilibrated L chondrite. The amount of troilite (5.02 wt. %) and metallic Fe-Ni (5.95 wt. %) support this classification. The material is highly crystallized and brecciated, with chondrules poorly defined and clearly visible (bigger than 50μm across) feldspars. This classify the meteorite in the petrographic type 6: the Madrid meteorite is therefore an impact melt breccia L6 ordinary chondrite. The main aim of this work is to analyse feldspars and whitlockites from Madrid meteorite by cathodolumi-nescence and to determine the trap structure. The im-pact events of this chondrite have also been using the mineralogy and ESEM images interpretations.
ESEM-BackScattering Image showing a schock vein composed by a mixture of Olivine, Troilite and infilled iron in very thin veins sized from 1 to 3 microns.
Schock veins: In similar cases have been demon-strated: (i) the presence of eutectic Fe and FeS indi-cates that the temperature during melt formation ex-
ceeded 988ºC, (ii) the troillite nodules occurred in many shocked chondrites being characteristic of the shock stage S3-S6. This L6-chondrite suffered two main impacts episodes. The first one produced the breccia, with thick dark areas, very heterogeneous, mixed with the unmelted minerals. This shock is been dated by 40Ar/39Ar in 470 Ma, when a big body im-pacted L6 parent body (all L6 meteorites have the same porphyritic to holocristaline texture, produced by this impact), and a mayor degassing event occurred. The second shock melted the Fe and FeS, propagating the hot liquid and gaseous metals through the breccia, entering into the minerals background in very thin shock veins of few microns.
Merrilite cathodoluminescence: This CaPO4 phase is related with mesostasis processes having a late crys-tallization. The characteristic emission peaks of the CL spectra from 300 nm to 1000 nm has been associated to specific activators such as Ce3+, Eu2+, Mn2+, Dy3+,Sm3+ and Sm2+ the two structural positions of calcium.
This merrilite (CaPO4) from Madrid L6 Chrondrite emits cathodoluminescence peaks attributed to Ce3+ (360-380 nm peak), Dy3+ (499 nm peak and 666nm peak), Sm (590 nm peak) and Tm3+ (366 nm peak).
7CORALS II Conference
RAMAN SPECTROSCOPY IN CORALS AND PEARLS. Laura Bergamonti, Danilo Bersani and Pier PaoloLottici, Physics Department, University of Parma, Viale G.P. Usberti 7/a, 43124 Parma, Italy.email: [email protected]
Introduction: Corals and pearls are organic gem material used for ornamental purposes. Apart from black and gold corals, formed by hornlike organic mat-ter, red to pink corals and pearls consist mainly of cal-cium carbonate in calcite or aragonite forms. The for-mation and nature of calcium carbonate have been largely investigated by means of Raman spectroscopy [1], [2], [3]. Raman scattering may be helpful to distin-guish between coral and pearl species through the iden-tification of their calcite or aragonite structure, or dif-ferences in the pigments.
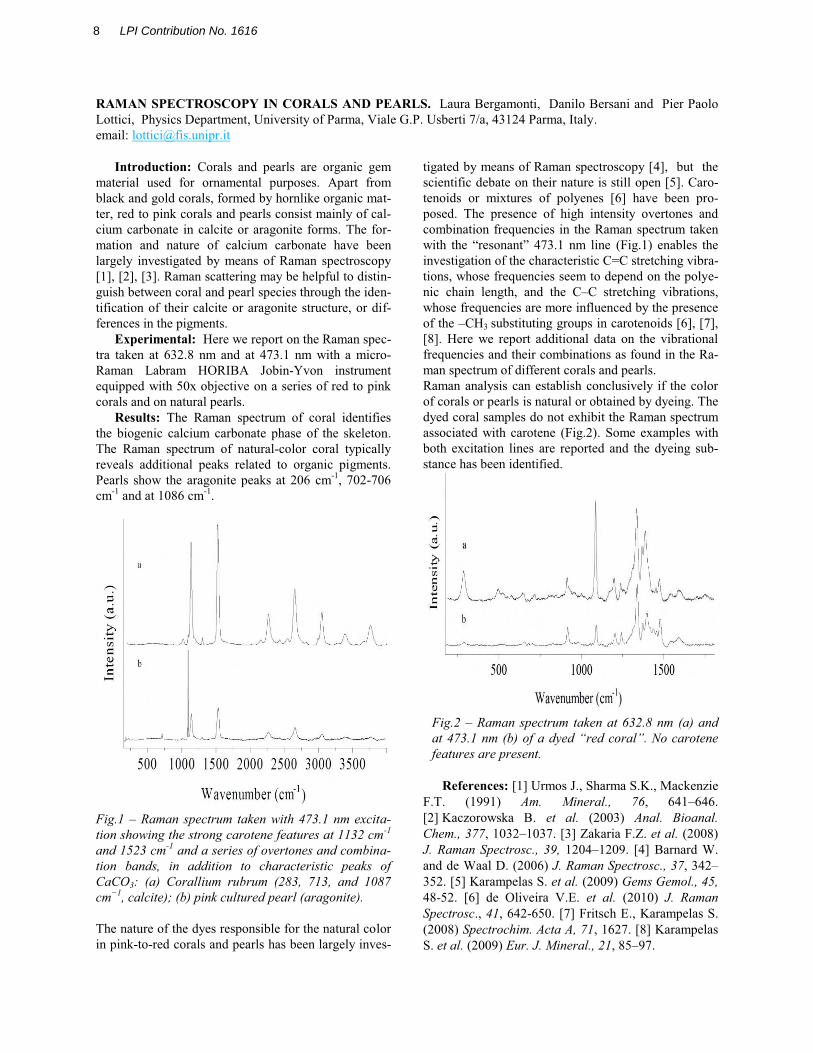
Experimental: Here we report on the Raman spec-tra taken at 632.8 nm and at 473.1 nm with a micro-Raman Labram HORIBA Jobin-Yvon instrument equipped with 50x objective on a series of red to pink corals and on natural pearls.
Results: The Raman spectrum of coral identifies the biogenic calcium carbonate phase of the skeleton.The Raman spectrum of natural-color coral typically reveals additional peaks related to organic pigments.Pearls show the aragonite peaks at 206 cm-1, 702-706cm-1 and at 1086 cm-1.
Fig.1 Raman spectrum taken with 473.1 nm excita-tion showing the strong carotene features at 1132 cm-1
and 1523 cm-1 and a series of overtones and combina-tion bands, in addition to characteristic peaks of CaCO3: (a) Corallium rubrum (283, 713, and 1087 cm 1, calcite); (b) pink cultured pearl (aragonite).
The nature of the dyes responsible for the natural color in pink-to-red corals and pearls has been largely inves-
tigated by means of Raman spectroscopy [4], but the scientific debate on their nature is still open [5]. Caro-tenoids or mixtures of polyenes [6] have been pro-posed. The presence of high intensity overtones and combination frequencies in the Raman spectrum taken
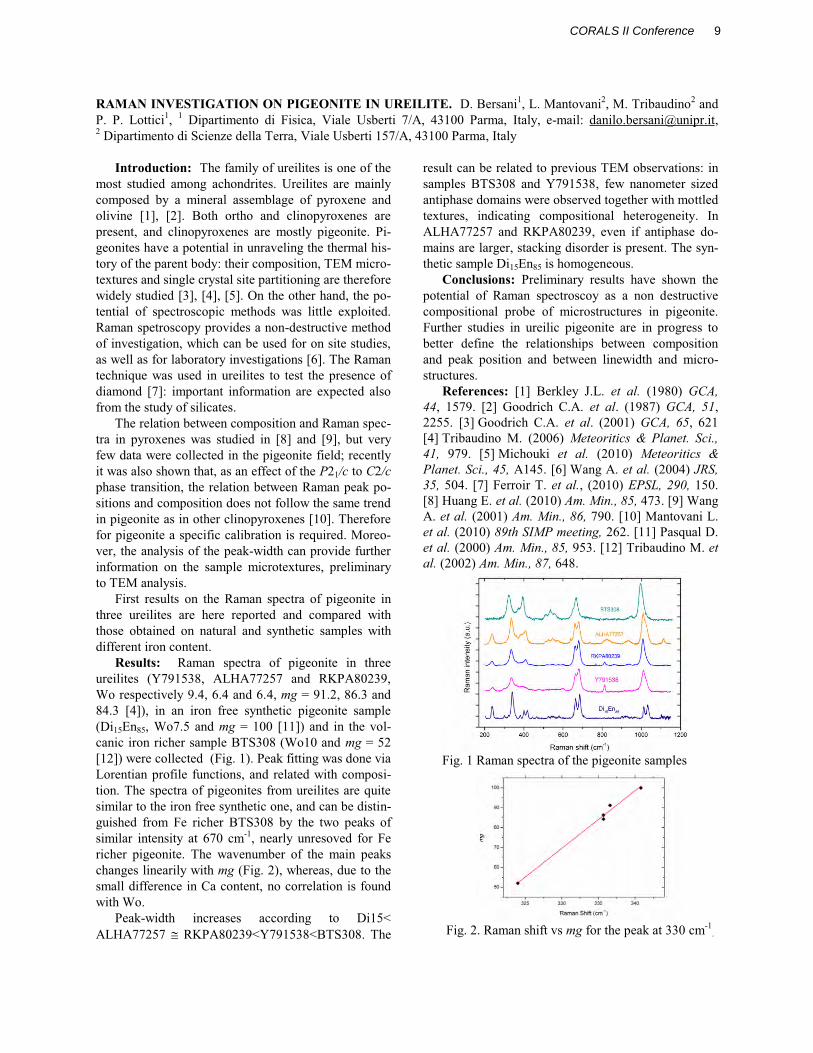
(Fig.1) enables the investigation of the characteristic C=C stretching vibra-tions, whose frequencies seem to depend on the polye-nic chain length, and the C C stretching vibrations, whose frequencies are more influenced by the presence of the CH3 substituting groups in carotenoids [6], [7],[8]. Here we report additional data on the vibrational frequencies and their combinations as found in the Ra-man spectrum of different corals and pearls.Raman analysis can establish conclusively if the color of corals or pearls is natural or obtained by dyeing. The dyed coral samples do not exhibit the Raman spectrum associated with carotene (Fig.2). Some examples with both excitation lines are reported and the dyeing sub-stance has been identified.
Fig.2 Raman spectrum taken at 632.8 nm (a) and at 473.1 nm (b) of a red coralfeatures are present.
References: [1] Urmos J., Sharma S.K., MackenzieF.T. (1991) Am. Mineral., 76, 641 646.[2] Kaczorowska B. et al. (2003) Anal. Bioanal.Chem., 377, 1032 1037. [3] Zakaria F.Z. et al. (2008) J. Raman Spectrosc., 39, 1204 1209. [4] Barnard W.and de Waal D. (2006) J. Raman Spectrosc., 37, 342352. [5] Karampelas S. et al. (2009) Gems Gemol., 45,48-52. [6] de Oliveira V.E. et al. (2010) J. Raman Spectrosc., 41, 642-650. [7] Fritsch E., Karampelas S.(2008) Spectrochim. Acta A, 71, 1627. [8] Karampelas S. et al. (2009) Eur. J. Mineral., 21, 85 97.
8 LPI Contribution No. 1616
RAMAN INVESTIGATION ON PIGEONITE IN UREILITE. D. Bersani1, L. Mantovani2, M. Tribaudino2 and P. P. Lottici1, 1 Dipartimento di Fisica, Viale Usberti 7/A, 43100 Parma, Italy, e-mail: [email protected],2 Dipartimento di Scienze della Terra, Viale Usberti 157/A, 43100 Parma, Italy
Introduction: The family of ureilites is one of the most studied among achondrites. Ureilites are mainly composed by a mineral assemblage of pyroxene and olivine [1], [2]. Both ortho and clinopyroxenes are present, and clinopyroxenes are mostly pigeonite. Pi-geonites have a potential in unraveling the thermal his-tory of the parent body: their composition, TEM micro-textures and single crystal site partitioning are thereforewidely studied [3], [4], [5]. On the other hand, the po-tential of spectroscopic methods was little exploited. Raman spetroscopy provides a non-destructive method of investigation, which can be used for on site studies, as well as for laboratory investigations [6]. The Raman technique was used in ureilites to test the presence of diamond [7]: important information are expected also from the study of silicates.
The relation between composition and Raman spec-tra in pyroxenes was studied in [8] and [9], but very few data were collected in the pigeonite field; recently it was also shown that, as an effect of the P21/c to C2/cphase transition, the relation between Raman peak po-sitions and composition does not follow the same trend in pigeonite as in other clinopyroxenes [10]. Thereforefor pigeonite a specific calibration is required. Moreo-ver, the analysis of the peak-width can provide furtherinformation on the sample microtextures, preliminary to TEM analysis.
First results on the Raman spectra of pigeonite in three ureilites are here reported and compared with those obtained on natural and synthetic samples withdifferent iron content.
Results: Raman spectra of pigeonite in three ureilites (Y791538, ALHA77257 and RKPA80239, Wo respectively 9.4, 6.4 and 6.4, mg = 91.2, 86.3 and 84.3 [4]), in an iron free synthetic pigeonite sample (Di15En85, Wo7.5 and mg = 100 [11]) and in the vol-canic iron richer sample BTS308 (Wo10 and mg = 52[12]) were collected (Fig. 1). Peak fitting was done via Lorentian profile functions, and related with composi-tion. The spectra of pigeonites from ureilites are quite similar to the iron free synthetic one, and can be distin-guished from Fe richer BTS308 by the two peaks of similar intensity at 670 cm-1, nearly unresoved for Fericher pigeonite. The wavenumber of the main peaks changes linearily with mg (Fig. 2), whereas, due to the small difference in Ca content, no correlation is foundwith Wo.
Peak-width increases according to Di15<ALHA77257 RKPA80239<Y791538<BTS308. The
result can be related to previous TEM observations: insamples BTS308 and Y791538, few nanometer sized antiphase domains were observed together with mottledtextures, indicating compositional heterogeneity. InALHA77257 and RKPA80239, even if antiphase do-mains are larger, stacking disorder is present. The syn-thetic sample Di15En85 is homogeneous.
Conclusions: Preliminary results have shown the potential of Raman spectroscoy as a non destructive compositional probe of microstructures in pigeonite. Further studies in ureilic pigeonite are in progress to better define the relationships between compositionand peak position and between linewidth and micro-structures.
References: [1] Berkley J.L. et al. (1980) GCA,44, 1579. [2] Goodrich C.A. et al. (1987) GCA, 51,2255. [3] Goodrich C.A. et al. (2001) GCA, 65, 621[4] Tribaudino M. (2006) Meteoritics & Planet. Sci., 41, 979. [5] Michouki et al. (2010) Meteoritics & Planet. Sci., 45, A145. [6] Wang A. et al. (2004) JRS, 35, 504. [7] Ferroir T. et al., (2010) EPSL, 290, 150. [8] Huang E. et al. (2010) Am. Min., 85, 473. [9] Wang A. et al. (2001) Am. Min., 86, 790. [10] Mantovani L. et al. (2010) 89th SIMP meeting, 262. [11] Pasqual D. et al. (2000) Am. Min., 85, 953. [12] Tribaudino M. etal. (2002) Am. Min., 87, 648.
Fig. 1 Raman spectra of the pigeonite samples
Fig. 2. Raman shift vs mg for the peak at 330 cm-1.
9CORALS II Conference

IN SITU PLANETARY MINERALOGY USING SIMULTANEOUS TIME RESOLVED FLUORESCENCE AND RAMAN SPECTROSCOPY. J. Blacksberg1 and G.R. Rossman2, 1Jet Propulsion Laboratory, California Institute of Technology, 4800 Oak Grove Dr., Pasadena, CA 91109, [email protected], 2California Institute of Technology, Division of Geological and Planetary Sciences, Pasadena, California 91125, [email protected]
Introduction: Micro-Raman spectroscopy is one of the primary methods of mineralogical analysis in the laboratory, and more recently in the field. Because of its versatility and ability to interrogate rocks in their natural form (Figure 1), it is one of the frontrunners for the next generation of in situ instruments designed to explore adiverse set of solar system bodies (e.g. Mars, Venus, the Moon, and other primitive bodies such as asteroids and the Martian moons Phobos and Deimos), as well as for pre-selection of rock and soil samples for cache and return missions.
Fluorescence spectroscopy offers complementary information revealing the many impurity and defect states present in minerals[1]. For a typical continuous wave (CW) green Raman measurement, fluorescence is viewed as a nuisance and is often so strong that the weaker Raman signal cannot be distinguished above the background. We discuss the use of time resolution to obtain Raman spectra under even the most extreme fluorescence conditions [2]. Since Raman occurs in-stantaneously, and fluorescence decay times vary, it is possible to separate them using time resolution (Figure 2). In addition to obtaining fluorescence-free Raman, we can distinguish the fluorescence spectra as well as any other time-dependent phenomena that may be present such laser induced breakdown spectroscopy (LIBS) when performed under appropriate conditions.
Time Resolved Spectroscopy for Planetary mi-neralogy: Raman spectroscopy is under consideration for a host of landed planetary missions aimed at defini-tive mineralogical studies. For example on Mars, evi-dence for an early water rich history is supported by the probable presence of altered minerals such as goe-thite, jarosite, Fe-, Mg-,and Ca- sulfates, hydrated sul-fates (e.g., kieserite), phyllosilicates (e.g., clays), and Fe-, Mg-, and Ca- carbonates [3]. Because many of these altered minerals are known to exhibit strong flu-orescence, the use of time resolution would be ex-pected to significantly improve the number of success-ful measurements on Mars. We demonstrate this
Figure 2. Streak Camera Image taken on a natural calcitesample with short lifetime fluorescence. The Raman spectrum is distinguishable during the laser pulse, and the fluorescence lifetime is ~ 8 ns.
technique using a green pulsed miniature microchip laser synchronized with a streak camera. We will dis-cuss spectra obtained on a variety of strongly fluo-rescnt altered minerals, with particular relevance to Mars (e.g. sulfates, phosphates, and clays). For many of these minerals Raman spectra were completely ob-scured by large background fluorescence when using CW Raman. We will conclude with a discussion of the challenges and feasibility of developing an on-surface time resolved spectrometer for planetary exploration.
Acknowledgements: The research described in this publication was carried out at the Jet Propulsion Laboratory, California Institute of Technology, under a contract with the National Aeronautics and Space Ad-ministration. CW Raman measurements were per-formed at the California Institute of Technology, and time-resolved experiments at JPL.
References: [1] M. Gaft et al., Modern Lumines-cence Spectroscopy of Minerals and Materials, Sprin-ger-Verlag, 2005. [2] J. Blacksberg, G. Rossman, and A. Gleckler (2010) Applied Optics, 49 (26), 4951-4962, [3] D.W. Ming et al. (2008) in The Martian Sur-face: Composition, Mineralogy and Physical Proper-ties, J.F. Bell III, ed., 519-540
Figure 1. Image of our pulsed532nm laser focused on a naturalmineral sample without prior sample preparation. The Raman andfluorescence spectra are collectedand sent to the spectrometerthrough the same objective lens.
10 LPI Contribution No. 1616

����������� ����� ����� ���� ��� �� � �������� ���� �� ���� ����������������� ����������� ���������������� ���� �������� �� ��������������������� ����������������� ����� �!��"�������! ��"�#��$!��%�����%�!�� � �� &��%!��"��'�%!�(����)���*+'�&��&��+�!!�,-��"��'!"�����../0��"!�"���1�������1!%���%��"��2�)���� )������� ��%"�"��2�)�����3��4�!��""�&��1�%�������.050��"!�"���1����6(����7�(���%��������8�
������� !�"��#�&!(��%��� 9�!���� ��1�!%�%�����
�!��!��1�9�!��%!�(������:���������%�"�����������%��;� 6 8����"�!��%;��!� ��"�!��%;�(�� %��� !���%��9�����!�(�� ��%(���� 1!��������� 6�8� !�� 4�!;� ������� ���<!%�=���������� !���!"���"�6>8���� !���4��&�9!���%��� 1��%!;� (������������ �;���� &��%�� 6&&#>8��"�"����%��?&��6&#>8�@�!��%���%A�����%�(��"�%��!(��%�� ����!�� ��� <!%��� +���� ��� ������%��%� A�%���B���(!���� %��!��";����� �����"�!%����� 9�!� %�����4�!�����%� ���"�%�������"�!�A��������%� ��"�����%!;��!(��%������!��9�!���"�1�!���%�? @���
���%���1!����%��%�";��A��9��������%���(��%���9�!��%���� �9� �!(��%��� �"� A�� ���A� %�%� 2��� ��� � ���"�%���%����%���A�������%��(��%�%���!�����������9�9�!��%�����#�!� 9��"����� � !�� �9� 9��"���%� ��1�!%����9�!���"�!�%�"������"�!����4�!�����%�����A������!�(��%�� ����!�� 9�!�� �� � A��"�A� ��%�� %��� ��������1�%�� �"� ��� �C1��� ��A� %���!� 9�!�%���� ��� 99��%�%���(�������������;�����9��%��!�1��%���D���!���
�$�%�"$&' $�� �%�(��'# ���%�%�� A�!�� 1�!�����"� 9!��� �����'"!����� ���� �1��%!� A�!�� �C���%�"�A�%���/>����������9������"���!�%�1�A�!��00��E��'9%�!�1�������������!��%�!�6F�!�(���(��G�4���F��� //08� %��� ��%%�!�"� ���%�A�� "�%��%�"�A�%�� �&&��������������� �� ���������������� ������� � 9���%;� �9� &��%!�� "�� '�%!�(������ 6�"!�"���1��8�� �"� ������%�� �9� � �%������ �%��� ����� 1!����!�������%��������%!��%��1�!%�!���;�%����"�9��!�1�!%��9�!��D����"�99�!��%�H�����%�I��;������
�%' &�'#&!(��%���;�%���������(��1�!9�!��"�������� %A��A;��� �!�%�� 9�!�%���� �9� �&#>� 9!��� (��!�(��%��6<B� 8��"������"��9!���&#�6�8��A����������������(����"� %�� &#�6B8� 6<B��8� �"� 1!�%��%�"� 6<B�>8����!��%�A�%��9!�����J�%����4���&#>�6<B��58���
�6:�J�*F&#>K�&#>6�8J&#�6�8J�6:�6 8�&#��6�8�J�F�#�K�&#��6B8�����������������6�8�&#��6B8�J�F�#�K�F�&#>������������������6>8�
F�&#>�J��6:��K��&#>�6�8�J�F������658�A��!���������&������ �����������":�!��!��+�����!��%�����!����4�!��"�(;� %���������%!%�����9���J����%��� ��"���� �"� ��4�!� 1!��%�!�� ����� �� 1!����!��6$8�� %��1�!%�!�� 6+8�� ������ �%!���%�� �"� 1F�� +��� 9�!�%���%��"� ��� (�� �%�"��"� ����!���� %��� "��!������ ���������%!%�����9�%���(��!(��%�������A����%��������"����� ��� (�� �;��"� (;� ����!���� %��� ���(��%;� �9�&#��6<B���8�6*�%��%�%�%���<B�������%������%�����%�1����%��� �����"� ��%��"8�� E�� �������%� 2��� �� � %��� %���;���%���D���%����9�%�����!��%������
���� � ���� ��� ������� +��� 4�(!%���� �1��%!�
6%%���� �"� ��%�!����"��8� �9� �;"!������!(��%�� ���B���������%����A�!���!!��"���%��4�!��A�"��!�����9�������%!%����� 60�0 �0� �8�� %D���� ��%�� �����%� %���������%!%���� �9� &#>
��� 9�!��"� (;� �%�1!�%�;���� �9�
F&#>���+���F&#>
���"�&#>����%�4�%��������������%����
A�!�� "�%�!����"� ������ %��� ��9%A!�� $F�<<2&� ?�@��+��� !�%������1� (�%A���� %��� ���%�"� F&#>
�� �"�&#>
��� �%�4�%����� �"� %��� !�%�4�� !�� �9� %������%� ���%�����(�"�����%��������1��%!��A�����%�����%��%��� �%�4�%;� �9� F&#>
�� %� �;� %���� ��� %��� <B�� �� �"��%��!�9�!��%�������%��9��&#>�9�!��"����9���%�����9�%�����+��$��"�1F��
���� � ���������� !"L�E��1�!9�!��"���;�%���%����%�";��9�%���B������&#�����1�!��A%�!�6<B�� 8�%�"�99�!��%� +� �"� $� (;� ���������� �1��%!����1;�� +���4�(!%�����1��%!��9�%������A%�!���C%�!��%��B���(�!����A�!��1�!9�!��"�%���!%������"�%������9�+��"�$�9!��� A����� %��� ���(��%;� �9� &#�� ��� A%�!� ��� A��D��A�� +��� �C��%����� �9� �� ���(��%��� 1���%� ��� A%�!��A����!��������%����(%���"��1��%!�%�"�99�!��%�1�;���� ���"�%������ E�� �(%���"� � ��(!%���� ��!4��9�!�%���&#�6B8�(��"����%���!�%�4������!���9�%���"����%��1�D��9� %����1��%!��"� %��� %���!�%�������(��%;� �9�&#�� %� ���� ���"�%����� !��� %���� ��(!%������!4����%����1����(��%�����%��%�������%��9�&#�6B8�"�!����%���9�!�%����1!������6<B���8���"������B���%;�%��� ����%� �9� �&#>� 1!���1�%%�"� %� "�99�!��%� ���"��%������9�+��$��"��������%!���%����
+���� �%�";� �����1� %�� �!�9;� 1!"����� 9!��� %����!;� <!%�� �"��!�� ��4�!�����%���E�� ����%�� %���9�!�%���� ���"�%����� �9� ����� �����%� �!(��%��� ��������L�8�%���%���1��!�����%���������������%!%������� &#�� "�!����F"���'!������ %��!�9�!�� A�� ���� %��������"���%��"�6<B�����>��"�58�%��+�M�0N&��"�$��1�%��>00(!O�(8�%��!��A�!���������(������!�����"�!����$!�%�!������� ��� 9�!� %���� ��� A�� A�� �%�";� %��� 9�!�%��;�%��������%��"� 6<B�� 8� %� P0N&� �"�$� �1� %�� /0(!��!)��*&%�+%,%��'#+����A�!D�A����11�!%�"�(;��'�+'�&#*�#���<�� 6&���00Q�0005/8� �"� 23��'$�<���6��00R:$$2� // 8�1!�,��%����%-%�%�!%'#�? @���!����"���S������6 RR08�T��������%;��9���"����%!;��!(��%������4��1���%�������"����%���;��5.�� <��4��!�� *�A� G�!D�� Q0Q� 11�?�@� $!D���%� �"� '11���6 RRR8L�3��!=�����"��%��$F�<<2&�6���8�U�����1�%�!�1!���!�� 9�!� �1���%����� (%��� !��%����� ����"��������� %!���1�!%���"���4�!����������������%������E%�!������!������4��%��%�������1�!%�RR�5�/R��3�T������4�!��&#��
11CORALS II Conference

SHOCK-INDUCED PHASE TRANSFORMATIONS IN MELT POCKETS WITHIN MARTIAN METEORITE NWA 4468. Suporn Boonsue and John Spray, Planetary and Space Science Centre, University of New Brunswick, NB E3B 5A3, Canada. [email protected], [email protected]
Northwest Africa (NWA) 4468 is 675 g martian mete-orite recovered from the Western Sahara in 2006 [1]. Itis an olivine basaltic shergottite, comprising clinopyrox-ene, olivine, maskelynite, chromite, ilmenite, Ca-phosphate polymorphs, troilite and pyrrhotite. The sam-ple shows both bulk (maskelynite formation) and loca-lized shock effects (excursions in veins and melt pock-ets). There have been several studies of NWA 4468, including geochronology, petrology and bulk composi-tion. The formation of high pressure polymorphs in melt pockets, however, has been only noted. Here we report the presence of high pressure polymorphs in melt pock-ets and their relation to the presence of Ca3(PO4)2 phas-es using Field Emission Scanning Electron Microscopy (FESEM) and micro-Raman Spectroscopy, including Raman mapping (Figures 1, 2 & 3). We have discovered three different CaPO4 polymorphs in the melt pockets, and their crystal structure has been confirmed by Raman analysis [2] [3]. The mineral assemblages of the melt pockets are apatite, merrillite, tuite, Fe-rich clinopyrox-ene, pigeonite, chromite, troilite, stishovite, and hollan-dite in a microcrystalline matrix comprising pyroxene, apatite, merrillite, Fe-Ti-Cr oxide and silica glass. Ring-woodite is developed at the rims of pockets. The mineral assemblages of the melt pockets are indicative of solid state transformations, nucleation and recrystallization at high temperatures and pressures. The stability fields of these minerals are used to infer the pressure and tem-perature conditions reached locally in the melt pockets to 23 GPa, and 2000oC [3] [4].
Figure 1. Intense twin peaks at 959 and 974 cm-1 and less intense peaks at 410, 577, 637 and 1093 cm-1 are characteristic of merrillite ( -apatite) (Xie et al., 2002).
Figure 2. Raman spectrum of tuite ( -apatite) in the pocket displays only one intense peak at 976 cm-1, and less intense peaks at 1095, 410.8, 577, 639 cm-1. The strong peak at 976 cm-1 is induced from symmetrical stretching vibrations of the PO4 group (Xie et al., 2003).
Figure 3. Combined SEM and micro-Raman analysis of a melt pocket and its mineral assemblage (ap- apatite,cpx-clinopyroxene, il-ilmenite, mer-merrillite, ol-olivine, pgn-pigeonite, rwd-ringwoodite, tui-tuite).References:[1] A.J. Irving et al., (2007) LPSC XXXVIII, Abstr.# 1526. [2] Xie, X., Minitti, M.E., Chen, M., Mao, H.K., Wang, D., Shu, J., Fei, Y., (2002) Geochim. Cosmochim. Acta, 66, 2439-2444. [3] X. Xie, , M.E. Minitti, M. Chen, Ho-Kwang Mao, D. Wang, J. Shu and Y. Fei (2003) Eur. J. Mineral. 15, 1001-1005. [4] Beck, P., P. Gillet, L. Gautron, I. Daniel, and A. El Goresy (2004), A Earth Planet. Sci. Lett., 219, 1 –12.
12 LPI Contribution No. 1616

Raman Microscopy of Samples of Martian Analogue Material withCyanobacteria. Ute Bottger1, Jean-Pierre de Vera1, Jorg Fritz2, Iris Weber3, and Heinz-Wilhelm Hubers1,4,1Department of Experimental Planetary Physics, Institute of Planetary Research, German Aerospace Center (DLR
e.V.), Berlin ([email protected]), 2Museum fur Naturkunde, Leibnitz-Institut an der Humboldt Universitat zu
Berlin, Germany, 3 Institute of Planetology, Muenster, Germany, and 4Technische Universitat Berlin, Institut fur Optik
und Atomare Physik, Berlin, Germany
Introduction Raman Laser Spectrometer - RLS -
onboard ExoMars 2018 will perform measurements on
Mars to identify organic compounds and mineral prod-
ucts as an indication of former and recent biological ac-
tivity. The measurements will be performed on crushed
powdered samples inside the Rover’s ALD (Analytical
Laboratory Drawer). The objective of the presented in-
vestigation is to analyze the influence of the crushing
process on the Raman spectra. This is done by compar-
ing Raman spectra of polished solid samples with those
of crushed samples. The second objective is to study Ra-
man spectra of crushed samples with cyanobacteria in re-
gard to the discrimination of the cyanobacteria from the
mineral background. Appropriate measurement parame-
ters (e.g. integration time and number of repetitions) for
the determination of the mineral composition as well as
the detection of biological material are derived. A mea-
surement regime is proposed for mineral mixtures with
cyanobacteria on the basis of the RLS instrument charac-
teristics. Sample Choice and Preparation Orbital ob-
servations showed that in general the phyllosilicate de-
posits do not occur together with the sulphate deposits
[1]. Thus the Mars simulant mineral mixture is assigned
to phyllosilicatic and sulfatic Mars regolith. The miner-
als and rocks are chosen to be structurally and chemically
similar to those identified in Martian meteorites [2] and
on Mars by recent orbiter and rover missions [3], [4].
The Martian analogue rocks and minerals are crushed
and only fragments smaller than 1 mm are used for the
mineral mixtures. The powder is pressed with 4.5 MPa
to retrieve pellets with a smooth surface for better sam-
ple handling. Cyanobacteria are chosen as candidates for
potential life on Mars. Experimental Setup The Raman
measurements are performed with a confocal Raman mi-
croscope Witec alpha300 R system at room temperature
under air at ambient pressure. The Raman laser excita-
tion wavelength is 532 nm. The spectral resolution of
the spectrometer is 4-5 cm−1. A Nikon 10x objective is
used. The spot size on the sample is in focus about 1.5
μm. The laser power of 1 mW on the sample is chosen.
This value is proposed for the RLS instrument on Exo-
Mars. Values of integration time are taken between 1 s
and 100 s per measurement and 1 to 100 measurement
repetitions at one point on the sample. First, measure-
ments are carried out on the polished solid samples. Then
measurements are performed on each Martian analogue
powder sample without bacteria and on pure cyanobac-
teria seperately. Third, measurements are made on the
pellets with cyanobacteria. Results and Summary The
Raman spectrum of cyanobacteria is influenced by the
Raman signal of the mineral background. If cyanobacte-
ria are present, β - carotene is the dominant feature in the
spectrum. To get optimal spectra of the mineral mixtures
of phyllosilicatic and sulfatic Mars and the cyanobac-
teria the integration time needs to be adjusted. Only
short measurement time should be used to avoid satu-
ration of the spectrum of β - carotene. If cyanobacte-
ria are not present, a longer integration time can be ap-
plied, which is necessary to identify the different min-
eral constituents of the sample. To propose a measure-
ment regime for mineral mixtures with cyanobacteria the
procedure should start with a measurement time of only
a few seconds. In a next step the time and the number
of repetitions need to be increased until acceptable spec-
tra of minerals are obtained. For a laser power on the
sample of 1 mW the measurement time should be se-
lected between 1 s (for cyanobacteria) and 20 s (for min-
erals). Acknowledgement This research has partly been
supported by the Helmholtz Association through the re-
search alliance ”Planetary Evolution and Life”.
References
[1] F. Poulet, J-P. Bibring, J. F. Mustard,
A. Gendrin, N. Mangold, Y. Langevin, R. E.
Arvidso, B. Gondet, and C. Gomez. Phyllosilicates
on Mars and implications for early martian climate.
Nature, 438:623–627, 2005. [2] H. Y. Jr. McSween.
What have we learned about Mars from the SNC
meteorites. Meteoritics, 29:757–779, 1994. [3] J-P.
Bibring, Y. Langevin, A. Gendrin, B. Gondet,
F. Poulet, M. Berth, A. Soufflot, R. Arvidson,
N. Mangold, J. Mustard, P. Drossart, and the
OMEGA team. Mars surface diversity as revealed
by the OMEGA/Mars express observations.
Science, 307:1576–1581, 2005. [4] V. Chevrier and
P.E. Math. Mineralogy and evolution of the surface
of Mars: A review. Planetary and Space Science,
55:289–314, 2007.
13CORALS II Conference

Micro Raman spectroscopic investigations of the nature and provenance of carbonaceous material in micro-
fossil bearing rocks: redefining D and G carbon band parameters for the detection of biosignatures. D. M. Bower1, A.Steele1 , M.D. Fries2 and L. Kater3, 1Geophysical Laboratory, Carnegie Institution of Washington, 5251 Broad Branch Rd, NW, Washington, DC, 20015, [email protected], 2Planetary Science Institute, Tucson, AZ 85719, 3WITec GmbH, Ulm, Germany.
Introduction: The identification of biosignatures and detection of extra planetary life is one of the pri-mary goals in astrobiology. Intrinsic to this goal is the improvement of analytical techniques and protocols used to identify biosignatures. Micro Raman spectros-copy is a non-destructive method that allows for in situ analysis of samples and unambiguous identification of a wide range of minerals and compounds. One of the biggest controversies using this technique, however, is in the use of D (~1350 cm-1) and G (~1580 cm-1) band parameters to determine the biogenicity of carbona-ceous materials in ancient rocks [4,6,7]. Not only do carbonaceous compounds from different sources often share the same spectroscopic characteristics, but the absolute nature of the D band is still unclear [1,2,9,10].To elucidate biogenicity, young samples of known provenance are typically analyzed and used as a base-line for comparison to much older samples or samples that have experienced extreme temperatures and pres-sures. To this ends we used the high-resolution imag-ing and geochemical mapping capabilities of micro Raman spectroscopy to investigate the nature and provenance of the mineral and carbonaceous materialin samples from the 400 Ma Rhynie chert, 570 Ma Duosnato phophorite, 1.9 Ga Gunflint chert, 2.7 Ga Tumbiana carbonate, and the 3.5 Strelley Pool and Apex cherts. The wide array of morphological micro-structures, carbonaceous components, and mineral assemblages in these samples provide the perfect test-ing ground for these techniques [5, 7, 8]. To further constrain D and G band carbon characteristics, micro Raman analyses were also performed on a suite of well-characterized carbonaceous meteorites. The spec-tral features of each sample set were quantified and compared. The results give much needed information for biosignature identification in these and other bio-logically significant rocks. Method: Raman spectra of the samples were col-lected using a WITEC Digital Pulse scanning near-field optical microscope (AlphaSNOM) with Scan Control Spectroscopy Plus. The Raman scans were conducted with a a frequency-doubled 532 nm YAGlaser with. The laser was focused through a 25μm di-ameter fiber and a 100x objective lens. The scan speed was 3-5s dwell time per pixel at 30 kW cm-2. Images and virtual maps of the spatial elemental and mineral composition of the microtextures were generated using Witec Project 1.99 software. The collected spectra
were deconvoluted and quantified using ACD Labs 12 software.
Results: Comparisons of the Raman data from the microfossils and meteorites studied here show that G and D band parameters for both sample sets overlap,making it difficult to assign a biologic or abiolgic source for the carbonaceous material. The results of one G-band parameter comparison, however, provide a way to confirm the degree of thermal alteration of the carbonaceous matter in geologic samples. Raman spec-tral maps for each sample also show a wide range of microstructural features and minerals associated with the carbonaceous material.
Conclusions: While the unique mapping capabili-ties of micro Raman spectroscopy provide a greater view of the spatial relationships between carbonaceous materials and other features in ancient rocks, the D and G band characteristics of the carbonaceous material found in biologically associated structures are similar to those of abiologic origin. Careful analysis and de-convolution of the carbon D and G band parameters should be undertaken in any study involving the ori-gins of carbonaceous meterials. In addition, it is neces-sary to explore the spatial relationships and spectral characteristics to establish biosignatures for life detec-tion in ancient rocks on Earth and of those on other planets.
Acknowledgments: This work is funded by the NASA Postdoctoral Program, NAI.
References: [1] Beyssac O., Goffe B., Petitet J.-P., Froigneux E., Moreau M., Rouzaud J. -N. (2003) Spec-trochimica Acta Part A, 59, 2267–2276. [2] Brasier M.D., Green O.R., Lindsay J.F., McLoughlin N., Steele A., Stoakes C. (2005) Precambrian Research, 140(1-2), 55-102. [3] DeGregorio B. T, Sharp T.G., Flynn G.J., Wirick S., Hervig R.L. (2009) Geology, 37,631-634. [4] Javaux E.J., Marshall C.P., Bekker, A. (2010) Nature 463, 934-938. [5] Kudryavsvev A. B.,Schopf J.W., Agresti D.G., Wdowiak T.J. (2001) PNAS, 98, 823–826. [6] Marshall C.P., Edwards H.G.M., Jehlicka J (2010) Astrobiology, 10(2), 229-243. [7] Schelbe R.T., Westall F., Allen C.C. (2004) Advances in Space Research, 33, 1268–1273. [8] Schweizer M. (2008) PhD Thesis. [9] Steele A., Fries M.D., Amundsen H.E.F., Mysen B.O., Fogel M.L., Schweizer M., Boctor N.Z. (2008) Meteorics Planet. Sci., 42, 1549–1566. [10] Tazaki K., Ferris F.G., Wiese R.G., Fyfe W.S. (1992) Chemical Geol-ogy, 95, 313–325.
14 LPI Contribution No. 1616

TRAPPED HIGH DENSITY FLUIDS AND MELTS IN SUPERDEEP DIAMONDS. F. E. Brenker1, S. Schmitz1, L. Vincze2, B. Vekemans2, M. Krebs1, W. De Nolf3, K. Janssens3, T. Stachel4, J. Harris1,5
1Geosciences Institute, Goethe University, Frankfurt/M., Germany, 2Department of Analytical chemistry, Ghent Uni-versity, Belgium, 3Centre for Micro- and Trace Analysis - Department of Chemistry, Antwerp University, Belgium, 4Department of Earth and Atmospheric Sciences, University of Alberta, Edmonton, Canada, 5Division of Earth Sci-ences, University of Glasgow, Scotland, UK, ([email protected]).
Introduction: Diamonds from the transition zone and the lower mantle have attracted considerable atten-tion in recent years [1-6]. Compared to the majority of diamonds worldwide derived from lithospheric and sub-lithospheric sources, these rare samples provide exceptional insights into the chemistry and dynamics of the deepest accessible parts of the Earth. Several oc-currences of such “ultra-deep” diamonds have been reported and studied intensively in terms of their chem-ical characteristics and mineral paragenesis [1-7]. Sev-eral aspects, e.g. the C-isotopic composition of the diamond host or Eu-anomalies of pyroxene (former perovskite) inclusions, link to a subduction related ori-gin for several of these ultra-deep inclusions [1-2,6].
Although diamonds and their inclusions may probe the deep Earth only locally they are the only direct source of information available and any finding pro-vides information on the physical conditions (pressure, temperature, composition, oxygen fugacity) of their source region. In addition a minimum size of each chemical heterogeneity is expected because tempera-ture is reasonable high in the deep mantle and the time-scales of subduction, storage, capture and exhumation exceed tens to hundreds of millions years. Homogeni-sation is even faster within the transition zone, where the resistance time (time before complete assimilation) of a ~1m sized object is calculated to be limited to ~1 million years [8].
The diamonds investigated in this study were mined from alluvial deposits in the Juina area of south west-ern Brazil. It is shown that these diamonds contain ab-undant inclusions derived from sources extending from the deep asthenosphere into the lower mantle [4,5].
Methods: In the present work, the inclusions were studied in situ (inside the unbroken diamond) by the means of confocal Raman spectroscopy, confocal mi-cro x-ray fluorescence [9-11] and micro x-ray diffrac-tion. These techniques allow the investigation of the structure and chemical composition of even very tiny inclusions (< 5 m) with the only sample preparation being the polishing of a window close to the inclusions in the diamond in order to reduce light and x-ray ab-sorption/scattering effects. Keeping a (reduced) di-amond layer covering the inclusions prevents the trapped phases from any contamination and allows better distinction between their syn- and epigenetic origin, which was essential for the present study.
Results: Of special interest was a large Kankan di-amond containing many Ca-Si-O rich inclusions (KK200). Investigations applying Raman spectroscopy yield CaSiO3 walstromite, CaSi2O5 titanite and larnite (beta-Ca2SiO4) as inclusion paragenesis. The varying proportions of the respected phases indicate a depth of origin within the two phase field of larnite + CaSi2O5titanite between 300 and 360km [3].
Detailed trace element tomography of several cubo-octahedral inclusions indicate a Ca,Si-rich source, in the absence of several common mantle minerals, like olivine, garnet and Ca-poor pyroxene. This reservoir may represent metasomatized oceanic lithosphere (ro-dingites, ophicarbonates), meta-morphosed carbona-ceous sediments or a trapped carbonatitic melt. In addi-tion investigations on the surrounding narrow fractures around the inclusions show that contrary to our expec-tation the fractures are actually filled with material.The fracture filling shows close similarities in trace element composition to the mineral inclusions, in addi-tion to being generally enriched in REE. The former existence of a fluid or melt is required to transport ma-terial into these elongated fractures. This interpretation is further confirmed by X-ray diffraction measurements which indicate the presence of florencite and La-cerite crystals within the fracture fills.
The most likely interpretation is the entrapment of a volatile component during diamond growth, probably dissolved at high pressure within the solid inclusion phases. During uplift of the diamonds and associated pressure release this volatile content is expelled from the solid inclusion as a fluid and penetrates into the newly forming fractures.
References: [1] Harte, B et al. (1999) vol. 6, Geo-chemical Society, USA, 125-153. [2] Stachel, T. et al. (2000) Contrib. Mineral. Petrol. 140, 16-27. [3] Sta-chel, T. (2001) Eur. J. Mineral. 13, 883-892. [4] Ka-minsky, F. et al. (2001). Contrib. Mineral. Petrol. 140,734-753. [5] Hayman, P. et al. (2005) Contr. Mineral. Petrol. 149, 430-445. [6] Tappert, R. et al. (2005)Geology 33, 565-568. [7] F.E. Brenker, F.E. et al. (2002) EPSL 198, 1-9. [8] Chakraborty, S. et al. (1999)Science 283, 362-365. [9] Brenker, F.E. et al. (2005) EPSL 236, 579-587. [10] Vincze, L. et al. (2004) Ana-lytical Chemistry 76, 6786-6791. [11] Vekemans, B. etal. (2004) JAAS 19, 1302-1308.
15CORALS II Conference

MOGANITE IN THE CHALCEDONY VARIETIES OF CONTINENTAL CHERTS (MIOCENE, MADRID BASIN, SPAIN). M. A. Bustillo1, J. L. Pérez-Jiménez 1,2, A. M. Alonso-Zarza3 and M. Furio1.1Dpto. de Geología. Museo Nacional de Ciencias Naturales, CSIC. c/ José Gutiérrez Abascal, nº2, 28006-Madrid, Spain ([email protected], [email protected] and [email protected])2Current address: Centro Tecnológico de Repsol, 28931-Móstoles, Spain.3Dpto. de Petrología y Geoquímica, Facultad de Geológicas, Universidad Complutense de Madrid, 28040-Madrid, Spain ([email protected]).
Introduction: The Miocene of the Madrid Basin includes relatively frequent cherts and opaline cherts, which show different quartz textures under thin section in optical microscopy. This work discusses the amounts of moganite (in relation to quartz) obtained in different quartz textures (calcedonite, quartzine,lutecite, microcristaline quartz mosaics, etc.), using micro-Raman and optical microscopy.
Thermo Fisher DXR Raman microscope, which has a point-and-shoot Raman capability of 1-resolution was use with laser source at 532 nm. Moganite shows bands at 128, 141, 220, and 502 cm-1,with the latter being the most intense peak. Variations in the moganite/quartz ratio are revealed by theintensity ratios of the main symmetric stretching-bending vibrations of alpha-quartz (465 cm-1) and moganite (502 cm-1) respectively. This method provides a measure of the moganite content and its spatial variation. The data are interpreted in relation to their genesis and the type and environmental setting (shallow lacustrine carbonates, palustrine carbonates, palustrine gypsums and palustrine clays) of the host rock silicified.
The samples are attributed to the Middle Miocene and can be considered of similar age. It allows ruling out variations in the presence of moganite due to its disappearing with time (ageing). All the samples are formed in surficial environments and dolomite or gypsum are present in most of the cases. Optical microscopy shows many quartz textures are interconnected with opal, and in these cases it can be deduced that they formed by recrystallization of the opal (ageing). When opal does not appear, it is interpreted that quartz varieties could were formed directly by replacement of the host rock.
Results: After the realization of 250 analyses, it has been observed that all the varieties of chalcedony(calcedonite, quartzine and lutecite) contain moganite. The qualitative estimations of moganite/quartz (intensity of peak 502 of the moganite divided between intensity of peak 465 of quartz and multiplied by 100) show interesting data. The values in each texture can change very much (e.g. in the lutecite it can change from 26 to 82% or in calcedonite from 32 to 70%). Therefore, every studied chalcedony will be composed of alternating quartz and moganite domains in all three
dimensions, with variable domain sizes. But also these variations can be due to the orientation of the analyzed section. Moganite was always absent in the macrocrystalline and mesocrystalline quartz, and occasionally in some calcedonite cements.
When different chalcedony varieties are found in the same sample, the lutecite shows the highestamounts of moganite (48-59%), followed by calcedonite (36-55%) and quartzine (31-36%). When quartzines are not well formed and show a fibrous or microcrystalline nuclei and a border of elongated and interpenetrated megaquartz/mesoquartz crystals, then moganite only was detected in the nuclei. The opaline zones produce flat spectrums with no peaks, but when microcrystalline mosaic quartz is distinguished in optical microscopy, then moganite is found.
Calcedonite is pervasive in the carbonate sedimentary settings without dolomite or gypsum. The moganite proportion in the chalcedony is variable, with a higher variation in the calcretes (37-77%) and the shallow lacustrine limestones (32-70%) than in the palustrine limestones (25-38%), although these data can only to reflect the orientation of analyzed sections. No discrimination has been possible to make in relation to ageing from opal or cementation in these settings. Length-slow fibrous forms (lutecite and quartzine) are dominant in the palustrine evaporitic and Mg-rich settings (with gypsum and dolomite-magnesic clays respectively). In these settings length-slow fibrous forms have the highest variation in the proportion of moganite (26-82%).
Conclusions: Researchers have proposed that moganite actually is identical to lutecite, and therefore, moganite may prove an important indicator for vanished evaporites. Our results show that all the varities of chalcedony (calcedonite, quartzine and lutecite) can have a composite Raman spectrum of both, quartz and moganite, and it is independent of their genesis by ageing, direct replacement or cementation. The presence of moganite is also independent of the surficial sedimentary setting of the host rocks in which it formed.
Acknowledgments: Financial support was provided by project CGL2008-05584-CO2-01 from the Spanish Ministry of Science and Innovation.
16 LPI Contribution No. 1616
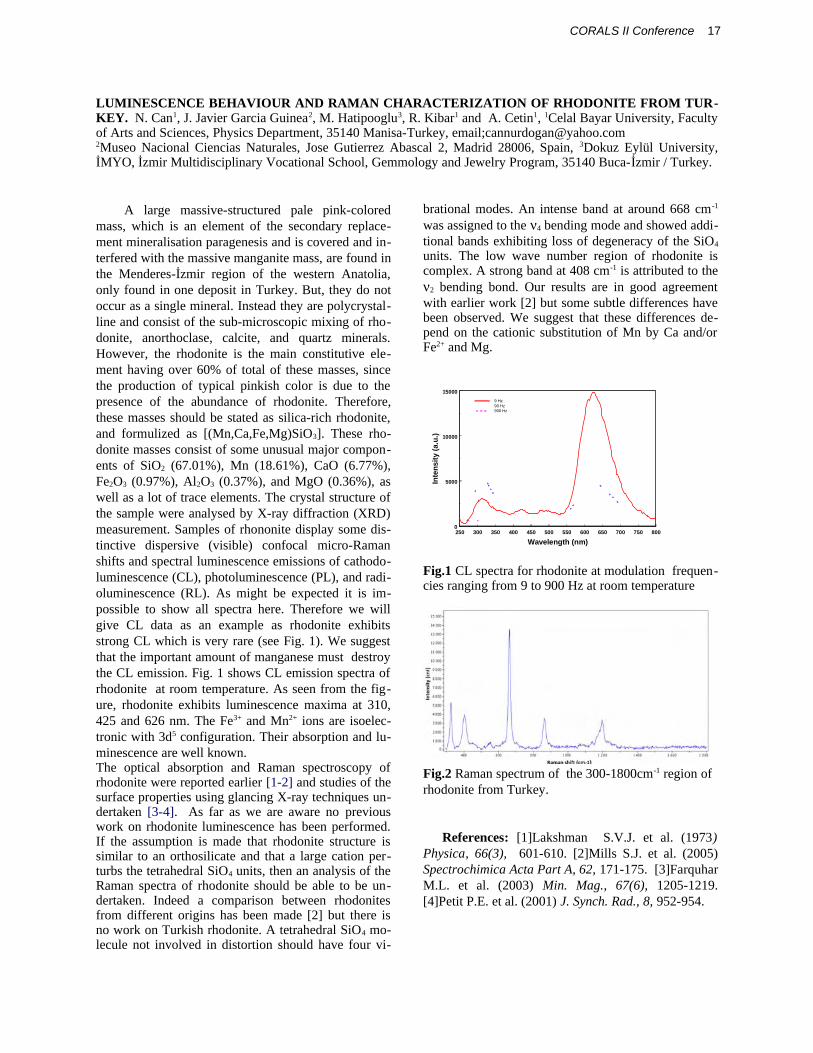
������������� ����� ��� � �� � ����� ������������������������������������������ ������������� ������������������������������������� ������� ���� �!���"��� �#��!�$�����!��%����#�����&�� �� #�'(!#��#�) ����* ����+�,-�����#�./��0 !� *���1�����������2!�(�����*����# ������������� ����#�������� # ��# ����� �� 3����#��������������4--5�&���� ��)�0�3�6!�7��"��� �#��!�8�9:�83*����������#��������!�;����������&�(����� **����!����� < ��!�'�����*��+�,-� ���.83*���=�/��0 !�
� � ���� �*�##�� .#������� � � ��� � ���0.����� ��*�## �<(��(��# ���� � * ����%� �( �# ������!�� ���� .* ���*�� ����#����������� � #�#������#���� � ��������.� �% � ��<��(��( �*�##�� �*������� �*�##��� �%���������( �� �� � #.83*�� � � ���� � �% � �( �< #� �� �������������!�%���������� �� ��#������/��0 !�� ����( !���������������#���#���� �*�� �����>�#� ����( !��� ����!��!#���.��� ��������#�#���%��( �#��.*����#������*�?�����%��(�.����� � �����(����# � ������ � ��� � @����3 � *�� ���#����< � � � �( ��(������ � �# � �( �*�������#������� � � .* ���(�������� ��5-A��%��������%��( # �*�## #�#��� ��( �������������% ��!����� ����0�#(������ ��# ��� �����( ��� # �� � �% � �( � �������� � �% � �(������ �� /( � %�� ��( # �*�## #�#(������ �#��� ���#�#�����.���(��(������ ���� � %��*���3 � ��# � BC����$ ��D&�:�E� �/( # � �(�.����� �*�## #����#�#���%�#�* ����#����*�F�����*���. ��# ��% �&�:�� C5G�-�AD ����C�4�5�AD ���:�C5�GGAD�$ �:�� C-�HGAD����:�� C-��GAD�������:�C-��5AD��#�< ����#��������%����� � � * ��#��/( ���!#����#������� ��%��( �#�*�� �< � �����!# ���!�I.��!���%%��������CI�)D�* �#�� * ����&�*�� #��%��(������ ���#���!�#�* ���#.������� � ��#� �#�� � C��#��� D � ���%���� � *����.��*���#(�%�#�����#� ��������*�� #� �� � *�##���#��%����(���.��*�� #� �� �C�JD��(�����*�� #� �� �C'JD���������.���*�� #� �� �C�JD� ��#�*��(��� � ?� �� ����� �# � �*.��##��� � ���#(�<���� �#� ���� �( � � �/( � %�� �< �<������� � �J � ���� � �# � �� � ?�*�� � �# � �(������ � ?(����#�#�������J�<(��(��#�� �!���� �C# �$�����D��K �#��� #���(����( ��*���������*������%�*����� # �*�#���� #���!��( ��J� *�##�����$������#(�<#��J� *�##����#� ������%��(������ ��������*�� *� ����� ���#�# ��%��*��( �%��.�� ��(������ � ?(����#���*�� #� �� �*�?�*�������-�,�+�����5�5��*��/( �$ �L��������L� ���#��� ��#� � �.�������<��(���+����%�����������/( �����#��������������.*�� #� �� ��� �< ���0��<��/( � ������� � ��#������� � ��� ���*�� � #� ����#���! � �%��(������ �< � �� ���� �� ���� ��B�.�E�����#���� #��%��( �#��%�� ����� ��� #��#�������������I.��!�� �(��@� #���.� ���0 � �B�.,E�� ��#�%�� ��#�< ��� ��<�� ��� ��� ����#�<��0�����(������ ���*�� #� �� �(�#�� ��� �%��* ���>%� �( ��##�*�������#�*�� ��(����(������ �#������� ��#�#�*��������������(�#������ ������(��������� ��������� �.����#��( �� ���( �����&�:,�����#��( ���������!#�#��%��( ���*���#� ������%��(������ �#(������ ���� ����� ���.� ���0 �� � >�� � � � � ��*����#�� � � �< � � �(������ #�%��*���%% � ���������#�(�#�� ��*�� �B�E������( � ��#����<��0����/��0�#(��(������ ����� ���( �����&�:,�*�.� ��� ����������� �������#��������#(�����(�� �%������.
����������*�� #�������� �# ����������������554��*.��
<�#��##��� ������( �ν,�� ������*�� �����#(�< ������.�����������#� ?(����������##��%�� � � ���!��%��( �&�:,�
����#� �/( � ��<�<�� ���*� � � � ���� ��% � �(������ � �#���*�� ?����#��������������,-4��*.���#��������� ������( �� � ����������� �:���� #���# ��� ������������ * ���<��(� ���� ��<��0�B�E�����#�* �#���� ���%% � �� #�(�� �� ����# �� ���K �#��� #���(����( # ���%% � �� #�� .� �������( ����������#��#����������%�����!�������=���$ �L��������
��� ��� ��� ��� ��� ��� ��� ��� ��� ��� ��� ��
�� � ���������
�
����
�����
�����
���
����������
��
����
�����
������
�������J�#� �����%����(������ ����*�����������%� @� �.�� #���������%��*�H����H--��3�������*�� *� �����
��������*���#� ����*��%���( ��--.�4--�*.��� ������%��(������ �%��*�/��0 !�
������ !�"#� B�EJ�0#(*�� � � &�;�� � � � ��� � C�HG�������� ���� ��� �5-�.5�-� � B�E����# �&�� � � ���� � C�--+D���������������������������G�.�G+���B�E$��@�(�����J� � � � ��� � C�--�D ����� � ���� � ������� ��-+.���H��B,E' ����'�6�� ������C�--�D��������������� ��H+�.H+,��
17CORALS II Conference
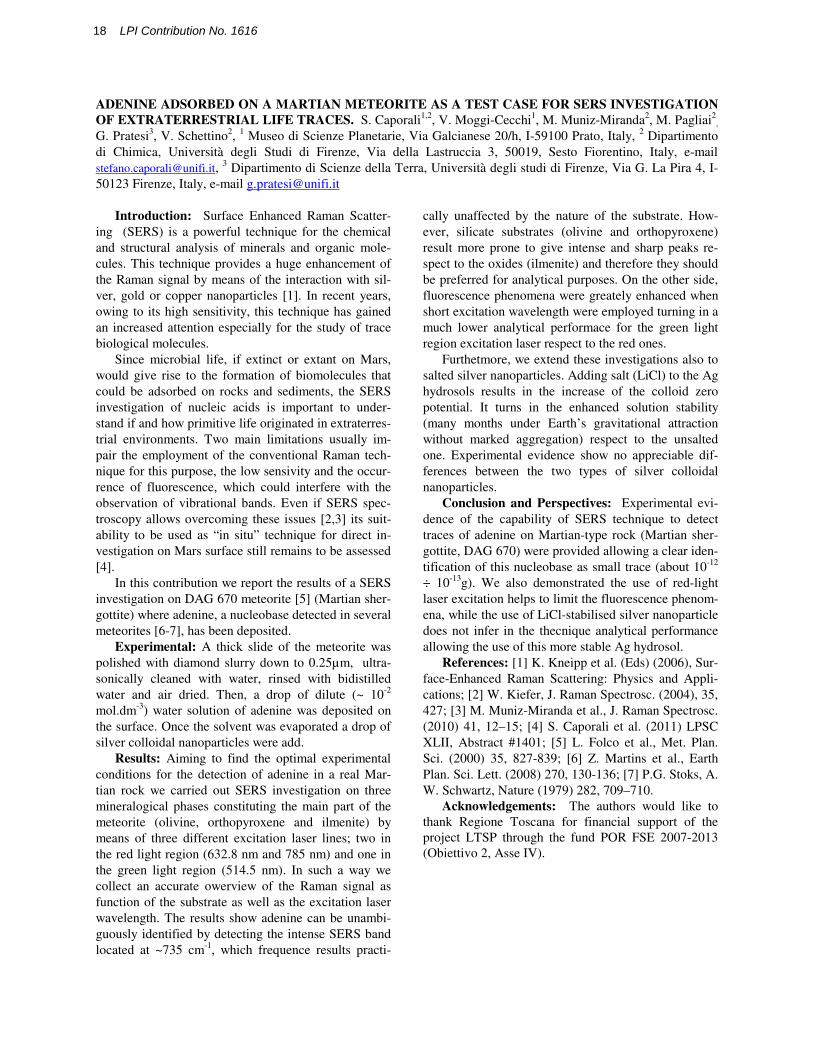
ADENINE ADSORBED ON A MARTIAN METEORITE AS A TEST CASE FOR SERS INVESTIGATION OF EXTRATERRESTRIAL LIFE TRACES. S. Caporali1,2, V. Moggi-Cecchi1, M. Muniz-Miranda2, M. Pagliai2
,
G. Pratesi3, V. Schettino2, 1 Museo di Scienze Planetarie, Via Galcianese 20/h, I-59100 Prato, Italy, 2 Dipartimento di Chimica, Università degli Studi di Firenze, Via della Lastruccia 3, 50019, Sesto Fiorentino, Italy, e-mail [email protected], 3 Dipartimento di Scienze della Terra, Università degli studi di Firenze, Via G. La Pira 4, I-50123 Firenze, Italy, e-mail [email protected]
Introduction: Surface Enhanced Raman Scatter-ing (SERS) is a powerful technique for the chemical and structural analysis of minerals and organic mole-cules. This technique provides a huge enhancement of the Raman signal by means of the interaction with sil-ver, gold or copper nanoparticles [1]. In recent years, owing to its high sensitivity, this technique has gained an increased attention especially for the study of trace biological molecules.
Since microbial life, if extinct or extant on Mars,would give rise to the formation of biomolecules that could be adsorbed on rocks and sediments, the SERS investigation of nucleic acids is important to under-stand if and how primitive life originated in extraterres-trial environments. Two main limitations usually im-pair the employment of the conventional Raman tech-nique for this purpose, the low sensivity and the occur-rence of fluorescence, which could interfere with the observation of vibrational bands. Even if SERS spec-troscopy allows overcoming these issues [2,3] its suit-ability to be used as “in situ” technique for direct in-vestigation on Mars surface still remains to be assessed [4].
In this contribution we report the results of a SERS investigation on DAG 670 meteorite [5] (Martian sher-gottite) where adenine, a nucleobase detected in several meteorites [6-7], has been deposited.
Experimental: A thick slide of the meteorite was polished with diamond slurry down to 0.25μm, ultra-sonically cleaned with water, rinsed with bidistilled water and air dried. Then, a drop of dilute (~ 10-2
mol.dm-3) water solution of adenine was deposited on the surface. Once the solvent was evaporated a drop of silver colloidal nanoparticles were add.
Results: Aiming to find the optimal experimental conditions for the detection of adenine in a real Mar-tian rock we carried out SERS investigation on three mineralogical phases constituting the main part of the meteorite (olivine, orthopyroxene and ilmenite) by means of three different excitation laser lines; two in the red light region (632.8 nm and 785 nm) and one in the green light region (514.5 nm). In such a way wecollect an accurate owerview of the Raman signal asfunction of the substrate as well as the excitation laser wavelength. The results show adenine can be unambi-guously identified by detecting the intense SERS band located at ~735 cm-1, which frequence results practi-
cally unaffected by the nature of the substrate. How-ever, silicate substrates (olivine and orthopyroxene) result more prone to give intense and sharp peaks re-spect to the oxides (ilmenite) and therefore they should be preferred for analytical purposes. On the other side, fluorescence phenomena were greately enhanced when short excitation wavelength were employed turning in a much lower analytical performace for the green light region excitation laser respect to the red ones.
Furthetmore, we extend these investigations also tosalted silver nanoparticles. Adding salt (LiCl) to the Ag hydrosols results in the increase of the colloid zero potential. It turns in the enhanced solution stability (many months under Earth’s gravitational attractionwithout marked aggregation) respect to the unsaltedone. Experimental evidence show no appreciable dif-ferences between the two types of silver colloidal nanoparticles.
Conclusion and Perspectives: Experimental evi-dence of the capability of SERS technique to detecttraces of adenine on Martian-type rock (Martian sher-gottite, DAG 670) were provided allowing a clear iden-tification of this nucleobase as small trace (about 10-12
÷ 10-13g). We also demonstrated the use of red-light laser excitation helps to limit the fluorescence phenom-ena, while the use of LiCl-stabilised silver nanoparticle does not infer in the thecnique analytical performance allowing the use of this more stable Ag hydrosol.
References: [1] K. Kneipp et al. (Eds) (2006), Sur-face-Enhanced Raman Scattering: Physics and Appli-cations; [2] W. Kiefer, J. Raman Spectrosc. (2004), 35, 427; [3] M. Muniz-Miranda et al., J. Raman Spectrosc. (2010) 41, 12–15; [4] S. Caporali et al. (2011) LPSC XLII, Abstract #1401; [5] L. Folco et al., Met. Plan. Sci. (2000) 35, 827-839; [6] Z. Martins et al., Earth Plan. Sci. Lett. (2008) 270, 130-136; [7] P.G. Stoks, A. W. Schwartz, Nature (1979) 282, 709–710.
Acknowledgements: The authors would like to thank Regione Toscana for financial support of the project LTSP through the fund POR FSE 2007-2013 (Obiettivo 2, Asse IV).
18 LPI Contribution No. 1616
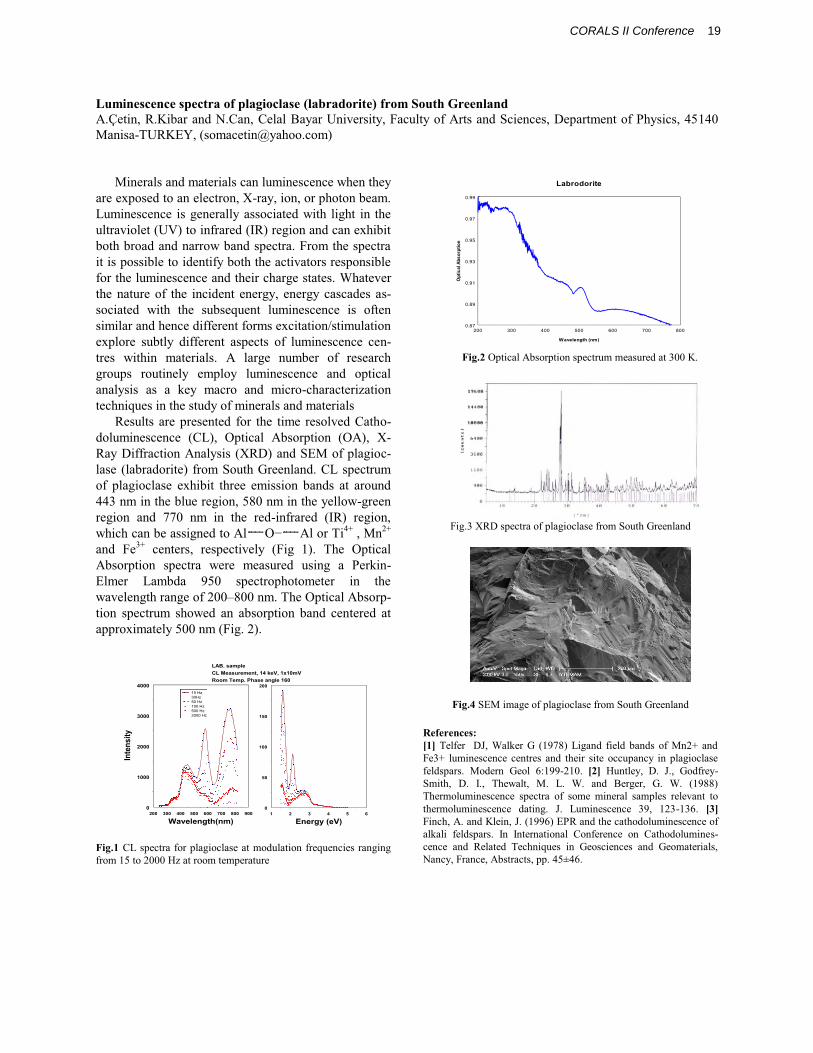
Luminescence spectra of plagioclase (labradorite) from South Greenland
R.Kibar and N.Can, Celal Bayar University, Faculty of Arts and Sciences, Department of Physics, 45140Manisa-TURKEY, ([email protected])
Minerals and materials can luminescence when they are exposed to an electron, X-ray, ion, or photon beam. Luminescence is generally associated with light in the ultraviolet (UV) to infrared (IR) region and can exhibit both broad and narrow band spectra. From the spectra it is possible to identify both the activators responsible for the luminescence and their charge states. Whatever the nature of the incident energy, energy cascades as-sociated with the subsequent luminescence is often similar and hence different forms excitation/stimulation explore subtly different aspects of luminescence cen-tres within materials. A large number of research groups routinely employ luminescence and optical analysis as a key macro and micro-characterization techniques in the study of minerals and materials
Results are presented for the time resolved Catho-doluminescence (CL), Optical Absorption (OA), X-Ray Diffraction Analysis (XRD) and SEM of plagioc-lase (labradorite) from South Greenland. CL spectrum of plagioclase exhibit three emission bands at around 443 nm in the blue region, 580 nm in the yellow-green region and 770 nm in the red-infrared (IR) region, which can be assigned to Al Al or Ti4+ , Mn2+
and Fe3+ centers, respectively (Fig 1). The Optical Absorption spectra were measured using a Perkin-Elmer Lambda 950 spectrophotometer in the wavelength range of 200 800 nm. The Optical Absorp-tion spectrum showed an absorption band centered at approximately 500 nm (Fig. 2).
200 300 400 500 600 700 800 900
Wavelength(nm)
0
1000
2000
3000
4000
Inte
nsity
15 Hz30Hz50 Hz100 Hz500 Hz2000 Hz
LAB. sampleCL Measurement, 14 keV, 1x10mVRoom Temp. Phase angle 160
1 2 3 4 5 6
Energy (eV)
0
50
100
150
200
Fig.1 CL spectra for plagioclase at modulation frequencies ranging from 15 to 2000 Hz at room temperature
200 300 400 500 600 700 800
Wavelength (nm)
0.87
0.89
0.91
0.93
0.95
0.97
0.99
Opt
ical
Abs
orpt
ion
Labrodorite
Fig.2 Optical Absorption spectrum measured at 300 K.
Fig.3 XRD spectra of plagioclase from South Greenland
Fig.4 SEM image of plagioclase from South Greenland
References:
[1] Telfer DJ, Walker G (1978) Ligand field bands of Mn2+ and Fe3+ luminescence centres and their site occupancy in plagioclase feldspars. Modern Geol 6:199-210. [2] Huntley, D. J., Godfrey-Smith, D. I., Thewalt, M. L. W. and Berger, G. W. (1988) Thermoluminescence spectra of some mineral samples relevant to thermoluminescence dating. J. Luminescence 39, 123-136. [3]
Finch, A. and Klein, J. (1996) EPR and the cathodoluminescence of alkali feldspars. In International Conference on Cathodolumines-cence and Related Techniques in Geosciences and Geomaterials,
19CORALS II Conference

Thermal Effect on The Cathodo- and Thermoluminescence Emission of Natural Topaz (Al2SiO4(F,OH)2). Co-rrecher, V.1 , Garcia-Guinea, J2, Martin-Fernandez, C2., Can, N3. 1CIEMAT. Av. Complutense 22. Madrid 28040,Spain. 2Departamento de Geologia y Geoquimica. Museo Nacional Ciencias Naturales. CSIC. 28006 Madrid. Spain. 3Celal Bayar University, Faculty of Arts and Sciences, Physics Department, 35040 Manisa-Turkey. Correspondenceauthor: [email protected]
Introduction. Most of gemstones, being natural mate-rials (silicates, carbonates, phosphates, etc.), exhibitluminescence emission. Such property is of great inter-est since could be potentially employed, not only fordating purposes, but also as personal dosimeters in case of radiation accident or radiological terrorism whereconventional monitoring was not established. For thesepurposes the laboratory routine is mainly based on theanalysis of the blue emission (at about 400 nm) of natu-ral materials. This emission, that is strongly dependentof the temperature, is produced by the incidence of the radiation on the aluminosilicates lattices that inducesmobility of the alkalis causing a high number of elec-tron–hole pairs in the lattice. Alkali self-diffusionthrough bulk and interfaces gives rise to a continuousalkali–oxygen bond splitting–linking processes withcontinuous formation–destruction of [AlO4]
o centres.Some holes can be trapped, forming [AlO4/M
+] centres. When the supplied energy is enough, the recombina-tion of the electrons with the hole trapped adjacent toAl-M+ reduces the presence of ionic charge compensa-tors at the Al sites and induces the blue luminescenceemission to [AlO4]o centres (aluminium–hole centres).In this sense, this paper reports about the influence ofthe temperature on the thermoluminescence (TL) andcathodoluminescence (CL) behaviour of a well-characterised topaz from Badajoz (Spain). TL provides information about the trapped charge recombinationsites related to metastable defects inside the lattice de-pending on whether the detrapping process is due toheat. CL is a process whereby light is created from anenergetic electron beam. CL supplies data about tran-sient defects after irradiation on the surface of the lat-tice. CL is used in the identification of the migrationand diffusion of some luminescent centres from theemission bands.
Results. The CL spectra all clearly show two featuresviz., a shoulder emission band at near 340 nm (3.64eV) and a sharp emission at 450 nm (2.75 eV). Sincethe excitation efficiency of CL is not uniform withdepth one possibility is that the defect centre which isresponsible for this particular emission, could be pre-sent closer the surface. For the low temperature CLmeasurements the 450 nm emission disappeared but the 340 nm emission becomes sharper. In addition to these features, another broad band is featured between 650nm (1.91 eV) and 750 nm (1.65 eV). Comparison ofsignals with other silicates may be helpful and these
features are similar to those observed in thermallytreated quartz where they have been attributed to(AlO4)
o and (H3O4)o centres.
Fig 1. CL of natural topaz taken at room temperature and
low temperature
TL glow curves of different aliquots of natural topazare shown after the preannealing treatment. In thewhole natural TL glow curve a broad peak is appreci-ated at 240oC followed by a second structure consistingon a wide broad distribution peaked at 450oC. In thewhole curve the TL features typically involve a gradual and progressively shift of the maximum peak up tohigher temperatures and a change in the shape and in-tensity of the TL distribution in accordance with thethermal pre-treatment. The thermolabile broad band ofblue emissions shows TL glow curves of multi-orderkinetics involving continuous processes of trapping-detrapping. These thermal phenomena of TL could beinvolved in consecutive breaking and linking of bondsof Al-O, Si-O, redox reactions and also losses of fluo-ride ions.
Fig 2. TL glow curves taken after preheating with tempera-
tures from 200 to 410oC.
20 LPI Contribution No. 1616

PRELIMINARY STUDIES ON THE SPECTRA LUMINESCENCE OF BRENKITE Ca2F2CO3. E. Crespo-Feo1, J. Garcia-Guinea2, V. Correcher3, and A. Nieto-Codina2, 1Dpt. Cristalografia y Mineralogia. Fac. CC. Geologicas-UCM. C/ Jose Antonio Novais 2. Madrid 28040 Spain, correspondence autor: [email protected] Nacional de Ciencias Naturales-CSIC. C/ Jose Gutierrez Abascal, 2 Madrid 28006 Spain, 3CIEMAT. Av. Complutense 22. Madrid 28040 Spain.
Introduction: Brenkite (Ca2F2CO3) is an orthorhombic mineral with Pbcn space group that is reflected in its external habit, radiated agregate fibers (Fig.1a) with well developed crystal faces at the top of the laths (Fig.1b).
Fig.1. Scaning Electron Microscope (ESEM) images of the studied brenkite: (a) radial intergrown of prismatic crystals;(b) detail of the crystal faces from the top of the fibers.
It was first described in 1978 [1] and, since brenkite is not a common mineral, very few papers have dealed on this carbonate [1-3]. No previous works on its luminescence has been developed therefore this is the first aproched to its luminescence features.
Methods: Brenkite was characterized by means of X-ray powder difracction (XRD) using a Phillips PW1710/00 difractometer with a CuKa radiation source, equipped with a graphite monochromator.Chemical analyses, together with the scaning electron microscope images, were obtained by enviromental scaning electron microscopy and energy dispersive X-ray spectrometer (ESEM-EDS) using an Inspect-S of
the FEI Company. CL spectra were performed in low vacuum mode without coating, using a Gatan MonoCL3 detector and PA-3 photomultiplier attached to the ESEM. The PMT covers a spectral range of 185 nm–850 nm. The excitation for CL measurements was provided at 25 kV electron beam.
Results and Discussion: By XRD the mineral seems to be pure brenkite and the chemical analyses (Ca 44%, F 23% and C 6%) fit very closely with the theoretical composition of the mineral [1,4], although some Yb has been observed (1%). CL spectra were performed in four different point along the brenkite fiber. If we consider the aggregate as a part of a spherical morphology, the analyses were located as follows: close to the inner part of the radial aggregate, in the middle of the fiber length, at the upper part of the fiber, and on the well developed crystal faces at the top. Spectra show similar features except the intensityvariability. The main luminescence response is located in the blue part of the spectrum with most intense peak situated at ~380 nm. Slighter signals are recorded at ~660 and ~760 nm. These could be related to some impurities as well as the blue region could be intrinsic although more detailed analysis are requireed. Also, it is needed to understand the Yb implication on the brenkite luminescence.
Fig.2. CL spectra of 4 different points along the brenkite fiber. See text for a detailed description.
References: [1] Hentschel G. et al. (1978) Neues Jahrb.Min.,Mh., 325-329. [2] Leufer U. and Tillmanns E. (1980)Tschermaks Mineral. Petrog. Mitt., 27, 261–266. [3] Grice J. D. et al. (2007) Chem. Rev., 107, 114–132. [4] Anthony J. W. et al. (2003) Handbook of mineralogy (Volume V-Borates, Carbonates, Sulfates): Mineral Data Publishing, Tucson, Arizona, 813 p.
21CORALS II Conference
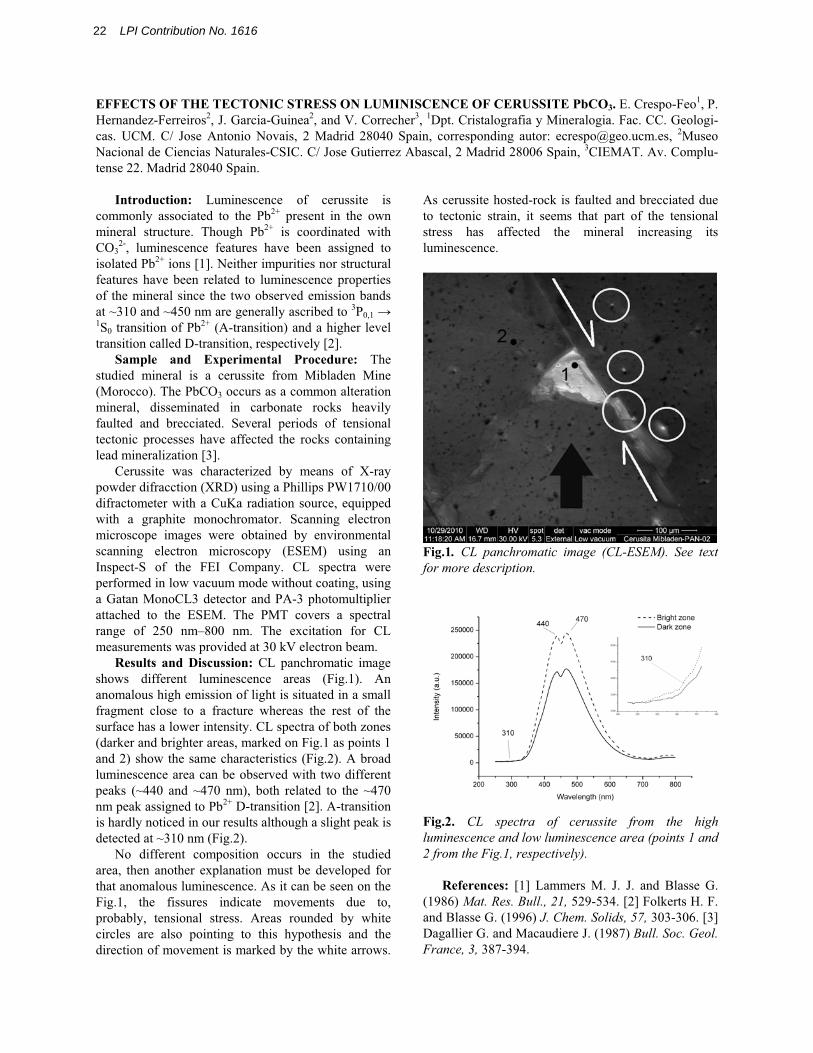
EFFECTS OF THE TECTONIC STRESS ON LUMINISCENCE OF CERUSSITE PbCO3. E. Crespo-Feo1, P.Hernandez-Ferreiros2, J. Garcia-Guinea2, and V. Correcher3, 1Dpt. Cristalografia y Mineralogia. Fac. CC. Geologi-cas. UCM. C/ Jose Antonio Novais, 2 Madrid 28040 Spain, corresponding autor: [email protected], 2Museo Nacional de Ciencias Naturales-CSIC. C/ Jose Gutierrez Abascal, 2 Madrid 28006 Spain, 3CIEMAT. Av. Complu-tense 22. Madrid 28040 Spain.
Introduction: Luminescence of cerussite is commonly associated to the Pb2+ present in the own mineral structure. Though Pb2+ is coordinated with CO3
2-, luminescence features have been assigned to isolated Pb2+ ions [1]. Neither impurities nor structural features have been related to luminescence properties of the mineral since the two observed emission bands at ~310 and ~450 nm are generally ascribed to 3P0,11S0 transition of Pb2+ (A-transition) and a higher level transition called D-transition, respectively [2].
Sample and Experimental Procedure: The studied mineral is a cerussite from Mibladen Mine (Morocco). The PbCO3 occurs as a common alteration mineral, disseminated in carbonate rocks heavily faulted and brecciated. Several periods of tensional tectonic processes have affected the rocks containing lead mineralization [3].
Cerussite was characterized by means of X-ray powder difracction (XRD) using a Phillips PW1710/00 difractometer with a CuKa radiation source, equipped with a graphite monochromator. Scanning electron microscope images were obtained by environmentalscanning electron microscopy (ESEM) using an Inspect-S of the FEI Company. CL spectra wereperformed in low vacuum mode without coating, using a Gatan MonoCL3 detector and PA-3 photomultiplierattached to the ESEM. The PMT covers a spectral range of 250 nm–800 nm. The excitation for CL measurements was provided at 30 kV electron beam.
Results and Discussion: CL panchromatic image shows different luminescence areas (Fig.1). Ananomalous high emission of light is situated in a small fragment close to a fracture whereas the rest of the surface has a lower intensity. CL spectra of both zones(darker and brighter areas, marked on Fig.1 as points 1and 2) show the same characteristics (Fig.2). A broad luminescence area can be observed with two different peaks (~440 and ~470 nm), both related to the ~470nm peak assigned to Pb2+ D-transition [2]. A-transitionis hardly noticed in our results although a slight peak is detected at ~310 nm (Fig.2).
No different composition occurs in the studied area, then another explanation must be developed for that anomalous luminescence. As it can be seen on the Fig.1, the fissures indicate movements due to, probably, tensional stress. Areas rounded by white circles are also pointing to this hypothesis and the direction of movement is marked by the white arrows.
As cerussite hosted-rock is faulted and brecciated due to tectonic strain, it seems that part of the tensional stress has affected the mineral increasing its luminescence.
Fig.1. CL panchromatic image (CL-ESEM). See text for more description.
Fig.2. CL spectra of cerussite from the high luminescence and low luminescence area (points 1 and 2 from the Fig.1, respectively).
References: [1] Lammers M. J. J. and Blasse G.(1986) Mat. Res. Bull., 21, 529-534. [2] Folkerts H. F. and Blasse G. (1996) J. Chem. Solids, 57, 303-306. [3] Dagallier G. and Macaudiere J. (1987) Bull. Soc. Geol. France, 3, 387-394.
22 LPI Contribution No. 1616

VATERITE STABILITY IN THE PRESENCE OF Cr (VI). J.A. Cruz1, N. Sánchez-Pastor1, A. M. Gigler2, andL. Fernández-Díaz1. 1Departamento de Cristalografía y Mineralogía. Universidad Complutense de Madrid. 28040, Madrid (Spain), 2CeNS and Department for Earth and Environmental Sciences, Ludwig-Maximilians-Universität. 80333, Munich (Germany).
Calcium carbonate phases are relevant in numerous scientific disciplines due to their abundance in bothinorganic and biotic media and for a wide range of industrial applications. Many studies demonstrate that vaterite is thermodynamically unstable with respect to the aragonite and calcite. However, Navrotsky pointed out that calcite, aragonite, and vaterite are close enough in free energy such that small changes in their surface properties and/or concentration of impurities can determine stability crossovers.[1] It has been shown experimentally that vaterite can become tempo-rarily stabilized when it forms in the presence of differ-ent ions [2, 3].
This investigation was focused on the effect of Cr (VI) stabilizing the polymorph vaterite. The crystal-lization of vaterite was carried out using a double dif-fusion system [4] which consisted of two verticalbranches separated by a column of silica hydrogel. The vertical branches were filled with 0.5 M CaCl2 and 0.5 M Na2CO3 solutions, and different amounts of a Na2CrO4 solution were added to the silica gel during its preparation (0.1, 0.15, and 0.2 M). The vaterite aggre-gates were recovered from the gel after 30 days and were studied by scanning electron microscope and Ra-man spectroscopy. Figure 1 shows examples of vaterite aggregates grown in silica gel bearing Cr (VI) concen-trations ranging from 0.1 M (a) to 0.2 M (c), where their characteristic morphology can be observed.
The Raman spectra collected from those aggregates formed in gels containing 0.15 M Cr(VI) (Figure 1band 1c) show the typical vaterite triplet at 1074, 1081, and 1094 cm-1 and an additional line at 750 cm-1. Fur-ther translational and rotational lattice modes can be observed between 100 and 300 cm-1 consistent with vaterite [5]. However, in contrast to the external mor-phology of the aggregate shown in Figure 1a, its Ra-man spectrum shows peaks at 1085 cm-1, 208 cm-1 and 711 cm-1, all of them characteristic of calcite [6]. Acloser examination of this sample (see the inset of Fig-ure 1a) shows that it is, in fact, a vaterite pseudomorph that consists of small calcite rhombohedra. The facts that: i. Cr-free experiments did not yield any other Ca-CO3 polymorph than calcite and ii. Vaterite trans-formed into calcite when the concentration of Cr (VI) in the growth medium was lower than 0.15 M, indicate that the presence of Cr (VI) promotes the formation of vaterite. However, only high Cr (VI) concentrations in the growth medium can prevent its transformation into calcite after a relatively short time.
References:
[1] Navrotsky, A. (2004) Proc. Natl. Acad. Sci.101, 12096 12101. [2] Nassrallah-Aboukais, N., et al. (1998) J. Chem. Soc. 94, 2399-2405. [3] Fernández-Díaz, L. (2010) Geochimi. Cosmochimi. Acta. 74,6064-6076. [4] Henisch, H.K. and García-Ruíz, J.M. (1986) J. Cryst. Growth. 75, 195-202. [5] Urmos, J. etal. (1991) Am. Mineral. 76, 641-646. [6] Bischoff et al. (1985) Am. Mineral. 70, 581-589.
23CORALS II Conference
Raman Micro-Spectroscopy performed on Extraterrestrial Particles. S. De Angelis1,2, V. Della Corte1, G. A. Baratta3, R. Brunetto4, P. Palumbo1, A. Ciucci1, A. Rotundi1
1 Dip. Scienze Applicate, Università Parthenope, Centro Direzionale, Isola C4, 80143, Napoli (Italy)([email protected], [email protected], [email protected], [email protected],[email protected])
2Dip. Ingegneria Aerospaziale, Università Federico II, Piazzale Tecchio, 80, 80125, Napoli (Italy)3INAF-Oss. Astrofisico di Catania, Via Santa Sofia 78, 95123, Catania (Italy) ([email protected])4Institut d’Astrophysique Spatiale, CNRS, Universitè Paris-Sud, UMR8617, F-91405, Orsay FRANCE([email protected])
Introduction:We performed Raman measurements on stratospheric particles collected by the balloon-borne DUSTER (Dust in the Upper Stratosphere Tracking Experiment and Retrieval) instrument (Della Corte et al. 2011). DUSTER is designed to collect particles, with sizes between 0.1 and 40 microns, in the upper stratosphere, at altitudes of 35-40 km; the aim is to collect micron-size cosmic particles settling in the terrestrial atmosphere. The DUSTER instrument has flown in 2006 from Kiruna-Esrange (Sweden, technical flight), in 2008 and 2009 from Svalbard (Norway, scientific flights) and a new scientific flight is planned from Kiruna-Esrange for the end of February 2011. The particles on which we performed Raman measurements were collected during the DUSTER 2008 flight, at an altitude of 37±1 km in the polar stratosphere. The particles analyzed by Raman micro-spectroscopy, (sizes 3 – 12 micron) have been previously characterized by IR micro-spectroscopy, Field Emission Scanning Electron Microscopy (FESEM) and Energy Dispersive X-ray analyses. The Raman spectra are characterized by an intense signal due to amorphous carbon, with the typical D and G peaks at 1361 cm-1 and 1580 cm-1
superimposed to a fluorescence continuum. In two spectra, relative to particles D08C_006 and D08C_008(b), we can tentatively recognize the presence of a weak peak at 1080 cm-1 that could be due to calcite. The peak is hardly distinguishable from the noise of the relatively strong fluorescence background due to the presence of amorphous carbon. The presence of calcite (CaCO3) is confirmed by IR micro-spectroscopy and by EDX analyses results. To support Raman spectra reduction, we developed a program (LabVIEW environment) able to fit many spectra simultaneously, choosing between Gaussian, Lorentzian orBWF curves for the fits.We compared the Raman results obtained on DUSTER particles, whose origin has been classified as extraterrestrial, with two other sets of Raman analyses performed on extraterrestrial dust: 1) Interplanetary Dust Particles (IDPs), collected by the high flying aircraft stratospheric NASA programm; 2) cometary particles collected during the fly-byof the NASA/Stardust spacecraft in the coma of the comet 81P/Wild 2. The Raman NASA/IDPs measurements show the presence of the D and G peaks of amorphous carbon, together with the evidence of iron-oxides (magnetite, maghemite and hematite) for all particles except one, in which the intense amorphous carbon signal dominates on possible minerals contribution. The presence of iron-oxides, combined with FESEM images and IR micro-spectroscopy, suggests that these IDPs could
have undergone pyrometamorphism because of the flash-heating during atmospheric entry.The Raman spectra of 81P/Wild 2 samples are dominated by condensed aromatic hydrocarbons (or "disordered carbonaceous material"). The D and G Raman parametersspan a range similar to that observed in IDPs and in most primitive meteorites.Raman analyses were performed at the INAF-Laboratorio di Astrofisica Sperimentale, Catania, Italy.
24 LPI Contribution No. 1616

Thermoluminescence Studies of Dergaon Meteorite
P. Dutta1 and K. Duorah2
1. Department of Physics, Dimoria College, Khetri-782403, Assam, India
2. Department of Physics, Gauhati University, Guwahati-781014, Assam, India
ABSTRACT:
A multiple fall of stony meteorite occurred near the town of Dergaon in Assam, India, on
March 2, 2001. Preliminary Mineralogical and Petrologic studies suggested that the
meteorite belongs to the H5 Group. Here in this paper we represent Thermoluminescence
studies of Dergaon meteorite in order to have its thermal history. The given work consists
of an estimation of the quantitative characteristics of thermal and /or shock thermal
influence on substance of this meteorite as well as degree of structural change in matter
during formation and subsequent evolution of their parent bodies. Here we get the
intensity of TL glow in equilibrium changes more than two order of magnitude.
Keywords: Meteorite, Thermoluminescence
PACS: 91.65 Sn, 96.30 Za
25CORALS II Conference
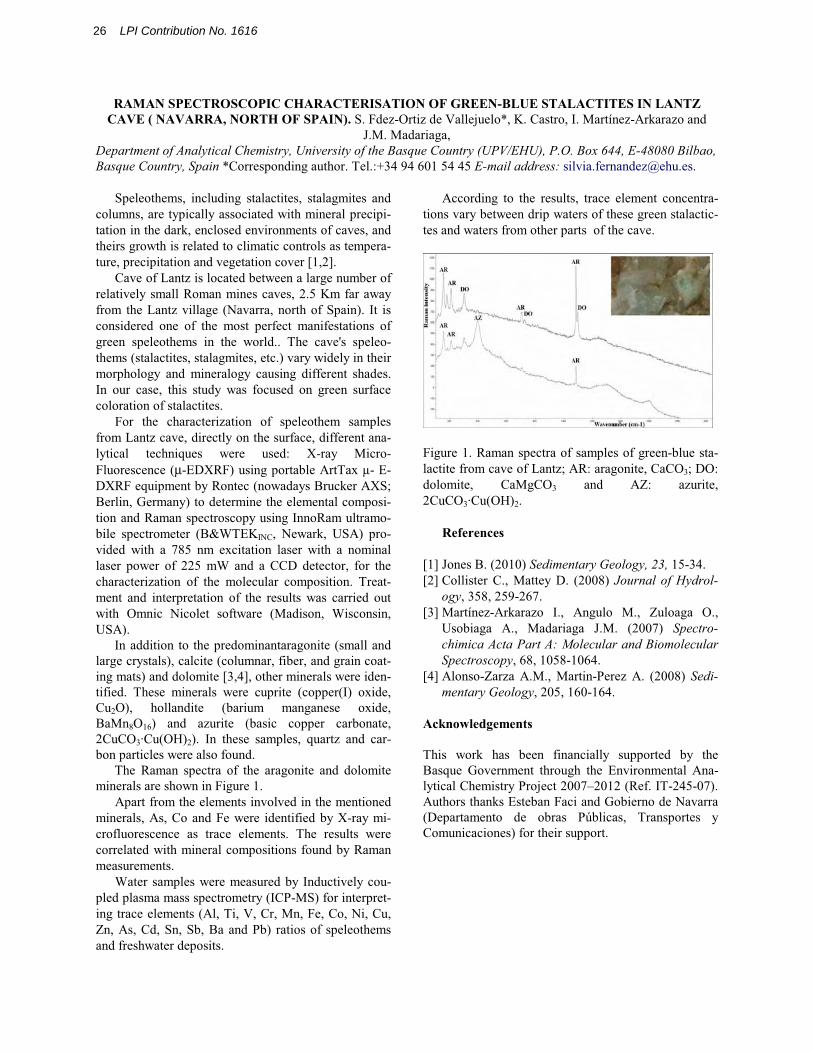
RAMAN SPECTROSCOPIC CHARACTERISATION OF GREEN-BLUE STALACTITES IN LANTZ CAVE ( NAVARRA, NORTH OF SPAIN). S. Fdez-Ortiz de Vallejuelo*, K. Castro, I. Martínez-Arkarazo and
J.M. Madariaga, Department of Analytical Chemistry, University of the Basque Country (UPV/EHU), P.O. Box 644, E-48080 Bilbao, Basque Country, Spain *Corresponding author. Tel.:+34 94 601 54 45 E-mail address: [email protected].
Speleothems, including stalactites, stalagmites and columns, are typically associated with mineral precipi-tation in the dark, enclosed environments of caves, and theirs growth is related to climatic controls as tempera-ture, precipitation and vegetation cover [1,2].
Cave of Lantz is located between a large number of relatively small Roman mines caves, 2.5 Km far away from the Lantz village (Navarra, north of Spain). It is considered one of the most perfect manifestations of green speleothems in the world.. The cave's speleo-thems (stalactites, stalagmites, etc.) vary widely in their morphology and mineralogy causing different shades. In our case, this study was focused on green surface coloration of stalactites.
For the characterization of speleothem samples from Lantz cave, directly on the surface, different ana-lytical techniques were used: X-ray Micro-Fluorescence (μ-EDXRF) using portable ArtTax µ- E-DXRF equipment by Rontec (nowadays Brucker AXS; Berlin, Germany) to determine the elemental composi-tion and Raman spectroscopy using InnoRam ultramo-bile spectrometer (B&WTEKINC, Newark, USA) pro-vided with a 785 nm excitation laser with a nominal laser power of 225 mW and a CCD detector, for the characterization of the molecular composition. Treat-ment and interpretation of the results was carried out with Omnic Nicolet software (Madison, Wisconsin, USA).
In addition to the predominantaragonite (small and large crystals), calcite (columnar, fiber, and grain coat-ing mats) and dolomite [3,4], other minerals were iden-tified. These minerals were cuprite (copper(I) oxide, Cu2O), hollandite (barium manganese oxide, BaMn8O16) and azurite (basic copper carbonate, 2CuCO3·Cu(OH)2). In these samples, quartz and car-bon particles were also found.
The Raman spectra of the aragonite and dolomite minerals are shown in Figure 1.
Apart from the elements involved in the mentioned minerals, As, Co and Fe were identified by X-ray mi-crofluorescence as trace elements. The results were correlated with mineral compositions found by Raman measurements.
Water samples were measured by Inductively cou-pled plasma mass spectrometry (ICP-MS) for interpret-ing trace elements (Al, Ti, V, Cr, Mn, Fe, Co, Ni, Cu, Zn, As, Cd, Sn, Sb, Ba and Pb) ratios of speleothems and freshwater deposits.
According to the results, trace element concentra-tions vary between drip waters of these green stalactic-tes and waters from other parts of the cave.
Figure 1. Raman spectra of samples of green-blue sta-lactite from cave of Lantz; AR: aragonite, CaCO3; DO: dolomite, CaMgCO3 and AZ: azurite, 2CuCO3·Cu(OH)2.
References
[1] Jones B. (2010) Sedimentary Geology, 23, 15-34. [2] Collister C., Mattey D. (2008) Journal of Hydrol-
ogy, 358, 259-267. [3] Martínez-Arkarazo I., Angulo M., Zuloaga O.,
Usobiaga A., Madariaga J.M. (2007) Spectro-chimica Acta Part A: Molecular and Biomolecular Spectroscopy, 68, 1058-1064.
[4] Alonso-Zarza A.M., Martin-Perez A. (2008) Sedi-mentary Geology, 205, 160-164.
Acknowledgements This work has been financially supported by the Basque Government through the Environmental Ana-lytical Chemistry Project 2007–2012 (Ref. IT-245-07). Authors thanks Esteban Faci and Gobierno de Navarra (Departamento de obras Públicas, Transportes y Comunicaciones) for their support.
26 LPI Contribution No. 1616

CONTENT OF RARE EARTH ELEMENTS IN A SPELEOTHEM ANALYZED BY ICP-MS AND CL-SPECTROSCOPY. Fernandez-Cortes, A. , Cuezva, S.1 1, Cañaveras, J.C. 2, García-Guinea, J1., Sanchez-Moral, S1. 1
Museo Nacional Ciencias Naturales. CSIC. 28006 Madrid. Spain. 2Laboratorio de Petrología Aplicada, UA-CSIC, 08040-Alicante, Spain
In the framework of a pilot study to search radiation sources and uranyl groups associated to the host rock and sediments, in a cavity with very high radon levels (Castañar cave, Spain) some Rare Earth Element (REE) mineralization’s have been detected in a carbonate stalactite. REE contents of the analyzed host-rock slates [1] by ICP-MS displayed spatially-heterogeneous concentrations, ranging from 20-44 ppm, 9-22 ppm, 8-23 ppm for Ce, La and Y, respectively. The REE signal is smoothed in the speleothem sample; 1 ppm, 0.2-0.9 ppm, 0.1-4.2 ppm for Ce, La and Y, respectively, values much higher than in other studied speleothems [2]. Cathodoluminescence (CL) analyses have allowed to obtain the whole spatially resolved spectra of the REE pattern along a concentric sequence of mineral precipitation of calcium-carbonate phases (Fig. 1). CL-spectra shows a wider range of spectral luminescence emissions corresponding to others REEs for B layer (calcite 90%, aragonite 10% by XRD), compared with the more external layer A (calcite ± phyllosilicates) where the intensity of the maximum CL-emissions are smoothed and Ce3+ prevails and hide others REE’s emissions. Fig. 2 shows a detailed CL spectrum for the growth layer B with a high density of REE: Sm3+, Sm4+, Dy3+, Ce3+, Eu3+ or Tb3+.The periodic enrichment of some REE (La, Ce) within the laminations of a speleothem reflect times of more intense weathering that usually correspond to relatively warm and humid climatic phases [2—3]. According with these authors, the higher concentration of Ce, La and Y in the external calcite layer (A) could indicate its growth during a phase with stronger weathering and more dynamic hydrology. REE mobilizations from the host-rock to this growth band corresponded to these major REEs. Simultaneously, the CaCO3 solubility could increase linked to a lower ratio of mineral precipitation due to REE-inhibition. An opposite pattern could be inferred for the inner layer B where the hydrodynamic conditions probably favored long times residence of seepage water and a higher interaction with the siliceous host-rock. This predominant REE-source entailed the incorporation and concentration of other REEs (Dy, Sm, Eu) and SiO4
-, Si-O groups into the CaCO3 lattices producing CL emission. The relative decrease of La, Ce and Y seems to be coeval to a more pronounced CL-anomalies of these minors REEs, as well as a uranium accumulation in this growth layer (19.3 ppm, 5 times higher than layer A).
An additional CL-spectrum of the growth layer nearest to fed conduit (Fig. 1,C) shows an intermediate pattern of REE’s emissions with respect to A and B layer. Thus, the CL-anomalies of the minors REEs are smoothed, except for Sm3+ and Dy3+. Originally, the REE’s contribution in this growth layer could be associated to similar hydrodynamic conditions of B layer but corresponding to an early stage.
Fig 1. REE and U concentrations and CL spectra for each concentric layer of calcium-carbonated phases.
Fig 2. Detailed CL spectrum with high REEs’ density corresponding to layer B.
References[1] Alonso-Zarza et al., (2011). Structural and host rock controls
on the distribution, morphology and mineralogy of speleothems in the Castañar Cave (Spain).Geological Magazine 48: 211 - 225.
[2] Zhou et al., (2008). Distinct climate change synchronous with Heinrich event one, recorded by stable oxygen and carbon isotopic compositions in stalagmites from China. Quaternary Research 68, 306–315.
[3] Richter et al., (2004). REE3+ and Mn2+ activated cathodoluminescence in late glacial and Holocene stalagmites of central Europe: evidence for climatic processes?. Holocene, 14(5): 759-767.
27CORALS II Conference
OLD AND MODERN PIGMENTS IDENTIFICATION FROM A 14th CENTURY SCULPTURE BY MICRO-RAMAN. M.L. Franquelo1, A. Duran1, D. Arquillo2 and J.L. Perez Rodriguez1, 1Materials Science Institute of Seville, Americo Vespucio 49, 41092 Seville, Spain [email protected] 2Fine Arts Faculty of Seville, University of Seville, Laraña 3, 41003 Seville, Spain
Introduction: Pigments identification in polychromed sculptures is very important for understanding the history of the works of art and the resolution of problems related to its conservation, restoration treatments and author attribution. Portable systems (XRF, Raman, XRD) only provide information from the external layers of the artifact, so in polychromies with a high number of layers, it is necessary to use other experimental techniques. The full identification of the pigments within the artworks requires collecting samples with all the layers, from the varnish to the support. If a sample contains all the layers, it will provide wide information about the way in which the polychromy and the repaint/restoration treatments were carried out. Micro-Raman spectroscopy can be used for the identification of pigments within the cross-sections containing all the layers of the polycromy [1-3]. The purpose of this work is to full characterize the different layers of cross-sections performed on samples from a 14th
century polychromed sculpture that had suffered subsequent restoration treatments by using micro-Raman spectroscopy. Also a chromatic study was carried out.
Experimental: A triplex polychromed sculpture of Santa Ana, the Virgin and the Child, dating from the Spanish Gothic period, has been studied. The dispersive integrated Horiba Jobin-Yvon LabRam HR 800 system was employed for recording the Raman spectra. The experiments were performed directly on the cross-sections performed from sculpture samples. Two external visible diode lasers are available in this apparatus: at
532.1 nm (green) and at 784.6 nm (red). An optical microscope is coupled confocally to the Raman spectrometer. The chromatic characterization was performed in situ using a portable spectrometer Dr. Lange Neurtek model LMC3/DIAM5.
Results: Five red layers were found together with the preparation layer in one of the cross-sections. The Raman spectra of the internal layers showed characteristic bands of vermilion (bands at 251, 289 and 343 cm-1). The presence of red lead was also detected (bands at 118, 147, 221, 307, 386 and 546 cm-1). The amount of red lead is higher than vermilion. The external red layer showed the characteristic bands
of vermilion and also those of red ochre: iron oxides mixture with clay minerals (bands at 221, 289, 406 cm-
1). Also gypsum (1004 cm-1) and lead white (1049 cm-
1) were detected.
200 400 600 800 1000 1200
Pb
GyHg
Hg
Hg
O
O
Inte
nsity
(a.u
.)
Raman shift (cm-1)
O
Fig 2: Micro-Raman on a red layer of one of the cross-sections: Hg=vermilion, O=iron oxide, Gy=Gypsum, Pb=white lead.
Titanium oxide (bands at 141, 447 and 609 cm-1)was detected in the external layers of white colour. The shoulder that appear at 438 cm-1 could be attributed to zinc white. Zinc was found by XRF (using a portable system) in most areas of the external part of the sculpture. Two blue color layers have been found in one of the stratigraphies, the internal layer is constituted by lazurite (bands at 258, 549, 810 and 1098 cm-1); this pigment accompanied by titanium oxide appeared in the external layer. Other old and modern pigments have been identified using this technique.
Chromatic characterizatyion of the different zones of the sculpture showed heterogeneous values of L*, a*, b*, according with the different colors visually observed. The composition was also confirmed by other techniques such as chemical analysis (SEM-EDX), micro-X ray diffraction and IR spectroscopy.
Conclusions: The micro-Raman spectroscopy study of cross-sections from a sculpture from 14th
century has shown the presence of old pigments such as vermilion, lazurite, lead white, red lead, red ochre or red lac in the internal layers and zinc white, titanium oxide, litopon, ultramar blue as modern pigments in the external layers attributed to subsequent restoration/repaint treatments.
Fig 1: Santa Ana triplex sculpture
References: [1] Clark R.J.H. (2007) J. Mol. Struct., 834-836, 74-80. [2] Franquelo M.L., Duran A., Herrera L.K., Jimenez de Haro M.C., Perez-Rodriguez J.L. (2009) J. Mol. Struct., 924-926, 404-412. [3] Du-ran A., Jimenez de Haro M.C., Perez-Rodriguez J.L., Franquelo M.L., Herrera L.K., Justo A. (2010) Ar-chaeometry, 52, 286-307.
28 LPI Contribution No. 1616

FRANCEVILLITE [(Ba,Pb)(UO2)2(V2O8)·5H2O] ON THE HYDROXYPAPATITE BOND FOSSILS OF
LORANCA (CUENCA, SPAIN): SPECTRUM CATHODOLUMINESCE OF URANYL-VANADATES
M. Furio, Merino, L., L. Tormo, A. Jorge, J. Garcia-Guinea 1Electron Microscopy and Spectroscopy Laboratory. Museo Nacional Ciencias Naturales. CSIC. 28006 Madrid. Spain. Author for correspondence: [email protected]
Geological Frame: The palaeontological deposit of fossil vertebrates Loranca-1 is located in the town of Loranca del Campo, Cuenca province, Spain. It is placed in the geological basin of Loranca in the Iberian Range. The basin is recognized as a non-sequenced foreland basin containing continental Tertiary deposits folded along with the underlying Mesozoic rocks. From the Late Oligocene to the Early Miocene the Lo-ranca Basin was filled by two coalescing depositional systems, the Tortola and the Villalba de la Sierra fluvi-al fans and associated environments. These deposition-al systems constitute the Upper Detrital Unit with a thickness of up to 900 m, which was formed during the major compressional tectonic phase of the Iberian Range. Tectonic activity during the deposition of the Upper Detrital Unit is evident because of progres-sive unconformities on the flanks of some anti-clines, and along the basin margins. Detailed strati-graphic correlations may be hazardous due to the com-plex nature of fluvial deposits. During the Tertiary pe-riod the Loranca Bassin was filled with beds of terri-genous and chemical sediments such as carbonates and gypsum up to reach 1000 m of thickness. Here we ana-lyze the vertebrate fossils outcrops of Loranca-1 (LO-1) dated as Rambliense (Low Miocene) which is an irregular boudine-shape sized 11 m composed by hete-rogeneous sands modified by post-sedimentary processes. These sands host fossil bonds with uranium minerals. This Loranca deposit was formed by trans-ported fluvial sands containing fossil bonds. Later, the post-sedimentary tectonic and diagenetic processesbreak the bonds and remobilize several elements such as vanadium, uranium, iron and barium. Here we stu-died fragments of the fossil rhino Protaceratherium minutum, i.e., enamel, dentin, metapode, by X-ray Dif-fraction, being hydroxyapatite the enamel and franco-lite the dentine and metapode. The mineralogical com-position of the sediment is quartz (77%), microcline (22%) and calcite (1%). The radioactive yellow miner-al sited on fossil bonds and sediment was identified by XRD as Francevillite [(Ba,Pb)(UO2)2(V2O8)·5H2O] and was selected to be analyzed under ESEM-CL to learn on the combined effect of the uranyl (UO2) and vanadyl (V2O8) groups with barium and lead cations in comparison with other similar phosphates, arsenates and vanadates with uranyl groups and other cations.
ESEM-CL: The francevillite mineral is a phosphore-cent yellow coating onto the Loranca fossil bond [Ca5(PO4)3(OH)] (Figure a). Under the ESEM France-villite looks as perfect euhedric rhomboedral plates (Figure b). The fossil background, ie., hydroxyapatite and collagen, also contain vugs stuffed with baryte(BaSO4) (Figure c). Several spectra CL were recorded from franceville crystals (Figure c) exhibiting the cha-racteristic uranyl emission peaks at circa of 527, 545, 576, 596 nm with the low intensity attributable to the presence of large amounts of vanadium.
The tetravalent vanadium belongs to 3d1 ions beingisoelectronic with Ti3+ an emission spectrum attributed to V4+ consists of broad band peaking at 625nm and narrow lines at approximately 528 and 529nm.
References: Daams, R., Lacomba, J.L. & López, N. (1986). Nuevas faunas de micromamíferos del Terciario continentalde la Depresión Intermedia (Provincia de Cuenca, España centrooriental). Estudios Geol., 42: 181-196.
Gómez, J.J., Díaz Molina, M. & Lendínez, A. (1996). Tec-tono-sedimentary analysis of the Loranca Basin (Upper Oli-gocene-Miocene, Central Spain): a "non sequenced" foreland basin. En Tertiary basins of Spain (P. Friend y C.J. Dabrio, ed.). Cambridge University Press, 285-294.
29CORALS II Conference

MINERAL VARIATIONS STUDY OF CANELOBRE CAVE PHOSPHATE STALACTITES BY RAMAN
AND LUMINISCENCE METHODS. García-Antón, E.1, Cuezva, S.2, Fernández-Cortes, A1, Cuevas-González, J.2, Muñoz-Cervera, M.C.2, Benavente, D.2, Sanchez-Moral, S.1, Cañaveras, J.C.2. 1Museo Nacional Ciencias Naturales. CSIC. 28006-Madrid. Spain. 2Laboratorio de Petrología Aplicada, Unidad Asociada UA-CSIC, 08040-Alicante, Spain
Phosphate minerals are relatively abundant in caves although do not form spectacular free-standing speleothems. Phosphate stalactites found inside Canelobre cave (SE Spain) are here studied by hyperspectral Raman and Cathodoluminescence (CL). Together with XRD and EDS analyses we characterized the complex phosphate paragenesis present in these precipitates.
The studied stalactites show a typical concentric structure (Fig. 1b), with layers (50- 500 m thick) of phosphates in their inner zone showing massive to radial fibrous textures. Contact with calcite layers are irregular, indicating dissolutional processes. Hydroxylapatite [Ca5(PO4)3OH] and brushite [Ca(HPO4) · 2H2O] are the main phosphate minerals in the stalactites. XRD analyses also reveals the presence of taranakite [(K,NH4)Al3(PO4)3(OH) · 9H2O] and carbonate-hydroxylapatite [Ca5(PO4,CO3)3
(OH,O)]. XRD patterns of most of these minerals are similar, so the distinction between the two phosphates relies on Raman and luminiscence analyses.
CL analysis show as different curves as spot analysis were done. Calcium phosphate characteristic red luminescence between 574 and 582 nm have been obtained in several points with changeable intensity (Fig. 1a). That marks variability in concentration of Mn+2 replacing Ca II and presence of quenching agents (as Fe2+) that decrease luminescence [1]. Also calcite Uv-blue calcite structural emission near 360 nm peak [2] has been found at the interface zone (Fig. 1a). Raman curves confirms these mineralogical attributions: the 1080 peak corresponding to CO3
-2
vibration in calcite and the apatite 960 peak associated with carbonate substitution in A and B structural sites [2,3] (Fig. 1e). Raman line scan have been extracted from interface zone between two different phases showing the change in Raman spectra obtained from calcium phosphate to calcium carbonate (Fig 1 c, d and e). Both kind of analyses, CL and Raman, extract not easily interpretable spectra indicating the complex distribution of phosphate minerals. That reflects alteration or mixing of minerals presence. As bands of a Raman spectrum relate directly to the bond strengths and atomic masses, molecular groups such as the carbonate ion, the hydroxyl ion, and water of crystallization could be recognized in subsequent work as well as different phosphate mineral phases also could be distinguished. Brushite and taranakite form under acid conditions, on the contrary hydroxylapatite species indicates a slightly alkaline environment, so the coexistence of
the described minerals within the phosphate staslactite gives information about changes in the pH and relative humidity of the environment.
Fig 1. : a) Cathodoluminscence spectra obtained. b)
sample images and spot analyses localitation. c)
optical microscope image from the sample. d) Raman spectra line-scan from Ps3 to Ps4 image. e) Raman spectra from points Ps3 (phosphate minerals) and Ps4 (calcite).
Acknowledgements: Financial support by CGL2008- 05929/BTE MEC project.
References
[1] Gaft, M. et al. (2005) Modern Luminiscence Spectroscopy of Mynerals and Matherials, 50-55 and 58-62. [2] Porto, S.P.S. (1966) Depolaritation of Ramman Scatering in Calcite, Physical Review, Vol. 147, num 2, 608-611. [3] Awonusi, A. (2007) Carbonate Assignment and Calibration in the Raman Spectrum of Apatite, Calcified Tissue International, Vol. 81, Num. 1, 46-52.
30 LPI Contribution No. 1616

LUMINESCENT DETECTION OF ACTIVE STRESS IN MELILITE-ANORTHITE CAI GRAINS OF
ALLENDE CV3 CHONDRITE (MEXICO).
Garcia-Guinea J.1, Tormo L.1, J., Azumendi, O.2, Ruiz J.2, Museo Nacional Ciencias Naturales. CSIC. 28006. Madr-id. Spain. Dept. Geodinamica. Fac. C. Geologicas. Univ. Complutense 28040. Madrid. Spain Author for correspondence: [email protected]
Introduction: Calcium aluminum-rich inclusions (CAIs) are the oldest known materials formed in the Solar System (Petaev & Jacobsen, 2009). FoBs are important forsterite-bearing Type B CAIs because of their intermediate chemistry and refractory inclusions.The studied Allende CAI has Forsterite (Fo) grains Al-rich clinopyroxene (Cpx), spinel (Sp), Mg-rich melilite (Mel) and minor anorthite (An) intergrown with Cpx forming a core surrounding Fo-Cpx as a discontinuous Al-rich mantle of Mg-depleted melilite. Many melilite grains are almost completely pseudomorphed by gros-sular (Gr) and monticellite (Mo). Anorthite-melillitegrains shows zonings of extreme mineral chemical dis-equilibrium between their cores and mantles which could be producing the inferred Si O strained struc-tures as probable responsible emission-defects of the 340 nm CL emission peak.
Figure 1.- (a) Allende CV3 chondrite (b) FoB-CAI (c)
Melillite-Anothite grain (b) Matrix with Fo, CPx, Sp, An,
Me, Mo, Gr.
Spectra blue luminescence : We previously published on the luminescence emission band at 340 nm of stressed tectosilicate lattices (Garcia-Guinea et al., 2007) observed just only in stressed silicon oxygen lattices. The non-bridging-oxygen or silicon vacancy-hole centers associated with Si O strained structures are the probable responsible emission-defects. The 340 nm CL emission is rarely detected in stressed alumi-num-silicates and quartz with large amounts of Al3+--alkali+ substituying silicon. At low temperature sili-cates enhance its 340 nm peak by cryogenic stress. The
340 nm emission peak can be observed in microclinewith hatch-cross texture (Correcher et al., 1999).
ESEM-EDS analyses taken on the CL spots
Spectra CL plots of melilite-anorthite grains of FoB-CAI
in the Allende CV3 Chondrite (Mexico).
References: Petaev M. I., Jacobsen S. B. (2009) Petrologic study of SJ101, a new forsterite-bearing CAI from the Allende CV3 chon-drite. Geochim. Cosmochim. Acta, 73 5100 5114.
Correcher V., Garcia-Guinea J., Delgado A. and Sanchez-Muñoz L. (1999) Spectra thermoluminescence emissions and continuous trap distribution of a cross-hatch twinned low microcline. Rad. Protec. Dosim. 84, 503 506.
Garcia-Guinea J., Correcher V., Sanchez-Munoz L., Finch A.A., Hole D.E., Townsend P.D. (2007) Luminescence emission band at 340nm of stressed tectosilicate lattices. Nucl Instr Meth Phys Res A 580, 648 651.
31CORALS II Conference

NATURAL EARTH PIGMENTS FROM ROMAN AND ARABIC WALL PAINTINGS REVEALED BY SPECTROSCOPIC TECHNIQUES. I. Garofano1, A. Duran1, J.L. Perez-Rodriguez1 and M.D. Robador2
1Materials Science Institute of Seville, Americo Vespucio 49, 41092 Seville, Spain [email protected] 2TechnicalArchitecture Faculty, University of Seville, Reina Mercedes 4, 41002 Seville, Spain
Introduction: Natural earths and minerals have been used as pigments since prehistoric times. They have been found in works of art everywhere and in any historical period due to their availability, high colouring capacity and stability [1]. The main aims of this work are the identification and comparative study of the pigments used in Roman and Arabic wall paintings by only using spectroscopic methods. In this form, a multi-analytical approach including micro-Raman, FT-Infrared and UV-visible, accomplished by chromatic studies, provided complete information on the compositions of the paintings, which can be regarded as a powerful tool for conservators, restorers, art historians and archaeologists.
Experimental: Fragments from Roman wall paintings of Reales Alcazares Palace in Seville (1st
century B.C.) and Pompeii Houses (2nd century B.C.) were studied. In addition, we studied some Arabic wall painting fragments (11th century A.D.), also collected from Reales Alcazares Palace. The dispersive integrated Horiba Jobin-Yvon LabRam HR 800 system was employed for recording the Raman spectra directly on the fragments. Lasers emitting at 532.1 nm (green) and at 784.6 nm (red) were used. An optical microscope was coupled confocally to the Raman spectrometer. FTIR spectra were collected using a Jasco FT-IR-6200 FV spectrometer (DTGS detector). KBr was mixed with powder samples for performing these experiments. UV-Vis spectra (Cary 100, Varian) were recorded in the diffuse reflectance mode. Powder samples were mixed with BaSO4 that does not absorb in the UV-Vis range. The chromatic characterization was determined over the fragments using a Dr Lange Neurtek model LMC3/DIAM 5 portable spectrometer that produces normalized D65 light.
Results: Raman spectroscopy allowed the indistinguishable identification of the majority of the pigments found in the paintings: hematite (bands at 227, 245, 294, 300, 409, 610 cm-1), goethite (287, 303, 397, 469 cm-1), vermilion (257, 290, 347 cm-1), carbon black (1325, 1592 cm-1), Egyptian blue (431, 1085 cm-
1), calcite (277, 710, 1083 cm-1).We used infrared spectroscopy to distinguish the
presence of ochre colours (clays mixed with hematite or goethite) by the detection of bands associated to clays (hydroxyl ions: 3695, 3648, 3617, 3352, 3418, 3185 cm-1, and aluminosilicates: 1032 cm-1). Green earth was also identified by FTIR due to the detection of absorption bands assigned to celadonite (3601, 3556, 3531, 1106, 1075, 961, 799, 683 cm-1) and glauconite (3615, 3531, 979, 962 cm-1). However, poor Raman spectra were obtained for the green colour fragments. FTIR band-shoulder at 1025 cm-1, observed in the black fragment, could be attributed to the presence of phosphate groups (ivory black).
Red ochre, yellow ochre, vermilion, green earth, carbon black, ivory black, Egyptian blue and calcite were the compounds detected in the Roman wall paintings, while hematite and calcite were observed in the Arabic ones (the ornamentation palette of all Islamic buildings is dichromatic, usually red and white).
UV-Vis and chromatic studies agree with the results found with the other experimental techniques.
dom (dominant wavelengths) are in the adequate zone within the visible region (400-800 nm) in all the cases, and CIE L*a*b* parameters match with those from pigments described in the literature. These latter studies permitted to identify slight variations of hue attributed to mixtures of pigments, such as in the case of blue and green fragments.
Conclusions: The combined application of the above mentioned spectroscopy methods allowed a full characterization of the pigments employed by Romans and Arabs in the wall paintings studied. Natural earths and minerals were the pigments mainly employed by both civilizations although some differences were found. The identification could help in tracing the possible routes of pigments origin and diffusion. The present work is one of the first articles devoted to the study of both Roman and Arabic wall paintings by using exclusively spectroscopic methods.
200 300 400 500 600 700
Fig 1: Raman spectra of: (a) red Arabic fragment (hematite) (b)yellow Roman fragment (goethite) (c) red Roman fragment
(vermilion)
Ram
an In
tens
ity
Wavenumber / cm-1
ab
cReferences: [1] Genestar C., Pons C. (2005) Anal.
Bioanal. Chem. 382, 269-274.
32 LPI Contribution No. 1616

RAMAN SPECTROSCOPY AND MICROPROBE INVESTIGATION OF THE INCORPORATION OF Cr (VI) IN CaCO3. A. M. Gigler1, N. Sánchez-Pastor2, J. A. Cruz2, and L. Fernández-Díaz2. 1 CeNS and Depart-ment for Earth and Environmental Sciences, Ludwig-Maximilians-Universität. 80333, Munich (Germany), 2 Depar-tamento de Cristalografía y Mineralogía. Universidad Complutense de Madrid. 28040, Madrid (Spain).
Introduction. Due to its high mobility and toxic ef-fects even in low concentrations, hexavalent chromium (Cr (VI)) is known as one of the most common envi-ronmental contaminants resulting from its widespread use in industrial applications. Cr (VI) compounds are used mainly because of their acidic properties and their ability to form intensely colored and insoluble salts.
Experimental. The crystallization experiments were performed in a double diffusion system [1]. Dif-ferent concentrations of Na2CrO4 (0.1, 0.15, and 0.2 M) were added to the sodium silicate solution dur-ing the gel preparation. Two months after the nuclea-tion, crystals comprising a representative range ofmorphologies with different intensities in yellow color were hand-picked from the gel. Their morphology was studied by scanning electron microscopy and the Cr concentration of the crystals and the development of zoning were analyzed by electron microprobe. A con-focal Raman microscope was used to identify the Ca-CO3 polymorphs and to investigate the zoning in the crystals.
Results and discussion. All spectra revealed the characteristic peak of calcite at 1085 cm-1 which is caused by the symmetric stretching vibration of thecarbonate group. Furthermore, we observed peaks at 280 cm-1 and 711 cm-1 corresponding to the translational and rotational lattice mode vibrations and to the internal translational modes of in-plane bending of the carbonate ions, respectively. In Figure 1, a close up of the ν2 region (peaks between 700 and 1100 cm-1) of these samples together with the main vibrationalmodes for chromatite as a reference is shown. The chromatite spectrum was obtained from a natural sample. In addition to the calcite bands mentioned above, some weak Raman bands appear between 850 and 925 cm-1. As mentioned by Urmos et al. [2], the ν2 band at 875 cm-1 is not allowed in the Raman spectra of crystals with calcite structure. However, this vibrational mode at 875 cm-1 is the most intense in chromatite and could be assigned to the ν1 symmetric stretching vibration of CrO4. Some additional weak bands are also present. Frost and Weiner described the Raman spectra of the CrO stretching region of some chromate-bearing minerals [3] In this region the band position varies from 825 to 972 cm-1 depending on the mineral. We found three main bands at 855, 875, and975 cm-1. The first two agree well with those enunciated by Frost and Weiner and subsequently, the new bands represent the incorporation of Cr (VI) into
the calcite structure as chromate groups. Furthermore, Wang et al. conducted a Raman spectroscopic study to distinguish the chromate species on Cr-MCM-41 synthesized by a direct hydrothermal synthesis method [4] In this work, the band at 980 cm-1 was assigned to the Cr-O vibration stretching of the dehydrogenatedmonochromate species (CrO4
2-). Thus, the third more intense band found in our spectra can be also correlated with the presence of Cr (VI) in the structure. These hypotheses are supported by the fact of the different intensities of the new bands. As can be observed in Figure 1, the intensity of the new peaks can be correlated to the content of Cr (VI) in the gel medium.
To investigate the possible zoning of the calcite crystals, a yellow crystal from the experiments with higher Cr concentration (0.2 M) was analyzed in detail by Raman and microprobe mapping. The electron microprobe showed that the inner part is Cr rich, while pure calcite is present in the outer regions. Moreover, a Raman profile was obtained from the same crystal and the analysis is perfectly correlated with the micropobe analysis.
Conclusions. i. Our results confirm the suitability of Raman spectroscopy to characterize the incorpora-tion of impurities in carbonate phases and, ii. The in-corporation of Cr is evidenced by the appearance ofnew vibrational bands in the calcite spectrum, which are consistent with the substitution of carbonate groups by chromate groups.
Figure 1. Close up of the ν2 region with the main vibrational modes for chromatite superimposed.
References. [1] Henisch, H.K. and García-Ruíz, J.M. (1986) J.
Cryst. Growth. 75, 195-202. [2] Urmos, J. et al. (1991) Am. Mineral. 76, 641-646. [3] Frost, R.L., and Weier, M. (2004) Neues Jahrbuch Min. 12, 575-594. [4] Wang, Z. et al. (2002) J. Biol. Chem. 277, 24022-24029.
33CORALS II Conference

RAMAN MICROSCOPY OF SHOCKED AND UNSHOCKED BASALTS FROM LONAR CRATER, INDIA. T. D. Glotch1 and M. J. Ferrari1, 1Stony Brook University, Stony Brook, NY 11794-2100, [email protected]
Introduction: Mars, the Moon, and other planeta-ry bodies have been subjected to intense bombardment by meteorites throughout their histories. Understanding the effects of this bombardment on the crystal struc-tures of target materials is a first-order problem in pla-netary science that has important implications for pla-netary remote sensing and in situ mineralogical studies.
Within the the ejecta of Lonar Crater are basaltic rocks shocked at intermediate pressures of 20-80 GPa [1]. Other terrestrial impact craters primarily occur in typical continental crust or sedimentary settings. The basaltic composition of the Lonar impact crater makes it the only terrestrial impact analog suitable for under-standing the effects of impact on the composition of the Martian basaltic crust and lunar mare.
Several studies have detailed the mid-IR spectros-copic properties of synthetically shocked plagioclase feldspar and pyroxene-rich samples and basalts [2-4]. Recent studies have also detailed the macroscopic mid-IR spectral properties of naturally shocked basalts from Lonar Crater [1,5]. Here, we provide micro-Raman data for both shocked and unshocked basalts from Lo-nar Crater. These data provide a detailed view of the petrography of Lonar samples and indicate that the effects of shock are not homogenous throughout the material undergoing shock compression.
Samples and Methods: We analyzed several sam-ples of shocked and unshocked basalt from Lonar Cra-ter collected by S. P. Wright and described further in [6]. Three samples, LC09-206, LC09-207, and LC09-284 were selected for analysis. LC09-206 and LC09-284 are shock class 2 samples (20-40 GPa shock pres-sure) [7], while LC09-207 is an unshocked basalt col-lected in the same suevite breccia outcrop as the other two shocked basalts that displays a minor amount of weathering. Samples were cut and polished into thick sections with a roughness of 0.25 μm.
Each sample was examined using the Stony Brook University Vibrational Spectroscopy Laboratory (VSL)WiTEC alpha300R confocal Raman microscope sys-tem equipped with a 50 mW frequency doubled 532 nm Nd:YAG excitation laser. This Raman imaging spectrometer is capable of acquiring spectra from ~8000- -1 and is equipped with multiple objec-tive lenses enabling spatial resolutions between several microns and 260 nm/pixel.
Results and Discussion: Both LC09-206 and LC09-284 contain abundant maskelynite (feldspathic glass) formed as a result of the shock process. These samples also contain unshocked clinopyroxene and and
melt glass, either in veins or pockets. Figure 1 shows background-removed labradorite and augite spectra (705 nm spot size) from the unshocked LC09-207sample and maskelynite and melt glass spectra from the shocked LC09-206 sample. The maskelynite and melt glass Raman spectra differ, with maskelynite display-ing broad peaks be -1 and ~900-
-1. The melt glass spectrum displays a com--1and a
weaker, broader peak cen -1. Both spectra differ markedly from the crystalline spectra from the unshocked sample. Future work will concen-trate on creating Raman maps with sub-μm spatial resolution in an effort to determine the effects of shock on potential accessory minerals and to study the effects of aquesous weathering on these samples and corellat-ing results with micro-FTIR studies of the same sam-ples [8].
Figure 1. Micro-Raman spectra acquired from sam-ples LC09-284 (labradorite and augite) and LC09-206(maskelynite and melt glass). Spectra were acquired using a 532 nm excitation laser and a 20 X, 0.46 N.A. objective, leading to a 705 nm spot size.
References: [1] Wright S. P. et al. (2008) LPS XXXIX, Abstract 2330. [2] Johnson J. R. et al. (2002) JGR, 107(E10), 5073. [3] Johnson J. R. et al. (2003) Am. Miner., 88, 1575-1582. [4] Johnson J. R. et al. (2007) Am. Miner, 92, 1148-1157. [5] Wright S. P. et al. (2011) JGR, in review. [6] Wright S. P. and H. E.Newsom (2011) LPS XLII, Abstract 1619. [7] Kieffer S. W. (1976) LPS VII, 1391-1412. [8] Glotch, T. D. et al. (2011) LPS XLII, Abstract 1566.
34 LPI Contribution No. 1616
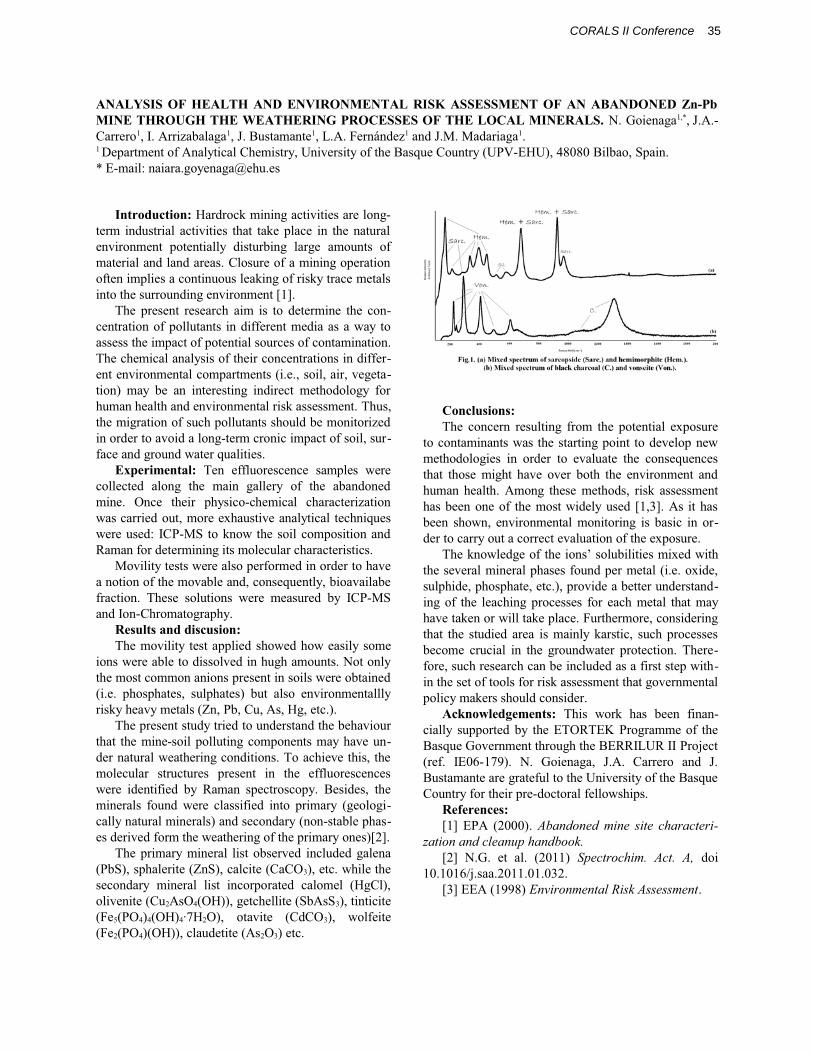
&'&*+/0/6796;<&*=;6&'>6<'?0@7'J<'=&*6@0/K6&//<//J<'=6796&'6&Q&'>7'<>6WZ\^_6
J0'<6=;@7`j;6=;<6q<&=;<@0'j6^@7z<//</6796=;<6*7z&*6J0'<@&*/{6¦§¨©ª«¬¯°¯²³´³¨µ§¶§¸¹¯»»¬»ª²³¨¼§¨¶»»«½¯¾¯¿¯°¯²³¨µ§¨ÀÁÂïįì²³¨Å§¶§¨Æ¬»ÇȬ½²¨¯È¨µ§É§¨É¯È¯»«¯°¯²§¨²¨Ê¬Ë¯»ÃĬèªÌ¨¶¯¿Íëί¿¨¹Ï¬Ä«Âûͳ¨Ð«Ñ¬»Â«ÃͨªÌ¨ÃϬ¨À¯ÂÒÁ¬¨¹ªÁûͨÓÐÔÕ¸Ö×Ðس¨ÙÚÛÚÛ¨À«¿¾¯ª³¨Ü˯«§´¨Ö¸Ä¯«¿Ý¨¯«¯»¯§°ªÍ¬¯°¯Þ¬ÏÁ§¬Â
0Z|}~���|�~Z�¨×¯»È»ªÎߨī«°¨¯Îëѫë¬Â¨¯»¬¨¿ª°¸Ã¬»Ä¨«ÈÁÂû«¯¿¨¯Îëѫë¬Â¨Ãϯèï߬¨Ë¿¯Î¬¨«¨ÃϬ¨¯ÃÁ»¯¿¨¬Ñ«»ªÄ¬Ã ¨ ˪ì믿¿Í ¨ È«ÂÃÁ»¾«° ¨ ¿¯»°¬ ¨ ¯ÄªÁਠªÌ¨Ä¯Ã¬»«¯¿¨¯È¨¿¯È¨¯»¬¯Â§¨¹¿ªÂÁ»¬¨ªÌ¨¯¨Ä««°¨ªË¬»¯Ã«ª¨ªÌ쨫ÄË¿«¬Â¨¯¨ÎªÃ«ÁªÁ¨¿¬¯ß«°¨ªÌ¨»«Âßͨû¯Î¬¨Ä¬Ã¯¿Â¨«Ãª¨ÃϬ¨ÂÁ»»ªÁÈ«°¨¬Ñ«»ªÄ¬Ã¨à²â§
ãϬ¨Ë»¬Â¬Ã¨»¬Â¬¯»ÎϨ ¯«Ä¨«Â¨Ãª¨È¬Ã¬»Ä«¬¨ÃϬ¨Îª¸Î¬Ã»¯Ã«ª¨ªÌ¨Ëª¿¿Áï諨ȫÌ̬»¬Ã¨Ä¬È«¯¨¯Â¨¯¨å¯Í¨Ãª¨¯Â¬Â¨ÃϬ¨«Ä˯ÎèªÌ¨ËªÃ¬Ã«¯¿¨ÂªÁ»Î¬Â¨ªÌ¨ÎªÃ¯Ä«¯Ã«ª§¨ãϬ¨ÎϬīί¿¨¯¯¿ÍǬªÌ¨ÃϬ«»¨ÎªÎ¬Ã»¯Ã«ªÂ¨«¨È«Ì̬»¸¬Ã¨¬Ñ«»ªÄ¬Ã¯¿¨ÎªÄ˯»ÃĬèӫ§¬§³¨Âª«¿³¨¯«»³¨Ñ¬°¬Ã¯¸Ã«ªØ¨Ä¯Í¨¾¬¨¯¨«Ã¬»¬Âë°¨«È«»¬Îà ¨Ä¬ÃϪȪ¿ª°Í¨Ìª»¨ÏÁį¨Ï¬¯¿ÃϨ¯È¨¬Ñ«»ªÄ¬Ã¯¿¨»«Âߨ¯Â¬ÂÂĬç¨ãÏÁ³¨ÃϬ¨Ä«°»¯Ã«ª¨ªÌ¨ÂÁÎϨ˪¿¿ÁïèÂϪÁ¿È¨¾¬¨Äª«Ãª»«½¬È¨«¨ª»È¬»¨Ãª¨¯Ñª«È¨¯¨¿ª°¸Ã¬»Ä¨Î»ª«Î¨«Ä˯ÎèªÌ¨Âª«¿³¨ÂÁ»¸Ì¯Î¬¨¯È¨°»ªÁȨå¯Ã¬»¨ÒÁ¯¿«Ã«¬Â§
<���}���Z|���¨ 㬠¨ ¬ÌÌ¿Áª»¬Âάά ¨ ¯ÄË¿¬Â ¨ 嬻¬¨Îª¿¿¬ÎÃ¬È ¨ ¯¿ª° ¨ ÃϬ ¨ į« ¨ °¯¿¿¬»Í ¨ ªÌ ¨ ÃϬ ¨ ¯¾¯Èª¬È¨Ä«¬§ ¨ æά ¨ ÃϬ«» ¨ ËÏÍ«Ϊ¸ÎϬīί¿ ¨ Îϯ»¯Î컫½¯Ã«ª¨å¯Â¨Î¯»»«¬È¨ªÁó¨Äª»¬¨¬çϯÁÂëѬ¨¯¯¿Íëί¿¨Ã¬ÎÏ«ÒÁ¬Â¨å¬»¬¨Á¬Èݨ¼¹Ô¸Éܨê¨ßªå¨ÃϬ¨Âª«¿¨ÎªÄ˪«ëª¨¯È¨è¯Ä¯¨Ìª»¨È¬Ã¬»Ä««°¨«Ã¨Ī¿¬ÎÁ¿¯»¨Îϯ»¯Î컫ÂëΧ
ɪѫ¿«ÃͨìÂè嬻¬¨¯¿Âª¨Ë¬»Ìª»Ä¬È¨«¨ª»È¬»¨Ãª¨Ï¯Ñ¬¨¯¨ªÃ«ª¨ªÌ¨ÃϬ¨ÄªÑ¯¾¿¬¨¯È³¨ÎªÂ¬ÒÁ¬Ã¿Í³¨¾«ª¯Ñ¯«¿¯¾¬¨Ì»¯Î몧 ¨ãϬ¬ ¨Âª¿ÁëªÂ ¨å¬»¬ ¨Ä¬¯ÂÁ»¬È ¨¾Í¨ ¼¹Ô¸Éܨ¯È¨¼ª¸¹Ï»ªÄ¯Ãª°»¯ËÏͧ
@����|�6�Z�6�������~Z�¨ãϬ¨ÄªÑ«¿«ÃͨìÂè¯ËË¿«¬È¨ÂϪå¬È¨Ïªå¨¬¯Â«¿Í¨ÂªÄ¬¨
«ªÂ¨å¬»¬¨¯¾¿¬¨Ãª¨È«Âª¿Ñ¬È¨«¨ÏÁ°Ï¨¯ÄªÁ稦ªÃ¨ª¿Í¨ÃϬ¨ÄªÂèΪÄĪ¨¯«ªÂ¨Ë»¬Â¬Ã¨«¨Âª«¿Â¨å¬»¬¨ª¾Ã¯«¬È¨Ó«§¬§ ¨ËϪÂËϯì³ ¨ ÂÁ¿ËϯìÂØ ¨¾Áà ¨¯¿Âª ¨¬Ñ«»ªÄ¬Ã¯¿¿¿Í¨»«ÂßͨϬ¯ÑͨĬï¿Â¨Ó鳨Ծ³¨¹Á³¨¶Â³¨×°³¨¬ÃΧا¨
ãϬ¨Ë»¬Â¬Ã¨ÂÃÁÈͨû«¬È¨Ãª¨ÁȬ»ÂïȨÃϬ¨¾¬Ï¯Ñ«ªÁ»¨ÃϯèÃϬ¨Ä«¬¸Âª«¿¨Ëª¿¿Á밨ΪÄ˪¬Ã¨įͨϯѬ¨Á¸È¬»¨¯ÃÁ»¯¿¨å¬¯ÃϬ»«°¨ÎªÈ«Ã«ªÂ§¨ãª¨¯ÎÏ«¬Ñ¬¨Ãϫ³¨ÃϬ¨Äª¿¬ÎÁ¿¯» ¨ ÂûÁÎÃÁ»¬Â ¨ Ë»¬Â¬Ã ¨ « ¨ ÃϬ ¨ ¬ÌÌ¿Áª»¬Âάά¨嬻¬¨ «È¬Ã«Ì«¬È¨¾Í¨è¯Ä¯¨ÂˬÎûªÂΪËͧ ¨À¬Â«È¬Â³ ¨ ÃϬ¨Ä«¬»¯¿Â¨ÌªÁȨ嬻¬¨Î¿¯Â«̫¬È¨«Ãª¨Ë»«Ä¯»Í¨Ó°¬ª¿ª°«¸Î¯¿¿Í¨¯ÃÁ»¯¿¨Ä«¬»¯¿Âب¯È¨Â¬ÎªÈ¯»Í¨Óª¸Â﾿¬¨Ëϯ¸¬Â¨È¬»«Ñ¬È¨Ìª»Ä¨ÃϬ¨å¬¯ÃϬ»«°¨ªÌ¨ÃϬ¨Ë»«Ä¯»Í¨ª¬ÂØàêâ§
ãϬ¨Ë»«Ä¯»Í¨Ä«¬»¯¿¨¿«Â誾¬»Ñ¬È¨«Î¿ÁȬȨ°¯¿¬¯¨ÓÔ¾Üس¨ÂËϯ¿¬»«Ã¬¨ÓéÜس¨Î¯¿Î«Ã¬¨Ó¹¯¹æëس¨¬ÃΧ¨åÏ«¿¬¨ÃϬ¨Â¬ÎªÈ¯»Í ¨ Ä«¬»¯¿ ¨ ¿«Âà ¨ «Îª»Ëª»¯Ã¬È ¨ ί¿ªÄ¬¿ ¨ Ó×°¹¿Ø³¨ª¿«Ñ¬«Ã¬¨Ó¹Áê¶ÂæÙÓæ×Øس¨°¬ÃÎϬ¿¿«Ã¬¨Óܾ¶ÂÜëس¨Ã«Ã«Î«Ã¬¨ÓƬìÓÔæÙØÙÓæ×ØÙîï×êæس ¨ ªÃ¯Ñ«Ã¬ ¨ ӹȹæëس ¨ 媿̬«Ã¬¨ÓƬêÓÔæÙØÓæ×Øس¨Î¿¯ÁȬëì¨Ó¶Âêæëب¬ÃΧ
z~Z�����~Z��6
ãϬ¨ÎªÎ¬»¨»¬ÂÁ¿Ã«°¨Ì»ªÄ¨ ÃϬ¨ËªÃ¬Ã«¯¿¨¬ç˪ÂÁ»¬¨Ãª¨ÎªÃ¯Ä«¯Ã¨å¯Â¨ÃϬ¨Âï»Ã«°¨Ëª«Ã¨Ãª¨È¬Ñ¬¿ªË¨¬å¨Ä¬ÃϪȪ¿ª°«¬Â ¨ «¨ª»È¬» ¨ ꨬѯ¿Á¯Ã¬¨ ÃϬ¨ÎªÂ¬ÒÁ¬Î¬Â¨ÃϯèÃϪ¬¨Ä«°ÏèϯѬ¨ªÑ¬»¨¾ªÃϨÃϬ¨¬Ñ«»ªÄ¬Ã¨¯È¨ÏÁį¨Ï¬¯¿Ãϧ¨¶Äª°¨ÃϬ¬¨Ä¬ÃϪȳ¨»«Âߨ¯Â¬ÂÂĬèϯ¨¾¬¬¨ª¬¨ªÌ¨ÃϬ¨ÄªÂèå«È¬¿Í¨Á¬Ȩಳë⧨¶Â¨«Ã¨Ï¯Â¨¾¬¬¨ÂϪ峨¬Ñ«»ªÄ¬Ã¯¿¨Äª«Ãª»«°¨«Â¨¾¯Â«Î¨«¨ª»¸È¬»¨Ãª¨Î¯»»Í¨ªÁ诨Ϊ»»¬Îè¬Ñ¯¿Á¯Ã«ª¨ªÌ¨ÃϬ¨¬ç˪ÂÁ»¬§¨¨
ãϬ¨ßªå¿¬È°¬¨ªÌ¨ÃϬ¨«ªÂð¨Âª¿Á¾«¿«Ã«¬Â¨Ä«ç¬È¨å«ÃϨÃϬ¨Â¬Ñ¬»¯¿¨Ä«¬»¯¿¨Ëϯ¬¨̪ÁȨˬ»¨Ä¬Ã¯¿¨Ó«§¬§¨ªç«È¬³¨ÂÁ¿ËϫȬ³¨ËϪÂËϯ쳨¬ÃΧس¨Ë»ªÑ«È¬¨¯¨¾¬Ã컨ÁȬ»Âïȸ«°¨ªÌ¨ÃϬ¨¿¬¯ÎÏ«°¨Ë»ªÎ¬Â¬¨̪»¨¬¯ÎϨĬ│ÃϯèįͨϯѬ¨Ã¯ß¬¨ª»¨å«¿¿¨Ã¯ß¬¨Ë¿¯Î¬§¨ÆÁ»ÃϬ»Äª»¬³¨ÎªÂ«È¬»«°¨ÃϯèÃϬ¨ÂÃÁÈ«¬È¨¯»¬¯¨«Â¨Ä¯«¿Í¨ß¯»Âëγ¨ÂÁÎϨ˻ªÎ¬Â¬¾¬ÎªÄ¬¨Î»ÁΫ¯¿¨«¨ÃϬ¨°»ªÁÈå¯Ã¬»¨Ë»ªÃ¬Î몧¨ãϬ»¬¸Ìª»¬³¨ÂÁÎϨ»¬Â¬¯»ÎϨί¨¾¬¨«Î¿ÁȬȨ¯Â¨¯¨Ì«»ÂèÂì˨å«Ãϸ«¨ÃϬ¨Â¬Ã¨ªÌ¨Ãªª¿Â¨Ìª»¨»«Âߨ¯Â¬ÂÂĬèÃϯ谪Ѭ»Ä¬Ã¯¿¨Ëª¿«Îͨį߬»Â¨ÂϪÁ¿È¨ÎªÂ«È¬»§
&��Z~��������Z|�� 6ãÏ«Â ¨ åª»ß ¨ ϯ ¨ ¾¬¬ ¨ Ì«¯¸Î«¯¿¿Í¨ÂÁË˪»Ã¬È¨¾Í¨ÃϬ¨ÖãæèãÖò¨Ô»ª°»¯ÄĬ¨ªÌ¨ÃϬ¨À¯ÂÒÁ¬¨©ªÑ¬»Ä¬Ã¨ÃÏ»ªÁ°Ï¨ÃϬ¨ÀÖèè¼ÅÐ証¼¨Ô»ªô¬Îèӻ¬Ì§ ¨ ¼ÖÛõ¸²ïöا ¨ ¦§ ¨ ©ª«¬¯°¯³ ¨ µ§¶§ ¨ ¹¯»»¬»ª ¨ ¯È ¨ µ§¨ÀÁÂïį쨯»¬¨°»¯Ã¬ÌÁ¿¨Ãª¨ÃϬ¨Ð«Ñ¬»Â«ÃͨªÌ¨ÃϬ¨À¯ÂÒÁ¬¨¹ªÁû̪ͨ»¨ÃϬ«»¨Ë»¬¸ÈªÎ껯¿¨Ì¬¿¿ªåÂϫ˧¨
@���}�Z����¨à²â¨ÖÔ¶¨ÓêÛÛÛا ¨�!"#$%#'$*+<#'*=<>'*?K"W"?>'W<Y
Z"><%#*"#$*?['"#\]*K"#$!%%^_àêâ ¨ ¦§©§ ¨ ¬Ã ¨ ¯¿§ ¨ ÓêÛ²²Ø ¨`]'?>W%?K<+_ * �?>_ * �j¨ Ȫ«¨
²Û§²Û²õ÷ô§Â¯¯§êÛ²²§Û²§Ûëê§àëâ¨ÖÖ¶¨Ó²ööÚب{#|<W%#+'#>"[*}<=^*�=='==+'#>§
35CORALS II Conference

RELATIONS BETWEEN LEACHATED COMPOUNDS AND RAMAN SPECTRUM OF BLACK SLAGS FROM EAF IN ORDER TO CHARACTERIZE THEM. L. Gómez-Nubla 1, J. Aramendia, S. Fdez-Ortiz de Vallejuelo, K. Castro and J. M. Madariaga. Department of Analytical Chemistry, University of the Basque Country (UPV/EHU), P.O. Box 644, E-48080 Bilbao, Basque Country, Spain. Tel.:+34 94 601 82 97; Fax: +34 94 601 35 00
1E-mail address: [email protected]
The black slags are a by-product of the steel fabri-cation. In this case they are produced in the fusion process by means of Electric Arc Furnace (E.A.F.). This type of material has a high strength and due to its durability and chemistry has been used as construction material and more recently, as a cement additive, land-fill cover material, and for agricultural applications [1-3]. In spite of this fact, they present some difficulties due to their volume instability and leaching of elements from them. So it should be considered the possible impact in soils and nearby drinking or surface waters where black slags have been used [4, 5] or deposited in dumping sites.
In this study have been analyzed samples from two different industries: ordinary steel industry and special steel industry. In both cases, original and treated black slags were provided us. The ordinary steel treatment consisted of outdoor cooling, water, crushing, sifting and magnetic separation of ironed materials. In the case of special steel treatment, it was only based on cooling outdoor and water. Apart from these, some black slags were picked up in two locations of Vizcaya (Basque Country, Spain). These samples were consid-ered treated due to were collected in construction works, and in order to be used they must be subject of treatment according to the legislation [6].
It was carried out a molecular characterization of all these black slags through Raman Spectroscopy Ren-ishaw RA 100, (Oxford, UK) and an InnoRaman ul-tramobile spectrometer (B&WTEKINC, Newark, USA). The spectrums indicated a bigger presence of hydrox-ides in treated slags than in the slag without treatment: lepidocrocite, goethite, limonite, etc.
Moreover, it was realized a leaching with Milli-Q water as extractant to reproduce the conditions that are given in the nature. The concentrations of released el-ements from the black slags were obtained by means of Inductively Coupled Plasma Mass Spectrometry (ICP-MS) and ionic chromatography (CI). With these data was made a statistical treatment: correlation analysis between cations (Al, Ba, B, Cr, Cu, Fe, K, Li, Mg, Mn, Mo, Na, Ni, Pb, Sb, Sn, Sr, Ti, V, W, Zn and Ca) and anions (F-, Cl-, NO3
- and SO42-). It was compared
which cations and anions were relationated with the compounds identified in the Raman spectrums obtained previously. It was observed, among others, a high cor-relation between iron and calcium, boron and barium, nickel and iron, sulfate and calcium… This last corre-
lation corroborated the presence of gypsum (CaSO4) appeared in the Raman spectrum .
Finally, it was made a parallel valoration with H2SO4 and NaOH, in order to determinate the carbon-ates contained in the black slags. After that, it was speculated about the acid gas attack over these carbon-ates, forming compounds that with the leaching could arrive to unbalance the environmental where the black slags had been deposited [7].
Figure 1. Raman spectrum of magnesioferrite (MG) together with typical silicates Raman bands of the
black slags (right side). References [1] Tsakiridis P.E. et al. (2008) J. Hazard Mater. 152, 805-811. [2] Sofilic T. et al. (2010) J. Radioanal. Nucl. Chem. 284, 73-77. [3] Van der Waals J.H. and Claassens A.S. (2003) Mining and the Environment III. [4] Tossavainen M. et al. (2007) Waste Manage. 27,1335-1344. [5] Proctor D. M. et al. (2000) Environ. Sci. Technol, 34, 1576-1582. [6] BOPV, 2003. N4. Decreto 34/2003 (Comunidad Autónoma del País Vas-co) (http://www.euskadi.net). [7] Sarmiento A. et al. (2008) J.Raman Spectrosc. 39, 1042-1049. Acknowledgements This work has been financially supported by Basque Government through ETORTEK BERRILUR 3 project (ref. IE10-273). L. Gomez -Nubla and J. Aramendia are grateful to the University of the Basque Country (UPV-EHU) and Basque Government respectively, for them predoctor fellowship.
36 LPI Contribution No. 1616
Trace Element and REE leaching during Diagenetic Albitization and its relationship to the Cathodoluminescence colour of Feldspars: the Tera Group,
Cameros Basin (NE Spain)
Authors: González-Acebrón, L.1, Barca, D. 2 Arribas, J.3; Mas, Ramón1
1 Dpto. Estratigrafía, Facultad de Ciencias Geológicas (UCM)- IGE, IGEO (CSIC), C/ Jose Antonio
Novais 2, 28040 Madrid (Spain)
2 Dipartimento di Ciencias de la Terra, Università de la Calabria (Italy).
3 Dpto. Petrología y Geoquímica, Facultad de Ciencias Geológicas (UCM)- IGE, IGEO (CSIC), C/ Jose
Antonio Novais 2, 28040 Madrid (Spain)
Corresponding author: Tel: (34)913944785. E-mail: [email protected] (L. González-Acebrón)
This study deals with the diagenetic albitization of both plagioclases and K-feldspars in the Tithonian fluvial sandstones of a rifted basin (Cameros Basin). A cathodoluminescence (CL) study of feldspars was performed using a cold instrument on sandstone thin sections. Trace elements and REE were studied on 300 m-thick sections involving simultaneous laser ablation and inductively coupled plasma mass spectrometry (ICP-MS).
The sandstones in the lower part of the rift record have not suffered the albitization process. A clear relationship is observed between sodium contents, as the main element of some feldspars, and their CL colour (the higher the sodium content, the lower is their CL). In addition, very different profiles are obtained when comparing trace elements of non-albitized feldspars in sandstones of the lower part of the rift record to those of albitized feldspars in sandstones of the infill top. Non-albitized K-feldspars show Rb, Sr, Ba, Pb contents up to 1000 ppm. In contrast, very flat profiles of trace element contents (<250 ppm) are recorded in albitized feldspars (both K-feldspars and plagioclases). Thus, albitization implies feldspars impoverished in trace elements, including REE. This impoverishment suggests leaching of most of the initial trace elements. In addition, partially albitized grains show albitized areas related to weak zones such as cleavage and fracture planes.
Albitized plagioclases show higher REE contents than albitized K-feldspars. According to the literature, non-albitized plagioclases are richer in REE than non-albitized K-feldspars. We report here that REE patterns partly depend on the initial composition of the feldspar (K-feldspar or plagioclase) as a useful geochemical criterion for distinguishing albitized detrital plagioclases from K-feldspars.
Albitized plagioclases are ridded with primary fluids inclusions, mainly all-liquid. Around 20% of the fluid inclusions feature a gas bubble, with liquid to vapour ratios between 95:5 and 85:15. Homogenization temperatures of cogenetic fluid inclusion assemblages indicate minimum albitization temperature around 83-115ºC. This temperature allowed the leaching of trace elements and REE during the albitization, interpreted as a dissolution and reprecipitation process. Additional work is carrying on determining CL colour relationship with CL spectra.
37CORALS II Conference

A COMBINED CATHODOLUMINESCENCE AND MICRO-RAMAN STUDY OF PLANAR DEFORMATION FEATURES IN QUARTZ. A. Gucsik1,2, T. Okumura3, M. Kayama3, H. Nishido3, K. Nina-gawa4, 1Department of Earth and Planetary Materials Science, Graduate School of Science, Tohoku University, Aoba 6-3, Aramaki, Aoba-ku, Sendai, 980-8578, Japan (E-mail: [email protected]); 2Konkoly Observa-tory of the Hungarian Academy of Sciences, H-1121, Budapest, Konkoly Thege Miklós út 15-17., Hungary; 3Research Institute of Natural Sciences, Okayama University of Science, 1-1 Ridai-cho, Okayama, 700-0005, Ja-pan; 4Department of Applied Physics, Okayama University of Science, 1-1 Ridai-cho, Okayama, 700-0005, Japan;
Introduction: The question of whether shock me-tamorphic effects may modify the luminescent nature of quartz under subsequent compression has been ad-dressed in a pioneering study of Boggs et al. [1] . Here, we report the first systematic experiments by means of the micro-Raman spectroscopy and Scan-ning Electron Microscopy-Cathodoluminescence mi-croscopy that investigate the effect of shock-induced amorphization to the electronic transitions in the high-pressure phase transitions. Up to now, phase transition studies of quartz have only used high-pressure polymorph of quartz (i.e., coesite, stishovite, etc.), not typical of shock-induced microdeformations (for instance, Planar Deformation Features-PDFs) in quartz as it is found in the target rocks of the terrestri-al impact craters.
Experimental Procedure: The Raman spectra were obtained using a Thermo Nicolet Almega con-focal micro-Raman spectrometer with a Nd:YAG-laser (20 mW at 532 nm) laser excitation system and a cooled CCD detector at 223K. SEM-CL images were collected using a Scanning Electron Microscope (SEM-JEOL 5410LV), equipped with a CL detector (Oxford Mono CL2), which comprises an integral 1200 grooves/mm grating monochromator attached to a reflecting light guide with a retractable paraboloidal mirror.
Results and Discussion: Raman spectra of shocked quartz exhibit a dominant peak at around 459 cm−1, whereas typical high-quartz has a sharp and intense peak at 464 cm−1, which can be assigned to O-Si-O stretching vibrational mode [2]. This frequency shift is related to a distortion of structural configura-tion such as formation of high density diaplectic SiO2
glass and/or amorphization associated with the occur-rence of glass-filled PDFs [2] as designated as green or blue stripes of Figure 1.
CL spectrum of shocked quartz contains two broad bands centered at 450 to 650 nm, which are assigned to presence of defect centers on, e.g., SiO4
groups. The dominant observed defects occur in the short-range order involving the slightly distorted SiO4
tetrahedra, which are common to both the crystallineand amorphous SiO2 structures [3]. We observed that
the CL emission, which is enhanced at a lower tem-perature (-192 °C), several hundred times more in-tense than that at room temperature (25 °C) due to temperature quenching effect. It gives a strong broad peak in the blue region with doublet apexes at 455 and 465 nm, which could be assigned to intrinsic emission bearing on the E'1 and E'2 centers [3]. Conclusion: The displacive phase transformation of quartz (i.e., trigonal-hexagonal transition at low tem-perature and high pressure) occurred in the PDFs has small symmetry and electronic structure-breaking dis-placements of atoms resulting non-radiative processes in the luminescence emission. This indicates that thenon-luminescence of the PDFs will increase with de-creasing temperature and increasing shock pressure. We noted that the combination of SEM-CL and micro-Raman techniques is a useful tool for the evaluation of the shock stages and identification of shock-induced microdeformations in the shock-deformed minerals, especially for the rock-forming minerals.
References: [1] Boggs et al. (2001) Meteoritics & Planet. Sci., 36,783-793. [2] Champagnon et al. (1996) J. Non-cryst. Solids 196, 221-226. [3] Kalceff et al. (2000) In Ca-thodoluminescence in Geosciences (eds. Pagel M., Barbin, V., Blanc, Ph. and Ohnenstetter, D.), Sprin-ger, p. 193-224 (2000).
Figure 1. SEM-CL image and a 2D Raman image (inlet) of PDFs in quartz from Ries meteorite crater,Germany.
PDF Created with deskPDF PDF Writer - Trial :: http://www.docudesk.com
38 LPI Contribution No. 1616

IN SITU μ-RAMAN OBSERVATION OF URANIUM DIOXIDE WEATHERING IN CONTACT WITH WATER AND UNDER ION BEAM IRRADIATIONG. Guimbretière*, A. Canizares, P. Simon, Y.A. Tobon-Correa, M.-R. Ammar, C. Corbel and M. F. BartheCNRS UPR 3079, Conditions Extrêmes et Matériaux – Haute Température et Irradiation, 45071 Orléans Cedex 2 * [email protected]
Earth and space environment are sometimes the frame of extreme conditions of temperature, pression and irradiation. In situ characterizations are necessary for a better understanding of the structural and chemi-cal changes induced by such extreme environmental conditions. This paper deals with in situ Raman charac-terization of a material exposed to ionic irradiation.
Fig.1 : In situ irradiation μ-Raman head with the cyc-lotron beam radiolyse cell.
One topic where the irradiation effect is a key-point is the study of the uranium mobility in the geosphere:Naturally, uranium exists in concentrations of a few ppm in soil, rock and water (more than 4 107 t as ore and 4.5 1012 t in sea water). Besides, the human activi-ties induces a release of uranium ores and secondary weathering products to the surface environment. It is well known that exposed to oxidizing conditions, tetravalent U(IV) present in uraninite and UO2 spent nuclear fuel is incorporated in common alteration products as U(VI) –phases, up to form an assemblageof secondary uranyls minerals with chemical composi-tions indicative of the local environment. These uranyl phases are more soluble than U(IV) material and thus, this leads to an increase in mobility of uranium togroundwater and soil. For these reasons, the impactstudies of the environment on the hydration-oxidation weathering of uranium minerals is of first importance. For uranium compounds, deal with the environmental condition mean dealing with irradiation [1]: Indeed, uranium is naturaly weakly α radioactive with more than 100’s million years half-life. Then, uranium prod-ucts are the most often exposed to self-irradiation or irradiation from neighbouring active actinide products. Unfortunatelly, the possibilities to observe over time
the effects of weak radio-activity as in the natural fis-sion reactors of Oklo (Gabon) are infrequent. Effects of ionic irradiation can then be simulated by accelerator ionic beam, where high flux allows to simulate in ashort time the dose and fluence of long time naturalexposure. The sparsity of appropriate natural condi-tions and the experimental complexity of in situ ion beam characterization may explain the only few works on this topic.
Fig.2: In situ Raman kinetic of the UO2/water interface during and after irradiation. Colors represent Raman intensity and y-axis the time (one spectrum by 2 min).
Therefore, a significant part of this paper, is dedi-
cated to the original in situ Raman spectrometer coupled with an ionic beam of a cyclotron accelerator (see figure 1). In a second part we present and discuss the Raman monitoring Uranium U(IV) dioxide / waterinterface under He ions irradiation. The figure 2 shows the evolution of the Raman spectra with time. One can distinguish the evolution of hydroxide and peroxideuranyl U(VI) compounds exhibiting signature in the 800-900 cm-1 range. Stability of these uranyl oxide hydrates versus the environmental conditions are wide-ly discussed [2,3], and the irradiation effect clearly needs to be taken into account [4]. Our results provide, in part, a foundation for develop-ing predictive models of U(IV) ↔ U(VI) natural cycles.
[1] Utsunomiya S. et al. (2005) Earth planet. Sci. Lett. , 240, 521–528. [2] Sowder A.G. et al. (1999) Environ. Sci. Technol. , 33, 3552–3557. [3] Kubatko K-A.H. et al. (2003) Science, 302, 1191–1193. [4] Corbel C. et al. (2006) J. Nucl. Mater., 348, 1-17.
39CORALS II Conference

THE SUITABLE CAROTENE AND XANTHOPHYLL IDENTIFICATION IN LECANORA LICHENS:
RESONANCE RAMAN SPECTROSCOPIC STUDY. I. Ibarrondo*, N. Prieto-Taboada, I. Martínez-Arkarazo and J. M. Madariaga, Department of Analytical Chemistry, Faculty of Science and Technology, University of the Basque Country (UPV/EHU), Bº Sarriena s/n 48940 Basque Country, Spain. *corresponding author: [email protected].
Introduction: Lecanora lichen species have been recognized as air pollution resistant due to their ability in acquiring new knowledge to protect themselves from high concentration of acid gases and metals [1, 2].
Carotenoids, ubiquitous compounds in lichens, are often classified as protective pigments because they dissipate the light energy used in photosynthesis and inhibit the formation of harmful reactive oxygenated species [3].
Raman Spectroscopy has been used widespread for characterization purposes of lichen metabolites, espe-cially in the characterization of lichen acids and pig-ments such as carotenoids. But sometimes the Raman assignments are not clear, are into controversy and the majority of the authors do not reach agreement [4, 5].
The Raman spectra of carotenoids present three ma-jor bands in the following order: in the regions of 1500-1550 cm-1 and 1150-1170 cm-1 appears two strong bands specific to the conjugated polyene chain
1) belongs C=C
2) relatedthe C C bonds of the same skeleton. In the 1000-1020cm-1
3) appear related to the -CH3 groups attached to the polyene chain. For instance,
1 band to major wavenumbers and vice versa [6].
The selection of the incident laser wavelength is an important aspect that influences the absorption of the chromophore. When maximum absorption is achieved, the analyses are said to be done in resonance condi-tions, where the Raman peaks of the chromophoric compound are enhanced significantly respect to other compounds presented [5].
The aim of this work is to characterize by Reso-nance Raman Spectroscopy a Lecanora lichen colonies to make proper Raman asignments in the path of the differentiation of both carotenes and xanthophylls.
Experimental: The measurements were done by using a Renishaw InVia Raman spectrometer, joined to a Leica DMLM microscope. The spectra were acquired with the Leica 50x N Plan (0.75 aperture) lens. The spatial resolution for the 50x lens is 2 m. The laser of 514 nm was used in all the measures to obtain the reso-nance effect of the carotenes and xanthophylls.
Results: Different areas of the Lecanora Muralis li-chen were distinguished according to the colour pro-vided by the main photosintethic pigment present. For instance, astaxanthin was the mayor pigment in brown
-carotene were the re-sponsibles for the black colour. The figure below dis-plays some of the Raman signatures obtained in the lichen colony. The main band 1 of the carotenoid al-lows to differentiate between astaxanthin (ast, 1507cm-
1 -carotene (beta, 1521 cm-1). However, none of the three bands normally used for carotenoid identifica-tion are enough as to distinguish zeaxan -carotene. Therefore, Raman signatures between 3100-3500 cm-1 corresponding to O-H bonds that are ob-served under resonance conditions are needed. More-over, those additional Raman bands can guarantee sometimes the correct carotenoid assignment when Raman features of other lichen compounds such as scytonemin are observed in the same spectrum.
Fig. Resonance Raman spectra of Astaxanthin (ast) and scyto-
nemin (scy) in comparison with -carotene (beta) in black and
brown areas, respectively, of the Lecanora Muralis lichen.
References: [1] Saxena S, Upreti D. K. andSharma N., (2007) J. Environ. Biol. 28, 49-51. [2]Pandey, V., D.K. Upreti, R. Pathak and A. Pal (2002)Environ. Monit. and Assess., 73, 221-223. [3] Baranski R, Baranska M., Schulz H., (2005), Planta, 222, 448-457. [4] Jorge-Villar S.E., Edwards H.G.M. (2010) J.Raman Spectrosc., 41, 63-67. [5] Robert B. (2009) Photosynth. Res., 101, 147-155. [6] Schulz H, Baran-ska M, Baranski R, Biopolymers, (2005), 77, 212-221.
Aknowlegments: This work was financially sup-ported by the Spanish Government (MICINN) through IMDICOGU project (ref. BIA2008-06592). Technical support provided by the Raman-LASPEA laboratory of the SGIker (UPV/EHU, MICINN, GV/EJ, ERDF and ESF) is gratefully acknowledged. I. Ibarrondo is grate-ful to the University of the Basque Country (UPV/EHU) for her pre-doctoral fellowship.
40 LPI Contribution No. 1616
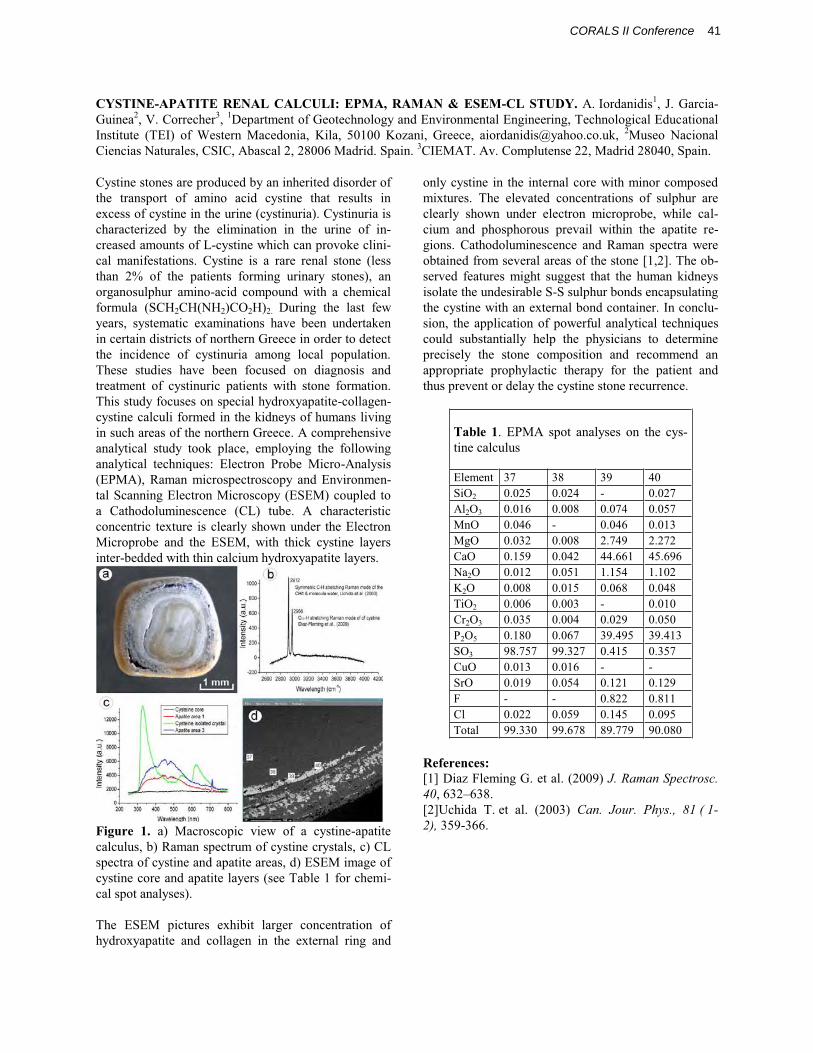
CYSTINE-APATITE RENAL CALCULI: EPMA, RAMAN & ESEM-CL STUDY. A. Iordanidis1, J. Garcia-Guinea2, V. Correcher3, 1Department of Geotechnology and Environmental Engineering, Technological Educational Institute (TEI) of Western Macedonia, Kila, 50100 Kozani, Greece, [email protected], 2Museo Nacional Ciencias Naturales, CSIC, Abascal 2, 28006 Madrid. Spain. 3CIEMAT. Av. Complutense 22, Madrid 28040, Spain.
Cystine stones are produced by an inherited disorder of the transport of amino acid cystine that results in excess of cystine in the urine (cystinuria). Cystinuria is characterized by the elimination in the urine of in-creased amounts of L-cystine which can provoke clini-cal manifestations. Cystine is a rare renal stone (less than 2% of the patients forming urinary stones), an organosulphur amino-acid compound with a chemical formula (SCH2CH(NH2)CO2H)2. During the last few years, systematic examinations have been undertaken in certain districts of northern Greece in order to detect the incidence of cystinuria among local population. These studies have been focused on diagnosis and treatment of cystinuric patients with stone formation. This study focuses on special hydroxyapatite-collagen-cystine calculi formed in the kidneys of humans living in such areas of the northern Greece. A comprehensive analytical study took place, employing the following analytical techniques: Electron Probe Micro-Analysis (EPMA), Raman microspectroscopy and Environmen-tal Scanning Electron Microscopy (ESEM) coupled to a Cathodoluminescence (CL) tube. A characteristic concentric texture is clearly shown under the Electron Microprobe and the ESEM, with thick cystine layersinter-bedded with thin calcium hydroxyapatite layers.
Figure 1. a) Macroscopic view of a cystine-apatite calculus, b) Raman spectrum of cystine crystals, c) CL spectra of cystine and apatite areas, d) ESEM image of cystine core and apatite layers (see Table 1 for chemi-cal spot analyses).
The ESEM pictures exhibit larger concentration of hydroxyapatite and collagen in the external ring and
only cystine in the internal core with minor composed mixtures. The elevated concentrations of sulphur are clearly shown under electron microprobe, while cal-cium and phosphorous prevail within the apatite re-gions. Cathodoluminescence and Raman spectra were obtained from several areas of the stone [1,2]. The ob-served features might suggest that the human kidneys isolate the undesirable S-S sulphur bonds encapsulating the cystine with an external bond container. In conclu-sion, the application of powerful analytical techniques could substantially help the physicians to determine precisely the stone composition and recommend an appropriate prophylactic therapy for the patient and thus prevent or delay the cystine stone recurrence.
Table 1. EPMA spot analyses on the cys-tine calculus
Element 37 38 39 40SiO2 0.025 0.024 - 0.027Al2O3 0.016 0.008 0.074 0.057MnO 0.046 - 0.046 0.013MgO 0.032 0.008 2.749 2.272CaO 0.159 0.042 44.661 45.696Na2O 0.012 0.051 1.154 1.102K2O 0.008 0.015 0.068 0.048TiO2 0.006 0.003 - 0.010Cr2O3 0.035 0.004 0.029 0.050P2O5 0.180 0.067 39.495 39.413SO3 98.757 99.327 0.415 0.357CuO 0.013 0.016 - -SrO 0.019 0.054 0.121 0.129F - - 0.822 0.811Cl 0.022 0.059 0.145 0.095Total 99.330 99.678 89.779 90.080
References:
[1] Diaz Fleming G. et al. (2009) J. Raman Spectrosc. 40, 632 638. [2]Uchida T. et al. (2003) Can. Jour. Phys., 81 ( 1-2), 359-366.
41CORALS II Conference

MOLECULAR CHARACTERIZATION OF A TEMPERATE BEACHROCK FORMATION IN THENERBIOI-IBAIZABAL ESTUARY (ARRIGUNAGA BEACH, BAY OF BISCAY). A. Iturregi1*, N. Arrieta , I. Martínez-Arkarazo, X. Murelaga, J.I. Baceta2, A. Sarmiento3 and J.M. Madariaga. 1 Department of Analytical Chemistry, University of the Basque Country (UPV/EHU), P.O. Box 644, E-48080 Bilbao, Spain. 2 Department of Stratigraphy and Palaeontology, University of the Basque Country (EHU/UPV), P.O. Box 644, E-48080 Bilbao, Spain. 3 Raman-LASPEA laboratory, SGIker, University of the Basque Country (EHU/UPV), P.O. Box 644, E-48080 Bilbao, Spain. *Tel.: +34 946018298, e-mail address: [email protected]
Beachrocks are well-cemented coastal sedimentary formations resulting from the precipitation of carbonate cements in the intertidal zone. The cementing agents of beachrocks are composed predominantly of CaCO3
polymorphs, high magnesian calcite (HMC) and low magnesian calcite (LMC).Several processes have been described for beachrock cementation, such as, precipi-tation of carbonates from evaporation of sea water, precipitation from ground water, precipitation in the salt and fresh waters mixing zone and CO2 degassing from beach ground waters [1-4]. The majority of beachrocks are found predominantly in tropi-cal/subtropical and low latitude coasts (0º - 40º lati-tude). Nevertheless, there are some evidences of beach-rock occurrence at upper latitudes [5]. This work is related to a beachrock formation in Arrigunaga beach
- located in the Nerbioi-Ibaizabal Est-uary. The purpose of this work was the characterization of the cements of those beachrock outcrops so as to continue a research programme aiming to clarify the processes involved on the cementation of the beaches located in the vicinity of the Estuary.
Different samples were gathered along the beachand classified depending on their relative location in the intertidal zone, distinguishing between high, midand low intertidal zone. At first instance, the granulo-metric characterization on the disgregated beachrock samples showed that the majority of the grains be-longed to the 250 and 2mm diameter fractions, al-though in the hardest (most compacted) samples theamount of the grains corresponding to the diameter less than 75 was substantially higher. Two raman equipments with different laser wavelengths were used for the molecular characterization: (i) an InnoRaman (B&WTEKINC) ultramobile spectrometer, equipped with 20x and 50x focusing lens, an excitation wave-length of 785 nm (nominal laser power 255 mW), aCCD detector (Peltier cooled) and BWSpec 3.26_38 software for data acquisition. (ii) A Renishaw InVia microRaman spectrometer coupled to a DMLM Leica microscope with 5x, 20x, 50x and 100x long-distancelens, a 514 nm as excitation source (nominal laser power 50 mW) and CCD detector (Peltier cooled). Spectra treatment was performed with the Wire 3.2 software (Renishaw, United Kingdom) in both cases.
Researches carried out in an adjacent beach, de-scribe different types of cement generations within the beachrock formations. The first generation was mainly
HMC, followed by aragonite and mixtures of CaCO3
polymorphs, silicates and iron oxides in high amounts[6]. Nonetheless, the Raman analyses of this work re-vealed that the vast majority of the cement in the study area is aragonite in the whole intertidal zone. HMC is only occasionally found acting as cement in the low intertidal zone and no evidences of the iron oxide based cements are observed. Concerning to the low intertidal zone, calcite was also found sporadically (Fig. 1). Furthermore, the studied beachrock is less cemented than the outcrops analized in the previous work.
These all differences found regarding the cement generations could be attributed to the location of the beaches; that is, to be situated in the interior or out of the Estuary.
Figure 1. Raman spectra of different points in the intertidal zone: (a) HMC appearing occasionally in the low intertidal zone (b) aragonite (mid); (c) aragonite and silicates (mid).
Apparently, the studied beachrock is less cemented than other outcrops analized nearby, so more analysesmust be carried through it to understand the processesof beachrock formation in each setting.
References [1] Beier J.A. (1985) J. Sediment. Petrol. 55, 755-
761.[2] Russell R.J. (1963) J.Trop.Geogr. 17, 24-27. [3] Hanor J.S.
(1978) J. Sediment. Petrol. 48, 489-501.[4] Milliman J.D. (1974)
Marine Carbonates, Springer-Verlag, 375 .[5] Kneale D. et al.
(2000) Sediment. Geol. 132, 165-170. [6] Arrieta N. et al. (2011)
Spectrochim. Acta A. doi:10.1016/j.saa.2011.01.031.
Acknowledgements. This work has been financially supported
by the Basque Government through the Environmental Analytical
Chemistry Project (ref. IT-245-07). Technical support provided by
the Raman-LASPEA laboratory of the SGIker (UPV/EHU, MICINN,
GV/EJ, ERDF and ESF) is gratefully acknowledged. N. Arrieta is
grateful to the University of the Basque Country (UPV/EHU) for her
predoctoral fellowship.
42 LPI Contribution No. 1616

THERMOLUMINESCENCE AND SHOCK METAMORPHISM OF ORDINARY CHONDRITES. A.I. Ivliev, V.A Alexeev, N.S Kuyunko Vernadsky Institute of Geochemistry and Analytical Chemistry, Russian Academy of Sciences, 119991, Kosygin str. 19, Moscow, Russia; e-mail: [email protected].
Introduction. The collision processes obviously played a leading role in the formation of meteorites. Shock and thermal metamorphism accompanying the collisions is considered therefore as the most fundamental process in the evolution of the primordial matter. The experimental study of this process has undoubtedly the crucial importance, especially with respect to the search for quantitative criteria in the estimation of the effects of shock-thermal metamorphism. One of the most sensitive methods of determination of the degree of structural changes in a matter is the thermoluminescence (TL). The intensity of a TL glow in equilibrium ordinary chondrites (peak height of glow or area under peak) changes more than on two orders of magnitude [1]. The main TL phosphor in these meteorites is feldspar, which one is present at all H, L, and LL chondrites approximately in identical proportions and has a similar composition (Ab74, An20, and Or6). The investigations of TL in minerals affected by experimental loading in spherically converging shock waves [2-4] have shown that TL characteristics were highly sensitive to changes in the crystal lattice. The shock stage of ordinary chondrites usually is determined by a petrographic method [5]. The purpose of the present investigation was carrying out of the TL investigations of chondrites with a petrographically identified shock stage. And, on the basis of obtained results, carrying out of an estimation of a degree of a shock metamorphism in chondrites with a unknown degree of a shock load.
Experimental method. The method of the sample preparation and the TL measuring is similar to a procedure surveyed in [2-4, 6].
Results of TL measurements.On the results of recording of X-rays and -rays
induced TL, there were calculated intensity of glow TL (Sp). The obtained results were compared to a degree of a shock load [6, 7]. The dependence of values Sp from a shock class of meteorites was found. However, at examination of TL induced by a X-rays, it was found, that the most sensing indicators of a degree of a shock load are the value of area under a curve of glow in a temperature region 40 -350 O (Sp). The results of these calculations are listed in table. In accordance with these data, the increase of values Sp is observed at the increase of shock pressure up to 10 GPa (stages S1-S2), and subsequent their sharp decrease up to two orders of magnitude is seen at further increase of shock pressure from ~10 up to 90 GPa (stages S3-S6). Using the results of our measurements and values of shock pressures of
different classes of meteorites [5], we have received the approximate formulas for an estimation of a value of a shock load, which one have undergone chondrites at collisions in space. For shock classes S1-S2 it was obtained: P = 1.93 x ln (Sp) - 5.57, and for S3-S6: P = -12.28 x ln (Sp) + 91.74. The results of evaluations under these formulas are given in the last column of the table. Table. Results of calculations of a area under the peak of glow (Sp) and value of a shock load (P).
N Shock
Conclusions. The investigation of the TL induced by X-rays in equilibrium ordinary chondrites has shown a high response of values Sp on a shock load, which one was undergone by these meteorites in space. However for precise identification of shock classes S1 - S3 under the TL data, the preliminary petrographic examinations is necessary. The estimation of a shock load of 17 meteorites was executed. The shock classes of meteorites of Kunya-Urgench (S2), Dalgety Downs (S4), and Pervomaisky (S6) were determined.
References. [1] Sears D.W.G. (1988) Nucl. Tracks Radiat. Meas 14. 5-17. [2] Ivliev, A.I. et al. (1995) Geokhimiya. 9. 1368-1377. [3] Ivliev, A.I. et al. (1996) Geochemistry International 34. P. 912-919. [4] Ivliev A.I. et al. (2002) Geochemistry International. 40. 739-750. [5] Stöffler D. et al. (1991) Geochim. et Cosmochim. Acta, 55. 3845-3867. [6] Alexeev V.A. et al. (2001) Geochemistry International. 39. 1043-1055.
/Meteorite
klassSp P, GPa
1 Dhajala H3 S1 222±13 4.9±0.3 2 Pribram H5 a-b 261±10 5.2±0.2 3 Saratov L4 S2 310±16 5.5±0.3 4 Biurboele L4 S1 326±20 5.6±0.3 5 Elenovka L5 S2 355±9 5.8±0.1 6 Tugalin-Bulen H6 S1 575±25 6.7±0.6 7 Nikolskoe L4-5 S2 671±67 7.0±0.7 8 Kunya-UrgenchH5 928±100 7.6±0.8 9 Barwell L5 S3 590±35 13.5±0.8
10 Kunashak L6 e 300±28 21±2 11 Pultusk H5 S3 285±24 22±2 12 Ochansk H4 S3 279±32 23±3 13 Kilabo LL6 S3 262±10 23±1 14 Dalgety Downs L5 142±14 31±3 15 Malakal L5 e 45±2 44±2 16 Kyushu L6 S5 34±3 46±5 17 Pervomaisky L6 7.6±0.6 60±5
43CORALS II Conference
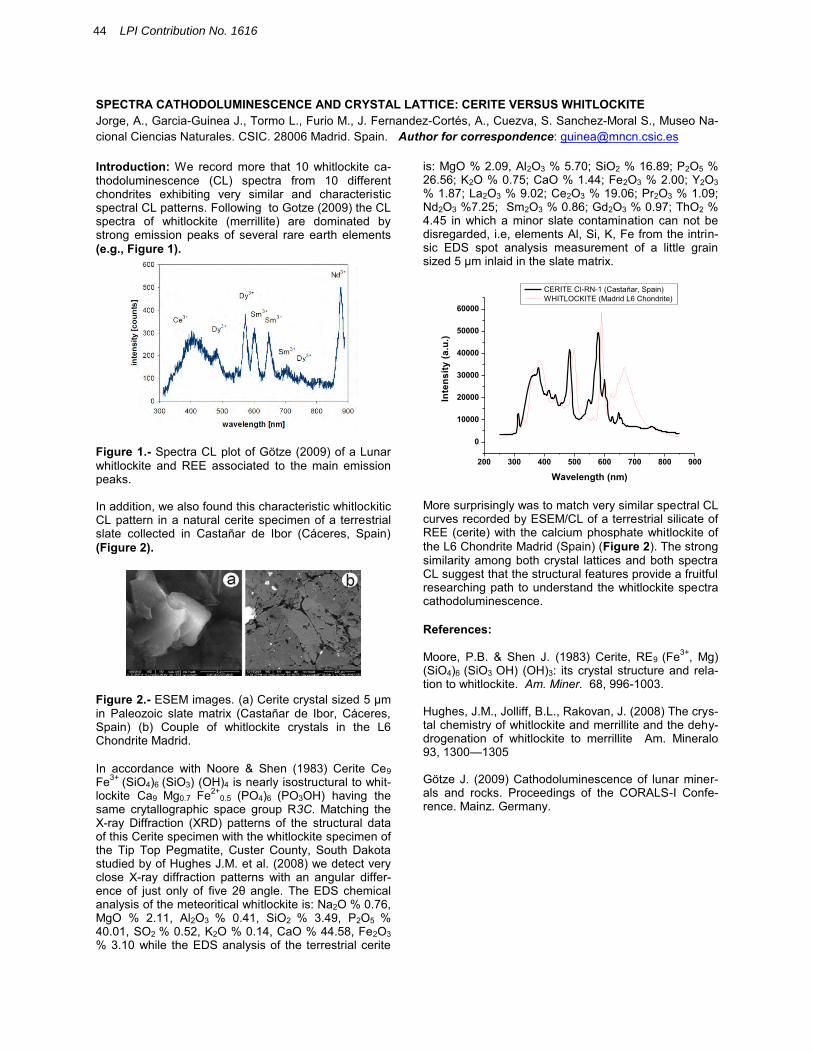
SPECTRA CATHODOLUMINESCENCE AND CRYSTAL LATTICE: CERITE VERSUS WHITLOCKITEJorge, A., Garcia-Guinea J., Tormo L., Furio M., J. Fernandez-Cortés, A., Cuezva, S. Sanchez-Moral S., Museo Na-cional Ciencias Naturales. CSIC. 28006 Madrid. Spain. Author for correspondence: [email protected]
Introduction: We record more that 10 whitlockite ca-thodoluminescence (CL) spectra from 10 different chondrites exhibiting very similar and characteristic spectral CL patterns. Following to Gotze (2009) the CL spectra of whitlockite (merrillite) are dominated by strong emission peaks of several rare earth elements (e.g., Figure 1).
Figure 1.- Spectra CL plot of Götze (2009) of a Lunar whitlockite and REE associated to the main emission peaks.
In addition, we also found this characteristic whitlockitic CL pattern in a natural cerite specimen of a terrestrial slate collected in Castañar de Ibor (Cáceres, Spain) (Figure 2).
Figure 2.- ESEM images. (a) Cerite crystal sized 5 µm in Paleozoic slate matrix (Castañar de Ibor, Cáceres, Spain) (b) Couple of whitlockite crystals in the L6 Chondrite Madrid.
In accordance with Noore & Shen (1983) Cerite Ce9Fe3+ (SiO4)6 (SiO3) (OH)4 is nearly isostructural to whit-lockite Ca9 Mg0.7 Fe2+
0.5 (PO4)6 (PO3OH) having the same crytallographic space group R3C. Matching the X-ray Diffraction (XRD) patterns of the structural data of this Cerite specimen with the whitlockite specimen of the Tip Top Pegmatite, Custer County, South Dakota studied by of Hughes J.M. et al. (2008) we detect very close X-ray diffraction patterns with an angular differ-ence of just only of five The EDS chemical analysis of the meteoritical whitlockite is: Na2O % 0.76, MgO % 2.11, Al2O3 % 0.41, SiO2 % 3.49, P2O5 %40.01, SO2 % 0.52, K2O % 0.14, CaO % 44.58, Fe2O3% 3.10 while the EDS analysis of the terrestrial cerite
is: MgO % 2.09, Al2O3 % 5.70; SiO2 % 16.89; P2O5 %26.56; K2O % 0.75; CaO % 1.44; Fe2O3 % 2.00; Y2O3% 1.87; La2O3 % 9.02; Ce2O3 % 19.06; Pr2O3 % 1.09; Nd2O3 %7.25; Sm2O3 % 0.86; Gd2O3 % 0.97; ThO2 %4.45 in which a minor slate contamination can not be disregarded, i.e, elements Al, Si, K, Fe from the intrin-sic EDS spot analysis measurement of a little grain sized 5 µm inlaid in the slate matrix.
200 300 400 500 600 700 800 900
0
10000
20000
30000
40000
50000
60000
Inte
nsity
(a.u
.)
Wavelength (nm)
CERITE CI-RN-1 (Castañar, Spain) WHITLOCKITE (Madrid L6 Chondrite)
More surprisingly was to match very similar spectral CL curves recorded by ESEM/CL of a terrestrial silicate of REE (cerite) with the calcium phosphate whitlockite of the L6 Chondrite Madrid (Spain) (Figure 2). The strong similarity among both crystal lattices and both spectra CL suggest that the structural features provide a fruitful researching path to understand the whitlockite spectra cathodoluminescence.
References:
Moore, P.B. & Shen J. (1983) Cerite, RE9 (Fe3+, Mg)(SiO4)6 (SiO3 OH) (OH)3: its crystal structure and rela-tion to whitlockite. Am. Miner. 68, 996-1003.
Hughes, J.M., Jolliff, B.L., Rakovan, J. (2008) The crys-tal chemistry of whitlockite and merrillite and the dehy-drogenation of whitlockite to merrillite Am. Mineralo93, 1300 1305
Götze J. (2009) Cathodoluminescence of lunar miner-als and rocks. Proceedings of the CORALS-I Confe-rence. Mainz. Germany.
44 LPI Contribution No. 1616

NEW RAMAN SPECTROSCOPIC DATA OF ALMAHATA SITTA METEORITE
M. Kaliwoda1,*, R. Hochleitner1, V. H. Hoffmann2, T. Mikouchi3, A. M. Gigler4, W. W.. Schmahl1,4
1Mineral State Collection Munich, Theresienstrasse 41, 80333 Munich (Germany) ([email protected]), 2Geophysics, LMU-München, Theresienstr. 41, 80333 Munich (Germany), 3Earth and Planetary Sci-ence, Graduate School of Science, University of Tokyo, 7-3-1 Hongo, Bunkyo-ku, Tokyo 113-0033 (Japan), 4 CeNS and Section Crystallography, LMU-München, Theresienstr. 41, 80333 Munich (Germany)
Introduction: 2008 TC3 was the first meteorite previously observed in space and discovered after-wards. 2008 TC3 fall took place on 7 October 2008 in the Nubian Desert (Northern Sudan). Its mass was around 3.95 kg. All specimen, belonging to this fall, were called Alma-hata Sitta (AS), and could be classified as a multicom-ponent breccia composing of different meteoritic lithologies like anomalous polymict ureilites and dif-ferent chondrites [1-3]. Therefore, the meteorite re-vealed to be of a rare type of extraterrestrial material, with also large amounts of carbonaceous grains.
Raman research: The investigation of minerals by Raman spectroscopy is an suitable methode to typifyminerals within these planetary material. Raman meas-urements could be used to classify the structure and composition of quartz, pyroxenes, olivines and other materials within meteorites. In combination with elec-tron microprobe, Raman spectroscopy is an excellenttool to typify different polytypes and polymorphs. Therefore it is for example possible to distinguish be-tween graphite, graphene and diamond within the in-vestigated AS samples. Furthermore we could map areas of 90 μm to 90 μm todetermin mineral phases within rather inhomogenous clusters in AS. The following minerals could be classi-fied within our AS samples due to Raman measure-ments:
Graphite (see Figure 1) Diamond Graphene Suessite (see Figure 2) Schreibersite Cohenite Kamacites Troilite/Cr troilite Pyroxene Plagioklas
Results: By means of our Raman measurements it was possible to characterize graphite, graphene and also diamond. To some extend, these three minerals occurin clusters within one sample. Especially graphene and graphite change within diminutive areas.
Moreover it was possible to acquire the first suessite Raman data. Up to now no exact Raman spectra of suessite was existing. In addition we mapped areas, i.e. clusters and mineral inclusions within AS, where the local chemical compo-sition as well as the mineral content vary within short distance.
Conclusion: Micro-Raman spectroscopy proved to be a quick and valuable tool for investigation of extra-terrestrial material. No special sample treatment is needed, with the exception of polished surface. There-fore it is a good methode to characterize different min-erals and polytypes within one sample and to make preliminary work for later microprobe measurements.
Figure 1: Graphite
Figure 2: Suessite
References: [1] Jenniskens P. et al. (2009), Nature , 458: 485-488. [2] Bischoff A. et al. (2010), MAPS, in press. [3] Hochleitner R. et al. (2004), Journal of Raman spectroscopy, 35, 515-518
Additional Information: This study was performed partly under the cooperative research program of the Center for Advanced Marine Core Research (CMCR), Kochi Uni-versity, Japan (10B033).
45CORALS II Conference

THERMOLUMINESCENCE AS ONE OF THE METHODS FOR DETERMINATION OF THE CRYSTAL LATTICE STRUCTURE OF QUARTZ. L. L. Kashkarov, G. V. Kalinina , S. N. Shilobreeva. Vernadsky Institute of Geochemistry and Analytical Chemistry, Russian Academy of Sciences, 119991, Kosygin str. 19, Moscow, Russia , [email protected]
Introduction:Research of radiation-induced processes of structural and chemical reworking of the silicates, occurring under influence of an ionizing radiation, is now one of the important scientific problems. In a basis of these researches representation about radiation-induced structural changes of a crystal lattice of irradiated samples, formation in it of a different sort of micro-defects lays. As consequence, repeatedly accelerated diffusion leading redistribution of the elements concentration in the crystal volume, is observed [1, 2]. In the works of authors [3, 4] for the first time it has been shown radiation-stimulated redistribution of the implanted into quartz of the iron atoms that was caused by the subsequent irradiation of the accelerated protons. Thus, iron atoms or are undergoing diffusion in the crystal volume, or enter chemical interaction in a near-surface layer of quartz with formation of a chemically modified compound. Radiation-stimulated diffusion for greater depths can be treated as segregation of iron atoms on some centers such, for example, as oxygen vacancies of quartz. In view of these processes, it is important to perform an experimental definition of a degree of radiation-induced crystal lattice destruction. One of high-sensitivity methods of registration of structural changes of quartz is the method of thermoluminescence (TL) analysis. In work [5] at research of the TL- luminescence of quartz precise dependence of the TL-parameters on capacity of shock loading has been received. In the present work the results of TL-parameters measurement for the quartz of different crystal structure are presented. Enough high sensitivity to TL-storage, allowed to use this mineral for development of a TL-research technique of structural changes and destructions of the crystal lattice, occurred under action of nuclear irradiation, are discussed.
Samples and technique: TL-measurement was spent for a number of quartz samples: Qu-1 fusion, with amorphous structure and Qu-2 natural rock crystal. As have shown the optical analysis, the Qu-1 contained the microcrystallite inclusions, and Qu-2 were represented as the transparent, colorless monocrystals. Measurements were spent on the installation, allowing to register the very low levels of the TL-luminescence by a technique described in [6]. It was registered natural (TLNAT) and artificially induced (TLIND ) when the samples were exposed to X-rays of energy E = 55 keV.
Results and discussion: From comparison of the TL glow curves for the studied quartz samples it is follows: 1) TLNAT - intensity for both sample groups of quartz in the low ( 250 ) temperature interval is approximately identical and lays at a level of 1×10⁻³
relative units, that corresponding to a background thermoluminescence (TLBAC). However, at ~ 300 it is observed peak of the TLNAT -luminescence, approximately on the order of magnitude exceeding a background luminescence in this temperature interval. This TLNAT-luminescence is adequating to the trapped electrons, accumulated during all history of existence of the given samples. 2 TLBAC was measured at repeated heating of the samples after measurement their TLNAT, that specifies a minimum level of the TL-luminescence which can be registered on used installation. 3) TLIND it is characterized by following features: For the samples of amorphous quartz Qu-1 on a glow curves it is observed, at least, five peaks in the low-temperature ~ (50-250) oCintervals and several peaks in the region of ~ (250-400) oC. Evaluation of the activation energies according for these peaks gives the values from ~ 1.1 eV up to ~ 1.8 eV. Single-peak in TLIND glow curve for the samples of Qu-2 corresponds to the activation energy of ~ 1.2 eV.
Conclusion: Difference of the glow curves for TLIND in Qu-1 and Qu-2 samples, and evaluation of the activation energy allow us to identify some crystal structural characteristics. It is apparently, that in fused quartz specific glow curves are caused by inclusions of microcrystals. Corresponding degrees in heterogeneity of structure in these samples as a whole can be estimated due of these data. Carrying out of the special calibration experiments on revealing of the activation energy levels at implantation of quartz by accelerated nuclei will enable for carrying out of a quantitative estimation of a degree of destruction the quartz crystal lattice, that arising under influence of nuclear particles of different charge and energy. Study was supported by Russian Foundation for Basic Research, grant 10-05-00253-a.
References: [1]. Wang K.-M. et al. (1990) J.Appl. Phys., 68, 3191-3193. [2]. Hosono H. (1995) J.Non-Crystalline Solids, 187, 457-472. [3]. Shilobreeva S.N. et al. (2006) Nucl. Instr. & Meth., Phys. Res., 256, 216-218. [4]. Shilobreeva S.N. et al. (2006) Docl. Acad. Nauk (russian), 411, 676-679. [5]. Ivliev A.I. et al. (1996) Geochimiya, 1011-1017. [6]. Ivliev A.I. et al. (1995) Geochimiya, 1368-1377.
46 LPI Contribution No. 1616

Optical Absorption, Cathodo- And Radioluminescence In Diaspore.1, 1, I.C.Keskin1,
B.Tastekin1, M.Hatipooglu2, R.Kibar1, A. etin1 and N.Can1, Celal Bayar University, Faculty of Arts and Sciences,Physics Department, 45140 Manisa-Turkey, email;[email protected] MYO, zmir Multidisciplinary Vocational School, Gemmology and Jewelry Program, 35140 Buca-Izmir/Turkey.
-AlO(OH)] is one of the bauxitic minerals in the Al2O3 H2O system and is part of the gibbsite, bayerite, bohemite, diaspore, and corundum series. [1]
-AlOOH) are of interest in different fields such as production of alpha-alumina, extraterrestrial water exploration and jewelry. Diaspore is the only oxo-hydroxide suitable as a direct precursor
-Al2O3 when dehydration at 450 500 oC is reached. Diaspore in nature can be also considered as one of the precursors of natural crystalline alumina
-Al2O3).[2]
In diaspore the oxygens are in a hexagonal close packed layer. Luminescence spectra of the naturel di-aspore are typical of 2E 4A2 transitions of Cr3+ lumi-nescence centers (R-lines) substituting for Al3+ in six fold coordination [3]. Gem quality diaspores are formed by four remobilization processes (extraction, mobilization, migration and re-crystallization) of the metabauxite components in an aqua-complex as open-space fillings. This formation and its rarest crystal are only found in the Ilbir moun-tains region of the Menderes crystalline massif (SW Turkey) around the world. Thus, the studies on gem quality diaspores have fairly limited [4]
Fig. 1 shows cathodoluminescence (CL) and radioluminescence (RL) spectra of diaspore at room temperature. As seen from the figure, diaspore exhibits luminescence maxima at 430, 488, 571, 697and 712 nm at CL spectrum.
250 300 350 400 450 500 550 600 650 700 750 800
Wavelength (nm)
0
7000
14000
21000
28000
35000
Inte
nsity
(a.u
)
CLRL
Fig.1 CL and RL spectra for diaspore at room temperature.
In the absorption spectrum of diaspore,there are a few peaks at 371 nm, 385 nm, 397 nm, 450 nm, 560 nm and 640-750 nm. These can be attributed to some impurity elements.
350 400 450 500 550 600 650 700 750 800
Wavelength (nm)
0.55
0.75
0.95
1.15
1.35
1.55
Opt
ical
Abs
orpt
ion
Diaspore
Fig.2 Optical absorption spectrum of diaspore in the range of 350-800 nm.
References: [1] J. Garcia-Guineaa; et. al. Radiation Measurements 33 (2001) 653 658 [2] J. Garcia-Guinea et. al. Journal of Physics and Chemistry of Sol-ids 66 (2005) 1220 1227 [3] S.Shoval et.al.Journal of Thermal Analysis and Calorimetry 71 (2003) 699-706
405(2010)17291736
47CORALS II Conference
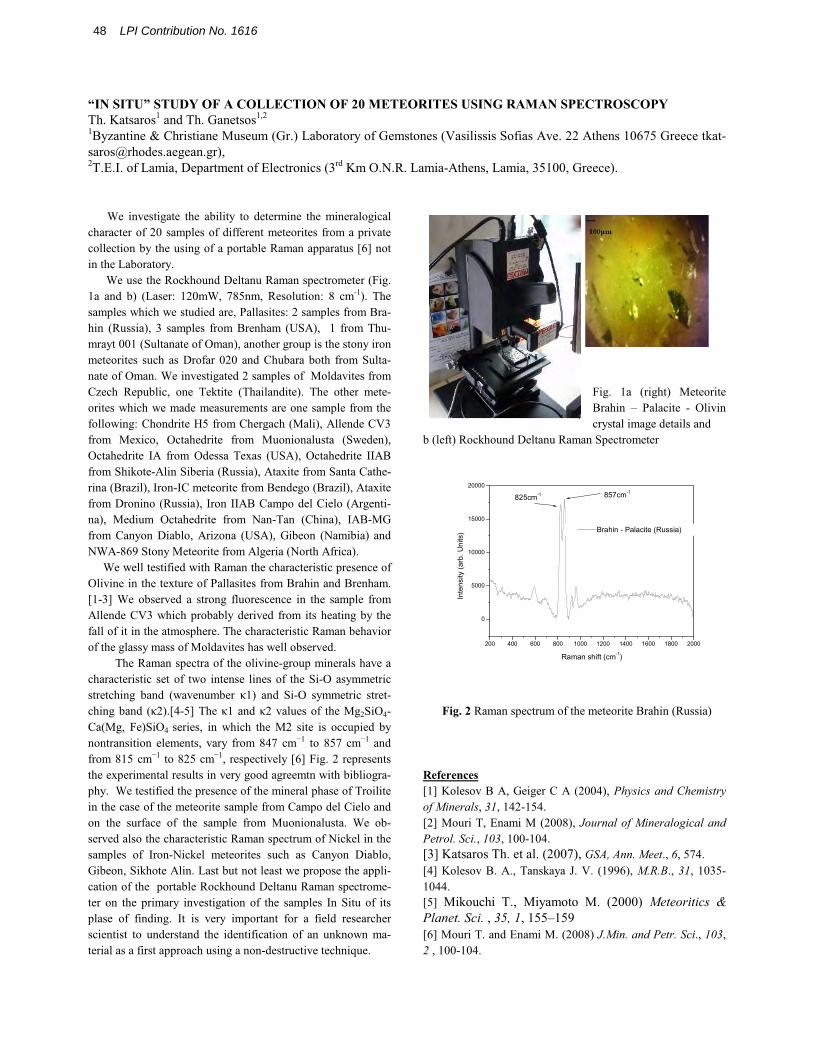
“IN SITU” STUDY OF A COLLECTION OF 20 METEORITES USING RAMAN SPECTROSCOPY Th. Katsaros1 and Th. Ganetsos1,2 1Byzantine & Christiane Museum (Gr.) Laboratory of Gemstones (Vasilissis Sofias Ave. 22 Athens 10675 Greece [email protected]), 2T.E.I. of Lamia, Department of Electronics (3rd Km O.N.R. Lamia-Athens, Lamia, 35100, Greece).
We investigate the ability to determine the mineralogical
character of 20 samples of different meteorites from a private collection by the using of a portable Raman apparatus [6] not in the Laboratory. We use the Rockhound Deltanu Raman spectrometer (Fig. 1a and b) (Laser: 120mW, 785nm, Resolution: 8 cm-1). The samples which we studied are, Pallasites: 2 samples from Bra-hin (Russia), 3 samples from Brenham (USA), 1 from Thu-mrayt 001 (Sultanate of Oman), another group is the stony iron meteorites such as Drofar 020 and Chubara both from Sulta-nate of Oman. We investigated 2 samples of Moldavites from Czech Republic, one Tektite (Thailandite). The other mete-orites which we made measurements are one sample from the following: Chondrite H5 from Chergach (Mali), Allende CV3 from Mexico, Octahedrite from Muonionalusta (Sweden), Octahedrite IA from Odessa Texas (USA), Octahedrite IIAB from Shikote-Alin Siberia (Russia), Ataxite from Santa Cathe-rina (Brazil), Iron-IC meteorite from Bendego (Brazil), Ataxite from Dronino (Russia), Iron IIAB Campo del Cielo (Argenti-na), Medium Octahedrite from Nan-Tan (China), IAB-MG from Canyon Diablo, Arizona (USA), Gibeon (Namibia) and NWA-869 Stony Meteorite from Algeria (North Africa). We well testified with Raman the characteristic presence of Olivine in the texture of Pallasites from Brahin and Brenham. [1-3] We observed a strong fluorescence in the sample from Allende CV3 which probably derived from its heating by the fall of it in the atmosphere. The characteristic Raman behavior of the glassy mass of Moldavites has well observed. The Raman spectra of the olivine-group minerals have a characteristic set of two intense lines of the Si-O asymmetric stretching band (wavenumber κ1) and Si-O symmetric stret-ching band (κ2).[4-5] The κ1 and κ2 values of the Mg2SiO4-Ca(Mg, Fe)SiO4 series, in which the M2 site is occupied by nontransition elements, vary from 847 cm−1 to 857 cm−1 and from 815 cm−1 to 825 cm−1, respectively [6] Fig. 2 represents the experimental results in very good agreemtn with bibliogra-phy. We testified the presence of the mineral phase of Troilite in the case of the meteorite sample from Campo del Cielo and on the surface of the sample from Muonionalusta. We ob-served also the characteristic Raman spectrum of Nickel in the samples of Iron-Nickel meteorites such as Canyon Diablo, Gibeon, Sikhote Alin. Last but not least we propose the appli-cation of the portable Rockhound Deltanu Raman spectrome-ter on the primary investigation of the samples In Situ of its plase of finding. It is very important for a field researcher scientist to understand the identification of an unknown ma-terial as a first approach using a non-destructive technique.
Fig. 1a (right) Meteorite Brahin – Palacite - Olivin crystal image details and
b (left) Rockhound Deltanu Raman Spectrometer
Fig. 2 Raman spectrum of the meteorite Brahin (Russia)
References [1] Kolesov B A, Geiger C A (2004), Physics and Chemistry of Minerals, 31, 142-154. [2] Mouri T, Enami M (2008), Journal of Mineralogical and Petrol. Sci., 103, 100-104. [3] Katsaros Th. et al. (2007), GSA, Ann. Meet., 6, 574. [4] Kolesov B. A., Tanskaya J. V. (1996), M.R.B., 31, 1035-1044. [5] Mikouchi T., Miyamoto M. (2000) Meteoritics & Planet. Sci. , 35, 1, 155–159 [6] Mouri T. and Enami M. (2008) J.Min. and Petr. Sci., 103, 2 , 100-104.
200 400 600 800 1000 1200 1400 1600 1800 2000
0
5000
10000
15000
20000
825cm-1 857cm-1
Inte
nsity
(arb
. Uni
ts)
Raman shift (cm-1)
Brahin - Palacite (Russia)
48 LPI Contribution No. 1616

CLARIFICATION OF SHOCK-INDUCED EFFECT ON CATHODOLUMINESCENCE OF ALKALI
FELDSPAR. M. Kayama1, H. Nishido1, T. Sekine2, T. Nakazato1, A. Gucsik3,4 and K. Ninagawa5, 1Research Insti-tute of Natural Sciences, Okayama University of Science, 1-1 Ridaicho, Kita-ku, Okayama 700-0005, Japan (E-mail: [email protected]); 2Department of Earth and Planetary Systems Science, Graduate School of Science, Hiro-shima University, Kagami-yama 1-3-1, Higashi-Hiroshima, Hiroshima 739-8526, Japan; 3Department of Earth and Planetary Materials Science, Graduate School of Science, Tohoku University, Aoba 6-3, Aramaki, Aoba-ku, Sendai, 980-8578, Japan; 4Konkoly Observatory of the Hungarian Academy of Sciences, H-1121, Budapest, Konkoly Thege Miklós út 15-17., Hungary; 5Department of Applied Physics, Okayama University of Science, 1-1 Ridaicho, Kita-ku, Okayama 700-0005, Japan;
Introduction: Materials subjected to shockwaves display characteristic and irreversible structural changes on both macroscopic and microscopic scales, depending on the applied shock strength. The shock pressure at the time of impacting, therefore, is the most important parameter that needs to clarify the collisional history of asteroid and meteorite impacts. Shock meta-morphic process caused by hypervelocity meteorite impacts, however, has not been fully understood yet. Cathodoluminescence (CL) spectroscopy and micro-scopy provide useful information on the existence and distribution of defects and trace elements in materials with high spatial resolution. This technique is expected to be applied to clarify shock pressure effect on the minerals in meteorites and impactites. In this study, CL analysis of experimentally shocked alkali feldspar hasbeen conducted to evaluate shock-induced effect on CL of feldspar.
Samples and methods: Single crystals of sanidine (Or87Ab13An0) from Eifel, Germany, and microcline (Or63Ab37An0) from Marumori, Japan were selected as starting material for shock recovery experiments. The shock pressure was induced on sanidine at 10.0, 20.0, 31.7 and 40.1 GPa using a propellant gun. CL images and spectra were obtained by an SEM-CL system.
Results and discussion: Color CL images of un-shocked (Sa00) and experimentally shocked sanidine at 10 GPa (Sa10) indicate a red violet emission. Sanidine at 20 GPa (Sa20) displays a blue emission with vein-shaped textures and a red violet luminescent back-ground. A blue emission is also distinguished in the color CL images of shocked samples at 31.7 GPa (Sa30) and 40.1 GPa (Sa40). Color CL images of un-shocked (Mi00) and shocked microcline at 10.0, 20.0, 31.7 and 40.1 GPa (Mi10, Mi20, Mi30 and Mi40, re-spectively) exhibit blue CL emissions, where the inten-sity increases with an increase in shock pressure. Ra-man spectra of unshocked and shocked sanidine as well as microcline at 10 GPa consist of pronounced peaks at 180, 290, 485 and 510 cm 1, which are assigned to TO T stretching vibration. Shocked sanidine and micro-cline above 20 GPa present rather weak peaks at 510 and 600 cm 1. Shock metamorphism breaks a linkage of the T O T bond in the framework structure of sani-
dine, resulting in the transition of sanidine and micro-cline into diaplectic glass. Blue CL areas in shocked sanidine are identified to diaplectic glass, but red-violet areas to diaplectic or unshocked sanidine.
CL spectra of Sa00 and Mi00 show a blue emission band at 420 nm and a red-IR one at 730 nm. Shocked sanidine and microcline above 20 GPa have UV-blue CL emissions at 380 and 330 nm of which intensities increase with an increase in shock pressure. Spectral deconvolution of CL spectra from shocked sanidine and microcline provides Gaussian components at 2.948, 3.261 and 3.881 eV. The components at 3.261 and 3.881 eV are recognized in diaplectic glass, but not in diaplectic or unshocked sanidine and microcline. It indicates that these components are characteristic of CL signals derived from diaplectic glass. Shock meta-morphism destroys a linkage of T O T bond in the framework structure of sanidine and microcline, but resulting in formation of shock-induced defect center related to the components at 3.261 and 3.881 eV. Their component intensities increase with an increase in shock pressure, where the increasing rates are different between sanidine and microcline. It is noteworthy that the intensity depends on not only shock pressure, but also phase composition and structural order-disorder which are closely related to transition shock pressure from feldspar into diaplectic glass. The component at 2.948 eV was detected in both diaplectic feldspar and glass, suggesting that the shock-induced defect center is almost independent of the breaking of the linkage of the T O T bond caused by shock metamorphism. The intensity correlates linearly with peak shock pressure induced on sanidine and microcline, with little depen-dence on composition or structure. The correlation can provide quantitative values of the shock pressures ex-perienced on the feldspar at the time of impacting,which can estimate shock pressures of meteorites and impact crater impactite with higher precision than con-ventional method. This shock barometry should be extensively used in the clarification of meteoritic or planetesimal collision history and the interpretation of the ejection process on Mars and Moon.
49CORALS II Conference

CHARACTERIZATION OF RADIATION EFFECTS IN ALBITE BY CATHODOLUMINESCENCE. M.Kayama1, H. Nishido1, S. Toyoda2, K. Komuro3 and K. Ninagawa2, 1Research Institute of Natural Sciences, Okaya-ma University of Science, 1-1 Ridaicho, Kita-ku, Okayama 700-0005, Japan (E-mail: [email protected]); 2 De-partment of Applied Physics, Okayama University of Science, 1-1 Ridaicho, Kita-ku, Okayama 700-0005, Japan.;3Earth Evolution Sciences, University of Tsukuba, Ten-nodai, Ibaraki, 305-8571, Japan;
Introduction: Cathodoluminescence (CL) micro-scopy and spectroscopy provide useful information about the existence and distribution of lattice defects and trace elements in materials with high-spatial reso-lution of a few micron meters. The CL spectral featuresare closely related to radiation dose of alpha- or gam-ma-particles, suggesting geoscientific applications for geodosimeter using CL of minerals such as quartz and zircon. No CL investigations on radiation effects in feldspar which is a most important rock-forming min-eral on earth s crust have been conducted to date, al-though the visible halos caused by alpha-particle can be easily found in the feldspar directly attached to ra-dioactive minerals. In this study, He+ ion implantation at 4 MeV, corresponding to the energy of alpha-particle from 238U, has been conducted to characterize radiation effect of alpha-particle by CL in albite.
Samples and methods: Single crystals of albite from Minas Gerais, Brazil, from Itoigawa Japan, and from Tanogami, Japan were used in the present study.He+ ion implantation (dose density: 2.18 × 10 6 to 6.33 × 10 4 C/cm2) on the samples was performed using a 3M-tandem ion accelerator at 4 MeV corresponding to the energy of alpha-particles from 238U. A scanning electron microscopy-cathodoluminescence (SEM-CL) was used to obtain CL spectra of these albite samples.Operating conditions were set at 15 kV (accelerating voltage) and 1.0 nA (beam current).
Results and discussion: CL images of He+ ion implanted albite from Minas Gerais, Brazil, from Itoi-gawa Japan, and from Tanogami Japan show a bright luminescent from the implanted surface, which is identified as a CL halo. The width of the halo is consistent with the theoretical range of He+
ion implantation at 4 MeV. CL line analysis revealedthat an increase in the CL intensity along depth direc-tion substantially corresindicating an energy loss process of specific ionization along the track of a changed particle.
CL spectra of unimplanted albite from Minas Ge-rais, Brazil, from Itoigawa Japan, and from Tanogami Japan have emission peaks at 350, 400, 570 and 740 nm which are assigned to Ce3+ impurity, Ti4+ impurity or Al-O -Al center defect, Mn2+ impurity and Fe3+ im-purity centers, respectively. Similar emission peakswere recognized in CL spectra of the implanted albite. The intensities of all of these CL emissions decrease with an increase in radiation dose of He+ implantation.
Raman spectroscopy on these albite indicates that Ra-man peak at 505 cm 1 shows a decrease in the intensity and an increase in the full width at half maximum (FWHM) with increasing the He+ dose. These observa-tions suggest that He+ implantation breaks a linkage of T-O-T bonds in the framework of albite, resulting in a reduction of CL emissions due to impurity centers.
CL spectra of all implanted albite have a red emis-sion at 700 nm, of which the intensities increase with an increase in the radiation dose. Deconvolution of CL spectra from the unimplanted and implanted albite can successfully provides six Gaussian components at 3.05, 2.82, 2.10, 1.86, 1.67, and 1.56 eV, where the compo-nent at 1.86 eV is observed only in the implanted albite samples. Integral intensity of the component at 1.86 eV linearly correlates with the radiation dose. These re-sults suggest that the component at 1.86 eV is assigned to radiation-induced defect center formed by He+ ion implantation. The component intensity at 1.861 eV correlates with the radiation dose as a function of rad-iation sensitivity, but does not depend on the densityand distribution of other emission centers, degree of Si-Al ordering, the presence of microstructures or texture, nor the provenance, i.e., Minas Gerais, Brazil, from Itoigawa Japan or Tanogami Japan.
CL microscopy, therefore, was found to be useful to visualize radiation halo, and CL spectral deconvolu-tion can quantitatively evaluate radiation dose of alpha particles from natural radionuclides on albite, which could be a geodosimeter.
50 LPI Contribution No. 1616
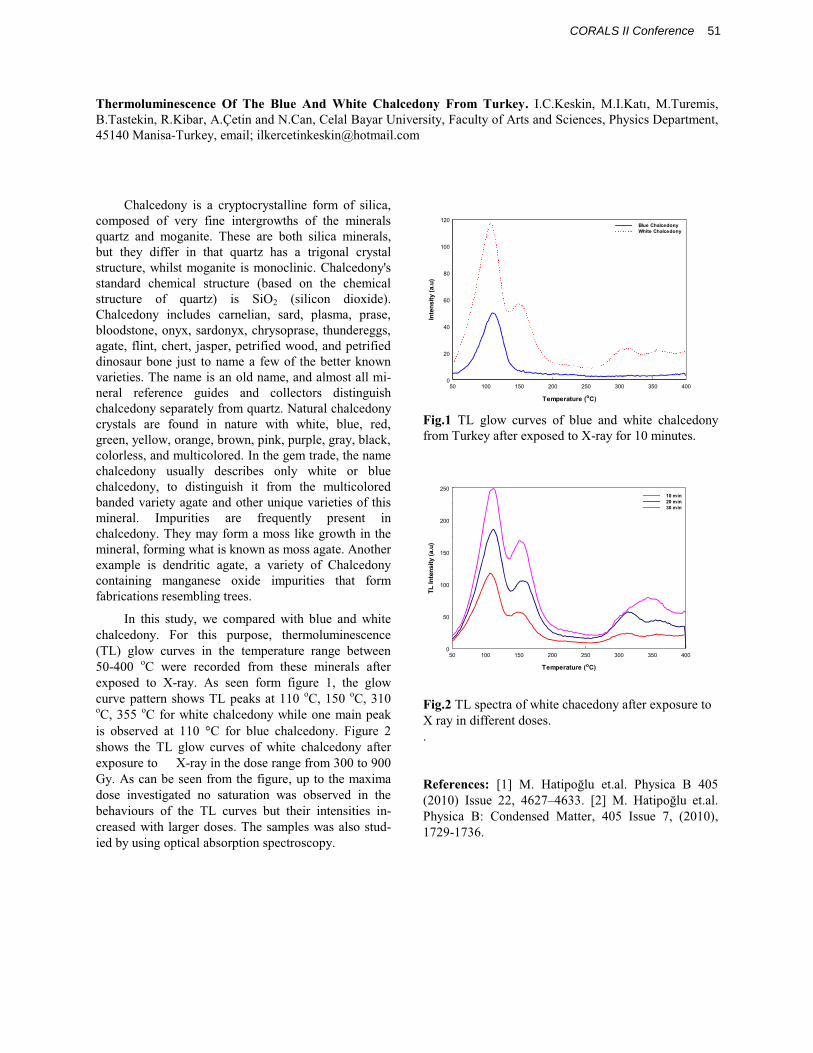
Thermoluminescence Of The Blue And White Chalcedony From Turkey. , M.Turemis,B.Tastekin, R.Kibar, etin and N.Can, Celal Bayar University, Faculty of Arts and Sciences, Physics Department, 45140 Manisa-Turkey, email; [email protected]
Chalcedony is a cryptocrystalline form of silica,composed of very fine intergrowths of the minerals quartz and moganite. These are both silica minerals,but they differ in that quartz has a trigonal crystal structure, whilst moganite is monoclinic. Chalcedony's standard chemical structure (based on the chemical structure of quartz) is SiO2 (silicon dioxide). Chalcedony includes carnelian, sard, plasma, prase, bloodstone, onyx, sardonyx, chrysoprase, thundereggs, agate, flint, chert, jasper, petrified wood, and petrified dinosaur bone just to name a few of the better known varieties. The name is an old name, and almost all mi-neral reference guides and collectors distinguish chalcedony separately from quartz. Natural chalcedony crystals are found in nature with white, blue, red, green, yellow, orange, brown, pink, purple, gray, black, colorless, and multicolored. In the gem trade, the name chalcedony usually describes only white or blue chalcedony, to distinguish it from the multicolored banded variety agate and other unique varieties of this mineral. Impurities are frequently present in chalcedony. They may form a moss like growth in the mineral, forming what is known as moss agate. Another example is dendritic agate, a variety of Chalcedony containing manganese oxide impurities that form fabrications resembling trees.
In this study, we compared with blue and white chalcedony. For this purpose, thermoluminescence (TL) glow curves in the temperature range between 50-400 oC were recorded from these minerals after exposed to X-ray. As seen form figure 1, the glow curve pattern shows TL peaks at 110 oC, 150 oC, 310 oC, 355 oC for white chalcedony while one main peak is observed at 110 C for blue chalcedony. Figure 2 shows the TL glow curves of white chalcedony after exposure to X-ray in the dose range from 300 to 900Gy. As can be seen from the figure, up to the maxima dose investigated no saturation was observed in the behaviours of the TL curves but their intensities in-creased with larger doses. The samples was also stud-ied by using optical absorption spectroscopy.
50 100 150 200 250 300 350 400
Temperature (oC)
0
20
40
60
80
100
120
Inte
nsity
(a.u
)
Blue ChalcedonyWhite Chalcedony
Fig.1 TL glow curves of blue and white chalcedony from Turkey after exposed to X-ray for 10 minutes.
50 100 150 200 250 300 350 400
Temperature (oC)
0
50
100
150
200
250
TL In
tens
ity (a
.u)
10 min20 min30 min
Fig.2 TL spectra of white chacedony after exposure to X ray in different doses..
References: [1](2010) Issue 22, 4627 4633. [2]Physica B: Condensed Matter, 405 Issue 7, (2010),1729-1736.
51CORALS II Conference
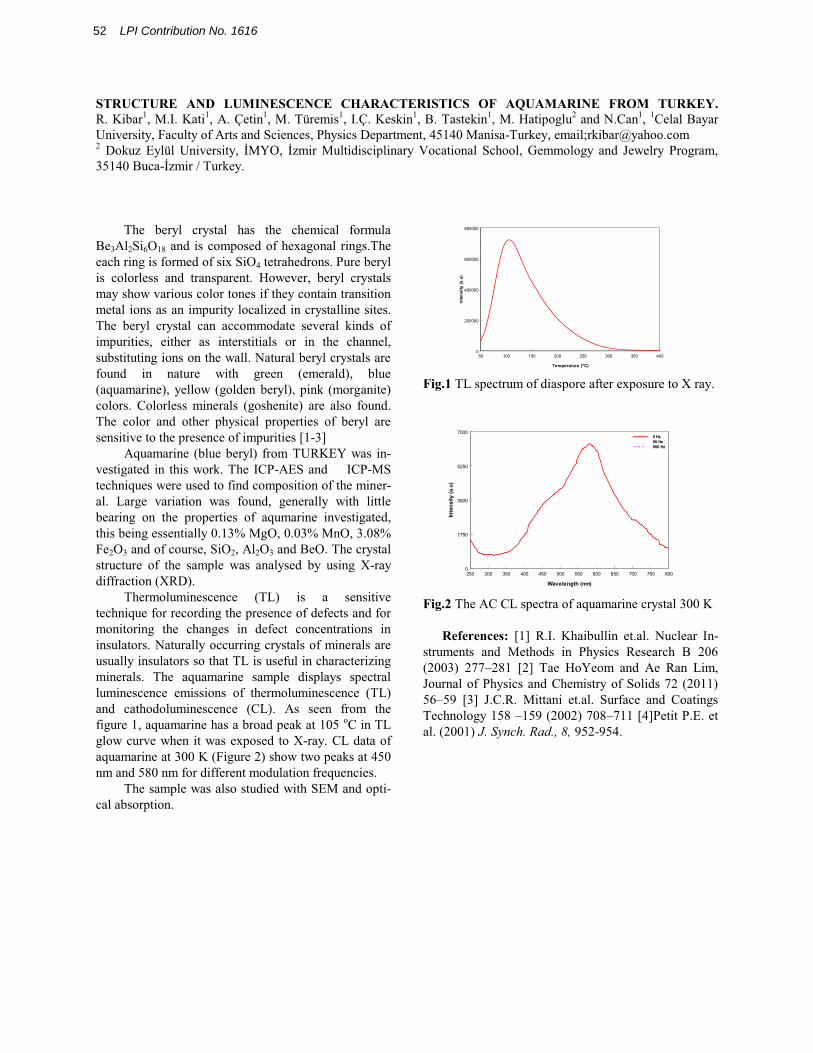
STRUCTURE AND LUMINESCENCE CHARACTERISTICS OF AQUAMARINE FROM TURKEY.
R. Kibar1, M.I. Kati1, etin1 1 . Keskin1, B. Tastekin1, M. Hatipoglu2 and N.Can1, 1Celal Bayar University, Faculty of Arts and Sciences, Physics Department, 45140 Manisa-Turkey, email;[email protected] MYO, zmir Multidisciplinary Vocational School, Gemmology and Jewelry Program, 35140 Buca- zmir / Turkey.
The beryl crystal has the chemical formula Be3Al2Si6O18 and is composed of hexagonal rings.The each ring is formed of six SiO4 tetrahedrons. Pure beryl is colorless and transparent. However, beryl crystals may show various color tones if they contain transition metal ions as an impurity localized in crystalline sites. The beryl crystal can accommodate several kinds of impurities, either as interstitials or in the channel, substituting ions on the wall. Natural beryl crystals are found in nature with green (emerald), blue (aquamarine), yellow (golden beryl), pink (morganite) colors. Colorless minerals (goshenite) are also found. The color and other physical properties of beryl are sensitive to the presence of impurities [1-3]
Aquamarine (blue beryl) from TURKEY was in-vestigated in this work. The ICP-AES and ICP-MStechniques were used to find composition of the miner-al. Large variation was found, generally with little bearing on the properties of aqumarine investigated, this being essentially 0.13% MgO, 0.03% MnO, 3.08%Fe2O3 and of course, SiO2, Al2O3 and BeO. The crystal structure of the sample was analysed by using X-ray diffraction (XRD).
Thermoluminescence (TL) is a sensitive technique for recording the presence of defects and for monitoring the changes in defect concentrations in insulators. Naturally occurring crystals of minerals are usually insulators so that TL is useful in characterizing minerals. The aquamarine sample displays spectral luminescence emissions of thermoluminescence (TL) and cathodoluminescence (CL). As seen from the figure 1, aquamarine has a broad peak at 105 oC in TL glow curve when it was exposed to X-ray. CL data of aquamarine at 300 K (Figure 2) show two peaks at 450nm and 580 nm for different modulation frequencies.
The sample was also studied with SEM and opti-cal absorption.
50 100 150 200 250 300 350 400
Temperature (oC)
0
200000
400000
600000
800000
Inte
nsity
(a.u
)
Fig.1 TL spectrum of diaspore after exposure to X ray.
250 300 350 400 450 500 550 600 650 700 750 800
Wavelength (nm)
0
1750
3500
5250
7000
Inte
nsity
(a.u
)
9 Hz90 Hz900 Hz
Fig.2 The AC CL spectra of aquamarine crystal 300 K
References: [1] R.I. Khaibullin et.al. Nuclear In-struments and Methods in Physics Research B 206 (2003) 277 281 [2] Tae HoYeom and Ae Ran Lim, Journal of Physics and Chemistry of Solids 72 (2011) 56 59 [3] J.C.R. Mittani et.al. Surface and Coatings Technology 158 159 (2002) 708 711 [4]Petit P.E. et al. (2001) J. Synch. Rad., 8, 952-954.
52 LPI Contribution No. 1616

COMPOSITIONAL ANALYSES OF F, Cl AND OH BY RAMAN SPECTROSCOPY IN APATITE FROM
MAFIC-ULTRAMAFIC PIPES OF THE IVREA VERBANO ZONE (NW ITALY). P. Kollegger1, F. Zacca-rini1, R. J. Bakker1, G. Garuti1 and O.A.R. Thalhammer1, 1Department of Applied Geosciences and Geophysics, University of Leoben, Peter Tunner Str.5, Leoben, Austria ([email protected]).
In this contribution we present the Raman spectra obtained from selected apatites occurring in mafic-ultramafic pipes of the Ivrea Verbano zone (WN Italy). These pipes, hosting Ni Cu Platinum group elements (PGE) sulphide deposits, have an alkaline signature and are enriched in volatiles and fluids that encouraged the formation of hydromagmatic phases like apatite, phlogopite and amphibole [2]. Based on accurate elec-tron microprobe analyses, the apatites of our study are characterized by a wide spectrum of substitution of F, Cl and OH and therefore all the three end-members (flour-, hydroxyl- and chlorapatite) have to be taken in consideration for the Raman study.
Electron microprobe quantitative analysis is one of the most used techniques to analyse apatites and to discriminate the three endmembers. However, the anal-ysis of light elements (Z<9) such as O and F, by elec-tron microprobe, presents numerous problems and H cannot be detected. As a consequence, OH can be only calculated and reliable analyses of F can be obtained only with very modern electron microprobe, equipped with appropriate diffracting crystals. Furthermore, apa-tite is generally unstable under the high-voltage elec-tron beam that produces relatively large craters on the crystals. Therefore, the size of apatite should be at least bigger than 50 microns. Thus, to analyse precisely apa-tite using electron microprobe is not always an easy target.
In the last 20 years, Raman spectroscopy was suc-cessfully applied to determine the compositional varia-tion in apatite, involving great application areas such as biological research (dental and bone investigation), palaeontology (fossilized teeth) and medicine (cancer research) ([1],[4],[3]). These previous studies indicate that Raman spectroscopy can provide, in principle, relatively simple and fast semi-quantitative analyses of the anion composition also on very small apatite crys-tals.
The structure of apatite, (Ideal: Ca5(PO4)3(F,Cl,OH)), is influenced by the different size and structural position of the monovalent anions (F, Cl and OH), shifting the cell parameters. A free phosphate group (PO4
3-) possesses four Raman-active
1 (980 cm-12 (363 cm-1
3 (1082 cm-1) and
4 (514 cm-1). In our samples we could observe that each of the modes is shifted to lower levels and that the FWHM of the single peaks are widened by the incor-poration of other species than F. Because our samples do not possess apatites with an end-member composi-
tion we included other studies ([1],[5],[4],[6]) for cor-relation with our data.
The results of this study demonstrated, for the first time, that there is a linear correlation between the Ra-man shift and the FWHM of the peaks, with the com-position of the apatites not only between two end-members, but between the end-member fluorapatite on the on the one hand and the end-members hydroxyap-atite plus chlorapatite on the other hand (Fig.1). We showed that the influence of Cl and OH on the Raman active modes of the apatite´s phosphate group is nearly the same. Therefore Raman investigations provide an instrument for the quantification of F contents in com-parison with the sum of Cl plus OH.
Knowledge of the presence of F, Cl of OH in apa-tite provides information about fluid phase properties at formation conditions in geological environments.
Fig. 1: a) peak position, and b) FWHM of the 1
PO43- band in correlation to XF = F/(F+Cl+OH) [apfu.].
Open circles: this study; Crosses: F-Cl apatites; Trian-gles: OH apatites; Rectangle: (OH)0.29Cl0.69F0.02 apatite.[1],[4],[5],[6]
References: [1] DeMul F.F.M. et al. (1986) Jour-nal of Dental Research, 65(3), 437 440 [2] Garuti G.et al. (2001) Journal of Petrology, 42(2), 433 457 [3] Haka A.S. et al. (2002) Cancer Research,62(18), 5375 5380 [4] Pasteris J.D. et al. (2004) Bio-materials, 25(2), 229 238 [5] Tsuda H. and Arends J. (1993) Journal of Dental Research, 72(12), 16091613 [6] Yu H. et al. (2007) Journal of Physics and Chemistry of Solids, 68(10), 1863 1871
53CORALS II Conference
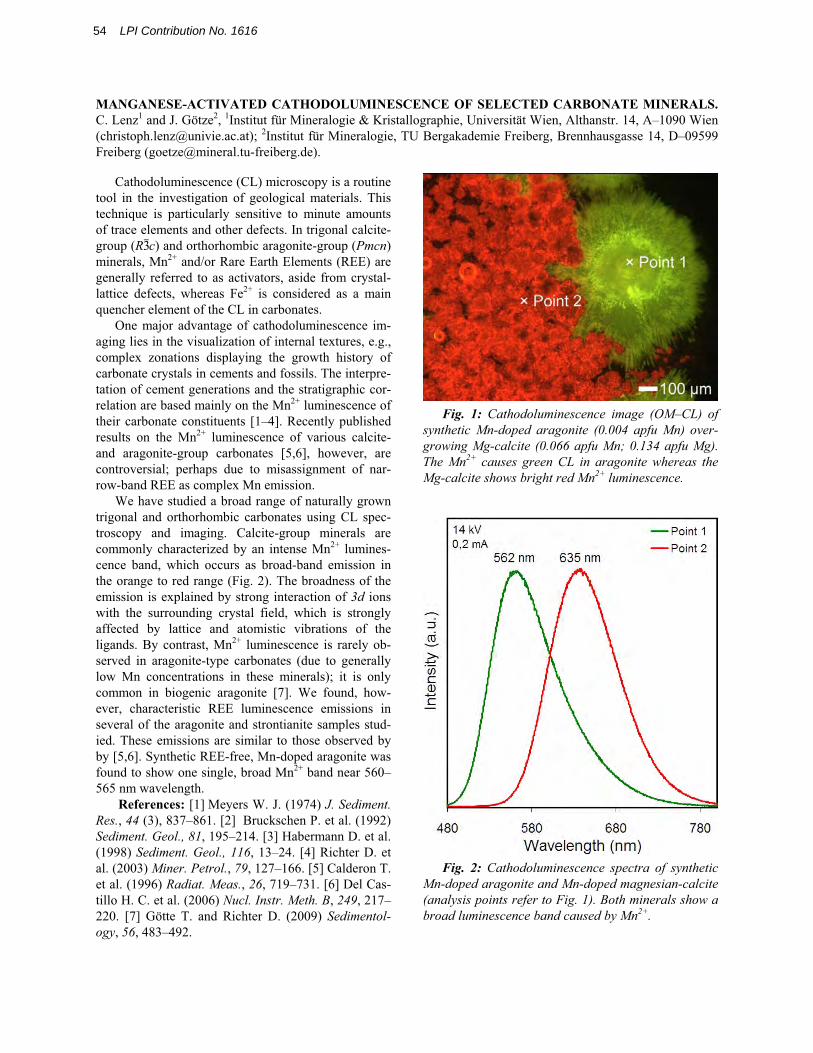
MANGANESE-ACTIVATED CATHODOLUMINESCENCE OF SELECTED CARBONATE MINERALS.C. Lenz1 and J. Götze2, 1Institut für Mineralogie & Kristallographie, Universität Wien, Althanstr. 14, A–1090 Wien ([email protected]); 2Institut für Mineralogie, TU Bergakademie Freiberg, Brennhausgasse 14, D–09599 Freiberg ([email protected]).
Cathodoluminescence (CL) microscopy is a routine tool in the investigation of geological materials. This technique is particularly sensitive to minute amounts of trace elements and other defects. In trigonal calcite-group (R c) and orthorhombic aragonite-group (Pmcn)minerals, Mn2+ and/or Rare Earth Elements (REE) are generally referred to as activators, aside from crystal-lattice defects, whereas Fe2+ is considered as a main quencher element of the CL in carbonates.
One major advantage of cathodoluminescence im-aging lies in the visualization of internal textures, e.g., complex zonations displaying the growth history of carbonate crystals in cements and fossils. The interpre-tation of cement generations and the stratigraphic cor-relation are based mainly on the Mn2+ luminescence of their carbonate constituents [1–4]. Recently published results on the Mn2+ luminescence of various calcite- and aragonite-group carbonates [5,6], however, are controversial; perhaps due to misassignment of nar-row-band REE as complex Mn emission.
We have studied a broad range of naturally grown trigonal and orthorhombic carbonates using CL spec-troscopy and imaging. Calcite-group minerals are commonly characterized by an intense Mn2+ lumines-cence band, which occurs as broad-band emission in the orange to red range (Fig. 2). The broadness of the emission is explained by strong interaction of 3d ions with the surrounding crystal field, which is strongly affected by lattice and atomistic vibrations of the ligands. By contrast, Mn2+ luminescence is rarely ob-served in aragonite-type carbonates (due to generally low Mn concentrations in these minerals); it is only common in biogenic aragonite [7]. We found, how-ever, characteristic REE luminescence emissions in several of the aragonite and strontianite samples stud-ied. These emissions are similar to those observed by by [5,6]. Synthetic REE-free, Mn-doped aragonite was found to show one single, broad Mn2+ band near 560–565 nm wavelength.
References: [1] Meyers W. J. (1974) J. Sediment. Res., 44 (3), 837–861. [2] Bruckschen P. et al. (1992) Sediment. Geol., 81, 195–214. [3] Habermann D. et al. (1998) Sediment. Geol., 116, 13–24. [4] Richter D. et al. (2003) Miner. Petrol., 79, 127–166. [5] Calderon T. et al. (1996) Radiat. Meas., 26, 719–731. [6] Del Cas-tillo H. C. et al. (2006) Nucl. Instr. Meth. B, 249, 217–220. [7] Götte T. and Richter D. (2009) Sedimentol-ogy, 56, 483–492.
Fig. 1: Cathodoluminescence image (OM–CL) of synthetic Mn-doped aragonite (0.004 apfu Mn) over-growing Mg-calcite (0.066 apfu Mn; 0.134 apfu Mg). The Mn2+ causes green CL in aragonite whereas the Mg-calcite shows bright red Mn2+ luminescence.
Fig. 2: Cathodoluminescence spectra of synthetic Mn-doped aragonite and Mn-doped magnesian-calcite (analysis points refer to Fig. 1). Both minerals show a broad luminescence band caused by Mn2+.
54 LPI Contribution No. 1616

EVALUATION OF PORTABLE RAMAN FOR THE CHARACTERIZATION OF SALT EFFLORESCENCES AT PETRA, JORDAN. P. López-Arce1, A. Zornoza-Indart1, C. Vázquez-Calvo1, M. Go-mez-Heras 1,2, M. Álvarez de Buergo1 and R. Fort1. Instituto de Geología Económica/Instituto de Geociencias (CSIC-UCM), C/ Jose Antonio Nováis 2, Madrid 28040, Spain ([email protected]), 2Departamento de Petro-logía y Geoquímica, Universidad Complutense de Madrid. C/ Jose Antonio Nováis 2, Madrid 28040, Spain
Abstract: The advantages of using a portable Raman equipment are contrasted with some of its shortfalls, that make other analytical techniques necessary to characterize salt efflorescences on historic buildings. In-situ analyses were carried out at some monuments of Petra (Jordan). Samples were also taken to the labo-ratory and analyzed with this and other techniques. This research shows the pros and cons of these ana-lytical techniques - and how they complement each other- to identify the presence of soluble salts, which are deeply damaging these rock-cut monuments by salt crystallization processes.
Fig.1. ‘Silk Tomb’, Petra (Jordan) and Raman analyses of salt efflorescence sample from this monument.
Materials and Methods: Twenty two samples of salt efflorescences were collected from the so-called ‘Silk Tomb’ (Fig.1a) and the ‘Monastery’ at the Ar-chaeological Park of the Nabatean City of Petra (Jor-dan) in a first field trip to the site. All the samples were analyzed in the laboratory through X-ray diffraction (XRD). The salt efflorescences samples were also tested in the laboratory with a portable Raman equip-ment (Inspector Raman Delta Nu with a 785 nm diode laser for excitation) together with pure commercial salts, in order to create a database and to set a method-ology, testing the most accurate analyses conditions for making easier the in-situ monitoring in a second field trip to the site. Approximately 100 measurements were made in the field, with the portable Raman equipment, from those areas previously sampled and their surroundings. Samples containing all type of salts were also analyzed with Environmental Scanning Mi-croscopy with Energy-Dispersive X-ray Spectroscopy and Cathodoluminiscence detectors (ESEM-EDS-CL).
Results and discussion: Salt efflorescences of gypsum (CaSO4 ·2H2O) and niter (KNO3) were quickly and easily identified with Raman spectroscopy (Fig. 1b) in most of the samples analyzed in the build-
ings. The in-situ monitoring of these salts in cleaning and consolidation treatments of artworks helps restor-ers to decide when the treatment is concluded [1]. As-sessment of stone deterioration by salt crystallization can also be carried out with portable Raman [2].
Laboratory and in-situ Raman analyses. A higher number and better quality spectra, with less fluores-cence, of salt efflorescences were obtained in the field compared to the lab (Fig.1b). In-situ-monitoring avoids also sampling and environmental changes that affect phase transitions of hygroscopic salts (gypsum) during transportation to be analysed in the lab.
XRD, ESEM-EDS-CL analyses. Some of the most common salts sampled from the buildings and ana-lyzed in the laboratory with XRD (Fig.2a), contained halite (NaCl) and sylvite (KCl), which are not sensible to Raman vibrations due to their strong ionic bond.
Fig.2. a) XRD of the sample shown in Fig 1b; b) ESEM-EDS of same sample; c) CL spectra of Na and K chlorides; d) Pancromatic map showing CL of these salts.
Nevertheless, these chlorides show strong lumines-cence, and can be easily identified by means of ESEM-EDS-CL (Fig.2b-d). Their CL signals allow distin-guishing the stronger luminescence of halite that could be related to the presence of Mn2+ in its crystal lattice [3]. Other salt efflorescences, easily identified with Raman do not show luminescence, as gypsum, or are not detected with ESEM-EDS, as N in Niter.
References: [1] Martínez-Azcarazo I. et al. (2010) Anal Bioanal Chem, 397, 2717–2725 [2] Kramar S. et al. (2010) J Raman Spectrosc 41(11), 1441-1448 [3] Gorobets V. S. and Rogojine A. A. (2002) LuminiscentSpectra of Minerals, 300pp.
55CORALS II Conference

LASER INDUCED ARTIFICIAL FULGURITES FORMATION: PRELIMINARY RESULTS.S. Martinez-Ramirez1, J.J. Camacho2 and L.Diaz1
1Instituto de Estructura de la Materia (CSIC). C/Serrano 121. 28006 Madrid, Spain, [email protected];[email protected], 2 Departamento de Química-Física Aplicada, Facultad de Ciencias, Universidad Autónoma de Madrid, Cantoblanco, 28049 Madrid, Spain, [email protected]
Introduction: Fulgurites are glassy irregular tubes produced by the fusion of soil, which has been struck by lightning. The formation of a fulgurite occurs dur-ing the rapid transfer of lightning energy to a narrow channel in the ground [1, 2].
Artificial building materials are made from sili-ceous sand, calcite and ferrous materials from the same origin that the soil where fulgurites are formed.
IR lasers are an adequate tool to supply onto a lim-ited area of a surface controlled thermal energy. The interaction of CO2 lasers pulses with the surface mate-rial induces ablation and under specific conditions it could produce also structural transformations and crys-tallization on the surface material [3].
Raman spectroscopy is a non-destructive analytical technique that has been used to study a wide range of glassy silicate materials. Those materials are character-ized by a number of broad bands that reflect the framework of the silicate structures [4, 5].
Aim: The main objective of this work is to study the formation of fulgurites in artificial building materi-als irradiated with CO2 laser radiation
Methodology: Samples of 1x1x6 cm of the mortar were exposed to CW CO2 (Synrad Firestar t80) laser radiation at different powers (8W and 40W) and dif-ferent times (5 and 30 seconds).
Optical Emission Spectroscopy (OES) was used to analize the composition of the plasma plume.
After the exposure time, samples were studied by Raman spectroscopy. Raman spectra were recorded with a confocal Raman microscope (Renishaw RM2000) equipped with a 514-nm laser, a Leica mi-croscope, and a thermoelectrically cooled CCD cam-era. The spectra shown were obtained with a 50× ob-jective lens. The laser output was 100 mW, and the exposure time 10s. The area where vibration modes are found, i.e. 4000–100 cm 1, was the spectral region scanned.
Results: Figure 1 shows the aspect of the sample under CO2 laser radiation showing the glassy fulgurite formed after irradiation. The size of the spot is bigger when higher power radiation. For the same power radiation longer time exposure produce bigger spot.
Raman spectra of the artificial fulgurite is showed in Figure 2. The presence of crystalline quartz (464; 355 and 210 cm-1 band) as well as several small broad bands from different Si-O bonds can be observed. When 50% of the laser power irradiated the sample, no
quartz was observed; however a small band at 965 cm-
1 indicate the presence of Si2O7 groups. The surface temperature reached at different conditions of irradia-tion were measured from emission spectra and it range from 4000 K to 5000 K.
Conclusions: For the first time fulgurites forma-tion from an artificial building materials from CO2
laser radiation has been studied.
Figure 1. Image of artificial fulgurite; left: irradiated 5s at 8W; middle: irradiated 30s at 8W and right: irra-
diated 5s at 40W
1100 1000 900 800 700 600 500 400 300 200
wavenumber (cm-1)
5s, 50% 30s 10% 5s, 10%
965
805690
464
397
355
258 210
Figure 2. Raman Spectra of artificial fulgurite
References: [1] Garcia-Guinea J. et al. (2009) Mi-cro-Raman Spectroscopy and Luminescence Studies in the Earth and Planetary Sciences 128-134.
[2] Carter E.A. et al. (2010) Phil. Trans. R. Soc. A. 368, 3087–3097.
[3] Díaz L., et al. (2006) Appl. Phys.A 85, 33-37 [4] Colomban P (2006) J. Am. Ceram. Soc. 88,
390-395.[5] Martinez-Ramirez S (2006) J. Raman Spectrosc
37, 555-561. Acknowledgments: This research was supported by the MICINN (Ministerio de Ciencia e Innovación) (BIA00767-2008, CTQ2008-05393/BQ and CTQ2010-15680) and Ministerio de Fomento (C31/2006).
56 LPI Contribution No. 1616

RAMAN SPECTROSCOPIC STUDY OF ALLENDE (CV3) AND SARATOV (L4) CHEMICAL
RESIDUES AND ITS IMPLICATION TO PHASE Q. J. Matsuda1, K. Morishita1, M. Nara2 and S.
Amari3, 1 Department of Earth and Planetary Science, Graduate School of Science, Osaka University,
Toyonaka 1-1, Osaka 560-0043, Japan (e-mail: [email protected]), 2Laboratory of Chemistry, College of Liberal Arts and Science, Tokyo Medical and Dental University, Chiba 272-0827, Japan, 3Laboratory for Space Sciences and the Physics Department, Washington University, St. Louis, MO 63130-4899, USA.
Introduction: The noble gases have played important roles to study various events during the evolution of oursolar system. The planetary noble gases in meteorite are highly enriched in heavy noble gases. They are carried byso-called “phase Q” . Phase Q is in a HF/HCl resistant residue (about 0.5% of the bulk meteorite) of the meteorite,but is destroyed by oxidants such as HNO3, Na2Cr2O7 etc. Phase Q is now identified as carbonaceous material [1],
but its precise chemical state is not yet known. In this study, we compared the Raman spectroscopic data of theoriginal HF/HCl residues (Q-rich) and their etched residues (Q-poor) for Allende (CV3) and Saratov (L4), in order to examine the carbon feature of the phase Q. Both phase Q and presolar diamond are preserved in the Allendemeteorite, but presolar diamonds are not detected in ordinary chondrites of petrologic type >3.8 [2]. Thus we hopedto be able to determine the phase Q in Saratov without the disturbance of presolar diamond.
Sample and Experimental: We prepared the original HF-HCl residues using a chemical procedure commonlyused to concentrate Q. The etched residues were prepared with an oxidant from the original residues. We alsoprepared a colloidal fraction for the Allende original residue. The noble gas measurements were carried out using theVG5400 noble gas mass spectrometer in Osaka University. The Raman spectroscopy was carried out using a Ramanmicroscope (Kaiser Hololab 5000, Kaiser Optical Systems, Inc.) with a 532nm YAG laser.
Results and Discussion: The noble gas and Raman data of the Allende chemical residues are given in Matsudaet al. [3]. As for Saratov, only the noble gas data of the HF-HCl residue and a bulk sample are given in Matsuda et
al. [4]. We confirmed that the heavy noble gases were surely enriched in the original residues (Q-rich) but depletedin the etched residue (Q-poor) in both chondrites.
Noble gas concentrations in the colloidal fraction of Allende original residue are a factor of 2-4 higher than those in the non-colloidal fraction [3]. The Raman spectroscopic parameters show that the colloidal fraction of the originalresidue is more amorphous compared to the non-colloidal fraction in Allende [3]. The ion irradiation evolves thecarbon into more amorphous [5], indicating that the “plasma model” [6] is a plausible one as the origin of phase Q[3]. As for Saratov, the original residue contains only a portion of the trapped heavy noble gases, but they arelargely removed in the etched residue, suggesting that phase Q is surely present in Saratov but is damaged bythermal metamorphism [4].
The Raman spectroscopic parameters such as peak positions and intensity ratios of the original residues are very much different for Allende and Saratov. The Raman spectroscopic parameters of the original residues have changeddiscretely after the oxidation in both meteorites. This suggests that the oxidization not only dissolves out theoxidizable carbon but also changes the whole carbon structure. After the oxidation, the D band positions at about
1350 cm-1 increased in both meteorites, but the intensity ratio of D and G bands (ID/IG) decreased in Allende but
increased in Saratov. The different change of ID/IG ratios may be due to the difference stage of graphitic carbon for
Allende and Saratov. Allende carbon is in the stage of nanocrystalline graphite to amorphous carbon (Stage 2 inFerrari and Robertson [7]) where the decrease of ID/IG ratio indicates the evolution to amorphous state. Meanwhile,
Saratov carbon is in the stage of graphite to nanocrystalline graphite (Stage 1 in Ferrari and Robertson [7]) where the increase of ID/IG ratio indicates the evolution to amorphous state. Thus our Raman data indicate that the
oxidation changes the carbon structure to more amorphous (disordered) state in both meteorites.Our results indicates that release of Q-gases is simply due to the disordered rearrangement of carbon structure by
oxidation [1,8], although there still is a possibility that phase Q consists of very fine grains of a discrete phase and it is always covered by the major disordered carbon under the Raman spectroscopic observation [3].
References: [1] Ott U. et al. (1981) Geochim. Cosmochim. Acta, 45,1751-1788. [2] Alexander C. M. O' D. etal. (1990) Earth Planet. Sci. Lett., 99, 220-229. [3] Matsuda J. et al. (2010) Geochim. Cosmochim. Acta, 74,5398-5409. [4] Matsuda J. et al. (2010) Meteorit. Planet. Sci., 45, 361-372. [5] Brunetto R. et al. (2009) Icarus,200, 323-337. [6] Matsuda J. and Yoshida T. (2001) Meteorit. Planet. Sci., 36, A127. [7] Ferrari A. C. and Fobertson J. (2000) Phys. Rev., B61, 14095-14107. [8] Ott U. (2002) Rev. Mineral. Geochem., 47, 71-100.
57CORALS II Conference

OPTICALLY STIMULATED LUMINESCENCE RESPONSE OF MODERN FLASH-FLOOD DEPOSITS IN SMALL MOUNTAIN CATCHMENTS. A. Medialdea1, N. Porat2, G. Benito1 1Museo Nacional Ciencias Na-turales-CSIC, Serrano 115-bis, 28006 Madrid, Spain, 2 Geological Survey of Israel, Jerusalem, Israel. Correspondence author: [email protected]
Introduction: OSL is increasingly being used as an accurate tool in dating recent flood deposits for improved flood hazards assessment. This work pre-sents a study on the OSL response of sediments from recent (last 200 years) flash-flood deposits in the Gua-dalentín River (SE Spain). Two problems can be an-ticipated in the luminescence response for dating such recent deposits. Firslty, poor bleaching due to short duration of flood-flash flows and limited transport distance at the catchement headwater. Secondly, geo-logical setting dominated by carbonate bedrock [1]. This study aims to provide preliminary diagnostic analysis with those parameters which might show an irregular OSL behaviour on these young samples [2]. The samples showed a positive behaviour despite their young age, namely a high signal-to-noise ratio making possible to measure the response at low doses, and lack of thermal transfer after preheating treatment. Furthermore, tests on the recuperation and recycling ratio were carried out showing a reproducible re-sponse. Possible feldspard contamination was checked by using IRSL. Equivalent Dose (De) values were de-termined for 24 aliquots. The results show a high scat-ter which could be caused by a insufficient bleaching prior to deposition. This effect typically results in an overstimation of the age.
180 200 220 240 260 280 300-10
-5
0
5
10
15
20
25
De
(s)
Temp ºC
0,0
0,5
1,0
1,5
2,0
2,5
3,0
3,5
Recycling ratio
Figure 1- Measuring cycle effect on the recycling ratio (circles); IR stimulation effect on recycling ratio (tri-angle); De values (squares).
These preliminary OSL tests point out that single grain analysis may provide more accurate De values
thus being the appropiated procedure for dating these flash flood deposits.
References:[1] Benito, G., Rico, M., Sánchez-Moya, Y.,
Sopeña, A., Thorndycraft, V.R., Barriendos, M. (2010) The impact of late holocene climatic variability and land use change on the flood hydrology of the Guada-lentin River, Southeast Spain. Global and Planetary Change, vol. 70, Issues 1-4, 53-63.
[2] Madsen, A.T., Murray, A.S. (2009) Optically stimulated luminescence dating of young sediments: A review. Geomorphology, 109, 3-16.
58 LPI Contribution No. 1616

��������������� � ���� �� ����������� ������� ��� ����������� ��� ���������������������������������������������������� ������������������ ���������������������� ��������������������������� �� ��!����"#��$����#����%&������������''()���������$*����+,�����-.�������/���0�*����,��������1�!,�2��3!��2�����3�2� �������1�!,�2���4��-����������,* ���������')5)���������$*�����
������������� � � ��6����� 67������� ���� �� ��� 2�7��� �
����2�������8�9������9��6�2�-������ �������2��������������,� �2� ���� 96�26� 8��,� ��� �9� ��,*�������� ���� 6��6�*�������������27����� ������8��6���������� ����7���,����26���� :���*��� 6�-�� ���� ����2���� �6�� 2 ��6���8��,����2�,*������ ���� � ��� �;���� �6�� 2���������� ��<������ 8����6����8��,�����������������6����9��2�������,���6�������2 ��6������,�7� �� *������� ��� �6���� ���� ������ � �6���6��6�7�6�-������ ��������2����7�����
��� �6�� *������� 9��=�� 9�� 2�7��� ��� ���� �����2��������2 ��6������8��,�����<�������� �������8���$�5���������� >�� ����,�� �6��� �6�� �<������ ,��,��� 8��,� �6��:���*�� ��������������� ���26��#6�������,*�������� ���������6��"�?�@� � ���� ���-��������8����=�����������96�26����,�� ��� �� ������������ ���� 2�,*����� 7� �� �� 67�������A�B���������� ���2��8��,�� �6�� �6������2� �,��� ��96�26� *����2�� �6��� 2 ��6������ ���� ��� �� 8��,� �6�� �27�2����� ��� �6��*������� ��� �7��2���� �6���,�7��;���� � �9��6���27�2�����A���CB��
�!"#��$#��%&� %""%�%��'� %��� "���#���# � :;*���,�����9����2���������������6��D��6����������� ������7� :�-����,���� �6�, ��� +D��:�/�� �� ��,� ������26�, ��� 8�2� ��7� �8� ������� ��� ����� �� ��!�����������$*����� ?����9���� ����� ��� ��-��� � *��������� ��� � ������6��*6����������,��8��6���7���,�D�������$�5��>��6�-�� ��� 7��� �6�� 2 ��6�����=�����2� 8��,������9��6� �6���D(()�$*�2���,����� +D��� ���� ���E ���/�� 7�����������))F�'))F�5))�����-��F,,���88��2��������������������� ��������� �����"�GE�@�(C���,���
�#'�&�' � ��� 3������ �� 9�� 2�,*���� �6�� �9�� 3��,���7���*��=��+H��')������C')�2,�/��8�����,� �2� �������88������������G����������� -���������2 ��6����������*�2��-� 7�� >�� � ���-�� �6��� ��� ��� *���� �� ��� ��88���������� ��9���� ��26� ������ �8� �6��,� �2� ��� 7� ?�,��� �*�2����2�*7�� ���*���� �6�� ?�,��� �6�8�� ��88����2�� ��� -��7��,� � +H�� 2,�/� ��9���� �6�� ����� -��� ���� �6�� 2 ��6����������������6�� �� ��������6����6��*��=�������������I')�2,���2�����*�����������6����$�5���2��������8�����6�� 2�7��� ������� +���� �6�� �9���� �*�2���� ��� 3���� �/���#6���2�� �� ����������6��8�2���6������ 8����+����� ��� ��/�����;*� ���8��,��6��2 ��6����������2��������2���������6��2��2��������������6����,��������<�������� ��������8��6������2��2� 2�,*�������� ��� �;2������� *��2�*�������� ��=���* �2��������������2�������8� �6���� 8����*��=�� ����I')�2,����
����&�'���' � #6���� ���� ��� ���� �8� �� ���*� * ����� ���2� �,*�����2�� �2����� ��� 2��� �;* ���� ���� ���� ������� � ��88������������ ���� 2�7�-� 2����,� *��2������
96�26� ,�7� �22��� ��� �6�� ���� ����� 3�������� �;* ������*��-���� 7� ��� �6��3���� �� 2��� �� ����2������ �����88��������������8� �6����88������������*��2���� +3���� �/��3���������6�9�� �26�,���2� 7� �6�� �-� ������ �8� �� 2�7�,��,�������6� �6�� ��,�G� +3���� ���/� ��7�,��,���2� 26�, ���9��6�D������ ���7�-� ��� ����+3�������/�� ��6�����8��,����������2��2�����������8��6���� ������6����,��������� ������ +9��6� ���9��6���� *��2�*�������/�� +3���� ���/�0�88����������� 26�, ��� 7� 2 ��6������� ���� +3���� ��0/� ��7�,��,�� ��2���� �8���� ��*������������� ���� 2 ��6����� ����� � ��������96�26�*����2�� � �6��*�����-�� ��7��27��8��6�� �<���� ���*�2�� ��� �6�� �27� 2������ D7������� �� ��� � ���-��� 7�@� � ��J�� *�� �� ��� �6�� ���8�2�� ��**���� �6����6���7� �2���������**��������;���������8��,��6������������6����� ���2��22�������,���������A�B��
$�,� ����;*���,�����9� � ��*��8��,�������6��8������9��6� ��6��� �� ��� +"��$�5� ���� ,�;�����/� ���� -� ��� ���+$����D�$/�� �������2�������:���*���3��,��6��� ������������� 9��9� � *��*���� �� 2�,*�������� �,��� � 8��� :���*�� �����**����?�,����*�2����2�*7������*������� �������,����8����6����;��,������������6������ �����
��(��)&#�*#$#��' � >�� �6��=� ���#��+�$0�))K)))5(/� ���� 14����?:$$� +$�))IF��1�((�/����%�2���8����6����**������
900 1000 1200 1300 14000
1000
2000
30000
1000
2000
30000
1000
2000
3000
SO2-
4
Inte
nsi
dad
(u.a
)
Raman Shift (cm-1)
CO2gas
Inte
nsid
ad(u
.a)
SO2-
4
Inte
nsid
ad(u
.a)
CO2
clathrate
CO2
dissolved
�3���������$*�2�����8��6�������������������� -����������<������� �������8���$�5������*�2�����8��6����,��2�,*�������8����2 ��6���������
�3������ ��� ���,���2� ��88����2������� 7� 2 ��6������� ���� �� ��<�����2�7�-� 2����,�*��2�����
�#+#�#��#' ��A�B�0� �������������� ��+�))(/������������5K�5I)��A�B��������� ��������������� ��+�))(/������������5I�()(�� ACB� L�-� ���� ��� @�� ��� � �� +�)))/� �� ����� ������C5)�C5C���
59CORALS II Conference

EVENTS IN THE LIFE OF THE OLDEST ZIRCON ON THE MOON: A COMBINED SIMS, CL, EBSD
AND RAMAN STUDY. R. T. Pidgeon1a, A. A. Nemchin1, M. Grange1, N.Timms1, 1Department of Applied Geol-ogy, Curtin University, Kent Street, Bentley, WA 6102, Australia (a r.pidgeon @curtin.edu.au)
Introduction: Zircon has been identified in a number of KREEP-rich breccias in lunar samples. Precise U-Pb isotopic analyses of these grains began in the 1980’s, with the development of the SHRIMP ion microprobe [1,2] and zircon U-Pb geochronological research since this time has revealed a complex history of lunar magmatism beginning at c 4.42 Ga, the age of the oldest zircon on the moon [3] and ending at c. 3.9 Ga, the age of the later heavy bombardment [4]. An important question that needs to be resolved is whether magmatic events dated by zircon are impact related or represent endogenic lunar igneous activity. In most cases information is not available to resolve this issue but where SHRIMP U-Pb measurements are made on skeletal zircons that crystallized in cooling impact in-duced melt the zircon age clearly dates an impact event. A second possibility for dating an impact is by investigating the U-Pb age pattern in a zircon that has been disturbed by one or more impacts. This is lessstraightforward and to unravel the history of such grains it is necessary to apply a combination of optical and cathodoluminescence (CL) imagery, electron backscattered diffraction (EBSD) and Raman spectros-copy besides SIMS U-Pb measurements. In this contri-bution we describe results using these techniques on the oldest lunar zircon found so far [3]. This c. 4.42 Ga grain from the matrix of Apollo 17 breccia sample 72215,195 contains evidence of its igneous origin and also of one or more later impact events.
The c. 4.42 Ga lunar zircon: The location of this zircon in the breccia matrix is shown in the following CL image. The grain is a broken fragment , about
500μm in diameter, with an equidimensional, rounded form suggesting mechanical abrasion during transport. The main body of the grain has a uniformly low CL
intensity and grey-pink birefringence indicating ex-treme radiation damage. Exceptions are a small bright (CL) patch on the left side of the grain and a bright linear sliver along the top. The grain does not have PDFs or other structures indicative of severe impact.
SHRIMP U-Pb measurements: A total of 41 SHRIMP U-Pb isotopic measurements were made on this grain. The 207Pb/206Pb ages vary within the grain from 4.42 Ga in two areas in the centre to 4.35 Ga in areas of bright CL. The inhomogeneous age distribu-tion is attributed to an impact event at c. 4.35 Ga. The reduction in 207Pb/206Pb age is due to the progressive and incomplete removal of radiogenic Pb from the zircon, despite the grain having little radiation damage. Whereas it would appear at first sight that only Pb has been lost from the grain it can be demonstrated from a plot of 207Pb/206Pb age versus U and Th that some loss of these elements has also occurred in areas of bright CL.
EBSD and Raman measurements: EBSD, opti-cal birefringence and Raman intensity maps and the distribution of U and Th, show an identical pattern delineating the distribution of radiation damage in the grain. A comparison of this pattern with the Pb-Pb age distribution shows that these are not the same indicat-ing that Pb loss occurred independently of the distribu-tion of U and Th and the radiation damage at c. 4.35 Ga. The Raman width data confirm the highly radia-tion damaged structure of the zircon. By comparisonwith Raman data from unannealed zircon grains it is evident that radiation damage in the c. 4.42 Ga grain has been annealed by a later event.
History of the c. 4.42 Ga zircon: A combinedSIMS, CL, EBSD, Raman and optical investigation has revealed a complex history for the grain from initial crystallization at c. 4.42 Ga, severe chemical distur-bance at c. 4.35Ga and a number of impact and trans-port events culminating in final deposition and anneal-ing at c. 3.8 Ga.
References: [1] Compston W. et al. (1984) JGR,89, B525-B534. [2] Pidgeon R.T. et al. (2010) Precam.Res., 44-49. [3] Nemchin A.A. et al. (2009) NatureGeosc.,2, 133-136. [4] Nemchin A.A. et al. (2008) Geochim. Cosmochim. Acta. 72, 668-689.
60 LPI Contribution No. 1616

SPECTRA LUMINESCENCE OF URANYL GROUPS ASSOCIATED TO SILICA PHASES IN HYDROTHERMAL AND SEDIMENTARY OPALS FROM MADRID (SPAIN). Pozo, M.1, Garcia-Guinea, J2, Furio, M2., Fernandez-Cortés, A.2, Correcher, V.3 1Departamento de Geología y Geoquímica. Universidad Autónoma de Madrid. 28049 Spain. 2Museo Nacional Ciencias Naturales. CSIC. 28006 Madrid. Spain. 3CIEMAT. Av. Com-plutense 22. Madrid 28040, Spain. Correspondence author: [email protected]
HYDROTHERMAL OPAL.- The late hydrothermal activity occured in the La Cabrera (Madrid) granitic pluton along with miarolitic cavities and pegmatitebodies produced different mineral parageneses linked to the temperature decreasing. The maximun hydro-thermal activity ocurred at 250ºC ± 50ºC decreasing up to circa 140ºC. Accordingly, the pegmatitic cavities of the Cabrera granite are zoned from the inner to theouter as follows: (i) calcite with gypsum, opal, uranos-pinite and johnbaumite in the core, (ii) prehnite, lau-montite, heulandite-Ca, stilbite-Ca, chabazite, fluora-pophyllite, datolite and bavenite, (iii) epidote, (iv) quartz–feldspar pegmatite being the outer layer of the cavity, and (v) granite as the host rock.
Figure.1.- ESEM pictures of the hydrothermal opal parageneses of La Cabrera (Madrid): (a) Grey back-ground is opal, white sphaeres are johnbaumite, grey needles are calcite and grey masses resembling liquid are gypsum. (b) Black background is opal, white sphaeres are johnbaumite coating opal (c) Uranospinite plates on the former parageneses (d) Broken opal with cavities and aggregate of johnbaumite on the upperright (white). SEDIMENTARY OPAL.- They are are thin siliceous layers and infills of translucent white colour up to 2 cm thick. The silica phases sporadically occur asso-ciated to chert nodules in the sepiolite deposit from the Batallones Butte (Neogene Madrid Basin, Spain). These layers are commonly filling or coating brown silicified sepiolite, being interpreted as a late stage of silicification (Figure 2). XRD analysis indicates opal
CT and quartz as main composition with traces of se-piolite. Under the petrographic microscope microcrys-talline quarz clusters and cements affecting an opalgroundmass have been observed.
Figure 2. Hand sample and texture in thin section (N//).
The ICP-MS chemical analysis displays high silica content (93.44 wt %), moderate LOI (5.10 wt %) and around 1.5 wt% of other major and trace elements. Among trace elements is noteworthy the U content (69.1 µg/g) higher almost five times its abundance in silicified sepiolite. Other trace elements include V, Cr, Ni, Zn, Rb, Sr, Sb and Ba. Under the ESEM-CL micro-scope we record a mixed spectra (Figure 3).
200 300 400 500 600 700 800 900
0
10000
20000
30000
40000
50000
60000
70000
Inte
nsi
ty (
a.u
.)
Wavelength (nm)
HYDROTHERMAL SEDIMENTARY
Both spectra CL recorded on opal areas clearly depicts close uranyl groups. Moreover, it is important to note that intensities and minor peaks are different. Explana-tion: in the case of the hydrothermal opal specimen we collected light emission coming from micro-uranospinite crystals hidden in the small vugs, while in the sedimentary case we recorded the characteristicpeaks of the quartz and less significant uranyl peaks association which could be attached uranyl groups sited in hydrous cluster of the same opal.
61CORALS II Conference

ANALYSIS OF THE RESIDUALS IN GRAVE GOODS FROM THE VACCAEA ERA AT THE NE-CROPOLIS OF ‘LAS RUEDAS’ IN PINTIA.A.C. Prieto1, M. Avella1,2, M.A. González1, J. Jiménez1, F. Romero3, R. De Pablo3, C. Górriz3 and C. Sanz3,1GdS Optronlab, 2Unidad de Microscopía Avanzada. Parque Científico UVa, Edificio de I+D, Campus “Miguel Delibes”, Paseo de Belén, 11, E-47011 Valladolid, Spain. ([email protected]), 3Dpto. Prehistoria, Arqueología, Antropología Social y Ciencias y Técnicas Historiográficas. Universidad de Valladolid, Plaza del Campus, E-47011 Valladolid, Spain.
Introduction:The archaeological site of Pintia (Padilla de
Duero/Peñafiel, Valladolid), located at the oriental side of the vaccaea region, was occupied for more than thousand years, between IV century B.C and VII cen-tury A.C, by different cultures: Vaccaean, Roman and Visigothic. The Vaccaea era has yielded the more interesting archaeological records regarding the differ-ent functional areas that involve the oppidum: the for-tified village of ‘Las Quintanas’ – surrounded by a wall and a moat-, the artisan neighbourhood of ‘Car-ralaceña’, the necropolis of Las Ruedas, etc.
Pottery, metal and bone/skeletal remains are the more common objects recovered. The pottery remains are very well preserved, so they are optimal for analys-ing and the subsequent study of the food contained, such as milk-based products, animal fats, beer, wine, etc.
The vessels from the funerary area of 'Las Ruedas' are specially interesting. They contained the food for the afterlife and therefore have a great symbolic value. The wealth of the grave, the absence or presence of objects or contents contributes significantly on the assessment of the deceased’s profile (age, sex, social status, etc). Therefore, the analysis of the residuals found in the vessels becomes highly significant.
The use of three complementary instrumental tech-niques has been assessed as an analytical methodol-ogy. Light microscopy (visible and ultra-violet light), Environmental Scanning Electron Microscopy equipped with an Energy Dispersive X-ray Analysis system (ESEM-EDX) and micro-Raman spectroscopy (μ-RS) have been used in this work. Samples were set up on a common holder for all the techniques
Experiment: The specimens studied in this work were extracted from a crateriform vessel which be-longs to the grave goods of the grave #154. The grave corresponds to a tall individual, probably female, bur-ied in the II century BC.
Light microscopy analysis were carried out with a petrographic microscope Leica DMLP with both transmitted and epi-illumination. The environmental electron scanning microscopy was carried out with FEI-Quanta 200F equipped with a Genesis XM2i from EDAX. Micro-Rama spectra were acquired with a high resolution Raman spectrometer LABRAM HR 800UV
from Horiba-Jobin & Yvon Spex, equipped with an Olympus BX41 microscope and a XYZ-axis motorized stage. A x100 objective and backscattering configura-tion were used for Raman spectra acquisition. A 632.8 nm HeNe laser were used as excitation probe. The nominal laser power on the samples was 1mW and the irradiance was about 100 kWcm-2. The spectral win-dow was [200-3800] cm-1, the integration time was [5-60] s and 2 accumulations were used as acquisition parameters. All this results in an spectral resolution less than 1 cm-1.
Results and Discussion: The results show the presence of phytoliths, vegetal fibres and stems with parenchymal structures at different alteration degree. Low crystallization structures, with elemental compo-sition of C, O and Ca were detected. They are probably related to oxalates that can come from milk-based de-rivatives or vegetal residuals.
Degradation and age of organic natural fibres can be assessed by the relative intensity relationship be-tween the as(COC), s(COC) glycoxilic and as(CH2)bands at 1098, 1124 and 2917 cm-1 respectively. We have obtained for I1124/I1098 and I1098/I2917 values of 0.9 and 0.6 respectively which are characteristic of old and degraded fibres.
The presence of organic materials with low crystal-linity and order can be assessed by the study of the 1595 cm-1 and 1386 cm-1 bands, related to C-C bonds vibrations, and their relative intensities.
Raman bands assigned to compounds related to ag-ricultural processes can be identified and therefore can be distinguished from the residuals of interest.
Conclusions: We have stated herein that the use of the Raman spectroscopy together with complementary high resolution analytical techniques becomes a pow-erful tool for the study about the contents and use of ceramic vessels from archaeological heritage.
Acknowledgments: This work was funded by Spanish Government through Ministerio de Ciencia e Innovación, MCINN.
Project HAR2010-21745-C03-01.
62 LPI Contribution No. 1616
RAMAN SPECTROSCOPY ANALYSIS OF A PLAYING CARD FROM THE XVIII CENTURY. A. C. Prieto1, M. Avella1,2, O. Martínez1, J. Jiménez1, J.L. Alonso3, I. Sánchez4, R. Martín4 and M. Barrera4, 1GdS Optron-lab, Parque Científico UVa, Edificio de I+D, Campus “Miguel Delibes”, Paseo de Belén, 11, E-47011 Valladolid, Spain ([email protected]). 2Unidad de Microscopía Avanzada. Parque Científico UVa, Edificio de I+D, Campus “Miguel Delibes”, Paseo de Belén, 11, E-47011 Valladolid, Spain. 3Servicio de Restauración de la Diputación Foral de Alava, Urartea 4, E-01010 Vitoria-Gasteiz, Spain. 4Centro de Conservación y Restauración de Bienes Culturales. Junta de Castilla y León. Carretera 2. E- 47130 Simancas, Valladolid, Spain.
Introduction: We present herein the characteriza-tion, by means of three complementary experimental techniques (light microscopy-LM, scaning electron microscopy equiped with energy dispersive X-Ray spectroscopy–SEM-EDX and micro-Raman spectros-copy– μRaman), of a card belonging to a deck of the Spanish pattern, made in Perú at the time of Virreinato de Peru (XVIII century): The objective is to obtain detailed information of the pictoric palette used for the decoration of the cards, where two basic colors, red and green, are seen. Small samples from both colored regions have been analysed.
Experiment: The material selected for the study is a piece of civil goldsmiths, a card (number five, swords) of a traditional deck which has been restored in the Servicio de Restauración de la Diputación Foral de Alava and analysed in the Centro de Conservación y Restauración de Bienes Culturales de la Junta de Castilla y León. In particular, the study concerns to a piece made of Silver alloyed with a small amount of Copper, whose typology corresponds to the colonial culture of that period (XVIII century).
A first inspection of the samples (stratigraphies) was performed by LM, using a petrographic micro-scope LEICA DMLP, with transmited and epi-illumination. Elemental analysis was performed by using an environmental SEM (ESEM), model FEI Quanta 200FEG, equiped with EDX, Genesis XM2i from EDAX. μRaman analysis was performed using a LABRAN HR 800 UV (Horiba Jobin-Yvon). The Ra-man spectra were collected in backscattering configu-ration, using a x100 magnification objective and a HeNe laser ( =632.8 nm) for excitation. The nominal power onto the sample was 100 kWcm-2. The spectral resolution is better than 1 cm-1 using a difraction grat-ing of 1200 lines/mm.
Results and Discussion: The analysis of the sam-ples using LM –white light ilumination – shows three pictoric layers in a stratigraphic disposition, for both samples from red and green regions. That from the green area shows a non homogeneous distribution of micro-crystals in the three stratigraphic layers. TheEDX analysis of the green samples show the presence of Cu salts as the main pigment. An EDX profile along the three layers, with a step size of 0.08 μm, shows the presence of Cu in the two lower layers. The upper
layer shows high Fe/low Cu concentrations. The EDX analysis of the samples from red areas show the pres-ence of cinnabar (HgS) as the main pigment. The lower (glue) layer present high contents on Si, O, Al, C and K, with Mg and Fe traces. (The composition of the glue layer of both green and red areas is similar). The upper layer, which is a re-painting layer, has high contents of C, Al, Si, O and Fe, with some traces of K, Ca, S and Hg, coming from the intermediate layer (first painting layer). Such composition suggests the presence of silicoaluminates of clay type used as dis-persion vehicles, and crystals containing some Fe pig-ment as a cromophore.
The Raman spectra for the green areas show, for the upper layer, broad and not well defined bands, to-gether with a sharp peak at 2154 cm-1 – with a shoul-der at 2128 cm-1 – , as well as a band with intermediate intensity at 2092 cm-1, ascribable to the Fe+3-C N-Fe+3
bonding. Intense bands are also observed at 271 and 527 cm-1, ascribables to the Prussian blue pigment, Fe4[Fe(CN)6]3, as well as two intense bands at 1368 and 1399 cm-1, due the Cr3+ fluorescence; Cr3+ appears as an impurity associated to the Al2O3 used during the polishing of the sample. The two lower layers in the green areas show bands associated to the verdigris pigment, corresponding to the copper acetate with dif-ferent hydration levels. The Raman spectra for the red areas show peaks at 254 and 344 cm-1 – with a shoul-der at 354 cm-1 –, together with a small band at 285 cm-1, ascribable to the A1 , ELO and ETO modes of HgS (Vermilion), respectively. The upper layer shows the intense bands of the Vermilion and Prussian blue pig-ments. The lower layer shows a fluorescence band centered at ~682 nm. Broad and not well defined bands superpossed to this band could be ascribable to colophony (rosin) used as a glue.
Conclusions: The complementary use of Raman spectroscopy togheter with high resolution analytical techniques allows to reveal the pigments used for the decoration and the further manipulation history of cards belonging to the historic and archeological heri-tage.
63CORALS II Conference

DETECTION OF CARBONACEOUS MATERIAL IN FOSSIL MARINE MICROBIALITES BY RAMAN SPECTROSCOPY (LÁNCARA FORMATION, LOWER CAMBRIAN, CANTABRIAN MOUNTAINS, SPAIN). A.C. Prieto1, M.P. Avella1,2, O. Martínez1, E. Moreno-Eiris3, S. Menéndez4, M. Rodríguez-Martínez5, A. Perejón6. 1GdS Optronlab, 2Unidad de Microscopía Avanzada. Parque Científico UVa, Edificio de I+D, Campus “Miguel Delibes”, Paseo de Belén, 11, 47011 Valladolid, Spain. [email protected], 3Universidad Complutense, Dpto. Paleontología, 28040 Madrid, Spain, 4Museo Geominero (IGME), 28003 Madrid, Spain, 5Universidad de Alcalá, Dpto. Geología, 28871, Alcalá de Henares, Spain, 6Instituto Geología Económica, 28040 Madrid, Spain.
Introduction: Marine carbonate lithofacies formed 512 My ago (lower Cambrian, Stage 4) in tidal plains in a mixed carbonate platform – where sedimentation was strongly influenced by tides and storms – have been analyzed. The carbonate sedimentation was pro-duced by enzymatically controlled mineralization [1] through the epibenthonic fauna such poriferans (Ar-chaeocyaths –extinct taxa), echinoderms and molluscs, as well as by induced biomineralization by benthonic microbial communities (BMC). The lithofacies corre-spond to high energy deposits like bioclastic pelle-toidal limestones and oncolitic facies and low energy deposits like fenestral limestones and microbialites. Microbia-lites are mineral deposits formed through trapping and binding of detrital sediment as well as the locus of the mineral precipitation of BMC [2]. Micro-bial activity favoured characteristic macrostructures like digitate thrombolites [3] and spongiostromata on-colites (related with cyanobacteria coatings) and mi-crostructures like microbial peloids, crusts and clotted microfabrics [4].
Raman spectroscopy has been used to differentiate the main carbonate minerals and to detect the presence of carbonaceous material in enzymatically controlled minerals (skeletal elements), microbially induced biominerals and abiotically precipated cements. Diffe-rent macro and microestructures (thrombolites, onco-lites, fenestral bindstones, microbial crusts and micro-bial peloids) have been analyzed in the microbialites.
On studing carbonaceous material it is known that the two crystalline forms of carbon, diamon and graph-ite, are characteried by two Raman bands at 1386 (D band) and 1595 cm-1 (G band), respectively. The Ra-man parameters of these bands are very sensitive to structural disturbances by electronic configuration sp2-sp3 changes in the carbon bands (C-C) and conse-quently their presence are use to estimate the structural properties of the carbonaceous material. In particular, the intensity ratio between the G and D bands has been shown to be indicative of the crystallinity degree of the material. This can provide intersesting information about the thermodicamical processes of crystallization.
Materials and methods: The Raman experiments were performed on thin sections using a high resolu-tion Raman spectrometer LABRAM HR 800UV from Horiba-Jobin & Yvon Spex, equipped with an Olym-pus BX41 microscope and a XYZ-axis motorized
stage. A x100 objective and backscattering configura-tion were used for Raman spectra acquisition. A 632.8 nm HeNe laser were used as excitation probe. The nominal laser power on the samples was 1mW and the irradiance was about 100 kWcm-2. The spectral win-dow was [200-3800] cm-1, the integration time was [5-60] s and 2 accumulations were used as acquisition parameters. All this results in an spectral resolution higher than 1 cm-1.
Results and discussion: Skeletal remains (Ar-chaeocyaths and hyolithids) are composed of CaCO3and show weak bands of disorganized carbonaceous material. Microbial macro- and microstructures show important changes in compositon. A Raman profile along a columar thrombolite shows compositional variations between microsparitic calcite (CaCO3) and dolomicrospar (CaMgCO3)2 and presence of carbona-ceous material. Intercolumn space is filled by micro-bial peloids (CaCO3) with low intensity vibrational bands characteristic of the disorganized carbonaceous materials. However, thrombolites, fenestral bindstones and microbial microsparitic crusts in close localities are solely composed of calcite and carbonaceous mate-rial displaying well differentiated D and G bands. The Spongiostromata oncolites related with cyanobacteria do not show rests of carbonaceous material. Microbial peloids are dolomitized and preserve low cristalinity carbonaceous material. The precipitation sequence of calcite cements in cavities shows two distinct phases: an early marine cementantion phase with signatures of disorganized carbonaceous material and a later burial cementation phase abiotically precipitated.
Conclusions: Raman spectroscopy is shown to be a powerfull technique to analyze the presence of car-bonaceous material in fossil marine microbialities as well as to give insight into the thermodinamical crys-tallization processes occurring in the Cambrian sam-ples.
References: [1] Mann S. (2001) Biomineralization -principles and concepts in bioinorganic materials chemistry, Oxford University Press, 210 pp. [2] Burne R. V. and Moore L. S. (1987) Palaios, 2, 241-254. [3] Aitken J. D. (1967) J. Sed. Petrol., 37, 1163-1178. [4] Flügel E. (2004) Microfacies of carbonate rocks,Springer, 976 pp.
64 LPI Contribution No. 1616
QUANTITATIVE DETERMINATION OF GASEOUS PHASES IN FLUID INCLUSIONS BY RAMAN MICROSCOPY. A. C. Prieto1, A. Guedes2, A. Dória2, F. Noronha2 and J. Jiménez1, 1GdS Optronlab, Parque Científico UVa, Edificio de I+D, P. de Belén, 1, E-47011 Valladolid, Spain ([email protected]), 2Centro de Geo-logia/ DGAOT, Faculdade de Ciências, Universidade do Porto, P-4169-007 Porto, Portugal.
Due to its non-invasive nature, together with its high lateral resolution, micro-Raman spectroscopy reveals itself as a powerful technique to perform quali-tative analysis and to determine the relative molar frac-tions of the gaseous species present in minerals fluid inclusions. However, the integrated Raman intensity depends, among others, of the concentration of the analyte and of the Raman cross-sections, and these depend on the state variables of the system, therefore, the concentrations of the molecular species present in the gas phase of fluid inclusions determined from Ra-man spectra are relative quantitative values. From the calculation of the molar concentrations of the gases in the fluid inclusion, and once all phases characterized, it is possible to determine the system state variables (P-V-T-X) in solid-liquid-gas equilibrium.
There are numerous publications concerning the application of micro-Raman spectroscopy to the de-termination of the composition of fluid and solid inclu-sions in minerals and processes to obtain molar frac-tions in COHNS multi-component systems have been also been described [1-5]. Micro-Raman qualitative analysis requires the identification of the various con-stituents of a mixture though the position ( , cm-1) and the intensities of the fundamental vibration modes of the ionic or molecular group in the Raman spectrum. A collection of the species contained on fluid inclusions and their characteristic vibrational modes are described on Burke [6] and for the relative quantification of gaseous phase of the ionic or molecular species i pre-sent in a fluid inclusion, using the theory of Placzek [7] improved by Dhamelincourt et al.[8], the integrated Raman intensity is Ii=I0 iNi i,, where I0 is the intensity of incident radiation on the sample, i, the Raman scattering cross-section, Ni, the number of molecules of the species i, i, the spectral efficiency factor, de-pendent on the spectrometer, optical instruments and CCD detector. Therefore, the Raman integrated inten-sity gives information on the number of molecules of a species per unit of volume. The molar fraction Xi of the species i is Xi=[(Ii/ i i)]/ [(Ii/ i i)].
The present work addresses the determination of the molar fractions percentage on a multi-component system, calculated from the integrated Raman intensity of the bands characteristic of each molecular group. The experimental study has focused on the analyses of CH4-CO2-N2 fluid inclusions in cassiterites from the Panasqueira mine (Portugal), previously studied by
microthermometric analyses, and were performed us-ing a microRaman Dilor spectrometers interfaced to an Olympus microscope with 100x objective lens and excitation wavelengths of 488.0 and 514.5 from Ar+ lasers (Valladolid University) and 632.8 nm from a HeNe laser (Porto University). Spectral decomposition of bands were performed using the program of Dilor LabSpec-Jobin Yvon-Spex, and Raman parameters obtained. Although calibration procedures were al-ready described in the literature, an important contro-versy is presented to define whether one or both bands of the Fermi resonance (FR) of CO2, which should contribute to the calculation of the integrated intensity of CO2. Dubessy et al.[3] suggest that the sum of both intensities [I( 1)+I(2 2)] is constant, although the rela-tive ratio of their areas [I( 1):I(2 2)] varies with the density and internal pressure. Its pressure dependence and detection limits are reflected in the study of Rosso and Bodnar [9]. Raman intensity studies [10-11] and of the roto-vibrational spectrum [12] of the doublet of the FR of CO2, show that, on the equilibrium, the population of states of both vibrational quantum levels [CO2(1000) CO2(0200) 102 cm-1].
The present work describes the methodology used for the quantification of the different species in the fluid inclusions paying attention to the calibration of measurement spectrometers and to the Fermi reso-nance of CO2 vibrations ( 1-2 2; 1285 -1388 cm-1).
References: [1] van der Kerkhof A.M. (1988) Bull. Mineral, 111, 257-266. [2] van der Kerkhof A.M. (1990) Geochimica et Cosmochimica Acta, 54, 621-629. [3] Dubessy J. Poty B and Ramboz C. (1989) Europeam J. Mineral, 1, 517-534. [4] Thiery R. van der Kerkhof A.M. and Dubessy J. (1994) Europeam J. Mineral, 6, 753-771. [5] Bakker R.J. (2003) Chemical Geology, 14101, 1-21. [6] Burke E. A. J. (2001) Li-thos, 55, 139-158. [7] Placzek G. (1934) Handbuchder Radiologie. H. Marx Akad. Verlag. Leipzig, 6, 2,209-375. [8] Dhamelincourt P. Beny J.M. Dubessy J. and Poty B. (1979) Bull. Soc. Fr. Min. Cris., 102, 600-610. [9] Rosso K.M. and Bodnar R.J. (1995) Geochimica et Cosmochimica Acta, 59, 3961-3975. [10] Fernández-Bertran J. (1983) Spectrochimica Acta, Part.A. 39-2, 119-121. [11] Howard-Lock H.E. and Stoicheff B.P. (1971) J. of Molecular Spectroscopy, 37, 321-326. [12] Millot G. and Roche C. (1998) J.Raman Spectroscopy, 29, 313-320.
65CORALS II Conference

CROSS-SECTION ANALYSIS TO ESTABLISH THE PENETRATION LEVEL OF ATMPOSPHERIC
POLLUTION IN MORTARS. N. Prieto-Taboada1, O. Gómez-Laserna, I. Ibarrondo, I. Martinez-Arkarazo, M. A. Olazabal and J. M. Madariaga, University of the Basque Country (UPV/EHU), Department of Analytical Chemistry, Barrio Sarriena s/n, 48080, Bilbao, Spain. Tel.: +34 946018294. Email1: [email protected].
Introduction: The impact of the acid gases in buildings has been widely studied because of their no-table and visible consequences in building materials [1-4]. Buildings are known to be pollutant repositories [5], but not always the penetration level of the pollutantis studied although it is an important factor to evaluate the real conservation state of building materials. Sur-face analysis do not allow to detect internal decaying processes that are the precursors of crackings and even material loss when soluble salts are formed. Cross-section analyses, however, are suitable to determine the depth reached by pollutants and thus, to determine the conservation state of the materials in order to preserve the integrity of the building. With this purpose, Ramanspectroscopy was used in this work to analyse render-ing mortars of a building located in an industrialized neighbourhood of metropolitan Bilbao.
Experimental: Two types of rendering mortarswere analysed. Although they were collected from the same facade, the first (MF) belonged to the first floor of the building and was completely covered by a black crust, while the second one (MG, from the stone pillar of the groundfloor) showed almost the original appear-ance. The samples were analysed by two different Ra-man spectrometers: (i) an InnoRam® (B&WTEKINC)ultramobile spectrometer, equipped with 20x and 50xfocusing lens and a 785 nm laser with a Peltier cooled CCD detector and (ii) an InVia Raman spectrometer (Renishaw), coupled to a Leica DMLM microscopeprovided with a 514 nm wavelength excitation sourceand CCD detector.
Results: The analysis of the internal part of the MF mortar revealed that it was a mixture including beach sand (bioclastic signatures), hematite and diverse sili-cates. The surface showed the typical composition of a black crust: carbon, gypsum (CaSO4·2H2O) and occa-sionaly anhydrite (CaSO4). However, coquimbite (Fe2SO4·9H2O) was also detected as a result of a deg-radation process described elsewhere [5]. Moreover, the analysis of the cross section revealed subeflores-cences composed of calcite (CaCO3) at 3mm from the surface.
The second type of mortar, which was not black crusted, was indeed composed mainly by quartz and traces of anatase (TiO2), silicates, hematite and calcite in the surface (till 1mm depth). This layer suggested a high deterioration of the material by solubilisation of the cement and giving quartz as the final remaining compound. Besides, the analysis of the cross section of
the mortar sample revealed the widespread presence of nitrocalcite (Ca(NO3)2·4H2O) at 4mm-11mm depth. The figure below shows the degradation products formed by the combined attact of SOx and NOx gases against calcite, giving gypsum and coquimbite, and nitrocalcite respectively.
Figure: Raman spectra of MG mortar. (a) and (b) gypsum, ni-
trocalcite and calcite at different proportions at 11mm depth (c)
quartz, q, belonging to the original composition together with gyp-
sum, coquimbite, coq, and calcite at 2mm depth.
The nitrate band is quite broad to be related to aunique compound and thus the presence of other ni-trates should not be ruled out. In the same way, the main Raman band of gypsum (1007cm-1) appeared also sometimes with a shoulder, shifted to higher wavenum-bers corresponding to anhydrite (1017cm-1). Even more, coquimbite was also identified in this sample at2mm depth joint to gypsum and calcite.
References: [1] Martínez-Arkarazo I., Angulo M.,Bartolomé L. et al (2007) Anal Chim Acta, 584, 350-359. [2] Massey SW (1999) Sci Total Environ, 227, 109-121. [3] Sarmiento A., Maguregui M., Martínez-Arkarazo I. et al (2008) J Raman Spectrosc, 39, 1042-1049. [4] Sabbioni C., Zappia G., Ghedini N. et al (1998) Atmos Environ, 32, 215-223. [5] Prieto-Taboada N., Maguregui M., Martinez-Arkarazo I. et al (2010) Analytical and Bioanalytical Chemistry, 1-11.
Acknowledgements: This work was financially supported by the Spanish Government (MICINN) through IMDICOGU project (ref. BIA2008-06592). N. Prieto-Taboada acknowledges her grant from the Span-ish MICINN. Technical support provided by the Ra-man-LASPEA laboratory of the SGIker (UPV/EHU, MICINN, GV/EJ, ERDF and ESF) is gratefully ac-knowledged.
66 LPI Contribution No. 1616

BSE, CL AND RAMAN SPECTROSCOPY STUDY OF PHOSPATES AND MASKELENYTE IN THE H6 CANGAS DE ONIS REGOLITH BRECCIA. A. Rubio-Ordóñez1 , V. Cárdenes1, L. Rodríguez-Terente2, L. Tor-mo3, J. García-Guinea3. 1Dpto de Geología, Univ. de Oviedo ([email protected]). 2Museo de Geología, Univ. de Oviedo. 3Museo Nacional de Ciencias Naturales, Madrid.
Historical settings of the Cangas de Onís mete-orite: Fall of Cangas de Onís chondrite was held in the morning of December 6th of 1866. Several fragments of a flying body fell around the town of Cangas de Onís, in Asturias, NW Spain. The fall was seen by numerous locals, which collected over 22 kg of materi-al. Most of the recovered meteorite was brought to the Oviedo University, where it was studied for the first time [1]. Fragments of the meteorite were sent to other reseach centers and museums [2, 3] for their study and classification. Throughout time, meteorite category changed according with the historical classifications in effect at the moment.
The H6 Cangas de Onis regolith breccia: Ac-cording to previous works [4], it is formed by 60 ± 5% volume of H6 clasts with some H5 fragments, and 40 ± 5% of clastic matrix. Studied sample is composed by two main clasts and a clastic mesostasis with felspar-rich melts (An13Ab80Or6) included, less recrystallized than the main clasts. All components are affected by an intense fracturation, filled by taenite-kamacite and troilite. Also, there are evidences of melting processes and reabsorption of the olivine, plagioclase and pyrox-ene by the Fe-Ni melts. These data agree with [4, 5], which assume at list two fracturation and gravitational accretion processes of the parental body. Differences in characteristics and cooling ratios are also agree with the primary structure (onion-shell) of the fragmented parental body [6-8].
Results: Maskelenite: A plagioclase representing one of the main components of the silicate melt formed during the shock metamorphism [9]. Punctual chemical analyses showed a slight range of variation for the Ab-An-Or proportions, with abundances of MgO up to 2,8 % for the more anortitic melts. CL specters from these silicate glasses showed small differences in the intensi-ty of 430 and 460 peaks. Results obtained by EMP and CL suggest the occurrence of two melts of similar composition. These melts may be related with process-es of secondary accretion.
Phosphates: Occurrence of phosphates in ordinary chondrites is quite common. In this chondrite, exist-ence of anhedral crystals of calcium phosphates is documented in the clastic matrix. Chemical analyses are clearly different for these two minerals, with a relative higher content of REE+Y in the whitlockite than the chlorapatite. CL spectra showed this differ-ence between the Cl-apatite and the whitlockite (Fig. 1). The whitlockite had several peaks of variable inten-
sity related with the REE abundance. Raman spectros-copy also showed substantial differences for the ob-tained spectra. Both spectra showed a common shape, with their distinctive peaks for the PO4 in the interval 460 – 520 cm-1, maximum intensity peak at 1450 cm-1
and a secondary intensity peak at 1900 cm-1. Whitlock-ite spectrum is quite complex, probably due to the presence of REE in its structure, and partially coinci-dent with the spectral bands for the monazite [10] (e.g. RUFF ID:R060925). O-H peaks were not observed, pointing out to the anhydrous character of both phos-phates.
Acknowledgements: This work was financed by Ministerio de Ciencia y Tecnología, Proyecto Paleo-andes II – Uniovi (CGL2009-13706-C03-02).
References:[1] Luanco J. R. (1874). Anales de la Sociedad Española de Historia Natural, 3, 69-95. [2] Ordaz J., et al. (1999). Boletín de Ciencias de la Naturaleza, 45, 21-34. [3] Martín Escorza C., et al. (1999). Tierra y Tecnología, 19, 38-44. [4] Williams C. V., et al. (1985). Meteoritics, 20, 331-345. [5] Williams C. V., et al. (2000). Chemie der Erde, 60, 269-278. [6] Harrison Keith P. and Grimm Robert E. (2010). Geochimica et Cosmochimica Acta, 74, 5410-5423. [7] Trieloff Mario, et al. (2003). Nature, 422, 502-506. [8] Wood John A. (2003). Nature, 422, 479-481. [9] Schaal Rand B., et al. (1979). 2547-2571. [10] Podor R. (1995). European Journal of Mineralogy, 7, 1353-1360.
Figure 1: CL and Raman spectra of withlockite (red)and clorapatite (blue).
67CORALS II Conference

Uranyl Groups coupled to Evansite Granite Vein Infills in the Porto Undergrounds (Nw Portugal). Sanchez-Moral, S1, Fernandez-Cortes, A.1, Cuezva, S.2, Cañaveras, J.C. 2, Correcher, V.3, Miller A.Z.4 , Dionisio A.4,
Marques J.M.4, Saiz-Jimenez C.5, Afonso M.J.6, Chamine H.I.6, Furio, M1., Garcia-Guinea, J1.1 Departamento de Geologia. Museo Nacional Ciencias Naturales. CSIC. 28006 Madrid. Spain. 2Laboratorio de Petrología Apli-cada, Unidad Asociada Universidad de Alicante-CSIC, 08040-Alicante, Spain 3CIEMAT. Av. Complutense 22. Madrid 28040, Spain. 4 Centro de Petrologia e Geoquímica, Instituto Superior Técnico, Lisboa, Portugal 5Instituto de Recursos Naturales y Agrobiología. CSIC Sevilla, Spain. 6Laboratório de Cartografia e Geologia Aplicada (DEG), Instituto Superior de Engenharia do Porto; e Centro GeoBioTec|UA, Portugal. Correspondence author: [email protected]
Introduction.- The Evansite mineralization associated to Porto granite vein infill’s was firstly described by Rosas da Silva (1935) as layers up to 2 cm of amorph-ous Al2(PO4)3-5.nH2O precipitated from recent hydro-thermal fluids. This author analyzed the Porto Evansite screening a chemical composition of P2O5 % 12,20; Al2O3 % 40.62; H2O % 40.03 which is roughly correct. In those years, Iglesias (1927) also found Evansite in several Spanish outcrops. Concurrently, it was de-scribed an amorphous hydrated phosphate from Campo Lameiro also in Galicia as pale greenish yellow frac-ture-fillings up to 1 cm thick in granite, so-called amorphous Bolivarite specimen with formula Al2(PO4)3.5H2O. Van-Wambeke (1971) studied a new uranium-Bolivarite from Kobokobo (Congo) and later, co-author Garcia-Guinea et al., (1995) demonstrated as the Bolivarite-type (Campo Lameiro, Spain) and the Evansite-type (Mt. Zeleznik, Slovakia) are the same mineral phase, and accordingly, the International Mine-ralogical Association (IMA) discarded the Bolivarite name. Sometime later, Van-Wambeke wrote us sup-porting the Bolivarite mineral denomination on the basis of that the Kobokobo Bolivarite has circa 0.3% uranium at the same time as we wait for further analyti-cal opportunities to check the uranium content of all possible classic Evansite specimens from Porto, Zelez-nik, Kobokobo, Galicia outcrops, etc. In July 2010 Evansite samples were taken in the underground galle-ries excavated in granite in Porto urban. The non-destructive current techniques (ESEM-CL) together with the strong CL-spectral visibility of the uranyl-water group placed in “white insulators” such as the hydrous AlPO4 compounds offer an excellent system to analyze uranium to broad knowledge on the Evansite
phase (Fig. 1).
Fig.1: Porto Evansite: BS.- Backscattering ESEM image and CL.- Panchromatic CL image showing the physical positions of the uranyl groups.
A practical result of the analyses of uranium in the Por-to evansites case me be useful to explain the high levelsof radon gas (from 6000 to 7000 Bq/m3) detected in summer 2010 in the Porto undergrounds coming from the Evansite infill veins throughout the well-know se-quence U—Th—Rn. In addition, the radon gas ranges between 2 to 800 Bq/L in groundwater (Afonso et al., 2010).
References.-Rosas da Silva D.J. (1935) Depósitos de evansite nos
granitos do Porto (Portugal). An. Fac. Ciên. Pôrto 19, 1-8.Van Wambeke L. (1971) The uranium-bearing mineral Bo-
livarite: new data and a second occurrence. Min. Mag. 38, 418-423.
Garcia-Guinea et al (1995) A re-investigation of Bolivarite and Evansite. Can. Miner. 33, 59-65.
Afonso et al (2010) Using GIS mapping to assess ground-water studies in urban areas (Porto, NW Portugal): combined potential contamination sources and radon susceptibility. Abstract 38th IAH Congress, Krakow, 1, 80-82.
68 LPI Contribution No. 1616

RAMAN STUDY OF SYNTHETIC BaCO3 - SrCO3 SOLID SOLUTIONS. N. Sánchez-Pastor1, A. M. Gigler2,and L. Fernández-Díaz1. 1Departamento de Cristalografía y Mineralogía. Universidad Complutense de Madrid. 28040, Madrid (Spain), 2CeNS and Department for Earth and Environmental Sciences, Ludwig-Maximilians-Universität. 80333, Munich (Germany).
The characteristics of the SrxBa1-xCO3 solid solu-tion have been subject to controversy because of the important implications that the Sr/Ba ratio of naturallyoccurring members of this series have for the geochem-istry of carbonates. The fact that intermediate composi-tions of the SrxBa1-xCO3 solid solution are scarse in nature, together with the remarkable difference be-tween the ionic radii of 10.88% between Sr2+ (1.31 Å) and Ba2+ (1.47 Å), support the picture that there is amiscibility gap at low temperatures [1]. Nevertheless, experimental studies of its thermodynamic characteris-tics concluded that this solid solution is ideal and, con-sequently, complete [2].
Previous works showed that a variety of zoned BaxSr1-xSO4 crystals can be experimentally produced by counter-diffusion within a column of porous silica gel at room temperature [3]. Similar crystal growth gel experiments conducted using mixed SO4
2-/CO32- solu-
tions as the anionic reactant, allowed us to observe not only the formation of zoned BaxSr1-xSO4 crystals but also their subsequent replacement by the BaxSr1-xCO3
solid solution. The experimental arrangement consist ofa U-tube where a column of silica hydrogel occupiesthe horizontal branch, while the vertical branches Aand B correspond to the reservoirs of the parent solu-tions. Here, A and B were filled with BaCl2 (0.9 M) +SrCl2 (0.1 M) and Na2CO3 (0.5 M) + Na2SO4 (0.3 M), respectively [4]. One month after starting counter-diffusion, crystals of the BaxSr1-xSO4 solid solution were formed within the gel. These crystals show pro-gressive as well as sector zonings, with an increase in the Ba/Sr ratio from core to rim. Moreover, an oscilla-tory zoning is often superimposed. These characteris-tics have been observed by both electron microprobe and Raman analysis.
The BaxSr1-xSO4 crystals recovered from the gel af-ter one year showed identical size and external mor-phology, as well as the same type of chemical zonation patterns. However, microprobe analyses indicated that these crystals contain no S, but are completely replaced by the BaxSr1-xCO3 solid solution: these crystals are now BaxSr1-xCO3 pseudomorphs after the original BaxSr1-xSO4 crystals (Fig. 1). In order to further charac-terize the replaced crystals, a Raman spectroscopy study has been carried out.
In spite of the importance of the witherite-strontianite solid solution, very few authors report spectroscopic measurements on the intermediate com-positions [5, 6]. In the present work, synthetic samples
obtained by co-precipitation were studied. The wide thermodynamic, kinetic, and vibrational spectroscopicdatabase of the end members of the solid solution con-stitutes an excellent starting point for this investigation.
All spectra of the end members and the intermedi-ate compositions of the solid solution showed the fun-damental internal modes and the lattice modes. The 1,
2, 3 and 4 internal modes arise from the symmetric stretching, the out-of-plane bending, the asymmetric stretching and the in-plane bending mode of the car-bonate ion group, respectively. The variation of wavenumbers of internal and lattice modes as a func-tion of the chemical composition was studied. The results show that progressive substitution of strontium ions by barium ions produces bandshifts towardshigher wavenumbers. This is due to the fact that a mo-lecular vibration with a stronger bonding energy has a higher vibration frequency. As the Ba cation has a lar-ger radius (1.6 Å) than that of the Sr cation (1.44 Å),the shorter bonding length and consequently the stronger bonding strength of Sr-O compared to that of Ba-O can explain bandshifts toward higher wavenum-bers [7].
Figure 1. SEM image of BaxSr1-xCO3 pseudomorphs after
C/S-replacement in the original BaxSr1-xSO4 crystals
References:
[1] Baldasari, A. and Speer, J.A. (1979) Am. Min.64, 742-747. [2] Chang, L.L.Y. (1971) Am. Min. 56,1660-1973. [3] Prieto, M. et al. (1997) Geochimi. Cosmochimi. Acta. 61, 3383-3397. [4] Henisch, H.K. and García-Ruíz, J.M. (1986) J. Cryst. Growth. 75,195-202. [5] White, W.B. (1974) Min. Soc. Monogr. 4, 227-284. [6] Böttcher, M.E. et al. (1997) Eur. J. Min-eral. 9, 519-528. [7] Chen, Y-H. et al. (2010) Physica B. 405, 4386-4388.
69CORALS II Conference

LUMINESCENCE DATING OF MORTARS FROM ANCIENT ARCHITECTURAL ELEMENTS. J. San-jurjo-Sánchez1 and Rebeca Blanco Rotea2, 1University Institute of Geology “Isidro Parga Pondal”, University of A Coruña, Campus de Elviña, 15071 A Coruña, Spain, [email protected], 2Laboratorio de Patrimonio (LaPa) - CSIC c/ San Roque,2. 15704, Santiago de Compostela, Spain, [email protected]).
Introduction: Lime mortars are one of the most used building materials from prehistoric times. They are composed of a lime binder and an aggregate, usu-ally sand. Historic buildings have commonly been con-structed and modified in several periods of their his-tory, or their construction date is unknown. Some of the building materials used in the construction and re-constructions (bricks or ashlars) could been reused and thus could not provide information on the constructive stages. However, mortars cannot be reused. Therefore, they are interesting targets to date buildings. Attempts to date lime mortars by 14C and geochemical datinghave been unsuccessful or have shown limited succes[1], [2]. Optically Stimulated Luminescence (OSL) has also been scarcely tested to date lime mortars by OSL with promising results. Boetter-Jensen et al. [3] re-ported that manufacturing procedures for mortars erase the geological paleodose of quartz grains of the aggre-gate sand enough to be used as a dosimeter. Reports of luminescence dating of mortars have been carried out [4], opening a new way to date buildings constructed using not typically datable materials such as rock ash-lars. Goedicke [5] established a bleaching model as-suming the bleaching of some grains due to the manual transport and manufacturing of mortars and the bleach-ing of quartz grains in deeper layers due to the trans-parency of sand layers in gravel pits.
Mortar dating by OSL involves technical and archi-tectural considerations regarding both the paleodose and the annual dose. Considering the beta annual dose, microdosimetry can be important if heterogeneous mortars are dated. It must be considered that, in some cases, buildings were reconstructed or modified in past times, causing variation of the gamma dose.
Aim of the study: The Luminescence Laboratory of the University Institute of Geology (University A Coruña, Spain) has reconstructed the history of ancient buildings and historic walls of the NW of Spain by dating lime mortars by OSL. Mortars and bricks from the cupola and a wall of a Romanesque Basilica of San Martiño de Foz and restoration lime mortars from an-cient city walls of Santiago de Compostela (Galicia, NW Spain) have been taken and dated by OSL. The mortars of the former building are lime mortars made of lime and aggregate sand. The mortars of the latter are made of lime, and sand-gravel aggregate.
Results: The paleodose calculation showed prob-lems related to the quartz content in the mortars made with sand-gravel aggregate. Also, a sample aggregate
of the Basilica of San Martiño de Foz had quartz-poor sand and a feldspar contaminated quartz aliquots have been measured by a Post-IR OSL procedure [6]. Re-sults showed ages in agreement with the archaeological and architectural hypoteses. In the case of the Roman-esque Basilica of San Martiño de Foz the mortars al-lowed to date the cupola in the 10-11th Centuries, while the bricks dated are older, and they have been probably reused. The mortars of the ancient city walls of Santi-ago de Compostela correspond to the 17-18th centuries, and they match the archaeological hypothesis, as they are restoration mortars. Thus, carefully sampling, han-dling and measurement of OSL provide reliable ages for lime mortars, even when the aggregate is not quartz-rich sand.
References:
[1] Heinemeier J, Jungner H, Lindroos A, Ringbom A, von Konow T, Rud N (1997) Nuclear Instruments and Methods in Physics Research B 123:487-495
[2] Vendrell-Saz M, Alarcon S, Molera J, García-Vallés M (1996) Archaeometry 38:143-149
[3] Zacharias N, Mauz B, Michael CT (2002) Radi-ation Protection Dosimetry 101:379-382
[4] Boetter-Jensen L, Solongo S, Murray AS, Ban-erjee D, Jungner H (2000) Radiat Meas 32:841–845
[5] Goedicke C (2003) Radiation Measurements 37:409-415.
[6] Roberts HM, Wintle A (2001) Quaternary Science Reviews 20: 859-863
Figure 1. Radial plot of a lime mortar sample from San Martinho de Foz.
70 LPI Contribution No. 1616

LUMINESCENCE DATING OF PSEUDOKARST SPELEOTHEMS: A FIRST APPROACH. J . Sanjurjo-Sánchez1 and J. R. Vidal Romaní2, 1University Institute of Geology “Isidro Parga Pondal”, University of A Coruña, Campus de Elviña, 15071 A Coruña, Spain, [email protected], 2University Institute of Geology “Isidro Parga Pon-dal”, University of A Coruña, Campus de Elviña, 15071 A Coruña, Spain, [email protected].
Introduction: Speleothems are secondary mineral deposits formed in limestone or dolostone solutional caves. In granitic massifs, water trickling through the rock discontinuities causes a slow chemical and physi-cal weathering of the rock related to biological activity [1]. The weathered materials are first eroded and later deposited in either fissures or the water output of fis-sures. The formed speleothems are comparable to their congeners in karstic (limestone) systems although al-ways smaller in size and volume. Geochemical studies of such deposits have reported three different types of speleothems regarding the mineral composition: pigo-tite, evansite-bolivarite, opal-A.
Pigotite speleothems are composed of alumina and organic acids. They grow by rhythmic accretion of concentric layers as it occurs in calcite speleothems. The different layers alternatively show cream light (Al prevails) and reddish dark colours (Fe prevails) that seem to correspond to seasonal stages (winter-summer) similar to the varves of lake deposits. They have been studied and dated by 14C, as they contain abundant organic mater [2]. The only absolute ages know for this kind of speleothems in NW Spain indicate their formation during the late Holocene.
Opal-A speleothems are the most common speleo-thems in acid rocks and they are episodically formed by accretion of new layers of precipitated opal-A. They show two main morphological types: cylindrical (sta-lactites, anti-stalactites and stalagmites) and in crusts or sheets (flowstone and microgours). Opal-A speleo-thems are a suitable microenvironment for the settle-ment and development of microorganisms as bacteria, fungi, algae, diatoms, polychetes, mites, etc., and dif-ferent spores and pollen grains are frequently found trapped in the opal layers or on the speleothem surface [2], [3]. Thus, they can be interesting paleoclimatic records if they were dated. However, organic carbon is not abundant or absent, and other methods than 14Cmust be tested.
Evansite-bolivarite are yellowish to brown-reddish speleothems frequently found in well diaclased rocky massifs with development of sheet structure [2]. They show a layered structure (flowstone) and they are some centimetres thick, covering surfaces of various square metres. Evansite is amorphous and massive and forms botryoidal or reniform coatings. Chemical analyses indicated that there are composed of hydrous alumin-ium phosphates. Some authors [4], [5] believe that under the name of evansite-bolivarite there may be represented transition terms between alumina silicates and alumina phosphates where the phosphorous that
appears in them increases progressively as Si dimin-ishes till substituting it completely. They also contain some detritic quartz and feldspar grains transported from the weathered rock.
Aim of the work: In this work, the luminescence characteristics of opal-A and evansite-bolivarite spe-leothems, and of other minerals contained in their lay-ered structures, are investigated to apply a dating pro-cedure for this kind of deposits. As they are very fre-quent in NW Spain (but also in other parts of the World such as Venezuela, Australia, Argentina or Slo-vakia), an opal-A flowstone sample from Monte Louro and an evansite-bolivarite flowtone from Monte Costa Grande (Muros, A Coruña, NW Spain) have been taken and studied to test for luminescence dating. As scarce detritic quartz content have been found, po-lymineral aliquots have been studied and dated.
Results: First tests, showed luminescence charac-teristics typical of high feldspar content and both ther-moluminescence (TL) and post-IR OSL (Infra-Red Optically Stimulated Luminescence) [6] have been used to obtain a reliable ages. Results indicated an Holocene age for the opal-A speleothem sample. The Evansite-Bolivarite sample correspond to the Upper Pleistocene. Thus, they can be used as paleoclimatic records in areas of acid rocks.
References:
[1] Vidal Romaní J. R., Bourne J. A., Twidale C. R., Campbell E. M. (2003) - Siliceous cylindrical spe-leothems in granitoids in warm semiarid and humid climates. Zeitschrift für Geomorphologie, 47(4): 417-437.
[2] Vidal Romaní J.R., Sanjurjo-Sánchez J., Va-queiro Rodríguez M., Fernández MosqueraD. (2010) Speleothem development and biological activity in granite cavities. Géomorphologie (in press).
[3] Twidale C. R., Vidal Romaní J. R. (2005) Land-forms and geology of granite terrains. Balkema, Lon-don, 351 pp.
[4] Martín Cardoso G., Parga Pondal I. (1935) -Hallazgo de la eosforita en el Son (Coruña). Las Cien-cias, t.II, 849-850.
[5] García-Guinea J., Millán Chagoyen A., Nickel, E.H. (1995) - A re-investigation of bolivarite and evansite. The Canadian Mineralogist, 33, 59-65.
[6] Roberts HM, Wintle A (2001) Quaternary Science Reviews 2: 859-863.
71CORALS II Conference
Raman spectra on Fluid Inclusions in Glauberite from Miocene saline lakes of the Madrid Basin: evidence for microbial activity.
M.E. Sanz-Montero1, L. González-Acebrón2; J.P. Rodríguez-Aranda1 & C.P. Marshall3
1 Dpto. Petrología y Geoquímica. Fac. CC. Geológicas (UCM). IGE-CSIC. C/ José Antonio Novais, 2. 28040 Madrid, Spain. 2 Dpto. Estratigrafía. Fac. CC. Geológicas (UCM). IGE-CSIC. C/ José Antonio Novais, 2. 28040 Madrid, Spain. 3 Department of Geology, University of Kansas, Lawrence, KS 66045-7613, USA
Glauberite (Na2Ca(SO4)2) layers occur interbedded with magnesitic marlstone and evaporites (mostly halite and anhydrite) in the Madrid Basin, Central Spain. These rocks were deposited in a saline lake-mudflat sedimentary system during the Lower Miocene. The Ca-Na sulfate generally occurs as intrasedimentary crystals, although contorted or nodular beds are also observed. Glauberite consists of euhedral to subhedral hemipyramidal crystals which in some beds are tightly cemented by cubic halite precipitates. Glauberite crystals show both fluid and fluorescent solid inclusions of the host magnesitic marls. Magnesite precipitation has been interpreted to be mediated by microbial activity. Although glauberite is a common sulfate in inland evaporitic basins, its origin continues to be a matter of debate. Primary fluid inclusions in glauberite are analysed in this study in order to get more information in the formation of the mineral and to elucidate the possible role of microorganisms in the precipitation processes. Primary fluid inclusions (related to growth zones) have been recognized in this glauberite in oil-prepared thin sections from a core. Fluid inclusion assemblages (2 and 40 μm) are formed by very variable liquid: vapour ratio fluid inclusions (10/90 to 60/40), including all-liquid and all-gas fluid inclusions, which is characteristic of a low-temperature heterogeneous entrapment. An attempt to measure the final melting of ice temperature (in order to obtain the salinity conditions of formation) has been done in a Linkam stage, but no results have been obtained because the sample degrades upon freezing. To our knowledge, no salinity data from glauberite inclusions has been collected, probably due to the delicate nature of this mineral. Thus, Raman microprobe provided an adequate alternative to obtain the main components present in the fluid inclusion assemblages. Raman analysis of the samples was performed on a XRD confocal Raman Thermo Fischer Microscope in the MNCN, Madrid. Excitation was provided by the 532 nm line of a diode laser. Zones of primary fluid inclusions have been studied preferentially; nevertheless, spectral signatures of the glauberite host mineral have been examined as well. Glauberite presents its characteristic spectral features with mean bands at 1150, 998, 648, 470, 449 cm-1 and the presence of broad features attributed to hydrocarbons, between 1615 and 1440 cm-1. These features assigned to hydrocarbons became more important in the fluid inclusions, in which the glauberite signature is weaker. In fluid inclusions, complex Raman spectra in the C-Hx stretching modes (2700-3000cm-1) are observed which can be attributed to diversity of CH, CH2 and CH3 groups. A 1440 cm-1 band is assigned to bending CH2 modes. Bands from 3000-3100 cm-1 are aromatic C-H stretching modes. A mode at 1610 cm-1 is an aromatic C=C stretching mode. The spectral signatures of the fluid inclusions reveal also the presence of N2 (2320 cm-1), O2 (1550 cm-
1), CO2 (1370 and 1290cm-1), SO2 (1150 cm-1) and COS (842 cm-1). The inclusion of liquid hydrocarbons and organic-rich compounds in fluids would be indicative of microbial communities in the matrix embedding the sulfate crystals. Therefore, the microorganisms and the organic compounds may have favoured the precipitation of glauberite. Additional work is being undertaken to determine the type of organic matter included in the minerals by resonance Raman spectroscopy.
Acknowledgment: Financial support of Projects CGL2008-01648 and UCM-BSCH GR58/08 (grupo 910404) is acknowledged. We thank Marta Furió for her technical support.
72 LPI Contribution No. 1616

IRON OXIDES ON AG(111) - REVERSIBLE SWITCHING BETWEEN HEMATITE AND MAGNETITE. C. Schlueter1,2, A. M. Gigler2,3, and W. Moritz2, 1ESRF European Synchotron Radiation Facility. 38043 Grenoble (France), 2Department of Earth and Environmental Sciences. Ludwig-Maximilians-Universität. 80333 Munich (Ger-many), 3Center for Nanoscience (CeNS). Ludwig-Maximilians-Universität. 80799 Munich(Germany).
Iron oxides are of growing interest in environ-mental remediation [1], catalysis [2], magnetic data storage technologies [3, 4, 5] and most recently, spin-tronics applications [6]. So far, most thin films of iron oxides were grown on oxidic substrates like α-Al2O3
(corundum) [7, 8] or MgO (manganese oxide) [9]. However, iron oxide films on insulating substrates are subject to charging effects in electron spectroscopies. As metal substrates only Pt(111) has been used suc-cessfully for both hematite and magnetite [10]. The low lattice mismatch to the iron oxides makes Ag(111) apromising candidate for epitaxial growth and an alter-native to Pt(111). In the literature, only one report of magnetite thin films on Ag(111) was found [11]. Ourresults show that depending on the oxygen pressure and film thickness all the three phases of iron oxides, wues-tite (FeO), magnetite (Fe3O4) and hematite (Fe2O3) can be obtained.
Our iron oxide films were grown on Ag(111) sur-faces by multiple cycles of iron deposition (EFM3 Omicron) between room temperature and 150° C fol-lowed by oxidation in 2 × 10⁻⁶ mbar O2 at temperatures up to 400° C. Hence, the films were characterized in-situ with Low Energy Electron Diffraction (LEED), X-ray diffraction (XRD), and ex-situ by Confocal Raman microscopy. Thus, the three different phases wuestite, magnetite and hematite can be distinguished from their diffraction patterns as well as their characteristic Ra-man spectra. The confocal Raman microscope was alsoused in order to spatially characterize our films.
Wuestite films were formed for films below 10 Å thickness. This result was confirmed by both Raman spectroscopy and XRD. Films of more than 10 Å showed the magnetite structure. The symmetry of LEED and XRD results indicate the formation of an epitaxial magnetite film in two domains.
Oxidation of magnetite films by a flash to 450° C in 9 × 10⁻⁶ mbar molecular oxygen leads to the formation of hematite. LEED images indicate a complete trans-formation to hematite whereas XRD measurements show small quantities of a remaining magnetite struc-ture in the films. Islands of magnetite were found within a matrix of hematite by spatially resolved Ra-man spectroscopy. Figure 1a shows an intensity map of the second order scattering peak at ~1300 cm-1 only
present for hematite. The dark regions enclosed in this homogeneous hematite film could be clearly identified as magnetite (Figure 1b), while the remaining partscorrespond to hematite (Figure 1c).
Moreover, the possibility of reversible switching between hematite and magnetite was observed. It hasbeen shown that the hematite can be reduced back tomagnetite by annealing at 350° C in ultra high vacuum (UHV) conditions. SXRD results and the LEED pat-terns document the maintained epitaxy during these transformations.
The interplay of diffraction techniques and confocalRaman spectroscopy facilitates the surface phase analysis providing both structural analysis and spatial surface characterization.
References: [1] Cornell, R.M. & Schwertmann, U., (2003) VCH Weinheim, New York. [2] Zscherpel, D. et al. (1998) J. Chem. Phys., 108, 9506-9515. [3] Mor-rish, A.H. (1995) World Scientific, Singapore.[4] Prinz, G.A. (1995) Phys. Today,48, 58-63. [5] Auciello, O. et al. (1998) Phys. Today, 51, 22-27. [6] van der Zaag, P.J. et al. (2000) J. Magn. Magn. Mater. 211, 301-308. [7] Yi, S.I. et al. (1999) Surf. Sci., 443, 212-220. [8] Chambers, S.A. & Joyce, S.A. (1999) Surf. Sci., 420, 111-122. [9] Kim, Y.J. et al. (1997) Surf. Sci., 371, 358-370. [10] Ketteler, G. et al. (2001) Surf. Rev. Lett., 8, 661-683. [11] Waddill, G.D. & Ozturk, O. (2005) Surf. Sci. 575, 35-50.
Figure 1: (a) Intensity map of the most prominent hema-tite feature at ~1300 cm-1. (b) Spectra of the darker region reveal magnetite. (c) The residual area of the filmshows the characteristic hematite spectrum.
73CORALS II Conference
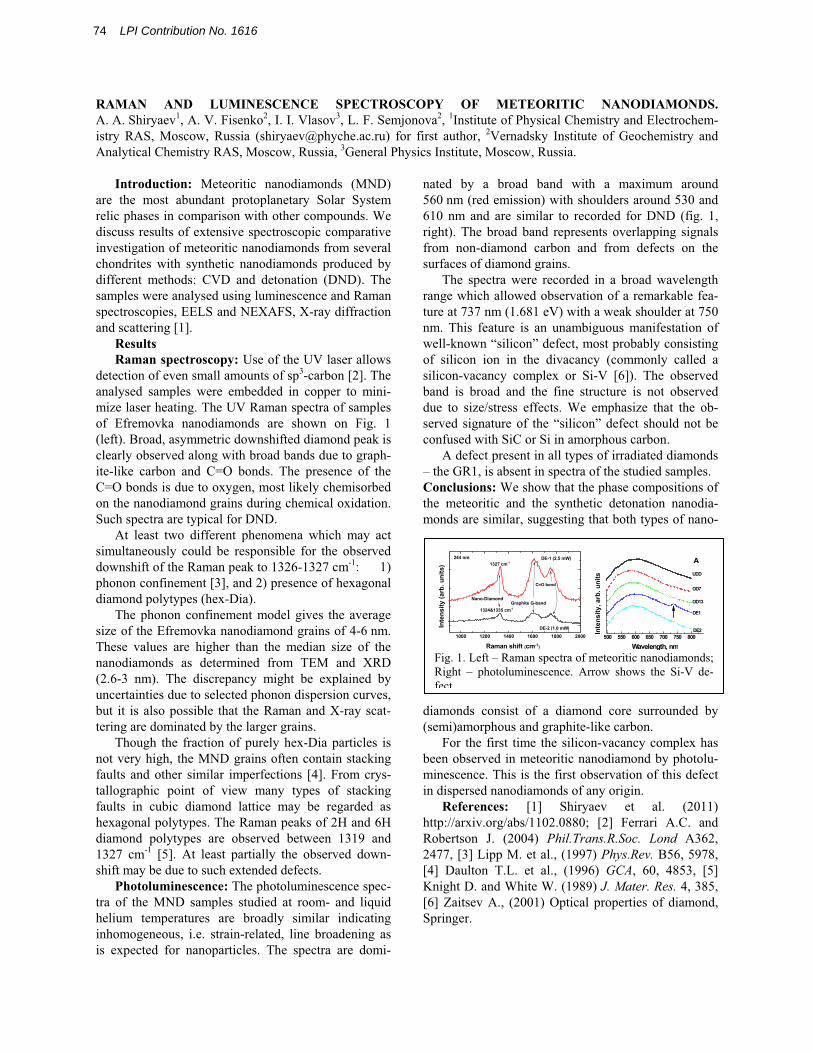
1000 1200 1400 1600 1800 2000
C=O bond
Graphite G-band1324&1335 cm-1
244 nm DE-1 (2.5 mW)
DE-2 (1.0 mW)
Raman shift (cm-1)
Inte
nsity
(arb
. uni
ts) 1327 cm-1
Nano-Diamond
500 550 600 650 700 750 800DE2
DE1
OD13
OD7
Inte
nsity
, arb
. uni
ts
Wavelength, nm
AUDD
Fig. 1. Left – Raman spectra of meteoritic nanodiamonds; Right – photoluminescence. Arrow shows the Si-V de-fect.
RAMAN AND LUMINESCENCE SPECTROSCOPY OF METEORITIC NANODIAMONDS.A. A. Shiryaev1, A. V. Fisenko2, I. I. Vlasov3, L. F. Semjonova2, 1Institute of Physical Chemistry and Electrochem-istry RAS, Moscow, Russia ([email protected]) for first author, 2Vernadsky Institute of Geochemistry and Analytical Chemistry RAS, Moscow, Russia, 3General Physics Institute, Moscow, Russia.
Introduction: Meteoritic nanodiamonds (MND) are the most abundant protoplanetary Solar System relic phases in comparison with other compounds. We discuss results of extensive spectroscopic comparative investigation of meteoritic nanodiamonds from several chondrites with synthetic nanodiamonds produced by different methods: CVD and detonation (DND). The samples were analysed using luminescence and Raman spectroscopies, EELS and NEXAFS, X-ray diffraction and scattering [1].
ResultsRaman spectroscopy: Use of the UV laser allows
detection of even small amounts of sp3-carbon [2]. The analysed samples were embedded in copper to mini-mize laser heating. The UV Raman spectra of samples of Efremovka nanodiamonds are shown on Fig. 1 (left). Broad, asymmetric downshifted diamond peak is clearly observed along with broad bands due to graph-ite-like carbon and C=O bonds. The presence of the C=O bonds is due to oxygen, most likely chemisorbed on the nanodiamond grains during chemical oxidation. Such spectra are typical for DND.
At least two different phenomena which may act simultaneously could be responsible for the observed downshift of the Raman peak to 1326-1327 cm-1: 1) phonon confinement [3], and 2) presence of hexagonal diamond polytypes (hex-Dia).
The phonon confinement model gives the average size of the Efremovka nanodiamond grains of 4-6 nm. These values are higher than the median size of the nanodiamonds as determined from TEM and XRD (2.6-3 nm). The discrepancy might be explained by uncertainties due to selected phonon dispersion curves, but it is also possible that the Raman and X-ray scat-tering are dominated by the larger grains.
Though the fraction of purely hex-Dia particles is not very high, the MND grains often contain stacking faults and other similar imperfections [4]. From crys-tallographic point of view many types of stacking faults in cubic diamond lattice may be regarded as hexagonal polytypes. The Raman peaks of 2H and 6H diamond polytypes are observed between 1319 and 1327 cm-1 [5]. At least partially the observed down-shift may be due to such extended defects.
Photoluminescence: The photoluminescence spec-tra of the MND samples studied at room- and liquid helium temperatures are broadly similar indicating inhomogeneous, i.e. strain-related, line broadening as is expected for nanoparticles. The spectra are domi-
nated by a broad band with a maximum around 560 nm (red emission) with shoulders around 530 and 610 nm and are similar to recorded for DND (fig. 1, right). The broad band represents overlapping signals from non-diamond carbon and from defects on the surfaces of diamond grains.
The spectra were recorded in a broad wavelength range which allowed observation of a remarkable fea-ture at 737 nm (1.681 eV) with a weak shoulder at 750 nm. This feature is an unambiguous manifestation of well-known “silicon” defect, most probably consisting of silicon ion in the divacancy (commonly called a silicon-vacancy complex or Si-V [6]). The observed band is broad and the fine structure is not observed due to size/stress effects. We emphasize that the ob-served signature of the “silicon” defect should not be confused with SiC or Si in amorphous carbon.
A defect present in all types of irradiated diamonds – the GR1, is absent in spectra of the studied samples. Conclusions: We show that the phase compositions of the meteoritic and the synthetic detonation nanodia-monds are similar, suggesting that both types of nano-
diamonds consist of a diamond core surrounded by (semi)amorphous and graphite-like carbon.
For the first time the silicon-vacancy complex has been observed in meteoritic nanodiamond by photolu-minescence. This is the first observation of this defect in dispersed nanodiamonds of any origin.
References: [1] Shiryaev et al. (2011) http://arxiv.org/abs/1102.0880; [2] Ferrari A.C. and Robertson J. (2004) Phil.Trans.R.Soc. Lond A362, 2477, [3] Lipp M. et al., (1997) Phys.Rev. B56, 5978, [4] Daulton T.L. et al., (1996) GCA, 60, 4853, [5] Knight D. and White W. (1989) J. Mater. Res. 4, 385, [6] Zaitsev A., (2001) Optical properties of diamond, Springer.
74 LPI Contribution No. 1616
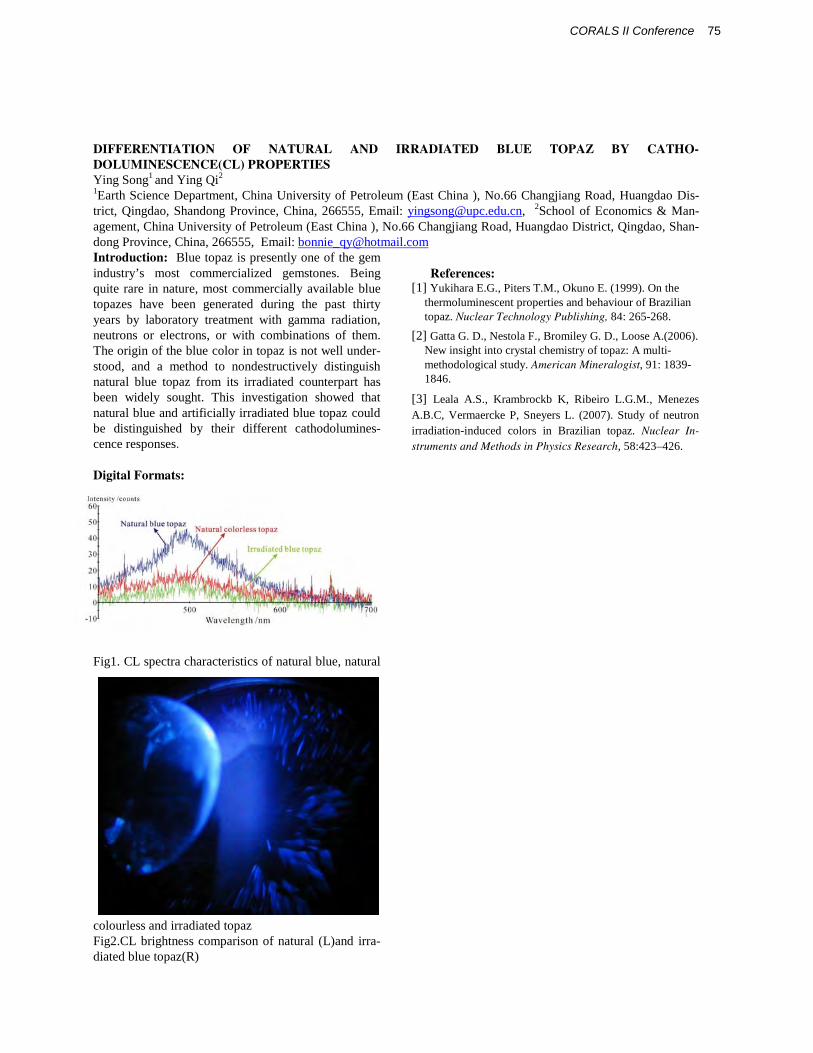
DIFFERENTIATION OF NATURAL AND IRRADIATED BLUE TOPAZ BY CATHO-DOLUMINESCENCE(CL) PROPERTIES Ying Song1 and Ying Qi2 1Earth Science Department, China University of Petroleum (East China ), No.66 Changjiang Road, Huangdao Dis-trict, Qingdao, Shandong Province, China, 266555, Email: [email protected], 2School of Economics & Man-agement, China University of Petroleum (East China ), No.66 Changjiang Road, Huangdao District, Qingdao, Shan-dong Province, China, 266555, Email: [email protected] Introduction: Blue topaz is presently one of the gem industry’s most commercialized gemstones. Being quite rare in nature, most commercially available blue topazes have been generated during the past thirty years by laboratory treatment with gamma radiation,neutrons or electrons, or with combinations of them. The origin of the blue color in topaz is not well under-stood, and a method to nondestructively distinguishnatural blue topaz from its irradiated counterpart has been widely sought. This investigation showed that natural blue and artificially irradiated blue topaz could be distinguished by their different cathodolumines-cence responses.
Digital Formats:
Fig1. CL spectra characteristics of natural blue, natural
colourless and irradiated topaz Fig2.CL brightness comparison of natural (L)and irra-diated blue topaz(R)
References: [1] Yukihara E.G., Piters T.M., Okuno E. (1999). On the
thermoluminescent properties and behaviour of Brazilian topaz. Nuclear Technology Publishing, 84: 265-268.
[2] Gatta G. D., Nestola F., Bromiley G. D., Loose A.(2006). New insight into crystal chemistry of topaz: A multi-methodological study. American Mineralogist, 91: 1839-1846.
[3] Leala A.S., Krambrockb K, Ribeiro L.G.M., Menezes A.B.C, Vermaercke P, Sneyers L. (2007). Study of neutron irradiation-induced colors in Brazilian topaz. Nuclear In-struments and Methods in Physics Research, 58:423–426.
75CORALS II Conference

Effects of Thermal Annealing on The Thermoluminescence Properties of Ion-Implanted SrTiO3 B.Tastekin,M.Turemis, M , I.C.Keskin, R.Kibar, etin and N.Can, Celal Bayar University, Faculty of Arts and Sciences, Physics Department, 45140 Manisa-Turkey, [email protected]
The wavelength, intensity and temperaturedependence of luminescence signals are widely used to provide highly sensitive monitors of imperfections in insulating crystals since variations in local lattice site configurations are reflected by variations of the luminescence. The thermoluminescence is excited by X-ray irradiation of an entire sample. Room temperature ion-implantation into the surface layer changes the TL signals both in terms of their relative intensities and peak temperatures, as well as modifying the emission spectra. Such an intense perturbation of the bulk signals resulting from surface ion beam implantation is extremely unusual. The ion-implantation damage in the surface is thought to act as a trap. There are consequent changes in the thermoluminescence in terms of defect stability and glow peak temperature [1].
In the present work, we present new data frominvestigations of the TL glow peaks of pure and Cuimplanted SrTiO3 (STO). Single crystal of STO hasbeen implanted at room temperature with 200 keV Cuions 1.1016 ions/cm2 . Thermoluminescence spectra were taken following furnace annealing at different temperatures for 1 h in air. After implantation and after post-irradiation annealing there are changes in the TL glow curves. Figure 1 shows the TL glow curves of pure STO after exposure to X-ray in the dose range from 300 to 1800 Gy. As seen from figure, the glow curve pattern shows TL peaks at 88 oC, 141 oC, 185 oCand 258 oC, after annealed at 400 oC while it is notobserved any TL peaks for unannealed sample.
50 100 150 200 250 300 350 4000
20
40
60
80
100
120
14010 min30 min60 minunannealed
Temperature (oC)
TL In
tens
ity (a
.u)
Pure SrTiO3
Figure 1. TL response of pure SrTiO3 as a function of X-ray irradiation time after annealed at 400 oC.
Figure 2 shows TL response of Cu implanted STO after annealed for different temperatures.
50 100 150 200 250 300 350 400Temperature oC
0
10
20
30
40
50
TL In
tens
ity (a
.u)
SrTiO3:Cu 1.1016 ions/cm2
400 oC500 oC600 oC700 oC800 oCunannealed
Figure 2. TL glow curves of Cu implanted STO as a function of annealing temperatures. The samples exposed to X-ray for 30 min.
Figure 3 shows the experimental optical ab-sorption spectra of the STO samples implanted with Cu+ ions to different ion doses. For the sample im-planted with copper to a lower dose, the spectrum is similar to that of unimplanted STO, except for a slight increased absorption in the short-wavelength region. Note also that at high implant doses, and strain induced by nanoparticles, implanted layer may no longer be fully crystalline which will increase the band edge ab-sortion. We may conclude that for the lower implant concentration there is no clear indication of the pres-ence of Cu nanoparticles, but the Cu surface plasmon resonance is seen for the higher dose giving a wide absorption band with a maximum near 600 nm, as is typical for copper.
400 500 600 700 800
Wavelength (nm)
0.75
0.80
0.85
0.90
0.95
Opt
ical
Abs
orbt
ion
SrTiO3SrTiO3:Cu 1x10¹⁶ ions/cm2
SrTiO3:Cu 5x10¹⁶ ions/cm2
SrTiO3:Cu 1x10¹⁷ ions/cm2
Figure 3. The experimental optical absorption spectra of the SrTiO3 samples implanted with Cu ions to dif-ferent ion doses.References: [1] B.Yang et.al. (2004) Nuclear Instru-ments and Methods in Physics Research Section B: Beam Interactions with Materials and Atoms 226 549-555. [2] R. Kibar et.al. (2010) Physica B 405 888 890.
76 LPI Contribution No. 1616

LUMINESCENCE AND RAMAN SCATTERING OF STABILIZED ZIRCONIA CRYSTALS. D. I. Torres1
and J. Llopis2, 1Department of Natural Science, Inter American University of Puerto Rico, Bayamon Campus, Puerto Rico 00957, 2Departamento de Física de Materiales, F. CC Físicas, Universidad Complutense, Madrid 28040, Spain.
Introduction: Zirconium dioxide (ZrO2) has mo-noclinic form at room temperature, but can be stabi-lized in cubic phase by partial substitution of Zr4+ with metal cations like Ca2+ or Y3+[1]. This cation substitu-tion causes the creation of oxygen vacancies in order to preserve electrical neutrality. This base defect structure of stabilized zirconia (SZ) has a significant influence on their optical properties, and can be modified by exposing the samples to reducing conditions. As a re-sult of thermal reduction, which generate new oxygen vacancies, the SZ become coloured modifying their main characteristic [2],[3]. The changes in coloration can be related to a broad absorption band centred at365 nm [4],[5], associated with defects formed with oxygen vacancies. However, the detailed structure of such defects is yet uncertain. Temperature dependent Photoluminescence (PL) and Raman spectra have been used to study the defect structure of untreated andthermochemically reduced Y-stabilized cubic zirconia(YSZ). The method of moments has been applied to the emission (EM) bands in order to obtain more informa-tion of the defects generated in the stabilization process, and in the reduction process.
Experiment setup: PL spectra were determined with a Perkin-Elmer LS-5 fluorescence spectrometer.Raman spectra were excited using 514.53 nm radiation line from a Coherent Innova99 Ar-ion laser. Spectra were measured in the backscattering geometry using a Raman microprobe (Olympus) attached to a triple spectrometer configured in the subtracting mode (Jobin Yvon T64000) and a multichannel detector charged coupled device (CCD). For the temperature depen-dence studies, we measured the EM in the range of 110-300 K, and the Raman spectra from 70-580 K. The YSZ single crystals used, purchased from Ceres Corp., contained 9.5 mol% Y2O3 with (100) orientation. For the thermochemical reduction, the samples were placed in a graphite box inside a furnace with a flowing inert atmosphere and then quenched in liquid nitrogen.
Results: PL spectra. Over the whole temperature range the EM spectrum of the untreated crystals can be decomposed into three broad bands, a red component peaked at 2,0 eV, a yellow-orange component peaked at 2,2 eV and a blue component peaked at 2,6 eV. The behavior of these bands with temperature and the pa-rameters obtained from the moments theory (Huang-Rhys parameter S and phonon mean energy h ) con-firms that they can be associated with three different defects, FAA-center for the red component, FA-center for the yellow-orange component, and F-center for the
blue component [6],[7]. As a result of thermochemical reduction, the crystals became colored with tonalities ranging from pale-yellow to dark-brown, and there appeared a broad absorption band centered at 365 nm similar to that previously reported [4],[5]. The rate of the luminescence decay with thermoreduction of each EM spectrum component was different, consistent with previous assumption of three different complexes. Re-sults from moments theory applied to the EM bands in colored samples points out to T-centers [8],[9] as the main defect generated in the reduction process.
Raman spectra. The Raman spectra of the as-received crystals showed the characteristic broad T2g
band centered at 600 cm-1. The Raman spectrum of the most reduced sample exhibited a decrease in inten-sity at frequencies below 300 cm-1. This region mostlycontains contributions from the acoustic modes, which arise from the in-phase motion between the oxygen and the cation sublattice, with the cations as the major con-tributors of the vibration [10]. This observation is in-dicative of improved order since the acoustic modes are activated by disorder. This improvement of the lattice arrangement can be understood as indicating that the concentration of vacancies is not randomly distributed, but that they are arranged in periodic se-quences. This is in agreement with our PL measure-ments and moments theory which associated a specific mean phonon frequency to each band component. The decrease in intensity at 300 cm-1 can be associated with the decay of PL intensity of the blue band and the for-mation of T-centers.
References: [1] J. G. Cai, C. Raptis, Y. S. Raptis, E. Anastassakis, Phys. Rev. B 51 (1995) 201. [2] R. Ben-Michael, D. S. Tannhauser, J. Genossar, Phys. Rev. B 43 (1991) 7395. [3] V. R. PaiVerneker, A. N. Petelin, F. J. Crowne, D. C. Nagle, Phys. Rev. B 50 (1989) 8555. [4] D. I. Torres, S. E. Paje, J. Llopis, G. Morell, R. S. Katiyar, J. Lumines. 72-74 (1997) 724.[5] G. Morell, R. S. Katiyar, D. Torres, S. E. Paje, J. Llopis, J. Appl. Phys. 81 (6) (1997) 2830. [6] P. Li, I.-W. Chen, J. E. Pender-Hann, Phys. Rev. B 48 (1993) 10063. [7] N. G. Petrick, D. P. Taylor, T. M. Orlando, J. Appl. Phys. 85 (1999) 6770. [8] C. B. Azzoni, A. Paleari, Phys. Rev B 40 (1989) 9333. [9] V. M. Orera, R. I. Merino, Y. Chen, R. Cases, P. J. Alonso, Phys. Rev B 42 ( 1990) 9782. [10] D.W. Liu, C. H. Perry, A.A. Feinberg, R. Currat, Phys. Rev. B 36 (1987) 9212.
77CORALS II Conference

The Influence of Annealing on Thermoluminescence Behaviour in ZnO, M.Turemis, B.Tastekin, M ,I.C.Keskin, R.Kibar, etin and N.Can, Celal Bayar University, Faculty of Arts and Sciences, Physics Department, 45140 Manisa-Turkey, [email protected]
Zinc oxide is a very perspective material for applications in optoelectronics. The wide direct gap of 3.37 eV and the large exciton binding energy of 60 meV suggest the use of ZnO in short-wavelength emitting devices. In this study, effect of annealing on thermolumines-cence characteristics of annealed and unannealed pure ZnO, implanted ZnO samples have been studied that were x-ray irradiated at different dose levels. Surface implants with Tb strongly modified the room tempera-ture bulk thermoluminescence properties generated by X-ray irradiation. The TL spectra were measured by RA 94 reader analyser.The structural properties of Tb on ZnO crystaline were investigated by atomic force microscopy (AFM).
As seen from figure 1, the glow curve pattern shows TL peaks at 83 oC and 255 oC for pure ZnO. After an-nealed at 1000 oC for 1 hour, it has been observe thatthere are four peaks at 103 oC, 200 oC, 262 oC and 289oC. Figure 2 shows TL glow curves of pure and Tb implanted ZnO single crystals with ions with a dose of 1x10¹⁶ ions/cm2 . The Optical Absorption spectra were measured using a Perkin-Elmer Lambda 950 spectrophotometer in the wavelength range of 200 800nm. The optical absorption spectrum of Tb implanted ZnO showed absorption bands centered at approximately 458 nm and 510 nm (Fig. 3).
50 100 150 200 250 300 350 400
Temperature (oC)
0
20
40
60
Inte
nsity
(a.u
.)
unannealedannealed at 1000 oC
Pure ZnO
Figure 1. TL spectra for unannealed and annealed at 1000 oC of pure ZnO ranging from 50 to 400 oC af-ter exposure to X ray.
50 100 150 200 250 300 350 400
Temperature (oC)
0
10
20
30
40
50
60
70
80
Inte
nsity
(a.u
.)
ZnO:TbZnO
Figure 2. The TL glow curves of pure and Tb implanted ZnO single crystals with ions with a dose of 1x10¹⁶ ions/cm2. Note that the sample was annealed at 1000 C for 1 hour in tube furnace
400 450 500 550 600 650 700 750 800
Wavelength (nm)
0.67
0.68
0.69
0.70
0.71
0.72
0.73
0.74
Opt
ical
Abs
orpt
ion
ZnOZnO:Tb
Figure 3. Optical absorption spectra of the 400-800 nm region of pure and Tb implanted (2.1016
ions/cm2) ZnO at annealed 1000 oC.
References: [1]Lakshman S.V.J. et al. (1973)Physica, 66(3), 601-610. [2]Mills S.J. et al. (2005) Spectrochimica Acta Part A, 62, 171-175. [3]Farquhar M.L. et al. (2003) Min. Mag., 67(6), 1205-1219. [4]Petit P.E. et al. (2001) J. Synch. Rad., 8, 952-954.
78 LPI Contribution No. 1616
Spectral Decomposition Methods for Coherent Raman Spectroscopy
L. Ujj1, R. Hemasinha2, C. Prayaga1,1Department of Physics, University of West Florida, Pensacola, Florida 32514, email: [email protected],2The Department of Mathematics and Statistics, University of West Florida, Pensacola, Florida 32514
Spectral fidelity of any coherent Raman spectra is a major concern of building and/or using an instrument
- m-ponent monitoring in a reaction chamber, or mapping the distribution of certain chemicals in a solid samplematrix. Mainly, three methods are used to recover the vibrational information from the measured spectra: 1. Nonlinear fitting based upon the Levenberg-Marquardtalgorithm[1], 2. Maximum Entropy Method[2], and 3. Direct phase retrieval procedure based upon the as-sumption that the third order susceptibility is an analyt-ic function[3].
Corrections for instrumental response and the prob-lem of finite sampling with appro nare also necessary to recover the vibrational bands needed to identify or characterize the samples.
These mathematical methods will be explained and a computer program written in LabView will be pre-sented. Spectra taken by a nanosecond (at UWF)[4]and a picosecond (at UofA)[5] CARS spectrometer will be presented and analyzed by all three methods, vice infra. It is concluded that the third method is the most appro -
References:
[1] W. H. Press, S. A. Teukosky, W. T. Wetterling, B. P. Flannery (1992), Numerical Recipes in C, Second Ed., Section 15.5, Cambridge University Press.
[2] E. M. Vartiainen, H. A. Rinia, M. Müller, M. Bonn (2006), Optics Express 14, 8, 3622-3630.
[3] Y. Liu, Y. J. Lee, M. T. Cicerone(2009), Optics Letters, 34, 9, 1363-1365.
[4] L. Ujj, F.Bartha, Z. Chen, C. Prayaga, T. Royappa, C. Amos, M. Tsukuda (2010), XXII Interna-tional Conference on Raman Spectroscopy (ICORS 2010), Boston.
[5] L. Ujj, C. G. Coates, J. M. Kelly, P. E. Kruger, J. J. McGarvey, G. H. Atkinson (2002), J. Phys. Chem. B,106, 4854-4862.
79CORALS II Conference

2 0 0 0 1 8 0 0 1 6 0 0 1 4 0 0 1 2 0 0 1 0 0 0 8 0 0 6 0 0 4 0 0 2 0 0
w a v e n u m b e r (c m -1)
F T B S H 7 5 c a l
1 2 7 5
1 1 6 2
1 0 8 5
7 1 0
1 4 7 4
1 5 8 4
1 7 1 6
1 3 4 9
Preliminary Studies tor the Use of Portable Raman in the Identification of Conservation Treatments Applied in the Architectural Heritage. C. Vazquez-Calvo1*, S. Martinez-Ramirez2*, Alvarez de Buergo1 and Fort R1
1 Instituto de Geología Económica / Instituto de Geociencias. (CSIC-UCM). Facultad de Ciencias Geológicas. c/ José Antonio Nováis 2. 28040 Madrid, Spain, [email protected] de Estructura de la Materia (CSIC). C/Serrano 121. 28006 Madrid, Spain, [email protected]
Introduction: During the last decades the use of consolidants and waterrepellents as a remedial and conservation technique for stopping or slowing down the deterioration of stone used in the construction of buildings and monuments has been very common and widespread. The application of these type of products is and has been, in most of the cases, not documented, or if documented, not annotated which specific prod-uct was used. Sometimes these treatments need to be removed or even a re-application; or the building stone that was treated has developed stains and decay forms linked to these products. Regarding the instrumental technique, Raman-Spectroscopy has shown to be a useful technique in this field of scientific conservation research [1-4]. In general, laboratory equipment per-forms better than portable Raman, however, for Cul-tural Heritage it is very important to study the artefacts with a non destructive technique as well as the ability of in situ studies.
Aim: The aim of this work is to validate the use of the portable and non destructive Raman equipment “Inspector Raman Delta Nu” for the recognition of conservation treatments in the architectural heritage, avoiding in this way intensive sample collection which is not recommended at all when working with cultural heritage.
Methodology: Several products were analysed, but, for the purpose of this work, only two of them, consolidants, were selected: FTB SH75 (ethyl ortho-silicate, 75%) and PARALOIDTM B-72 (ethyl methacrylate co-polymer). A limestone was employed as substrate for the treatmens (Colmenar stone). Small specimens (3x3x1cm) were impregnated with both conservation products. This stone has been character-ised by different authors [5,6], and has been used in buildings from architectural heritage for centuries [7]; mineralogically it is mainly composed by calcite (CaCO3). Analyses were performed, first on the un-treated fresh limestone, to consider any possible spec-tra influence; and secondly, on the impregnated speci-mens. The product was also analysed in its original liquid form in order to compare spectra. This portable Raman is equipped with a 785 nm diode laser for exci-tation, which has a maximum output power of 120mW at the source and a thermoelectrically cooled charge-coupled device detector, with a range of 200–2000 cm 1.
The spectra were recorded with integration time 5s. The resolution is 8 cm-1.
Results: In the case of the Raman technique, stone fluorescence represented a problem. However it has been posible to acquire spectra that may help in the in situ identification of conservation products. The results show that the application of the product over calcite allows identification of the support with 1085 cm-1
band observation. Adittionally the intensity of several bands from the product increases indicating some in-teractions between product and support (figure 1).
Conclusions: The technique is non-destructive, there is no need of sample preparation, and the equip-ment is portable. The portable raman is able to identify the support stone, conservation product, and the inter-actions between the product and the calcite.
Figure 1. Spectra of FTHSB75 conservation product applied over calcite.
Acknowledgments: The authors thank you the na-tional project CONSOLIDER-INGENIO 2007 (CSD2007-0058) y and the Madrid Regional Gover-ment project GEOMATERIALES (S2009/MAT-1629). And to the research UCM group: “Alteración y Conservación de los Materiales Pétreos del Patrimo-nio”.
References:[1] Martinez-Ramirez et al. (2003) Cement
Concrete Res, 33, 2063–2068, [2] Domingo et al. (2008) Prog. Org. Coat. 63 (2008) 5–12, [3] Edwards H.G.M. and Munshi E.T (2005). Anal. Bioanal. Chem.382, 1398–1406, [4] Vandenabeele et al (2007) Anal. Chem Acta. 588, 108-116, [5]Dapena, E. R. at al. (1989). Ingeniería Civil 71, 67-77, [6]Bustillo, A. (1980) Boletín Geológico y Minero. T XCI-III: 503-514, [7] Fort et al (1996) Geogaceta, 20, 1236-1239.
80 LPI Contribution No. 1616

RAMAN SPECTROSCOPY STUDY OF TEKTITES. M. V. Volovetsky1, A. A. Averin2, A. A. Shiryaev2 1Vernadsky Institute of Geochemistry and Analytical Chemistry RAS, 19, Kosygin Str, 119991 Moscow, Russia, [email protected]; 2Frumkin Institute of Physical Chemistry and Electrochemistry, 31, Leninsky Prosp., 119991 Moscow, Russia, [email protected].
Introduction. Tektites are iron containing natural
silicate glasses of impact origin. They formed during a meteorite or comet impact events as a result of partial melting and evaporation of the target rocks. So tektites are important geochemical indicators of substance dif-ferentiation which is caused by impact events during formation of planets. High temperature processes in silicate melts are accompanied with redox reactions involving multi-valent elements and in the first place Fe. An analysis of the iron oxidation state in tektites is important for understanding of the conditions which take place during the impact events.
Experiment and results. Tektites form different strewn fields were investigated using complementary techniques such as Mossbauer and Raman spectro-scopies, X-ray Absorption Spectroscopy and magnetic methods. Raman spectra were acquired for collection including various moldavites, philippinites, indo-chinites and australites. The spectra were recorded at room temperature using excitation by 532 and 738 nm lasers.
Typical Raman spectra of studied tektites are shown on Fig.1. The spectra are largely similar despite differences in samples provenance and composition.
Fig.1. Raman spectra of glasses. It is known that in Fe-containing silicate glasses the
region between 800 and 1200 cm-1 can be associated with various tetrahedral Qi species (i – number of bridging oxygen per tetrahedrally coordinated cation). Since Fe3+ ions can substitute for Si4+ bands in this region are sensitive to iron redox state [e.g., 1].
The broad band between 900 and 1100 cm-1 is pre-sent in all spectra. Spectral decomposition of this broad band permits to distinguish a band around 910 cm-1, which is supposed to be sensitive to Fe3+ (Fig. 2).
Fig.2. Deconvolution of spectra of Philippinite 1239. In Table.1 relative intensities of the 910 band in
different samples are compared with Mössbauer spec-troscopy data [2].
Table.1. Relative intensity of 910 cm-1 band (Raman spectr.) and Fe3+/ΣFe ratio (Mössbauer spectr. [2]).
Sample 910 cm-1 Fe3+/ΣFe Moldavite 15684 0.02 0.11 Australite 15135 0.04 0.13 Australite 2520 0.02 0.09 Philippinite1239 0.04 0.06 Indochinite-LD 0.07 0.10 Indochinite-К 0.08 0.07 Correlation is not unambigous due to the necessity
of calibration of the Raman data for a given glass chemical composition. Our Mössbauer data indicate low Fe3+ content of tektites [2], suggesting very reduc-ing conditions during tektite formation. The present Raman results confirm this conclusion.
References: [1] Magnien V. et al. (2006) Journal of Nuclear
Materials, 352, 190-195. [2] Volovetsky M.V. et al. (2008) Hyperfine Interactions, 186, 83-88.
81CORALS II Conference

RAMAN SPECTROSCOPY APPLIED TO RARE AND TINY PHASES: EXAMPLE FROM THE STUDY
OF PLATINUM GROUP MINERALS (PGM). F. Zaccarini1, R.J. Bakker1, G. Garuti1, O.A.R. Thalhammer, J.A. Proenza2 and T. Aiglsperger2, 1Department of Applied Geosciences and Geophysics, University of Leoben, Peter Tunner Str.5, Leoben, Austria, [email protected], 2 Departament de Cristal.lografia, Mineralogia i Dipòsits Minerals. Facultat de Geologia. Universitat de Barcelona, C/ Martí i Franquès s/n, E 08028 Barcelona, Spain.
Raman spectroscopy is a non destructive and structur-ally sensitive technique that can be easily used to iden-tify small mineral phases less than 10 microns in size.Some years ago, Raman spectroscopy was applied for the first time, to identify grains of natural platinum group minerals (PGM) [1]. However only 6 Raman spectra were published for the following natural PGM: cooperite (Pt,Pd,Ni)S, sperrylite (PtAs2), platarsite (PtAsS), moncheite (Pt,Pd)(Te,Bi)2, braggite (Pt,Pd,Ni)S and potarite (PdHg). Therefore, in this contribution we present the preliminary Raman resultsobtained on a great variety of PGM.The PGM are the carriers of the platinum-group ele-ments (PGE): osmium (Os), iridium (Ir), ruthenium (Ru), rhodium (Rh), platinum (Pt) and palladium (Pd).Recently, the PGE have gained tremendous importance due to their application in many modern and advanced technologies. However, with a concentration of about 10-6 to 10-7 % in the earth crust, the PGE are numbered among the ultra-trace elements. PGM occur naturally, as alloys, native elements or combinations with other elements, mainly S, As, Te, Bi, Sb, Se and O. Also the PGM are rare, representing only less than the 3% of the approved minerals by the Commission on New Miner-als and Mineral Names of the International Mineralog-ical Association (IMA). According to the literaturedata updated to 1997 [2], only 96 phases containing the PGE has major components, have been approved,whereas more than 500 PGM are still waiting for a clear identification, in particular for crystallographic characterization to the degree required for acceptance as new mineral species. From 1997 to the present days, only 25 new PGM have been discovered. The main reason for the significant lack of in sufficient identification of PGM is their mode of occurrence, i.e. as minute inclusions, prevents characterization using structural data. Optical and electron microscopy, elec-tron microprobe analysis are the most used techniques for chemical and physical identification of PGM. How-ever, PGM are notoriously difficult to identify during petrographic investigation owing to their small sizes and the similarity of the optical properties of many minerals. Furthermore, where the PGM are only a few microns in size, the electron microprobe generally pro-vides only semi-quantitative analyses due interferences from surrounding minerals. Therefore, there is a need of an innovative and complementary methodology able to provide mineralogical information which is difficult
and sometimes impossible to obtain from other widely used techniques. As a consequence, Raman spectros-copy is suggested as the best candidate to solve this technical problem, as previously proposed by [1]. Our results of Raman spectroscopy applied on selectedPGM, such as sulphides, arsenides, sulpharsenides re-vealed that all the analyzed grains display a very well-defined and characteristic spectrum, as typical for the compounds characterized by the presence of covalent bonding. On the contrary, the Raman spectra of a num-ber of alloys and native elements show no discernible scattering bands suggesting that the possible bonds present in these PGM are metallic or ionic. Few PGM, classified as possible Ru bearing oxides, show a broad and weakly scattered spectrum over the range of about 100 800 cm-1. The collected data also demonstratedthat Raman is sensitive on the compositional variation, particularly in the PGM characterized by a solid solu-tion substitution such as laurite (ideally RuS2)-erlichmanite (ideally OsS2) series. These results con-firm that Raman spectroscopy can be considered an innovative and complementary technique with a huge potential to better characterized and identify rare and tiny phases such as PGM. The two main disadvantagesof the Raman spectroscopy applied to the investigation of PGM are: 1) some PGM, such native elements and alloys, are not sensitive to this technique and 2) it does not provide a chemical composition of the investigated minerals. Therefore, it is intended to apply the Raman spectroscopy to a great number of different PGM, al-ready chemically characterized by electron microprobe,with the target to create a future and accessible data base of Raman spectra of a great number of different PGM.
References:
[1] Mernagh T.P. and Hoatson D.M. (1995) Can.Mineral., 33, 409-417.
[2] Daltry V.D. and Wilson A.H. (1977) Mineral. Petrol., 60, 185-229.
82 LPI Contribution No. 1616

NOTES

NOTES